
Abstract
Background
Resting-state functional connectivity analysis has a potential to unearth the putative neuronal underpinnings of various disorders of the brain. Major depressive disorder (MDD) is regarded as a disorder arising from alterations in functional networks of the brain.
Purpose
There is paucity of literature on resting-state functional magnetic resonance imaging (Rs-fMRI) in MDD, especially from the Indian subcontinent. The purpose of our study was to elucidate the differences in Rs-fMRI connectivity between MDD patients and age and gender matched healthy controls (HC).
Methods
In this prospective single institute-based study, the patients were recruited consecutively based on Hamilton depression rating scale (HAM-D). Age and gender matched HC were also recruited. Rs-fMRI and anatomical MRI images were acquired for all the subjects (MDD and HC group) and subsequent analysis was done using the CONN toolbox.
Results
A total of 49 subjects were included in the final analysis (MDD = 28 patients, HC = 21). HAM-D score was noted to be 24.4 ± 4.8 in the MDD group. There was no significant difference between MDD and HC groups as far as age, gender, employment status, and level of education is concerned. Region-of-interest-based analysis of Rs-fMRI data showed a significantly lower connectivity between the left insula and left nucleus accumbens and between left paracingulate gyrus and bilateral posterior middle temporal gyri in MDD group as compared to HC group.
Conclusion
There is reduced connectivity between certain key regions of the brain in MDD patients, that is, between the left insular cortex and the left nucleus accumbens and between the left paracingulate gyrus and the bilateral posterior middle temporal gyrus. These findings could explain the basis of clinical features of MDD such as anhedonia, rumination of thoughts, reduced visuo-spatial comprehension, reduced language function, and response to external stimuli.
Introduction
Depression among the leading mental health problems across the world with an estimated prevalence of approximately 5% among adults. 1 It has been estimated that one in every 20 adults in India suffers from major depressive disorder (MDD). 2 Major depression is characterized by a wide range of clinical features including the lack of interest in work (anhedonia), behavioral changes, sleep disturbances, cognitive disturbances, changes in appetite, alterations in body weight and suicidal thoughts. 3 Typically, these clinical features last for six months or longer. MDD is primarily diagnosed on the basis of clinical assessment of symptoms in accordance with the international classification of disease or diagnostic and statistical manual criteria. 4 Many different scores have been developed for assessment of severity of depression, which also help in the recruitment of patients into clinical trials. 5 While many studies have attempted to explore the alterations in structural and functional magnetic resonance imaging (fMRI) in patients with depression, the results have been varied across the studies. This may largely be due to the overlapping nature of symptoms in depression and other neuropsychiatric conditions and the differences in study design and case definitions. Also, attempts towards developing neuroimaging biomarkers for diagnosis of depression have been largely futile, largely due to the reverse inference fallacy, where the particular imaging parameter may not necessarily be specific for depression. 6 While many authors have attempted to study the role of fMRI in MDD, 7 no study exploring the changes in Rs-fMRI connectivity among patients diagnosed with major depression is available from the Indian subcontinent.
In this paper, we present our findings regarding the changes in resting-state functional connectivity between different region of interests in patients diagnosed with MDD as compared to the healthy controls (HC). We hypothesize that MDD patients may have specific changes in Rs-fMRI connectivity, which may help explaining the basis of clinical symptoms. We further hypothesize that the regions of the brain concerned with perception of reward, pleasure as well as processing of visuo-spatial information, may show altered resting-state functional connectivity in MDD as compared to HC.
Methods
This was a single center, hospital-based study, funded by the Science and Engineering research board (SERB), Department of Science and Technology, Government of India (Approval number: SRG/2022/001306). The study was approved by the institutional ethical committee (Approval number – IEC/AIIMS/BTI/222, dated: 10/10/2022). We included patients with a clinical diagnosis of MDD according to the ICD-10 (International Classification of disease – 10th edition) criteria,
8
and a score >17 based on Hamilton Depression Rating Scale (HAM-D).
9
We included only those patients who had not been exposed to any antidepressant medication. Age and gender matched healthy subjects with HAM-D scores less than 4 and no other diagnosed co-morbid medical or psychiatric illness were included in the HC group. Informed written consent was obtained from all the participants. The patients were included consecutively from the outpatient department and were explained about the procedure for undergoing the fMRI scan. Only right-hand dominant participants were included in the study. The exclusion criteria of the study included:
Any history of co-morbid illness Any history of intake of antidepressant medication Left-handed Pregnancy and active breastfeeding mother Substance abuse/addiction of drugs Refusal to consent Any other general contraindication for undergoing MRI scan.
The inclusion criteria for recruitment of MDD patients are mentioned as follows:
HAM-D score >17 Age (18–65) Right-handed No substance abuse.
MRI Acquisition
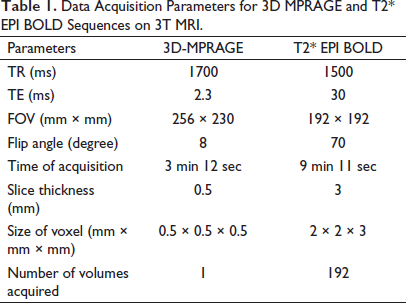
All the MRI scans were acquired on 3T MRI (Skyra, Siemens Healthineers, Germany) using a 32-channel head coil. The patients as well as the HC were asked to relax during the scan and keep their eyes closed. All the standard protocols were followed to maximize the patient comfort and minimize motion-related artifacts. The functional MRI data was acquired using the T2* Echoplanar imaging BOLD sequence and 3D MPRAGE sequence was acquired for anatomical co-registration. The imaging parameters for these sequences are shown in Table 1.
Data Acquisition Parameters for 3D MPRAGE and T2* EPI BOLD Sequences on 3T MRI.
Data Analysis
All the imaging data was converted from DICOM format to Nifti format and further analyzed using the CONN toolbox Version 21a based on SPM12 (Wellcomecentre for human Neuroimaging, United Kingdom) and Matlab version 2021a (Mathworks, United States) for iMac (Apple Inc, United States).
Preprocessing Pipeline
A default preprocessing pipeline based on volume-based analyses was utilized and normalization was done directly to the MNI space. Furthermore, we removed the initial 10 volumes of the Rs-fMRI data from each patient so that a steady state of longitudinal magnetization could be reached. Also, this step allows for equilibrium in the signal and also allows time for the participants to adapt to the environment within the scanner, particularly the noise. The pipeline includes various pre-processing steps, which are summarized as follows:
Function labeling of the functional files, which are a part of list of secondary datasets (labeled as “Original Data”). Realignment and unwrapping of functional data (for estimation of subject motion and correction accordingly). Translation of the data so that the center lies at (0,0,0) co-ordinate. Slice-timing correction of the functional data (STC; this step corrects for the differences in the time of acquisition of individual slices). Detection of the outliers in fMRI data (the identification of the outlier scans is done using ART-based algorithm for scrubbing of the data). Direct segmentation and normalization of functional data (simultaneous segmentation of grey matter, white matter and CSF, and normalization to MNI space). Labeling of the files of fMRI data as a component of secondary datasets (data is labeled as “MNI-space data”). Translation of the structural MRI data to (0,0,0) co-ordinates. Segmentation and normalization of the structural MRI data (simultaneous segmentation of gray matter, white matter and CSF, and normalization to MNI space). Smoothing of fMRI data (Gaussian kernel was used for spatial convolution). Labeling of fMRI data files as components of secondary datasets (labeled as “smoothed data”).
The slice order was selected as interleaved and functional outlier detection setting was kept at intermediate (i.e., 97th percentile). The smoothing Kernel was selected at 8 mm (default selection based on full-width half maximum criteria).
At successful completion of preprocessing, quality assurance plots were reviewed, and the data was subjected to denoising using linear regression of potential confounding factors (white matter, CSF, realignment, scrubbing, and effect of rest). The band-pass filter was set at a frequency range of 0.008–0.09 Hz. Subsequently, the preprocessed data was subjected to seed-based connectivity analyses and a connectome ring was derived to visualize the results. We selected 132 ROIs based on the Harvard Oxford atlas, which is inbuilt within the CONN toolbox.
Statistical Analysis
The tabulation of data was carried out in the form of a spreadsheet using MS office (Microsoft Corporation, USA) and statistical analysis done using MedCalc software (Belgium). Mean and standard deviation were used as measures of central tendency and measures of dispersion, respectively, for continuous data. Percentages and proportions were used for the representation of categorical data. T-test was used to determine the difference between MDD and HC groups for continuous variables. Fischer Exact test was used for the analysis of dichotomous variables. The normality of data was tested using the Shapiro-Wilk test. A p-value of <.05 was considered as significant.
For functional connectivity analysis, standard setting for cluster-based inferences was used in CONN toolbox. False discovery rate (FDR) method (using the multivariable pattern analysis [MVPA]) was used for the correction of p-value. Corrected p-FDR of <.05 was considered statistically significant.
Results
Clinical and Demographic Characteristics
Final analysis was done on 49 subjects (male – 26, female – 23). Table 2 summarizes the clinical and demographic characteristics of the patients (MDD group) and healthy controls (HC group).
Summary of the Differences in Baseline Characteristics and Demographics Between MDD and HC.
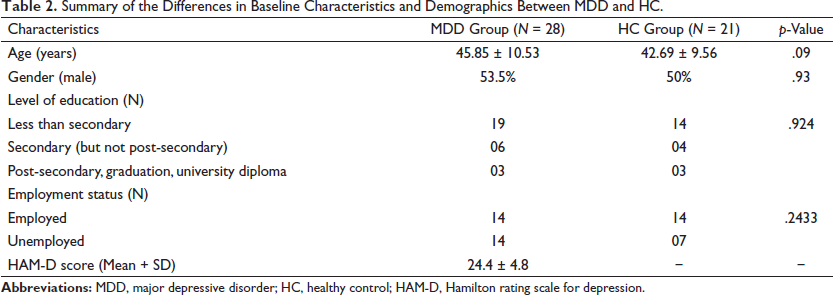
No statistically significant difference was found between the MDD group and the HC group with regards to age, gender, and employment status (employed vs. unemployed at the time of recruitment into the study). The mean of HAM-D score for MDD group was 24.4 ± 4.8. No statistically significant difference was noted between MDD and HC group with regards to educational status (i.e., pre-secondary, secondary, and post-secondary education)
ROI-ROI Functional Connectivity Analyses
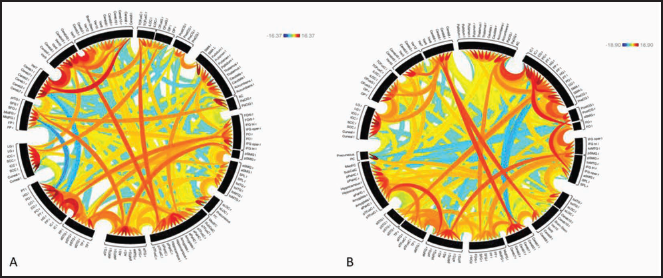
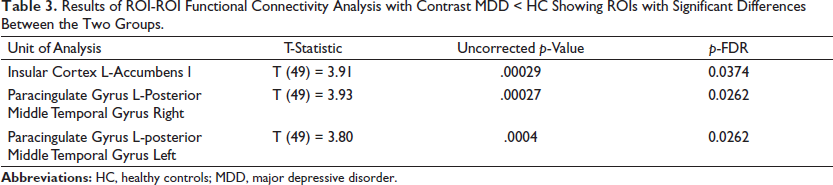
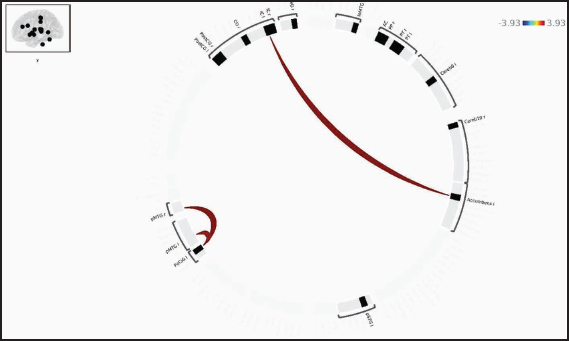
The results of ROI-based connectivity analysis in HC and MDD groups are represented as a connectome ring in Figure 1. The MDD group shows more negative correlations between the ROIs and reduced number of positive connections between the ROIs. When controlling for age and gender, MDD group showed lower functional connectivity as compared to HC group between left insular cortex and left nucleus accumbens and between left paracingulate gyrus and bilateral posterior middle temporal gyri as shown in Table 3 and Figure 2.
Results of ROI-ROI Functional Connectivity Analysis with Contrast MDD < HC Showing ROIs with Significant Differences Between the Two Groups.
There was no significant correlation between ROI-ROI functional connectivity among MDD group and HAM-D score, episodes of depression, and number of episodes of depression.
Discussion
MDD has been considered as a disorder arising from the alterations in functional connectivity within the brain networks. 10 To this end, many studies have attempted to unearth the putative alterations in whole brain functional connectivity among MDD patients as compared with HC.11–13 The analysis of structural MRI data from a large consortium (known as the Enhancing Neuroimaging Genetics through Meta-Analysis [ENIGMA]) observed a significantly reduced hippocampal volume and cortical thickness among MDD as compared to HC groups. 14 However, these results may not explain the spectrum of symptomology in MDD. In recent years, functional MRI has emerged as a potential tool for determining the neurocognitive biomarkers in MDD as well as identification of the predictors of treatment response. 15 Task-based fMRI studies, which include the performance of specific cognitive tasks, have found a reduced activity in frontal regions and an increased activity in limbic regions among the MDD patients. Also, the rostral anterior cingulate gyrus has been observed to show an increase in activity during tasks involving the viewing of faces showing negative emotion, and this finding has been shown to be predictive of favorable response to antidepressants.16–18 Recently, Rs-fMRI studies have been a focus among researchers for identifying the neural correlates of MDD. Rs-fMRI is an attractive study design in the evaluation of biomarkers of MDD due to the ease of performance and an independence from task-based design, which is desirable in MDD patients; many of whom may not be interested in task performance, and it may be difficult to solicit co-operation from them. 19 Various brain networks have shown changes in functional connectivity using Rs-fMRI in MDD.6, 20 The default mode network (DMN) has received most of the attention in Rs-fMRI studies in MDD. Most of the studies have found hyperconnectivity within the DMN in MDD group, correlating with the rumination of thought seen in patients with MDD. 10 However, variations in results in different studies have been observed largely due to variations in sample size and differences in data processing pipelines used. A recent large consortium from China (REST-meta-MDD) showed hypoconnectivity within the DMN in patients with MDD. 21 Although the literature is replete with many conflicting results concerning resting-state functional connectivity in MDD, it is clear that chiefly three major resting-state functional networks, that is, DMN, salience network (SN), and central executive network (CEN) play a major role in the pathophysiology of MDD and its treatment response. 10
In the present study, we have attempted to determine the differences in the Rs-fMRI functional connectivity among MDD patients and HC group. The study is a hospital-based study from a tertiary care center in North India and is the first study of its kind, evaluating the differences in functional connectivity among MDD and HC from the Indian subcontinent. We utilized HAM-D for diagnosis of MDD and a score of more than 17 was included in MDD group. HAM-D has been widely used in previously published studies on MDD and has been considered as a gold standard for the evaluation of MDD for more than four decades. 22 We have utilized standard image acquisition protocols for Rs-fMRI data as well as structural data on a state of 3T MRI unit. For data processing, CONN toolbox was utilized, which has a graphical user interface for processing of Rs-fMRI data. CONN is a well validated and widely used application for Rs-fMRI analyses and offers an intuitive working environment for data interpretation and presentation. 23
We employed ROI-ROI seed-based analyses for computation of Rs-fMRI functional connectivity differences between MDD group in comparison with HC group. Both the groups were matched as far as the baseline demographic features are concerned. Our data shows that there is reduced overall positive connectivity between the ROIs in MDD group as compared to HC, while the number of negative correlations between the ROIs is greater in MDD as compared with HC. This suggests an alteration of brain networks in MDD. We observed a significantly decreased connectivity left paracingulate gyrus and left posterior middle temporal gyrus, between the left insular cortex and left nucleus accumbens, between and between left paracingulate gyrus and right posterior middle temporal gyrus. The nucleus accumbens is regarded as a key player in the mesolimbic dopaminergic pathway and plays an important role in reward-related experiences. 24 The insular cortex has a wide range of functions including sensory and affective processing, self-awareness, high-level cognition, and other functions such as response to fear, anxiety, and happiness. 25 The paracingulate cortex has been shown to play a crucial role in cognitive and affective regulation. 26 The posterior middle temporal gyrus has connections with the DMN and ventral parts of inferior frontal gyrus and has been shown to play a key role in the retrieval of semantic and non-semantic information, including visuo-spatial perception and multimodal sensory integration. 27
Several studies on depression have shown altered connectivity of the nucleus accumbens with prefrontal cortex, lateral hypothalamus, ventral tegmental area, and hippocampus. 28 Furthermore, the anterior insula, thalamus, and nucleus accumbens are a part of reward neurocircuitry. 29 In our study, decreased functional connectivity between the nucleus accumbens and insula may explain some of the key symptoms of MDD such as anhedonia, where the patients lack the desire to obtain reward or pleasure. The paracingulate cortex, which includes the region of the cortex around the anterior cingulate gyrus, is a part of the DMN, and so is the posterior aspect of the middle temporal gyrus. It has been shown that the volume of anterior cingulate gyrus has been shown to be reduced in MDD as compared with controls. 30 The paracingulate cortex, which may exhibit anatomical variations among subjects, has a crucial role to play in cognitive tasks and affect. 26 The findings of our study, that the paracingulate cortex shows a reduced resting-state functional connectivity with the posterior medial temporal gyrus bilaterally, may be the underlying neural correlate for symptoms such as feelings of sadness, impairment of concentration, and feeling of low self-esteem. Additionally, reduced connectivity between paracingulate cortex and posterior medial temporal gyrus may explain few of the features of MDD, such as reduced language output, altered vision and spatial perception, and response to external noxious stimuli (such as pain and heat), as have been systematically evaluated in previous publications.31–33 While previously published studies have demonstrated hyperconnectivity within the DMN in MDD,34, 35 our study and few recent publications form large consortium and meta-analyses have shown hypoconnectivity within the DMN. 27 While hyperconnectivity within the DMN may be correlated with heightened self-rumination of thoughts in MDD, the conflicting findings of hypoconnectivity have questioned the role of DMN as a biomarker for MDD. 36 However, it must be acknowledged that the DMN remains a major brain network in the pathophysiology of MDD and further studies are necessitated in order to reliably establish the patterns of the changes in Rs-fMRI connectivity within the DMN in patients with MDD.
Limitations
We acknowledge a few limitations in the present study. This is a preliminary study based on a convenient sample size of 49 subjects (28 in MDD group and 21 in HC group) in a hospital-based practice. Due to limited sample size study, finding may have poor generalizability. A larger community-based sample is envisaged by our group in future to derive a more data-driven network-based analysis of functional connectivity in MDD. Functional connectivity analysis on a larger sample size could better evaluate the correlations between various symptoms of MDD and functional connectivity.
Conclusion
In this preliminary study on functional connectivity in MDD from the Indian subcontinent, we found a reduced connectivity between certain key regions of the brain in MDD patients, that is, between left insular cortex and left nucleus accumbens and between left paracingulate gyrus and bilateral posterior middle temporal gyrus. These findings could explain the underpinnings of the key clinical features of MDD such as anhedonia, rumination of thoughts, reduced visuo-spatial comprehension, reduced language function, and response to external stimuli; however, further studies with larger sample size are warranted to better understand the correlations between the functional connectivity alterations and the symptoms of MDD.
Footnotes
Authors’ Contribution
All authors contributed to the preparation of the manuscript. PS and SP designed and conceptualized the study. PS, MJ, and JS recruited the participants and completed the screening assessments. SP, AM, SK, and AL analyzed the data and performed the statistical analysis. SP, PS, and MJ wrote the initial draft of this manuscript. PS acquired funding and the final manuscript was approved by all the authors.
Statement of Ethics
The study received an approval from the institutional ethics committee (IEC) (Approval number – IEC/AIIMS/BTI/222, dated: 10/10/2022).
An informed and written consent were obtained from all theparticipants.
Declaration of Conflicting Interest
The authors declared no potential conflicts of interest with respect to the research, authorship, and/or publication of this article.
Funding
The authors disclosed receipt of the following financial support for the research, authorship, and/or publication of this article: This work was supported by science and engineering research board, Department of Science and Technology, Government of India (Grant Number – SRG/2022/001306).