
Abstract
Background
Segmentation and morphometric measurement of brain tissue and regions from non-invasive magnetic resonance images have clinical and research applications. Several software tools and models have been developed by different research groups which are increasingly used for segmentation and morphometric measurements. Variability in results has been observed in the imaging data processed with different neuroimaging pipelines which have increased the focus on standardization.
Purpose
The availability of several tools and models for brain morphometry poses challenges as an analysis done on the same set of data using different sets of tools and pipelines may result in different results and interpretations and there is a need for understanding the reliability and accuracy of such models.
Methods
T1-weighted (T1-w) brain volumes from the publicly available OASIS3 dataset have been analysed using recent versions of FreeSurfer, FSL-FAST, CAT12, and ANTs pipelines. grey matter (GM), white matter (WM), and estimated total intracranial volume (eTIV) have been extracted and compared for inter-method variability and accuracy.
Results
All four methods are consistent and strongly reproducible in their measurement across subjects however there is a significant degree of variability between these methods.
Conclusion
CAT12 and FreeSurfer methods have the highest degree of agreement in tissue class segmentation and are most reproducible compared to others.
Introduction
Advancements in neuro-imaging have greatly increased our impetus for the study of brain structure and function. 1 Magnetic Resonance Imaging (MRI) techniques provide good contrast between grey matter (GM), white matter (WM), and cerebrospinal fluid (CSF) and it is extensively used for structural and functional (fMRI) imaging of the brain. 2
Segmentation of 3D brain volumes into tissue types and between different cortical and subcortical regions has applications in a wide range of biomedical research problems.3, 4 Manual segmentation is considered the “gold standard” but suffers from serious drawbacks like being time-consuming, inter-rater variability and not being suitable for large-scale evaluation. 5
Automatic, semi-automatic segmentation methods including machine learning models have been developed to address these shortcomings and are used for tissue-class segmentation, cortical and sub-cortical segmentation, and are being increasingly used for neuroimaging analysis. 6 There are several tools in the public domain developed by different research groups for neuroimaging analysis 6 and each of them implements its own approach for bias-field correction, brain extraction, segmentation, and so on.
Several past studies have compared some of the segmentation methods applied either on the whole brain or to specific regions but mostly carried on much smaller datasets (n < 100).7–10 The main goal of this study is to compare the reliability and reproducibility of automatic brain tissue segmentation using FreeSurfer, FSL-FAST, CAT12, and ANTs on a large dataset and compare agreement between them.
Methods
Dataset
The publicly available OASIS3
11
dataset (2022 Release) has been downloaded from
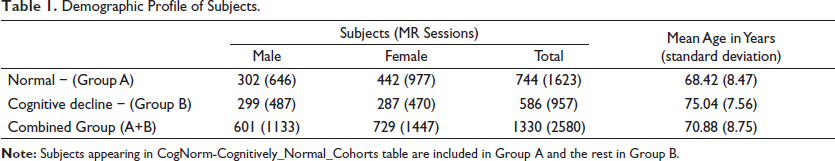
Demographic Profile of Subjects.
MR Images
T1-weighted (T1-w) MR images in NIFTI format for each of the subjects scanned at 3-Tesla scanners at different time points have been extracted from the OASIS3 dataset. The subjects are scanned on different Siemens 3-Tesla MRI Scanners as detailed in Table 2. The OASIS3 imaging methods, scanning protocols, and data dictionary are available on the OASIS website (
List of Scanner Models Used for 3T MR Acquisition.
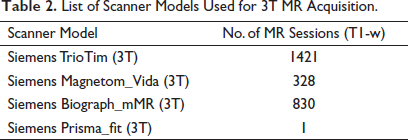
Image Processing
Each of the MR volumes has been processed through publicly available versions of FreeSurfer, FMRIB Software Library (FSL), Advanced Normalization Tools (ANTs), and Computational Anatomy Toolbox (CAT12) pipelines. The segmentation volumes for GM, WM, and estimated total intracranial volume (eTIV) of the brain have been extracted from the segmentation output. The brief detail of each of the pipelines is detailed as under:
FreeSurfer
FreeSurfer
12
(
FMRIB Software Library (FSL)
FSL
13
(
Advanced Normalization Tools (ANTs)
ANTs
15
(
Computational Anatomy Toolbox (CAT12)
CAT12
16
(
Quality Control
MR images that have failed during any of the automated image processing pipelines have been excluded, similarly, those images for which IQR was estimated to be below 75% have been visually inspected before further analysis.
Statistical Analysis
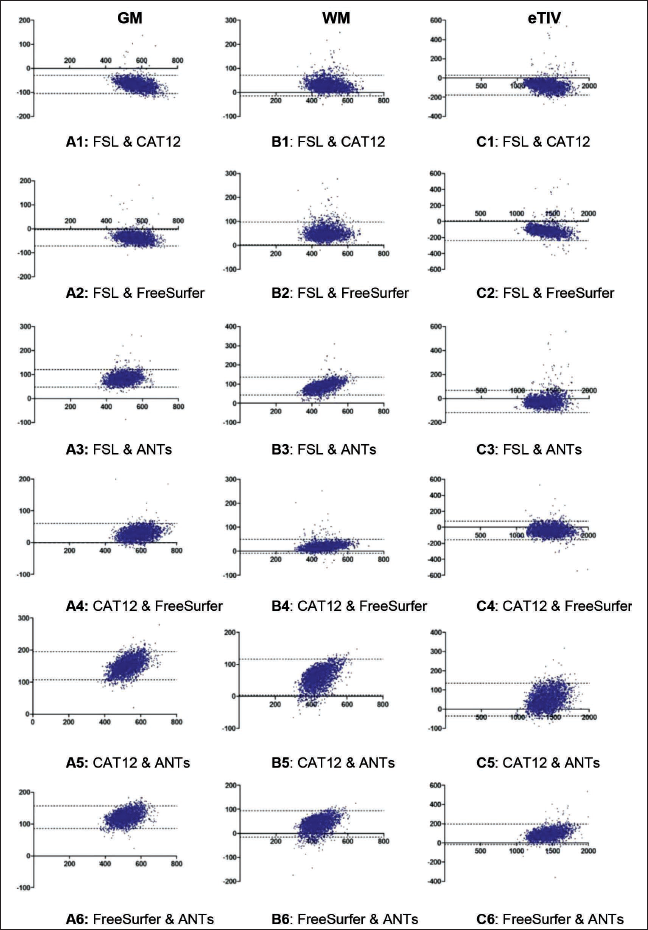
The mean and standard deviation of GM, WM, and eTIV (in cm3) from each of the methods across different age bands in normal as well as cognitively declining population has been measured and compared. The agreement between the methods has been analysed with Bland-Altman Plots 19 for each pair of methods, the X-axis in the plot represents the mean measurement of the two methods and the Y-axis denotes the difference between the methods. The lower and upper line of agreements corresponding to a 95% confidence interval is also plotted parallel to the X-axis in the BA plot. Reproducibility of measurement has been evaluated in a subset of the dataset (n = 56) of the normal population having scan-rescan performed within 1 year on the same MRI scanner model.
Results
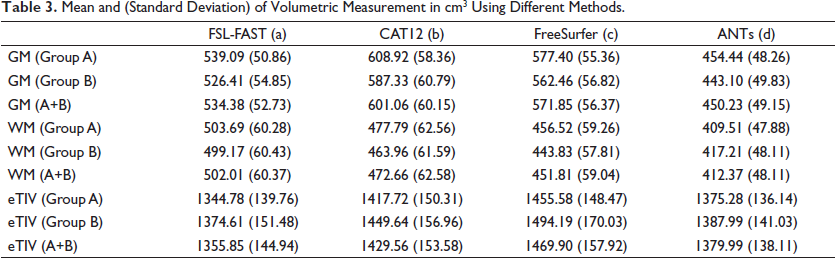
The mean age of the selected subjects was 70.88 years, the normal group (A) was 6.62 years younger than the cognitive decline group (B). The e-ICV of group B was higher than group A but the GM and WM volumes were consistently reported lower by each of the methods in group B (Table 3) pointing to age-related brain atrophy 20 which may have further been accelerated in the cognitive decline group. 21
Mean and (Standard Deviation) of Volumetric Measurement in cm3 Using Different Methods.
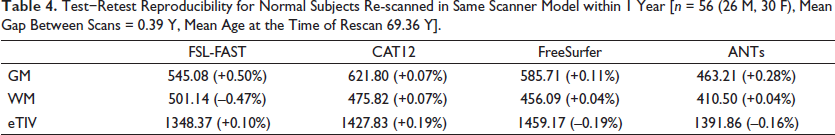
The reproducibility of the four methods tested on a smaller test−retest dataset of n = 56 has a variation of less than 1% pointing to a high degree of reproducibility for each of the four methods. CAT12 with a mean change of 0.07% for both GM and WM was most reproducible for tissue class segmentation followed by FreeSurfer and ANTs (Table 4).
Test−Retest Reproducibility for Normal Subjects Re-scanned in Same Scanner Model within 1 Year [n = 56 (26 M, 30 F), Mean Gap Between Scans = 0.39 Y, Mean Age at the Time of Rescan 69.36 Y].
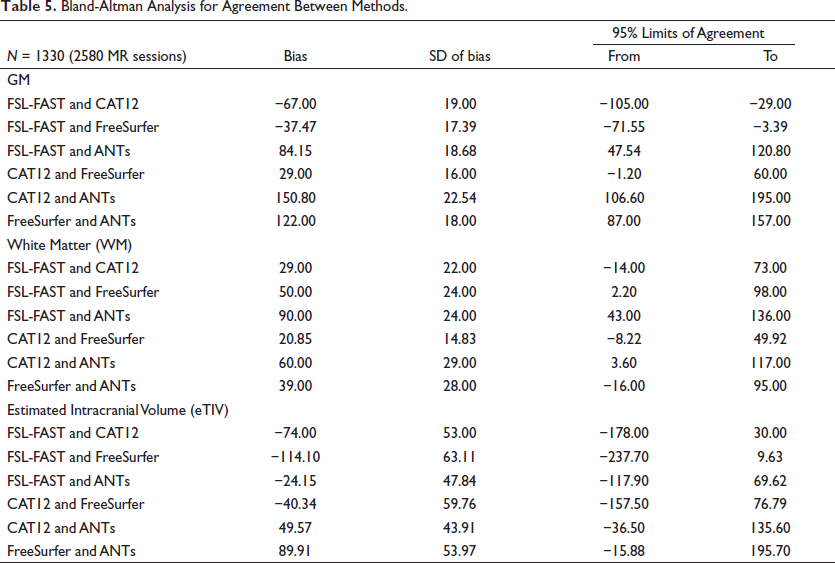
The Bland-Altman plots (Figure 1) for comparing agreement among the methods showed that most of the observations were falling within the 95% confidence interval. The bias between GM and WM measurement (Table 5) was lowest among FreeSurfer and CAT12 methods and the 95% confidence interval was also narrowest.
Bland-Altman Plots for Comparing Between Each Pair of Methods for GM, WM, and eTIV.
Bland-Altman Analysis for Agreement Between Methods.
Discussion
Each of the discussed neuroimaging pipelines used for segmentation has significant technical differences in their implementation and how they define different tissue classes. FSL-FAST and CAT12 pipelines perform partial volume estimation of tissue classes using Markov random field model with expectation-maximization 13 and Adaptive Maximum A Posterior (AMAP) technique, 16 respectively, FreeSurfer uses image intensity along with probabilistic atlas 12 in its segmentation model resulting in fine grain segmentation from which the tissue volumes are computed, ANTs relies on probabilistic tissue segmentation 22 along with machine learning models trained on labelled data in its segmentation approach. The difference in the various methods was observable in GM and WM measurements. The GM and WM tissue observations from the CAT12 and FreeSurfer methods have a higher degree of agreement whereas FSL-FAST has reported lower GM but higher WM as compared to CAT12 and FreeSurfer. On the other hand, ANTs have consistently underreported GM and WM compared to all other methods and this may be improved by labelled training data. Despite these differences between methods, the observations across subjects for each of the methods were consistent and reproducible as also evident from test-retest reproducibility of less than 1% in the smaller dataset.
However, among the methods CAT12 and FreeSurfer have performed better than others, FreeSurfer performs fine grain segmentation of cortical and subcortical regions using the Destrieux atlas and the Desikan-Killiany atlas and is suitable for the region of interest studies.
One of the potential drawbacks of the current study is that the selected dataset is primarily composed of the elderly population (mean age = 70.88 years) and the findings may not be representative of younger age groups.
Conclusion
CAT12 and FreeSurfer methods have the highest degree of agreement in tissue class segmentation and are most reproducible compared to others.
Footnotes
Acknowledgements
Data were provided by OASIS, OASIS-3: Longitudinal Multimodal Neuroimaging: Principal Investigators: T. Benzinger, D. Marcus, J. Morris; NIH P30 AG066444, P50 AG00561, P30 NS09857781, P01 AG026276, P01 AG003991, R01 AG043434, UL1 TR000448, R01 EB009352. The author would like to thank Dr. Richa Chaturvedi, Professor, School of Computer Science, Starex University for her guidance and support.
Statement of Ethics
Not applicable.
Declaration of Conflicting Interests
The authors declared no potential conflicts of interest with respect to the research, authorship, and/or publication of this article.
Funding
The data analysis has been carried out on computational resources funded by the Department of Biotechnology, Government of India under the erstwhile DIC project.