
Abstract
The need to guarantee public health spending sustainability remains on the governments’ agenda, despite constant efforts to improve health sector efficiency and to contain health spending growth. In this paper, we analyse citizens’, managers’ and health professionals’ views concerning the choice of alternative National Health Service (NHS)’ financing sources and the selection of priority areas to be financed from public funds. The main novelty of this study is the auscultation and the evaluation of different stakeholders’ perspectives concerning health spending decisions, namely, health professionals, managers and the general public. An online questionnaire was used to collect data. Methods include descriptive and inferential statistics, a Pareto graph and a factorial analysis. Our results reveal the preferable additional NHS funding sources are lottery and games of chance and the increase in alcohol and tobacco taxes. The respondents defend that priorities should consider the improvement of the population’s health status, namely, considering the universality of access, equity, effectiveness and efficiency, in line with the NHS’ mission. Health professionals are also concerned about disease prevention and health promotion. This paper contributes empirical evidence to support health manager decisions, focusing on rationing decisions and alternative financing sources.
Introduction
Health spending growth remains one of the major challenges in the health sector worldwide. Health spending is growing faster than the gross domestic product World Health Organization (WHO, 2018), in spite of the governments’ efforts to contain this tendency. Current public health issues put pressure on the health budgets, due to the increase in demand for healthcare related to ageing population, unhealthy lifestyles, health impacts of climate change and environmental pollution, national disasters, conflicts and mass population movements, among others (WHO Regional Office for Europe, 2018).
The organisation and funding of healthcare vary substantially across countries. In middle-income and high-income countries, a higher share of health spending is funded by public resources, namely, taxes and social health insurance contributions (WHO, 2018). In Portugal, the percentage of public funding is around 60%, and all resident citizens have access to the National Health Service (NHS), financed essentially through compulsory taxes (Simões et al., 2017), under the goal of universal coverage.
In order to contain unbalances in public finances both revenues and expenditures could be restructured. On the one hand, alternative sources of financing health budgets could be evaluated. On the other hand, supply can be rethought based on rationing policies, namely by redefining priorities on access to public service. Priority setting aims to improve equity in the delivery of care (Cromwell et al., 2015; Déry et al., 2019; Norheim, 2015; Sibbald et al., 2010), and could also increase NHS’ efficiency by channelling resources towards more cost-effective interventions (Chalkidou et al., 2016; Griffin et al., 2019).
In any case, these measures will have an impact on citizens’ lives, given that citizens are both users and financiers of the NHS (through mandatory taxes and social contributions). Therefore, it is important that citizens fully understand the aim of the health policies and validate them (Chim et al., 2019; Keene et al., 2016; Thomas, 1993). These measures can only be assured if the public is involved (Bowling, 1996; Degeling et al., 2017; Glover, 2019; Kaplan & Baron-Epel, 2015; Krinks et al., 2016; Li et al., 2015; Street et al., 2014) in the definition of the health policy.
In this regard, the WHO has presented its view on opportunities and challenges for twenty-first-century public health (WHO Regional Office for Europe, 2018). According to that report, ‘health policy development requires engagement in political and social structures, which should comprise a multidisciplinary approach and the involvement of civil society and the private sector (WHO Regional Office for Europe, 2018). That report has also identified the need for scientific evidence to support health policy-making, within a complex social and political context. Moreover, this evidence must be displayed clearly to professionals and the public, as well as to policy-makers (Kaplan & Baron-Epel, 2015; WHO Regional Office for Europe, 2018).
This study aims to contribute with empirical evidence to support healthcare management decisions, by focusing on rationales of decision-making and sources of financing. The objective of this study is to analyse Portuguese nationals’ opinions concerning: (i) the choice of alternative NHS’ financing sources and (ii) the selection of priority areas to be financed by the public funds.
The main novelty of this study is the auscultation and the evaluation of different stakeholders’ perspectives concerning health spending decisions, namely health professionals, managers and general public. Although we used a sample of Portuguese citizens, we think the results and discussion here presented can bring important insights to other countries with growing public health expenditures and similar NHS offerings.
This paper is organised into three sections. Section 2 describes the methodology, Section 3 presents the results and discussion, and in Section 4, the main conclusions are presented.
Methodology
An online questionnaire was developed and made available on various social networks (Facebook, LinkedIn and Twitter) during 2016. The questionnaire included the respondents’ sociodemographic characteristics and health-related variables (groups 1 and 2). Group 3 collected the respondents’ opinions concerning alternative financing sources of public healthcare expenditures, and group 4 asked about their views on priority areas of public intervention.
The questionnaire was constructed based on the one applied to the Argyll and Clyde population by Lees et al. (2002). However, it was adjusted to the Portuguese context and extended to support a more comprehensive analysis. For example, distinct financial sources and potential priority areas were included, a binary variable that takes the value 1 for managers was incorporated, and distinct methods were used. Afterwards, the questionnaire was validated by experts in the fields of health economics, health policy and management. In checking whether the questions were perceptible, the questionnaire was broken down by people with and without academic qualifications and with different ages. The final sample contained 400 complete answers.
Besides the descriptive statistics commonly used, we used non-parametric Chi-square tests, a Pareto graph and a factorial analysis. The Pareto graph was used to present the respondents’ opinions concerning alternative financing sources of public health expenditures. The evaluation of the priorities in the allocation of public spending on health was made using a Likert scale where 1 means ‘not important’, 2 ‘not very important’, 3 ‘important’, 4 ‘very important’ and 5 extremely important’, considering five groups—direct benefits for users, costs, equity and universality in access, type of care provided and health policy strategy. A factorial analysis was used to explain respondents’ views concerning the priority areas of public intervention. Kaiser–Meyer–Olkin (KMO) and Bartlett’s test of sphericity were performed to test sampling adequacy and confirm the appropriateness of the factorial analysis. A confirmatory analysis was also implemented to confirm the robustness of the obtained results.
The quantitative analyses were performed using SPSS (version 21) and AMOS (version 21).
Results and Discussion
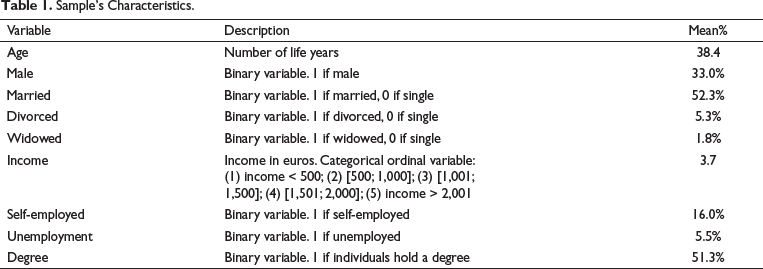
The sample includes 400 Portuguese individuals aged 18 years old and over. Respondents’ characteristics are described in Table 1. This sample approaches Portuguese population’s profile with respect to age—38.4 years old in our sample versus 41.8, in Portugal (Instituto Nacional de Estatística, 2012)—with a majority of women—67.0% versus 52.6%, in Portugal (PORDATA, 2018)—and 52.3% of married respondents—versus 46.6%, in Portugal (Instituto Nacional de Estatística, 2012). Respondents with higher education are overrepresented (51.3% in our sample and 18.1%, in Portugal, in 2017), while the unemployed individuals (5.5%) are slightly below the Portuguese reality, with an unemployment rate of around 8.9%, in 2017 (PORDATA, 2018).
Sample’s Characteristics.
Additional NHS Funding Sources
In the question ‘If the Government needs more revenue to finance health expenditures, indicate three priority sources of financing’, the respondents have to select three sources among 16 possibilities. According to the results, the lottery and games of chance and the increase in taxes on alcohol and tobacco were the main sources of revenue chosen by both the general public and health professionals (Table 2). In the same way, a higher percentage of managers considered that the additional funding from the NHS should be processed through the increase in taxes on tobacco and alcohol, followed by revenues from lotteries and games of chance, similar to the result obtained for health professionals.
Sources of Additional Funding from the NHS.
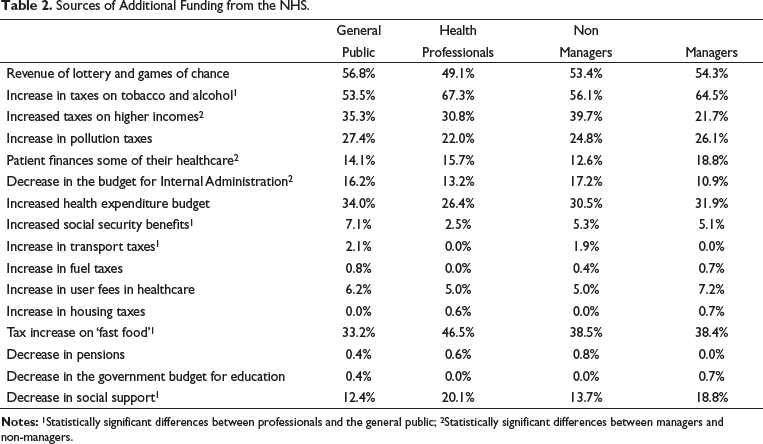
At the opposite extreme (2% or less of the respondents), the following expenses are included: increased transport taxes; increased fuel taxes; decrease in pensions; decrease in the State budget for education and increased housing taxes. These results suggest the respondents favour social protection and seem to penalise unhealthy behaviours. Lees et al. (2002) also concluded the general public prefers the national lottery for providing extra money to the NHS, and the most popular option among the clinicians was a higher tax on cigarettes and alcohol (Lees et al., 2002). The least popular options, for both groups, were education, housing and pensions (Lees et al., 2002).
A Chi-square test was applied, which allowed the identification of statistically significant differences between health professionals and the general public in relation to the following sources of financing: increased taxes on tobacco and alcohol; increased taxes on ‘fast food’; decrease in social support; increased social security benefits and increased taxes on transport, vehicles and road traffic. The Chi-square test’s implementation between managers and non-managers showed that being a manager has a statistically significant effect, that is, it impacts the choice of respondents for the following sources: higher taxes on higher income; the user finances some of their healthcare and decreased budget for internal administration.
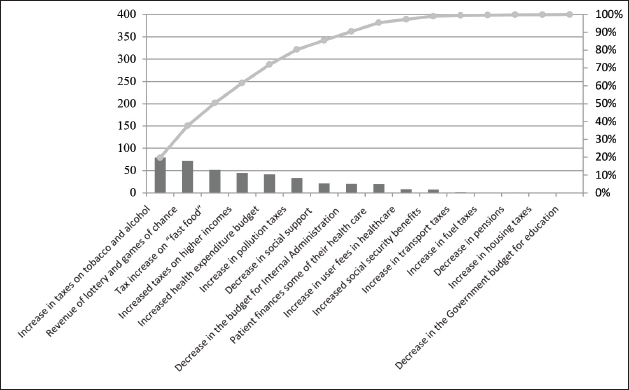
From the Pareto graph (Figure 1)—showing the percentage of respondents who selected each funding source and the accumulated percentage—there was a concentration of 50% of respondents choosing the following three priority sources of financing: taxes on tobacco and alcohol; lottery and games of chance and increased taxes on ‘fast food’.
Pareto Graphic Considering Financing Sources.
Establishing Priorities in Health
The following describes the respondents’ perception of the priority in allocating public health expenditures to each item listed in Table 3, using a 5-point Likert importance scale. The general public attributed more relative importance, with a mean of 4 or more and a median of 4 or 5 in the following items: ‘To reduce the waiting time for urgent treatment’; ‘For an efficient and effective health care delivery’; ‘So that all health care is accessible to all users’ and ‘Improving the health status of the population. However, Lees et al. (2002) found that the general public selected different priorities, namely that all healthcare is available at the nearest hospital and the reduction of waiting times for non-urgent treatment (Lees et al., 2002). On the other hand, Bowling (1996) concluded that highest priority was accorded to ‘treatments for children with life-threatening illness’ and ‘special care and pain relief for people who are dying’ (Bowling, 1996), and in Pinho e Borges (2015) respondents seem to prioritise patients based on the efficiency principle, which is by giving priority to patients considering their age and potential health gains (Pinho & Borges, 2015). In the same way, Chim et al. (2019) point out that the general public gives more priority to children than to end-of-life treatments (Chim et al., 2019).
Priority Areas of Intervention.
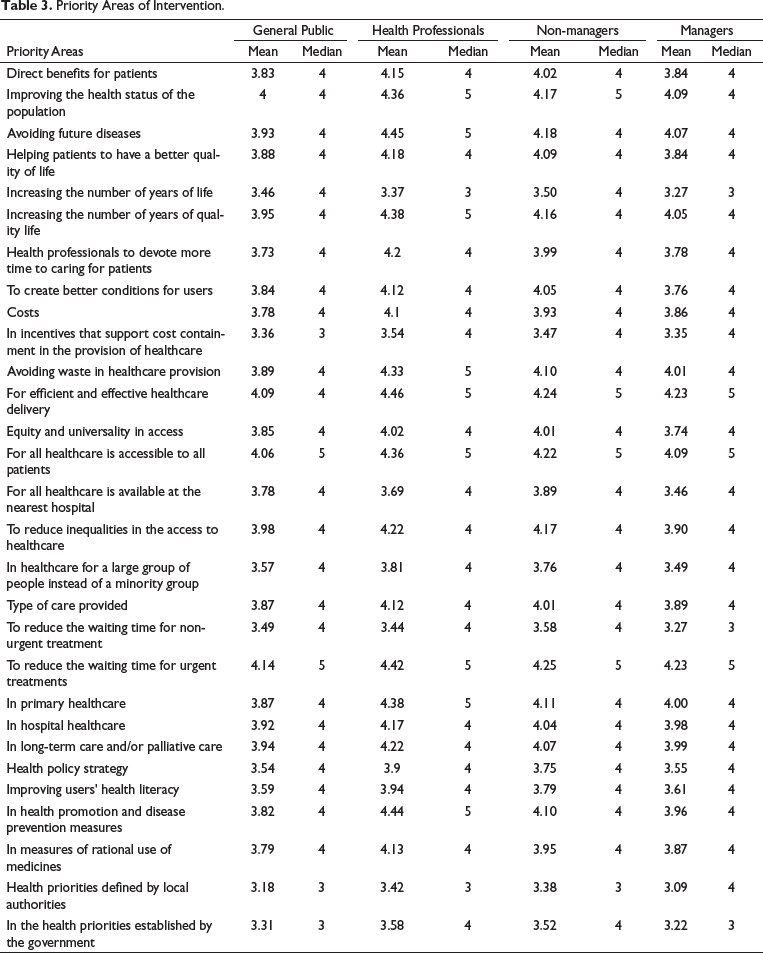
Health professionals also pointed out these items, in which the median was 5, as well as the following: ‘Avoiding future diseases’; ‘In health promotion and disease prevention measures’; ‘To increase the number of years of quality life’; ‘In primary health care’ and ‘To avoid waste in the provision of health care’. These results reveal health professionals are also concerned about prevention measures (including the focus on primary healthcare) and about the cost-effectiveness of the chosen interventions, in line with Griffin et al. (2019). Managers attributed greater importance to the following items: ‘For an efficient and effective provision of health care’, ‘For the reduction of waiting time for urgent treatments’ and ‘So that all health care is accessible to all users.’
In summary, for the four profiles of individuals, the common priorities are: ‘For an efficient and effective provision of health care’, ‘So that all health care is accessible to all users’ and ‘For the reduction of the waiting time for urgent treatments’.
On the other hand, the general public attributed less importance to the following items: ‘In incentives that favour cost containment in the provision of health care’; ‘In the health priorities established by the Government’ and ‘Health priorities defined by local authorities.’ Health professionals attributed less relative importance, with a median of 3, to the following points: ‘Health priorities defined by local authorities’; and ‘Increasing the number of years of life’. Non-managers only presented one item with a median equal to 3 ‘To health priorities defined by local authorities.’ For managers, the attribution of the least importance is similar to that of health professionals, but with an additional item ‘To reduce the time that users wait for non-urgent treatment.’
Considering categories, the general public and managers think that, on average, higher priority should be given according to the ‘type of care provided’, while health professionals prefer to invest public money in items with ‘direct benefits for users’. All the groups considered less priority should be given to ‘Health policy strategy’.
Factorial and Confirmatory Analysis
Additionally, a factor analysis was carried out with the 24 items, to identify the constructs that most contribute to explaining the opinion expressed by the respondents. From the implementation of the KMO and Bartlett tests, we concluded that the factor analysis is adequate—the KMO value approaches one (KMO = 0.9) and the Bartlett test (χ2 = 2,782.6) presents statistical significance (P < 0.01), which indicates that the correlations between variables allow the consideration of the factor analysis in question (Table 3). The factor analysis results are given in Table 4, obtained through the principal component method. Two main components were obtained, responsible for the explanation of 76.3% of the variance of all data.
Factorial Analysis Results.
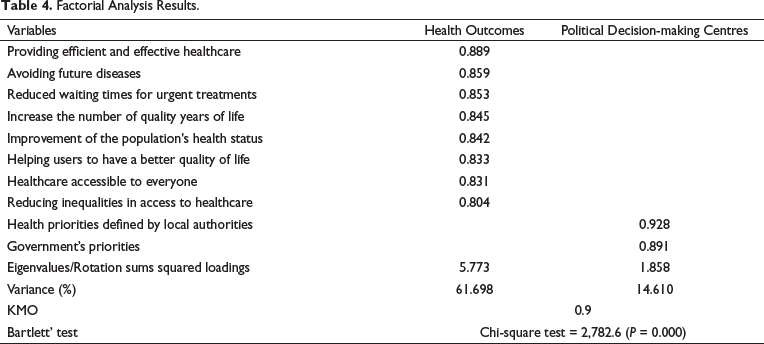
The first construct explains 61.7% of the variance and is related to the health results obtained, in particular if the priorities are defined taking into account the improvement of the population’s health status, focusing on the universality of access, with equity, effectiveness and efficiency and providing quality of life. The second component contributes to explaining 14.6% of the respondents’ opinions and refers to the decision-making power of political centres (autarchies and government) in defining public health spending priorities. This last factor relates to the diminished priority that all groups attributed to the health policy strategy (Table 3). In short, the application of factor analysis shows that not all the 24 items presented are important for determining public funding priorities. In fact, the ‘health outcomes’ component (which includes 8 of the 24 items) explains more than 60% of the variance in the respondents’ perception of the definition of health priorities. The results of the confirmatory analysis show that the measurement model fits the data well (Hair et al., 2010). Convergent validity was studied by calculating construct reliability (CR) and average variance extracted (AVE). Both the AVE and CR values are above the proposed threshold. The psychometric properties of measurement factors used in model estimation are satisfactory as indicated by CR (> 0.7) and AVE (> .6) values (Bagozzi & Yi, 1988).
Conclusion
Considering the need to guarantee health budget equilibrium, this article sheds some light on different stakeholders’ views on alternative sources of financing of the health budgets and on defining priorities on the access to public health services.
The preferable additional NHS funding sources selected by the general public, health professionals and managers were lottery and games of chance and the increase in taxes on alcohol and tobacco. These results suggest the respondents favour social protection and seem to penalise unhealthy behaviours.
Our results reveal that the public defends that priorities should be defined taking into account the improvement of the population’s health status, focusing on the universality of access, with equity, effectiveness and efficiency and providing quality of life, which are in line with the NHS’ mission and also reveals concerns with the need to promote a financial sustainable NHS. However, health professionals are also concerned about disease prevention and health promotion.
Concerning the study’s limitations, online surveys enable a large number of responses to be collected quickly but exclude individuals who do not have Internet access. Our sample has an overrepresentation of respondents with a degree and an underrepresentation of unemployment, which can be linked to the questionnaire administration technique used.
Footnotes
Declaration of Conflicting Interests
The authors declared no potential conflicts of interest with respect to the research, authorship and/or publication of this article.
Funding
The authors received no financial support for the research, authorship and/or publication of this article.