
Abstract
Establishing the sex of an unidentified cranium is foremost steps toward its biological profiling. Recent studies on sex estimation using small sample sizes (some even used as small as 50) from anatomy departments claim high accuracy rates, prompting validation efforts. This study focuses on validating such claims and establishing discriminant functions for North Indian populations, particularly in the mastoid region. In a previous study by the author on North Indians, the mastoid region provided very high accuracy (87%) using just two variables, asterion-mastoidale (Ast-Ms) and mastoid breadth. Then the author tried to validate the results of the previous study with increased samples of 158 (M/F: 110:48 females, age 18–70 years) crania using discriminant function analysis and receiver operating curve analysis (ROC).
The highest sex classification accuracy reached up to 79.7% using multivariate discriminant analysis. It is observed that the same variables, that is, Ast-Ms and mastoid breadth couldn’t be too discriminating and were not selected in the stepwise analysis. This difference in classification accuracy simply shows the biological variability in a population. However, in ROC analysis, the variables Ast-Ms (area under the curve [AUC] = 0.803) provided an accuracy of 78.48%. By considering sample size, investigators may limit the chance of reporting false-negative or false-positive findings with larger sample sizes, which in turn produce more accurate results. In essence, while smaller studies may boast high accuracy, validation with larger samples is essential. Moreover, utilizing diverse statistical methods ensures robustness in variable selection for forensic applications.
Keywords
Introduction
In recent years, man-made, natural disasters, and criminal methods of hiding the identity of the deceased have fetched an immense role for forensic anthropologists and odontologists in the identification of unknown and unidentified bodies or skeletal remains. At the very basic level, they use biological profiling, which includes the sex, age, stature, and racial affinity of the unknown. These preliminary methods shortlist the possible matches by narrowing the vast number of victims. For biological profiling, sex estimation is the starting point. A correct and objective sex assessment of skeletal remains will likely reduce the possible victim matches by 50%, thus reducing the time, efforts, and money of the investigating authorities by half. Further, it ensures a correct evaluation of age, stature, and ancestry, as these variables are highly sex-dependent and may simultaneously serve as foundational data for identification methods such as facial reconstruction.1–3 Further, the correct estimation of sex is also imperative from bioarcheological, anatomical, and forensic perspectives.
Among human skeletal parts, the skull is considered highly dimorphic. In cranial sex indicators, the metric and visually assessed methods of the mastoid region are well documented.4–6 Its compact structure and anatomical position make it more protected and resistant to damage. The mastoid process typically remains intact and is generally more robust in males. 7 Hoshi 8 sexed Japanese skulls based on three shapes of the mastoid process, that is, male (M), neutral (N), and female (F). Because male mastoid processes (M) are longer, the skull rests on them. In females, the shorter height of the mastoid process causes the skull to rest on the occipital condyles when placed on a flat surface. In the last four decades, several research studies have explored the sexual differences in the mastoid region using various qualitative and quantitative methods in different populations around the world.9, 10–20 Garvin et al. 5 and Sinhorini et al. 21 examined the different areas of the cranium for sexual dimorphic ability and found the mastoid area to be most dimorphic, pointing out the limitation of the small sample size in their studies. The relative cranial robustness and gracility of different sexually dimorphic traits vary by population due to obvious genetic and environmental changes. 22 These variations require the osteometric standards to be population specific and updated.11, 23–26
The reliability and accuracy of sex determination depend on the skeletal assemblage and exposure conditions, the age of the subject, intrinsic variability, the method applied, and the specific population being examined.10, 27, 28 Along with these criteria, the reliability of a discriminant function also depends on the number of samples included in the particular study. Metric variables are a noninvasive, low-cost, and suitable method for evaluating sexual differences, stature estimation, age estimation, and racial/population variation, as well as to denote secular/temporal changes. Nevertheless, metric methods are susceptible to error, which can happen due to an insufficient number of samples. Therefore, the primary objective of the current research is to validate the sex-differentiating capability of the mastoid region and to establish latest sex discriminant functions for assessment in cases involving fragmentary crania. The second aim is to deduce the consequences of the sample size on the selection of variables in discriminant function analysis (DFA).
Materials and Methods
To precisely determine the impact of sample size on discriminant formulas, the author conducted a critical assessment of a previous study, 7 which utilized a sample of 138 crania from the North Indian population to estimate sex using the mastoid region. This study included a total of 158 crania (M/F: 110:48, age: 18–70 years) collected in the Department of Forensic Medicine, Institute of Medical Sciences, Banaras Hindu University, Varanasi from January 2007 to January 2011. The crania were collected from the unclaimed bodies as donated to the Department of Forensic Medicine & Toxicology and Department of Anatomy (The Uttar Pradesh Anatomy Act, 1956- The Anatomy Act, enacted by various states in India, mandates the provision of unclaimed bodies to medical and teaching institutions for anatomical examination, dissection, and related purposes. These cadavers are typically unclaimed bodies acquired by the police).
A total of eight variables were measured using a sliding caliper (0.05 mm precision). Each measurement was taken three times on the left side of crania, and the average values were used for the analysis. The measurements, mastoid length (ML), mastoid breadth (MB), asterion-porion (Ast-Po), posterior end of incisura mastoidea-depression of suprameatal triangle (PEIM-DSMT), posterior end of incisura mastoidea-porion (PEIM-Po), asterion-depression of supra meatal triangle (Ast-DSMT), asterion-mastoidale (Ast-Ms), mastoidale-porion mastoid height (Ms-Po), were taken as described in the previous study. 7
Statistical Analysis
Statistical analysis was conducted using SPSS 20.0. A t-test is used to compare male and female measurements. The intraobserver error was assessed using the paired t-test. DFA and receiver operating characteristic (ROC) analysis7, 20 were utilized to examine the degree of sexual dimorphism and the accuracy percentage for each measurement. In DFA, stepwise analysis was followed by direct discriminant analysis to derive specific discriminant formulas aimed at achieving maximum accuracy. Then the mean values, t-values, P values, and classification accuracies were compared with the previous study, which provided very promising results in a comparatively smaller sample size (total: 138; M: F-104:34). 7
Results
Table 1 provides descriptive statistics for the small 7 and large (current) samples with t-test and P values. Males showed significantly larger dimensions than females. It can also be noticed that the standard deviation has slightly decreased after the addition of the samples. Further, it can be deduced from the table that the t-values are considerably decreased after the addition of the sample, particularly in the case of MB.
Descriptive Statistics of Measurements of Mastoid Region (mm), t-test and Significance of Differences Between Small and Large Samples.
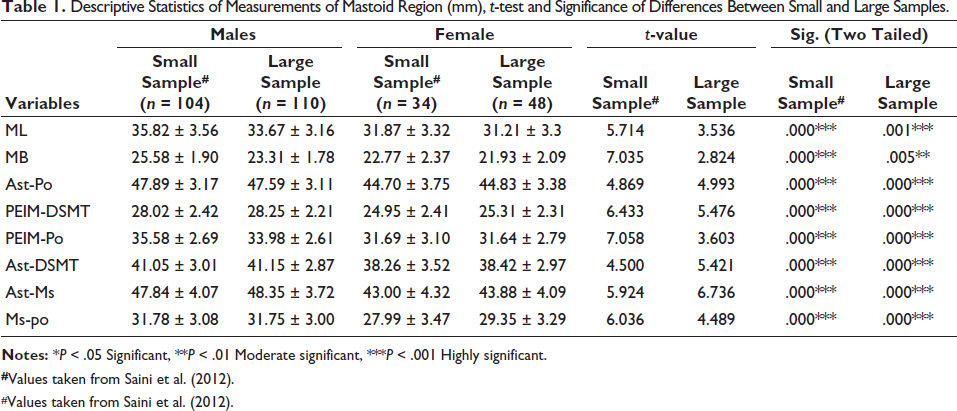
#Values taken from Saini et al. (2012).
#Values taken from Saini et al. (2012).
Table 2 shows the findings of intraobserver error. The correlation values show a substantial association between the measures recorded in the first and second occurrences. The P values demonstrate that there is no significant difference between the two measurements.
Results of Paired t-test (Intraobserver Error).
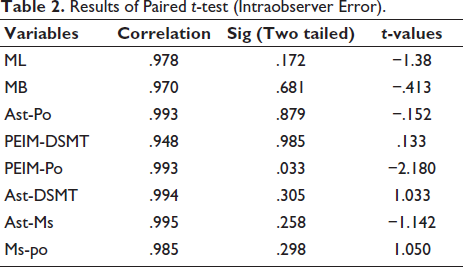
Table 3 shows the result of the stepwise analysis. Wilks’ lambda is a measure of how effectively each variable performs in a function to separate cases into groups. The score of Wilks’ lambda lies between 0 and 1, where the lesser values close to 0 indicate a higher capacity for discrimination by the function.
Result of Stepwise Discriminant Analysis for Small and Large Samples.
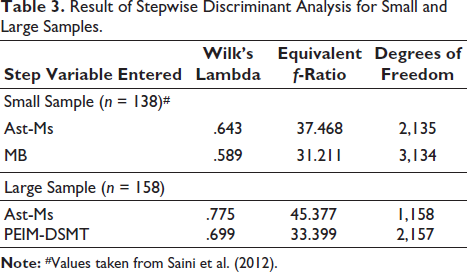
Table 4 provides the results of canonical discriminant functions and sex classification accuracies for small and large sample sizes. It is obvious from the table that the functions are very different for a small and large sample. The single variable Ast-Ms is selected in stepwise analysis in both sample groups. Ast-Ms was also selected as the best variable in both small and large samples, providing accuracies of 75.4% and 77.2%, respectively. After trying various combinations of variables in direction analysis, the sex classification accuracy didn’t increase above 79.7%, that is, about 7.3% less in comparison to the small sample.
Canonical Discriminant Function Coefficients for Stepwise and Direct Analysis with Correct Prediction Accuracies for Small and Large Samples.
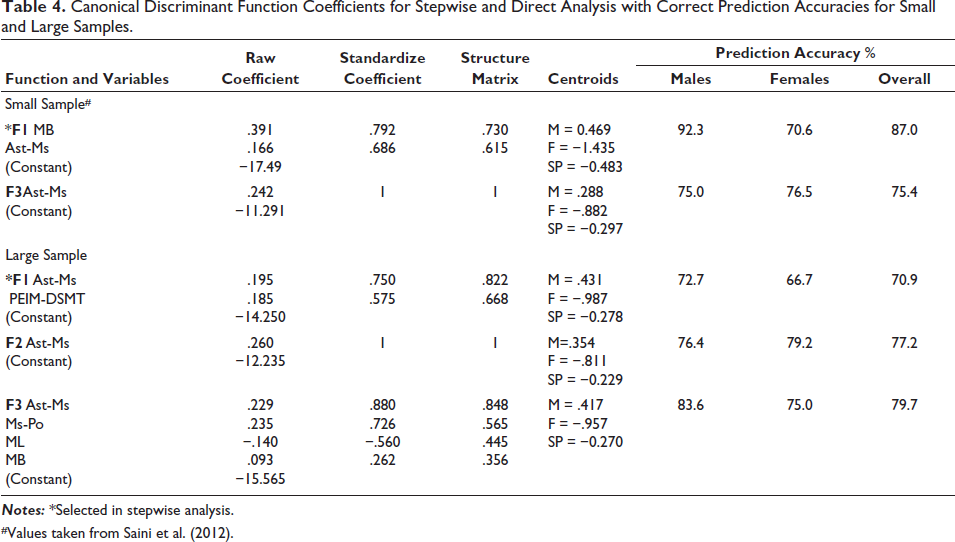
#Values taken from Saini et al. (2012).
Table 5 provides the correct sex classification accuracy for both sample groups. In both groups, the Ast-Ms emerged as the best variable, providing an accuracy of 75.36% and 77.2% in the small and large samples, respectively.
Correct Classification Percentages for Males, Females and Overall Accuracy (%) After Cross Validation.
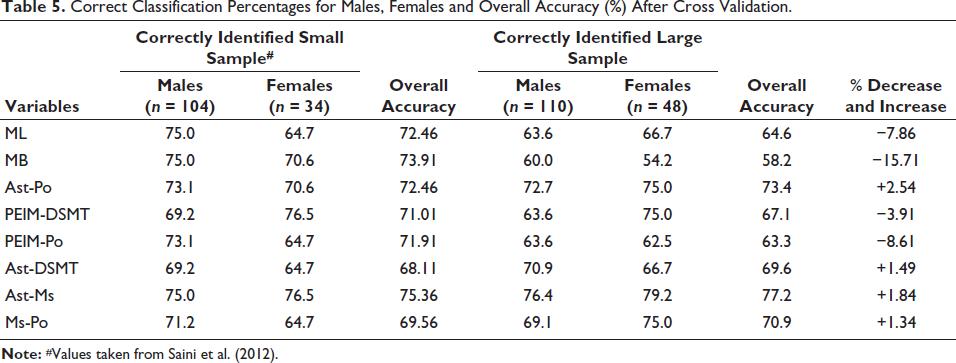
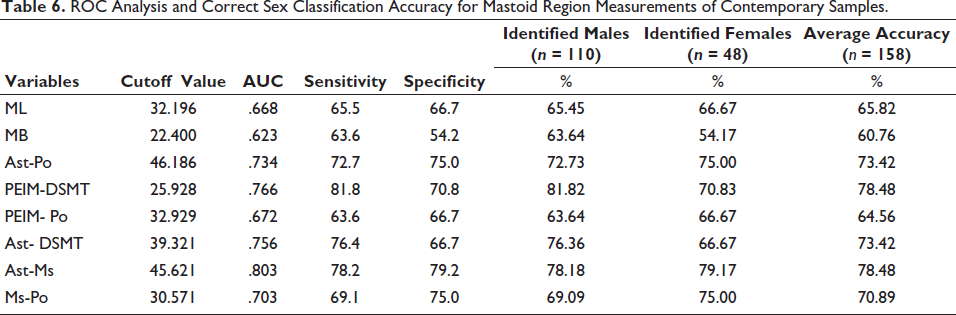
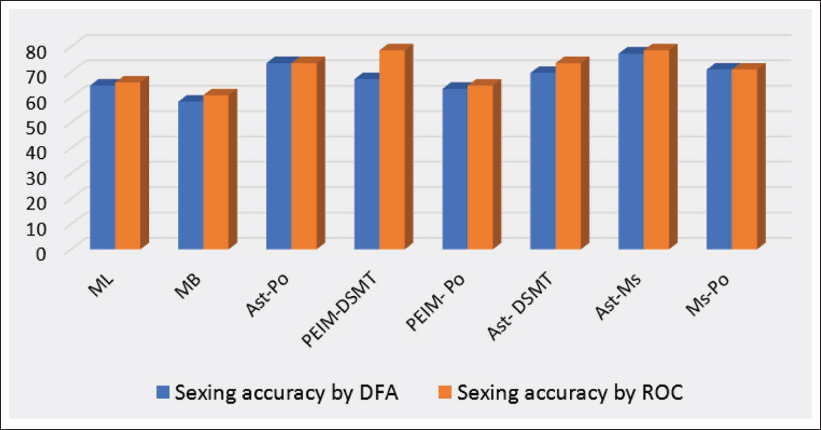
Table 6 shows the outcome of the ROC analysis, which clearly depicts that the classification accuracy reached up to 78.48% for two variables separately. A comparative graph also shows the sexing accuracy obtained by DFA and ROC (Figure 1).
ROC Analysis and Correct Sex Classification Accuracy for Mastoid Region Measurements of Contemporary Samples.
Discussion
Effect of Sample Size on Sexing Accuracy
One of the primary goals of the current investigation was to determine the influence of sample size, which is elaborated by the results obtained for the small 7 and large samples (current study). A sufficient number of samples is considered essential to quality research. Awareness of population-specific anthropological standards has grown, leading to more forensic research across diverse groups. However, sample sizes for Indian populations (dominantly Hindus) remain limited due to cremation practices and religious beliefs. During the literature review, the author came across various anthropological studies where small samples (<100) were used to create a sex discriminant function.29–31
In forensic anthropometry, sample size (n) is the number of individual/bones utilized to collect data and to calculate a set of statistics. Andrade 32 and Zamboni 33 emphasized the importance of a larger sample size. A bigger sample helps investigators to generate more precise average values, uncover outliers that might bias the results in a smaller sample, and give a narrower range of error. 33 The findings demonstrated significant sexual dimorphism in the mastoid region’s size, establishing its relevance as a sex predictor in the North Indian population. But sample size plays a very crucial role in deciding the classification accuracy, as shown by the comparison of results with the previous study on the same population and sample.
A larger sample size more closely estimates population variation. The standard error (which measures the degree of sampling variability) is greater where a sampling size is smaller, and vice versa. So, when the sample size is small, it can be difficult to see a difference between the sample mean and the population mean because too much sampling variability draws the wrong conclusions. If the sample size is large, it is easier to see a difference between the sample mean and the population mean because the sampling variability is not obscuring the difference (
Inter- and Intra-population Variability in Expression of Cranial Traits, Landmarks, and Measurements and its Effect on Sexing Accuracy
The second aim of the study was to provide discriminant functions that could be used in a forensic scenario. All parameters of the mastoid region were unconventional and new (except Ms-Po). In the small sample, MB and Ast-Ms were selected in stepwise analysis and provided an accuracy of 87%. Upon the addition of more samples, the mean and t-values changed considerably. Particularly in the cases of MB, PEIM-Po, and ML (Table 1), a decrease in sexing accuracy was reflected as 15.71%, 8.61%, and 7.86%, respectively (Table 5). This resulted in the selection of other variables (PEIM-DSMT and Ast-Ms) in the stepwise analysis (excluding MB) (Table 4) and an overall decreased discrimination of male and female crania in the large sample (Table 5). The only thing constant in both studies was the best variable, that is, Ast-Ms (Table 5). Franklin et al. 34 achieved sexing accuracy up to 95% in a pilot study (40 samples), but when the sample size increased in a subsequent study, 35 the sexing accuracy decreased to 84%. Overall, in this study, direct analysis provided the best separation of sexes (79.7%) by the combination of Ast-Ms, MHt, MLt, and MBr.
Nagaoka et al. 17 found “Asterion” to be the most unreliable landmark, and they attributed the complexity of lambdoid sutures to this unreliability of the position of Asterion. Some earlier anatomical and clinical/neurological studies on ‘Asterion’ and ‘Porion’ noticed the location of this landmark fluctuates with age in a population-specific way.13, 29, 36–39 However, the above statement could be valid for all craniometric landmarks and measurements, as each population differs from the other. Lesciottoa and Doershuka 40 observed a negligible effect of ageing on the mastoid region and other nonmetric traits, which was validated by Tallman. 41 In this investigation, it was found that once the “Asterion” is identified correctly, it shows almost identical sexing accuracy (slightly increased after the addition of a sample) (Table 5). The variation in accuracy found among groups may be explained by population-specific changes in landmark forms and sample heterogeneity.
Discrimination Ability of Different Mastoid Region Variables in Different Populations
It has been observed that the most dimorphic quantitative variables of the mastoid process also differ among population groups. The current investigation yielded greater sexing accuracies than other groups, including Germans and Portuguese, 13 Brazilians9, 16 and American Whites.42, 43 However, Nagaoka et al. 17 in their study on the Japanese population revealed exceptionally high sexing accuracies (92%) from a combination of mastoid height and width together, 17 but it is futile for a contemporary forensic sample as they used an archaeological sample of the twelfth and fourteenth centuries, which comprised only 50 males and 37 females without documented sex and age. The variable mastoid height (Ms-Po), that was shown to be significantly dimorphic and highly discriminating in their investigation, 17 has provided an accuracy of only 70.9% in this study. Manoonpol and Plakornkul 18 used linear discriminant analysis on 60 males and 40 females’ skull samples from the Thai population. They achieved the highest accuracy (76.90%) with Ms-As. Jaja et al. examined the cephalograms of 102 Nigerians for 3 measurements of the mastoid region with the area, and they found this region unreliable for forensic work as the highest accuracy, merely 65%, was obtained for the variable Ast-Ms distance. 44 Madadin et al. investigated 206 computed tomography (CT) scans from the Saudi population to estimate sex, and Ms-Po was the most effective variable, with a 69.4% accuracy. 45 Recently, Ibrahim et al. studied sexual differences in a sufficiently large Malaysian sample using CT scan data and found the area of the mastoid triangle to be the best discriminator of sex (84% sexing accuracy). 46 Nikita and Michopoulou 47 used a different approach and found that the mastoid process had relatively acceptable outcomes, with a correct sexing accuracy of 74.5% for pooled sexes. Toneva et al. 48 also observed the CT scans of the Bulgarian population and found high classification accuracies in test samples for mastoid measurements, that is, 88.1% for left Po-Ms, 78.6% for Ms-Ast, and 83.3% for Po-Ast, which are the highest in the contemporary sample. In the above studies, some researchers used archaeological samples, some used CT scans or cephalograms, and some used dry crania, which may also be attributed to differences in classification accuracy.
Apart from genetic variation, several other nongenetic factors influence the degree of sexual dimorphism in the human skull. Nongenetic factors encompass both local traditions and environmental elements that influence growth and development such as diet, physical activity, lifestyle, and health. Further, studies have shown that late-growing regions that increase slowly, for example, the mastoid region, show high sexual dimorphism at maturity.12, 49, 50 The mastoid process is absent in the newborn skull and begins to develop after the first year 51 due to the development and pull of the muscles attached to it. 42 It reaches its final adult size by late adolescence 52 and it extends inferiorly, slightly interiorly, and somewhat medially in the exact direction of pull of the group of muscles, mainly the sternocleidomastoid, splenius capitis (the posterior belly of the digastric muscle), and longissimus capitis.12, 53 Greater development of the mastoid process in males is due to the longer duration of growth, the attachment of muscles over a larger area, and comparatively stronger muscle forces. 7 Petaros et al. 54 presented an elaborated review and put their viewpoint on the different methodologies and measurements employed in sex identification from the mastoid process. Further, they suggested in the terminology of mastoid variables that distance measurements should be denoted by the endpoints employed during the measurement (e.g., distance asterion-porion; distance Ast-Ms), thereby avoiding the terms like mastoid length and height, which are confusing to understand.
As demonstrated in this study, an increase in the sample size may undermine or increase the sex classification accuracy, as may a change in the selection of the best variable. As a result, it is extremely desirable to design sex evaluation criteria that are suited to certain demographic groupings. These criteria will be determined by the exact placement of anatomical landmarks as well as the level of sexual dimorphism in the examined population. In these terms, the precise and accurate localization of the landmarks is of prime significance and a more important precondition for seeking sex differences and assessing the degree of sexual dimorphism in a population. Even in the same population after adding more samples, biological variability in different landmarks may be so obvious that it may lead to a very different level of sexual dimorphism, as shown in this study (Tables 4 and 5).
In conclusion, the current research met the demand for discriminant functions based on the mastoid process and demonstrated the significance of an abundant sample size in forensic anthropological investigations. However, some limitations of the present studies are also acknowledged, including unequal male and female samples, which are common in forensic collections all over the world due to the lesser involvement of females in outdoor activities.
Footnotes
Acknowledgement
The author is deeply grateful to S. K. Tripathi and S. N. Shamal for their support during the research work.
Declaration of Conflict of Interests
The author declared no potential conflicts of interest with respect to the research, authorship, and/or publication of this article.
Ethical Approval
Ethical clearence was taken from the institutional ethical clearence committee of the Institute of Medical Science, BHU, Varanasi.
Funding
The author received no financial support for the research, authorship, and/or publication of this article.
Informed Consent
Not applicable.