
Abstract
Chronological age (CA) may differ from dental or skeletal age, and its correlation becomes important in the evaluation of biological age. The present study aimed to evaluate the association of dental, skeletal, and CA in the 30 subjects of Punjabi Ethnic population aged between 7 and 15 years, using orthopantomogram and lateral cephalogram. All the seven teeth on the mandibular right side were assessed according to Demrijian’s eight stages, while the Cervical Vertebral Maturation (CVM) Index was adopted for the assessment of skeletal maturity. The one-way analysis of variance (ANOVA) test and the Pearson significance (2-tailed) test were performed for statistical analysis. The results of the Pearson correlation analysis showed a moderate to significant correlation between CA and dental age (DA), as demonstrated by most other studies as well. The Pearson correlation significance analysis demonstrated significant positive correlations between tooth development stages and DA for specific teeth. The one-way ANOVA test showed no significant correlation between CA, DA, and CVM stages. The study suggests that specific teeth seem to show a significant relation with dental age; hence, further research needs to focus on individual tooth development stages. The cervical vertebral maturation method should not be considered for estimating biological maturity according to the present study.
Introduction
A knowledge of the optimum growth and progress patterns in patients is essential to maximize the accomplishment of orthodontic treatment and to recognize abnormal growth trends. 1 Dental age (DA) is of chief concern to the orthodontist while organizing the management of various forms of malocclusions in accordance with maxillo-facial growth. Chronological age (CA) is not precise to define developmental status; yet, CA is vital in the cases of a cadaver in sciences, a scandalous skepticism in jurisdictional practice and fostering for an orphan. The conception of physiological age depends on the amount of development of numerous tissue structures. Evidence advocates various biological ages comprising skeletal age, morphological age, secondary sex character age, as well as DA. 2 Biological age employs many indicators, for instance, structural, sexual, dental, and skeletal developmental deviations that are more specific individually.
Even though a substantial association amid skeletal changes and facial development may be observed during the stretch of puberty, the application of hand-wrist radiographs for the estimation of craniofacial growth was doubtful. Alterations in the form of cervical vertebrae have a connection with CA. 3 The Cervical Vertebrae Maturation (CVM) Index, in origin described by Lamparski, performed on the lateral cephalogram, has become a popular method to assess skeletal maturity.
Several studies have seen the correlations in these methods of age estimation worldwide in previous literature on different populations. A master chart was developed for the Punjabi ethnic population for the age group of 7–15 years for a study sample of 30 subjects (including boys and girls).
In the present study, we assessed the association of dental, skeletal, and CA in the children of the Punjabi ethnic population.
Materials and Methods
Study Design
It was a retrospective study with the sample size of 30 patients (15 boys and 15 girls) in the age group of 7–15 years, who were undergoing fixed orthodontic treatment.
Calculation of Sample Size
The sample size was calculated to be n = 30, using the formula; n = [(Zα + Zβ)/C] 2 + 3, where C = 0.5 *ln[(1 + r)/(1 − r)], Zα is standard normal deviate at type 1 error, α = 0.05, Zβ is standard normal deviate at type 2 error β = 0.20, and r is the correlation coefficient.
Selection Criteria
Inclusion Criteria
Patients of Punjabi origin, that is, patients whose three generations were residing in the Punjab:
Patients without any systemic diseases, those affecting normal growth and development of the bone and teeth (If all the subjects were healthy, that is, they are not suffering from any chronic diseases).
Patients that have no history of previous orthodontic treatment.
Patients with no congenital or acquired malformations of the skeletal or dental origin.
Good quality radiographs; both taken on the same day.
Exclusion Criteria
Patients with history of extracted teeth.
Patients with a history of orthodontic treatment.
If the patients were not healthy or on medication for any chronic diseases.
The medical history was collected from guardians of all eligible subjects.
Data Collection
Chronological age of these patients was assessed by knowing the exact date of birth and the date of radiographs.
All radiographic exposures were carried out at the Department of Oral Medicine and Radiology, Christian Dental College, Ludhiana. All the radiographs, including orthopantomogram (OPG) and lateral cephalograms, were assessed by two examiners, and both the examiners were blinded to the age or date of birth of the subjects at the time of assessment of developmental stage. No more than eight radiographs were analysed by the examiner at any session to prevent the examiner’s fatigue, resulting in errors in measurement.
Dental Age Estimation
Calcification stages of all the seven teeth on right mandibular side were traced in the OPG and were rated following the written criteria and the tooth diagram for each stage (Stages A–H) as given in the New System of Dental Age Assessment 2 by Demrijian, Goldstein and Tanner.
This stage was converted to a score or numerical value as given in the tables (separately for boys and girls).
All these scores of seven individual teeth were summed up, and the maturity score was calculated.
This calculated maturity score was compared with score values given in the Demirjian chart (separate for boys and girls), and the corresponding DA was assessed.
Calculation of Skeletal Age
Cervical vertebrae maturation stages were assessed on lateral cephalogram of the same subjects.
Lower borders of C2, C3, and C4 were checked for the appearance of concavity or flatness and the overall shapes of C3 and C4.
Skeletal age was assessed by correlating the C2, C3, and C4 stages with the explanation and the diagrammatic representation given by Baccetti and McNamara. 3
Data Management
Obtained values of CVM stages and dental maturity specific to the Punjabi ethnic population were recorded in a Microsoft Excel spreadsheet. The investigator was unaware of the birth dates until all figures into a Microsoft Excel spreadsheet.
Statistical Analysis
The results were analysed using Microsoft Excel and the Statistical Package for Software Science (SPSS, Version 20.0). Independent sample t-test was applied for CA and DA of both groups’ boys and girls. The one-way analysis of variance (ANOVA) test was used to compare the CA and DA estimates and to clarify the association between the CA, DA, and CVM stages. The Pearson correlation significance (2-tailed) test was used to test the correlation between the CA and DA estimates, and to compare between the tooth development stages (TDSs) and DA.
Results
Comparison of Chronological Age and Dental Age Between Genders
Analysing CA and DA values would help to determine whether gender has any effect on values of CA or DA. This would further help to find if CA and DA values vary across different genders. Independent sample t-test was performed to determine CA and DA between genders. Mean values of CA (12.59 ± 1.53 in boys and 13.41 ± 1.18 in girls) gave P = .112. Mean values of DA (13.05 ± 2.49 in boys and 11.59 ± 2.38 in girls) gave P = .112. No statistically significant difference was observed in means of CA and DA between genders (Figure 1).
Figure Depicts Comparison of Chronological Age (CA) and Dental Age (DA) Between Genders. Data Were Expressed as Mean ± SD, Analysed by Two-way ANOVA, Followed by Tukey’s Post-hoc Test (n = 15). nsP > .05 Versus DA.

Correlation Between Chronological Age and Cervical Vertebrae Maturation Stages
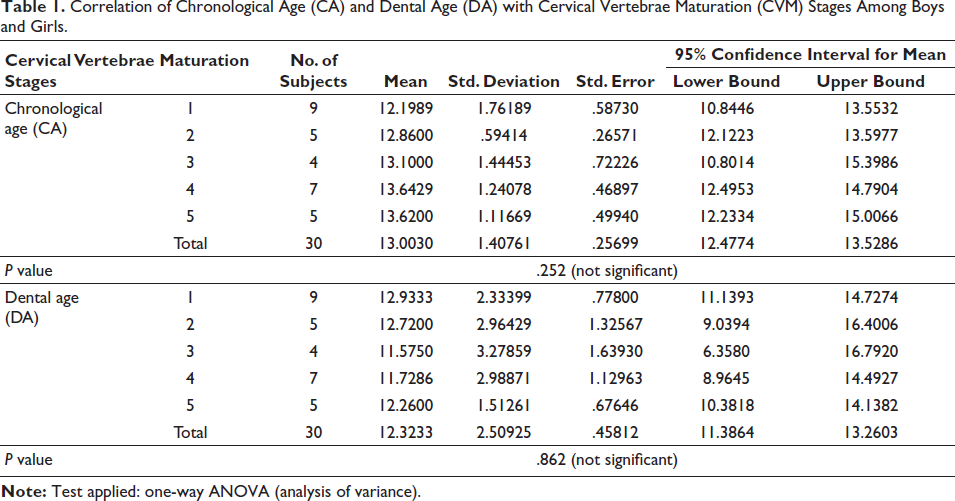
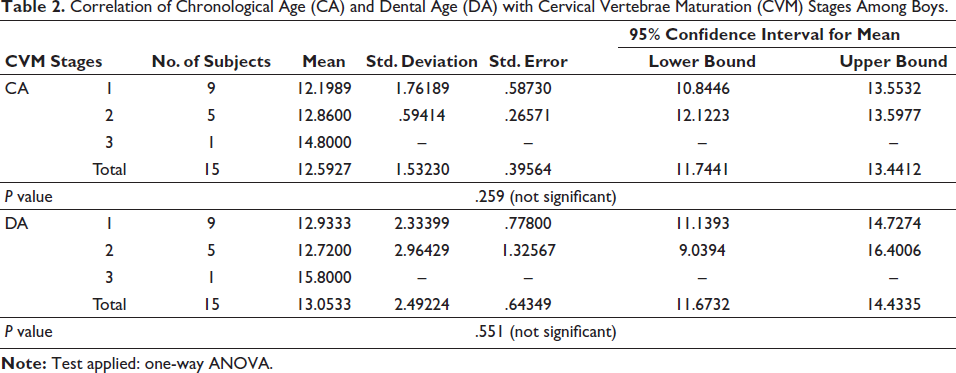
This analysis allows us to compare CA values across different CVM stages. This in turn helps to check the impact of CA on CVM stages. The mean values of CA for each CVM stage were as follows. Stage 1: 12.1989, Stage 2: 12.86, Stage 3: 13.1, Stage 4: 13.6429, and Stage 5: 13.62, with a mean value of 13.00 ± 1.41 (Table 1). For boys, the mean CA values for each CVM stage were as follows. Stage 1: 12.1989, Stage 2: 12.86, and Stage 3: 14.8 (Table 2). For girls, the mean CA values for each CVM stage were as follows. Stage 3: 12.5333, Stage 4: 13.6429, and Stage 5: 13.62 (Table 3).
Correlation of Chronological Age (CA) and Dental Age (DA) with Cervical Vertebrae Maturation (CVM) Stages Among Boys and Girls.
Correlation of Chronological Age (CA) and Dental Age (DA) with Cervical Vertebrae Maturation (CVM) Stages Among Boys.
Correlation of Chronological Age (CA) and Dental Age (DA) with Cervical Vertebrae Maturation (CVM) Stages Among Girls.
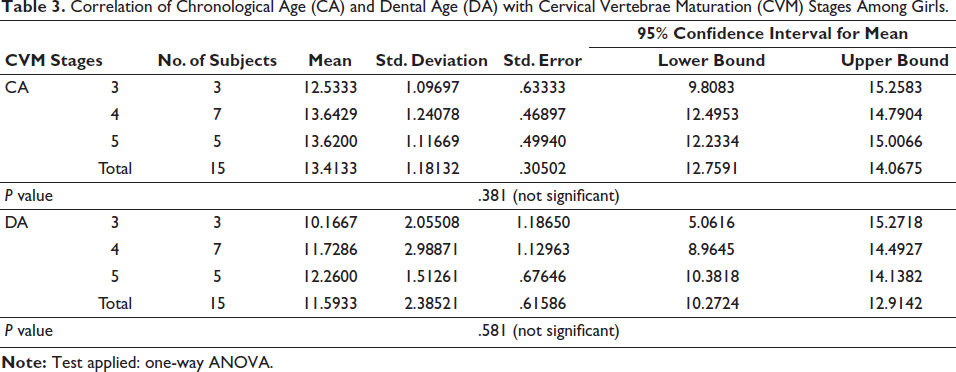
The P values associated with the one-way ANOVA test were .252 (overall), .259 (boys), and .381 (girls), indicating that there was no significant difference in mean CA between the CVM stages.
Correlation Between Dental Age and Cervical Vertebrae Maturation Stages
The correlation between DA and CVM allows us to analyse DA trends across various CVM stages. That further helps to determine the attainment of DA in relation to CVM stages. The mean values of DA for each CVM stage were as follows. Stage 1: 12.9333, Stage 2: 12.72, Stage 3: 11.575, Stage 4: 11.7286, and Stage 5: 12.26, with a mean value of 12.32 ± 2.51 (Table 1). In boys, the mean DA values for each CVM stage were as follows. Stage 1: 12.9333, Stage 2: 12.72, and Stage 3: 15.8 (Table 2). In girls, the mean DA values for each CVM stage were as follows. Stage 3: 10.1667, Stage 4: 11.7286, and Stage 5: 12.26 (Table 3).
The P values associated with the one-way ANOVA test were .862 (overall), .551 (boys), and .581 (girls), indicating no significant difference between the CVM stages.
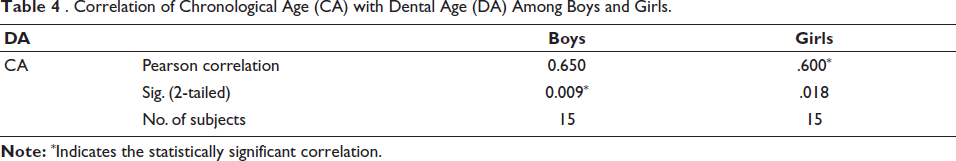
Correlation Between Chronological Age and Dental Age
This analysis permits us to check variations in DA in relation to CA and hence allows us to estimate DA in accordance with CA. The Pearson significance (2-tailed) test yielded the following P values: .009 for boys and .018 for girls (Table 4). The Pearson correlation analysis showed a coefficient of 0.650 for boys and 0.600 for girls, indicating a moderate positive correlation between CA and DA. As CA increases, DA tends to increase and vice versa.
Correlation of Chronological Age (CA) with Dental Age (DA) Among Boys and Girls.
Correlation Between Tooth Development Stages and Dental Age
The Pearson correlation significance (2-tailed) analysis was used to test the relationship between TDS and DA (Table 5). Such an analysis enables us to check the maturation of an individual tooth when compared to the overall DA. Any variation or anomaly in the individual tooth may be determined.
Among boys, the second molar (M2), second premolar (PM2), first premolar (PM1), canine (CN), and central incisor (I1) demonstrated significant positive correlations, whereas the first molar (M1), lateral incisor (I2), and DA did not show statistically significant correlations with DA. M2 showed a strong positive significant relationship (0.680), P = .005. M1 showed a weak positive nonsignificant relationship (0.400), P = .140. PM2 showed a strong positive significant relationship (0.666), P = .007. PM1 showed a positive strong significant relationship (0.654), P = .008. CN showed a strong positive significant association (0.758), P = .001. I2 showed a weak positive nonsignificant relationship (0.408), P = .131. I1 showed a moderately positive significant relationship (0.539), P = .038.
For girls, significant positive correlations were shown by CN and I1, while nonsignificant correlations were shown by M2, PM2, PM1, and I2. M1 could not be included in the analysis due to constant values. M2 exhibited a positive nonsignificant correlation of 0.211 (P = .449). PM2 showed a positive nonsignificant correlation of 0.471 (P = .076). PM1 showed a positive nonsignificant correlation of 0.271 (P = .328). CN showed a strong positive significant correlation of 0.685 (P = .005). I2 showed a positive nonsignificant correlation of 0.451 (P = .092). I1 showed a significant positive correlation of 0.633 (P = .011).
Correlation of Tooth Development Stages with Dental Age (DA) Among Boys and Girls.
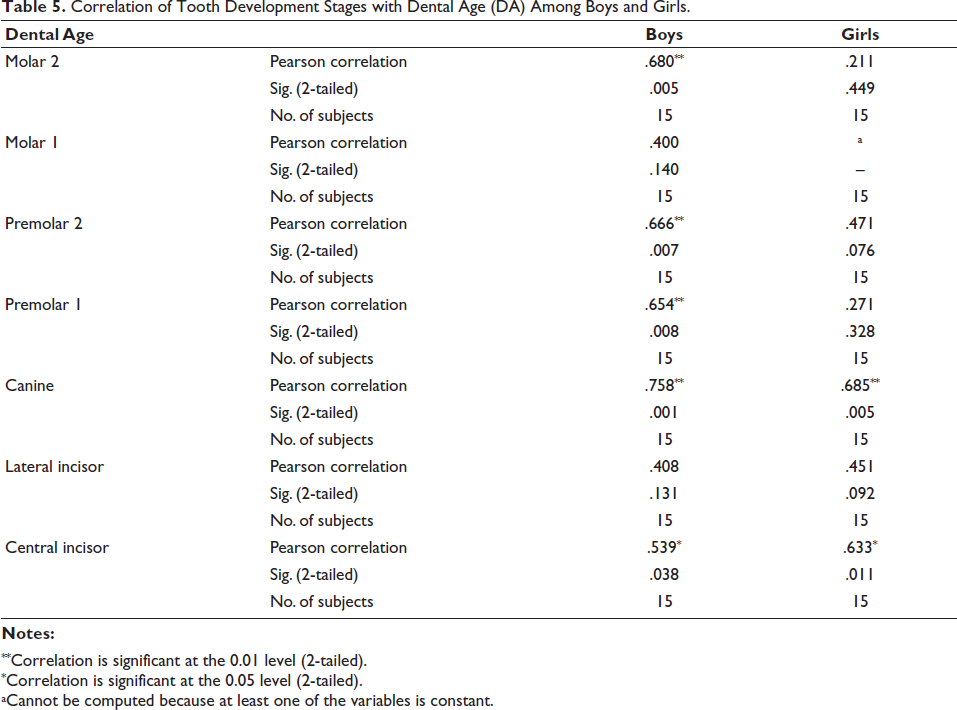
**Correlation is significant at the 0.01 level (2-tailed).
*Correlation is significant at the 0.05 level (2-tailed).
aCannot be computed because at least one of the variables is constant.
Discussion
The orthodontic treatment is significantly dependent on the patient’s growth potential. Therefore, the determination of biological maturity becomes really important in planning orthodontic treatment. The assessment of DA allows us to check for expected dental development in relation to CA or skeletal development of the patient.
The Demirjian method evaluates the dental maturity score correlated with CA using sex-specific tables. This method is widely used due to its high reproducibility and relatively simple application in clinical and research settings. The Baccetti and McNamara skeletal maturity system—a skeletal age assessment method—categorizes skeletal maturation into stages corresponding to different phases of pubertal growth based on peak growth velocity. This method helps in determining the optimal timing for intervention for orthodontics and dentofacial orthopedics. Both staging systems provide valuable insights into an individual’s biological age and growth potential. Therefore, they are considered complementary tools in age estimation and treatment planning.
In the present study, the means of boys and girls were found to be similar, suggesting that gender does not accomplish a noteworthy effect on the CA and DA. The one-way ANOVA test between CA and CVM gave the P value of .259 in boys, .381 in girls, and .252 in the entire sample. The correlation between the DA and CVM gave the P value of .551 in boys, .581 in girls, and .862 in the entire sample. In accordance with the present study in the children of the Punjabi ethnic population, the correlation between the CA and CVM stages, as well as between the DA and CVM stages, is not statistically significant. In contrast, a study performed in the Romanian population 6 showed a significant correlation between the CA and CVM stages. A study in the French population 7 showed moderate statistically significant correlation between the DA and CVM stages (R = 0.383–0.618). A study showed dental development to be positively associated with bimaxillary growth. A Polish study found Spearman’s correlation coefficient (Rho) positive, which indicates that ossification centers’ development advances by age. 10 A report of the Sudanese population showed high significant correlations between CA, DA, and skeletal maturity. 11 A good agreement was shown between the CA and the hand-based skeletal ages. In a study conducted on patients from the National University of Mexico and the Federico Gómez Children’s Hospital, statistically significant differences (P < .05) were found between DA, CA, and skeletal age. 17 Another study also showed the correlation between CVM stages and dental development stages to be highly significant. Optimized norms as applied on the Central European population showed increased precision in the evaluation of DA and skeletal age. 19 Another paper demonstrated the positive correlation between CA and CVM stages in each skeletal jaw relation. The study on the Kannur population of Kerala showed a good correlation between the DA and CA as 0.972 and between the CVM Index and CA as 0.919. 20 The Pearson correlation analysis showed a strong association between CA and DA (r = 0.72), CA and skeletal maturity (r = 0.59), and Skeletal maturity and DA (r = 0.71) in the North Indian population. 21 A systematic review disclosed a moderate to high statistically significant association of the CVM Index with other maturation methods. Similar to our results, the correlation coefficient between the CVM stages and CA came out to be relatively low (r = 0.62) in the Iranian female population. 12 Dental age showed a weak correlation with skeletal age (0.1) in Guatemalan boys. 25 These results indicate that CVM stages may not be reliable indicators of CA or DA. Additional factors need to be considered to advance the accuracy of age estimation approaches in orthodontic practice. These findings highlight the need for further research and the consideration of additional factors to improve age estimation methods in orthodontics.
Our study demonstrated a positive correlation between CA and DA in both boys and girls. The moderate positive association of 0.650 observed in boys and the significant correlation coefficient (P = .009) observed in girls further validate the utility of this method. These results align with the previous research in this area. The DA calculated by the London Atlas (P = .148) represented no variation between estimated DA and CA in the London Atlas. 4 The study by Tunç et al. 5 showed that the calculated DA using Dutch, French-Canadian, and Belgian values stood statistically significantly higher when linked to CA. A comparison of CA and DA gave an overestimation on applying the Demirjian method for both boys (R2 = 20.7%) and girls (R2 = 21.3%) in Portuguese, Spanish children, and adolescents. 8 A positive correlation was observed amid CA and DA (correlation coefficient 0.848; P < .001) in the Spanish pediatric population. 9 Another paper demonstrated a strong correlation amongst age and third-molar development in Turkish male (R2 = 0.61) and female (R2 = 0.63) children in the southwest Eastern Anatolia region. 13 Compared to the Demirjian method, the Cameriere European formula exhibited the greatest precision in DA calculation in Croatian children, following the Haavikko and Willems formula. 14 The standard error rate for the Indian population 15 through the Demirjian method came out to be ±1.17 for male subjects and ±1.6 for female subjects for the mandibular arch. The DA estimated from the digital OPG using Demirjian’s method and Willem’s method had revealed great accuracy in the children of Faridabad. 16 The study on the Dakshina Kannada population of South India showed the correlation coefficient values of 0.71 in males and 0.82 in females, showing a significant correlation between DA and CA. 18 A study performed on the Brazilian population showed overrating of Demirjian’s method, which remained statistically significant (P < .001). 22 The Egyptian-specific formula reduced the lag among CA and DA; hence, a virtual estimated age was calculated. 23 Machine learning systems based on Cameriere’s maturation stages gave additional precise results in approximating DA, whereas in Mexican patients, 17 a very weak association was found between CA and DA (R2 = .63). The malnourished cohorts of low socioeconomic status Mayas and Ladinos were significantly deferred in dental maturation when equated to the well-fed Ladino subjects. 25
From the results of the present study, the M2, PM2, PM1, CN, and I1 showed a strong relation with DA among the boys. The CN and I1 showed a strong relation with DA among girls. The results of the Portuguese and Spanish population using R2 coefficient showed the most significant teeth to be the CN, PM2, and M2. 8 A study amid calcification stages of mandibular CN and skeletal maturity showed significant correlation coefficients of 0.895 for the male and 0.701 for the female population. A method was developed to estimate the accurate DA for modern Japanese children and adolescents. 24
These findings support the potential use of DA estimation as an adjunctive method for age assessment. The significant correlations observed for certain teeth support the fact that some TDSs can serve as reliable markers for assessing DA. Teeth seem to be a valuable development guide since they are usually not modified by exogenous influences, including disease. However, not all TDSs showed significant correlations, which indicates that relying solely on tooth development may not provide accurate estimates of DA. 26 Factors such as dental development variations and individual differences can influence the accuracy of DA estimation. Note that DA estimation should be applied as a supplementary tool rather than a stand-alone method 27 for age assessment. Dental age combined with other age assessment techniques, such as skeletal age assessment 28 or anthropological methods, would provide a more comprehensive and accurate estimation of an individual’s age. However, further research with larger and more diverse samples on individual tooth development assessment is necessary to validate these results and establish standardized protocols for DA estimation in clinical and forensic settings.
Conclusion
Dental development assessed by Demirjian’s method may be used for assessing biological maturity, though further research on individual tooth stages may be necessary. On the other hand, CVM stages may not be relied on for assessing skeletal maturity.
Implications
It will be a practical application of methods that have been taught to the students in theory.
Easy for the student to determine and correlate the age of the patients.
The fallouts will be of help for diagnosing, and for planning treatment for orthodontic, pediatric patients and forensic dentistry.
Footnotes
Data Availability Statement
Data have been provided within the article. Further queries may be submitted to the corresponding author.
Declaration of Conflict of Interests
The authors declare no potential conflicts of interest with respect to the research, authorship, and/or publication of this article.
Ethical Approval
Ethical approval was obtained from the Ethical and Research Committee of the Institute, Min no. CDC/ERC/2022/33.
Funding
The authors received no financial support for the research, authorship, and/or publication of this article.
Informed Consent
Consent was obtained from patients’ guardians (since the population under study is less than 18 years of age).