
Abstract
Stature estimation has an important role in establishing the personal identity of unknown human remains. Establishing the identity of an individual from mutilated, decomposed and amputated body fragments is a challenging task. Various body parts may be used for the estimation of stature. In forensic practice, when mutilated remains are brought for examination, stature estimation is important for identification purposes. In the present study on 110 indigenous Meitei subjects, the percutaneous length of the ulna was studied to correlate with the stature. A positive correlation was observed between stature and percutaneous length of the ulna, and there was no statistically significant difference between the right and left ulna. The correlation coefficient (r) for both sexes together is 0.7335 and the regression equation is Y = 65.42911 + 3.773632X with a P value of <.01. For males, the r is 0.5814 and the regression equation is Y = 110.262 + 2.206518X with a P < .001. For females, the r is 0.3143 and the regression equation is Y = 123.8984 + 1.338234X with a P < .01. The simple linear regression equations derived from the study may be used for the estimation of height from the ulna in forensic practice in this part of the world, especially in mutilated remains.
Introduction
Stature is a basic and interesting aspect of a person’s identity. While everyone appreciates a tall stature, history does not lack short-statured personalities who are actually very famous. Napoleon Bonaparte and Charlie Chaplin are striking examples. It also has an important role in establishing the personal identity of unknown human remains. 1 Measurement of the height or stature of a living, walking individual is easy. However, in decomposed and mutilated remains and even in frail and debilitated bedridden patients, determination of stature becomes a challenging task. Establishing the identity of an individual from mutilated, decomposed and amputated body fragments has become important in recent times, due to natural disasters (such as landslides, earthquakes, cyclones and floods) and man-made disasters (such as riot deaths, ethnic clashes, acts of terrorism, bomb blasts, wars, etc.)
Different equations for estimation stature have been established for Whites and Blacks, and males and females. The equations that were derived by Trotter and Gleser in the early 1950s for Americans were being continuously revised using data from different sources. 2
Pearson estimated the stature from long bones by formulating regression equations. He also found that these formulae are population-specific and should not be applied to individuals of different population groups. Therefore, regression formulae need to be formulated for each specific population. 3 The present study has been designed to formulate a regression formula for the indigenous Meitei population (an ethnic group in North East India) to establish stature from the percutaneous length of the ulna.
Materials and Methods
The present study was a cross-sectional study done on a sample of 110 indigenous Meitei subjects (an indigenous Meitei is one who is preceding three generations both on the mother’s and father’s sides are Meiteis) with the age group of 21–25 years. The study was conducted in the Forensic Medicine & Toxicology Department of a tertiary care teaching institute in Northeast India. The subjects included students of the institute and subjects brought to the Department of Forensic Medicine and Toxicology for medico-legal works. A standard stadiometer was used for measuring the height, and a pair of spreading callipers for measuring the percutaneous length of the ulna.
Considering a dropout rate of 5%, a total of 55 males and 55 females, aged 21–25 years were studied, based on a previous study. 4
The sample size is calculated from the following equation:
Total Sample size (n) = [(Zα + Zβ)/c] 2 + 3, therefore (n) equals to 50.
Zα = 1.960 (95% confidence level)
Zβ = 1.282 (90% power)
c = 0.5 × log [(1 + r)/(1– r)] equals to 0.4722
r = 0.44 (from the study done by Pandey A et al. 4 )
Written informed consent was obtained from each study participant.
The standing height (stature) of the subject was measured in standing position, without shoes, on a standard stadiometer with both feet in close contact with each other with the trunk straight along the vertical board, and the head adjusted in Frankfurt-Horizontal plane (eye-ear plane). The measurement was taken in centimetres by bringing the horizontal sliding bar to the vertex.
For measuring the percutaneous ulnar length (PCUL) of the right ulna, the study subject was asked to place the elbow in flexion and the palm spread over the opposite shoulder to relax the soft tissues and make the bony landmarks prominent. Then, two points were marked by a skin-marking pencil. The apex of the olecranon was marked as the upper point and the distal point of the styloid process as the lower point and the distance between them was measured with the help of spreading callipers to determine the PCUL. All the measurements were taken by the same investigator with the same instrument to avoid any technical and/or inter-observer error and to maintain reproducibility. The measurements were taken at a fixed time (between 12:00 and 14:00) to avoid diurnal variation.
Data entry was done using Windows-based SPSS version 21.0 (Armonk NY: IBM Corp). Descriptive statistics, including the mean, standard deviation, minimum, maximum, percentage and frequency, were calculated. Analysis of differences in stature and ulnar length between male and female subjects was done by unpaired t-test. Karl Pearson’s correlation coefficients (r) were derived between ulnar length and stature, and standard error (SE) and coefficient of determination (R 2 ) were calculated. Single linear regressions were derived to estimate stature from the ulnar length. A P value of .05 or less was considered significant. The data obtained was compared with other similar studies.
Results
Altogether, 55 male and 55 female ethnic Meitei subjects in the age group of 21–25 years were studied. The observations are analysed separately for both right and left ulna in each sex, on all subjects and results are tabulated.
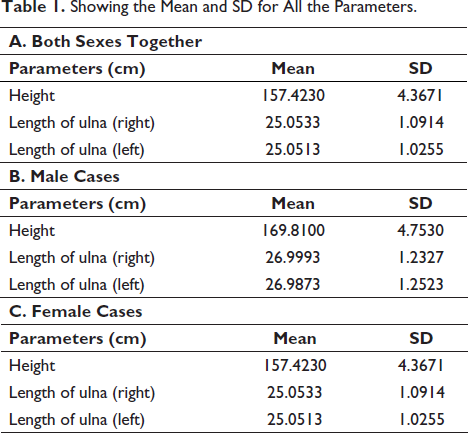
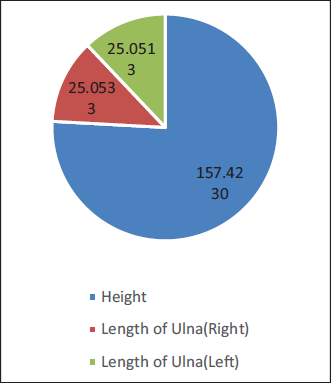
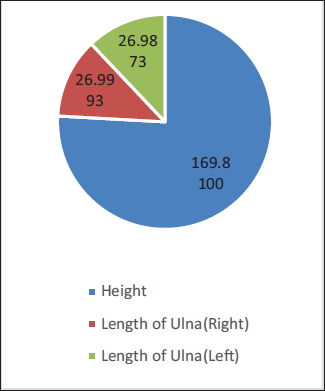
Table 1(A) and Figure 1 show the mean height and ulnar length for both sexes. The mean height is 157.4230 cm with a standard deviation of ±4.3671 cm. The mean length of the right ulna is 25.0533 cm with a standard deviation of ±1.0914 cm. The mean length of the left ulna is 25.0513 cm with a standard deviation of ±1.0255 cm. The mean height of males is 169.8100 cm with a standard deviation of ±4.7530 cm and the mean length of the right ulna is 26.9993 cm with a standard deviation of ±1.2327 and the length of the left ulna is 26.9873 with a standard deviation of ±1.2523 cm (Table 1(B) and Figure 2). The mean height of females is 157.4230 cm with a standard deviation of ±4.3671 cm and the mean length of the right ulna is 25.0533 cm with a standard deviation of ±1.0914 and the left ulna is 25.0513 with a standard deviation of ±1.0255 cm (Table 1(C) and Figure 3).
Showing the Mean and SD for All the Parameters.
Showing Mean Height and Lengths of Right and Left Ulna for Both Sexes Together.
Showing Mean Height and Lengths of Right and Left Ulna for Males.
Showing Mean Height and Lengths of Right and Left Ulna for Females.
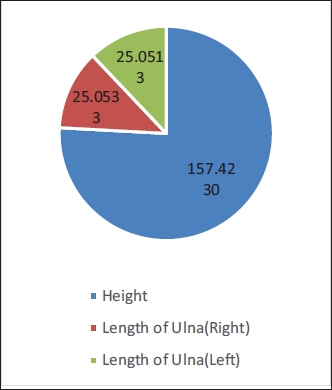
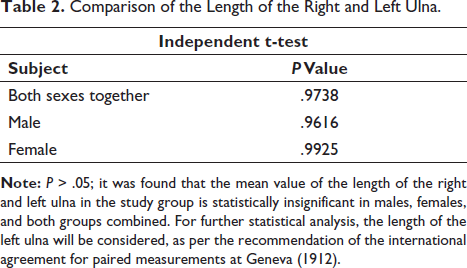
Table 2 shows the comparison of the length of the right and left ulna. The P value for both sexes together is 0.9738, for males, it is 0.9616 and for females, it is 0.9925. Since P > .٠٥, it was found that the difference in length of the right and left ulna is statistically insignificant in males, females and both sexes together. For further statistical analysis, the length of the left ulna was considered, as per the recommendation of the International Agreement for Paired Measurement at Geneva (1912). 5
Comparison of the Length of the Right and Left Ulna.
Pearson’s r was used to examine the relationship between the length of the ulna and height. The r between total height and length of the ulna was found to be statistically significant and positive in both males and females.
Table 3 shows the correlation between height and ulnar length which are positive and statistically highly significant (P< .01.), that is, if the length of the ulna increases or decreases, the height of the subject also increases or decreases and vice versa. Regression analysis was performed for the estimation of stature using the length of the ulna as the independent variable. Table 3 also shows the regression equation for height with length of ulna in males, females and both sexes together. The r for both sexes together is 0.7335 and the regression equation is Y = 65.42911 + 3.773632X with a P value of <.001.
Regression Equation for Height with Length of the Ulna in Males, Females and Both Sexes Together.
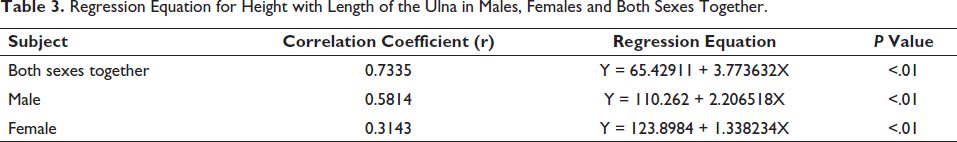
For males, the r is 0.5814 and the regression equation is Y = 110.262 + 2.206518X with a P< .01.
For females, the r is 0.3143 and the regression equation is Y = 123.8984 + 1.338234X with a P< .01.
Y = Height/Stature (cm) X = Length of ulna (cm). 65.42911, 110.262 and 123.8984 are intercepts (constants) for both sexes together, male and female, respectively.
From the above table, it is seen that the regression formula within a region also varies between the male and female populations of that region.
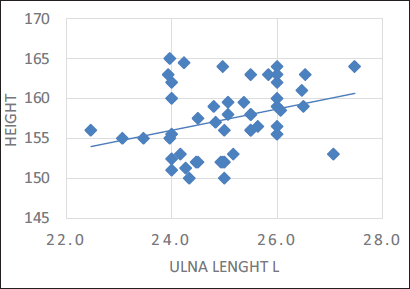
Figure 4 shows a positive correlation between the length of the ulna on the X-axis and the height of subjects on the Y-axis, indicating that an increase in the length of the ulna leads to an increase in the total height of both subjects
Correlation of Height with Length of Ulna in Both Sexes Together.
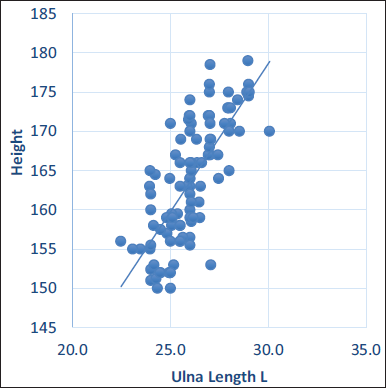
Figure 5 shows a positive correlation between the length of the ulna on the X-axis and the height of female subjects on the Y-axis, indicating that an increase in the length of the ulna leads to an increase in the total height of a male subject.
Correlation of Male Height with Length of Ulna.
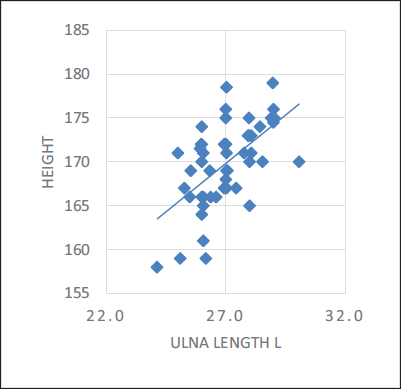
Figure 6 shows a positive correlation between the length of the ulna on the X-axis and the height of female subjects on the Y-axis, indicating that an increase in the length of the ulna leads to an increase in the total height of the female subject.
Correlation of Height with Length of Ulna in Females.
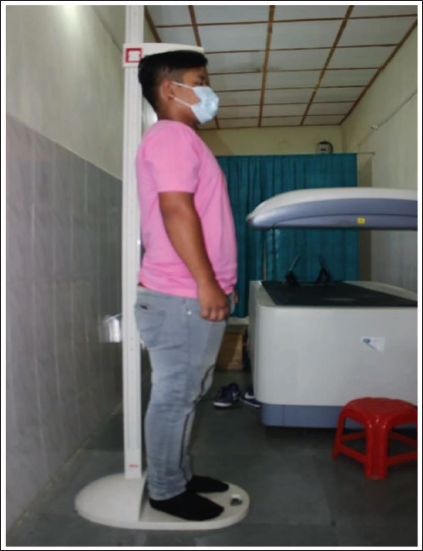
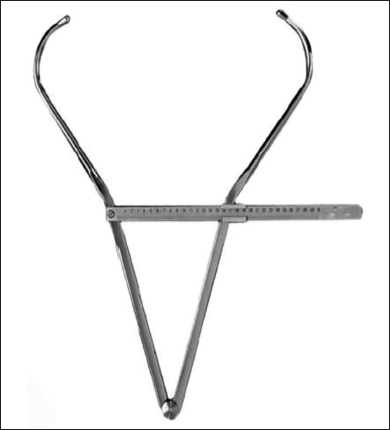
Figures 7, 8 and 9 show the procedure of taking the measurements and the equipment used.
Taking Standing Height with a Stadiometer.
Procedure for Taking the Percutaneous Ulnar Length.

Spreading Callipers.
Discussion
Stature is an essential feature of identification. In mass disasters, the whole body is not always available. Therefore, the estimation of stature from mutilated body parts assumes a role of paramount importance. Clinically, it has a role in the calculation of body mass index, which is used for the assessment of nutrition. However, its measurement is not always practical in mutilated and decomposed bodies and in old or frail bedridden patients who cannot stand or those who are suffering from vertebral column deformities. In such cases, formulae based on the ulnar length provide an alternative stature predictor. 6
Trotter and Gleser affirmed the requirement of different regression equations among different races after studying different races for the relationship between lengths of long bones and stature. 7 In addition to ethnic differences, secular trends can also influence body proportions. This fact has been reinforced by many studies all over the world. 2
A study for the estimation of stature from the upper limb measurements in the Turkish population developed regression formulae to estimate stature. 8 The results of this study indicated a positive correlation between upper limb measurements and stature, which was highest for ulnar length. Thummar B et al. 9 derived a regression equation for the estimation of stature from the length of the right and left ulna in both males and females. Allbrook 10 also derived regression formulae for the estimation of stature from the length of ulna in British and East African males and formulated that stature = 88.94 + 3.06 (ulna length) ± 4.4 (SE). Ilayperumal 11 derived regression equations for stature estimation from the length of the ulna in both males and females in the Sri Lankan population.
The need to identify the age group, race and area a particular person belongs to before applying the regression equation particular to that area and to that age group to identify the stature of the individual was stressed by Laxmi et al. 12
The present study deals with observations on the correlation of standing height with the length of the ulna in subjects between 21 and 25 years of age. We chose the ulna because, compared to other bones of the upper limb, it is easier to get a more precise measurement of ulnar length in living subjects. The ulna has easily identifiable surface landmarks, making the measurement possible. 3
The relationship between stature and the length of long bones is also influenced by sex among other things. 1 Thus, the need for a sex-specific stature estimation formula is proved beyond doubt. 11
The average height of adult males within a population is significantly higher than that of adult females. 13 The result obtained in this study agrees with the above statement.
In the present study, there was no statistical difference between the length of right and left ulna within each gender. The regression formulae for the estimation of stature by left ulna were derived, as the results from our study samples failed to prove that the differences in length between the right and left bones are significant.
The correlation coefficient (r) between the total height and ulna length was found to be positive, indicating a strong relationship between the two parameters. The positive correlation suggests if the length of the ulna increases or decreases, the height of the subject also increases or decreases and vice versa.
There has been a study in an Indo-Mauritian population to estimate the stature from PCUL, hand length and hand breadth and the regression models were formulated. 14 The results indicated that the percutaneous length of the ulna (forearm length) and hand length can be efficiently used for stature dimension.
Another study identified a meaningful relation between the stature and upper limb dimensions (P< .01.) in the Iranian population. 15 In the present study, for both sexes together, r = 0.7335 and the regression equation is Y = 65.42911 + 3.773632X with a P value of <.001.
For males, r = 0.5814 and the regression equation is Y = 110.262 + 2.206518X with a P< .01. For females, r = 0.3143 and the regression equation is Y = 123.8984 + 1.338234X with a P< .01., where Y = Height/Stature (cm), X = Length of ulna (cm) and 65.42911, 110.262, 123.8984 are intercepts (constants) for both sexes together, male and female, respectively.
Though a few similar studies have been done in the region, these were on other tribes16, 17 and hence, the present study has been done to establish regression formulae for Meitei subjects.
More regression formulae for more ethnic groups will make identification much easier in the future.
Conclusion
In the present study, an attempt was made to document a relationship between the ulna and height of indigenous Meitei subjects in the age group of 21–25 years. A positive correlation was found between stature and the length of the ulna, with no statistically significant difference between the right and left ulna. The derived simple linear regression equations can be used for estimating height from the ulna and vice versa. Thus, the data of this study may be of practical use in medico-legal investigations. Furthermore, in times of crisis, such as communal riots, the regression formulae derived here will be useful in a preliminary identification of the victims. Although stature cannot establish the complete identity of an individual, it can definitely save a lot of work in building up the basic sketch of a missing person or a suspect in a crime, and even in ruling out certain persons as suspects in a particular offence. With the advancement in imaging techniques, computerisation of personal data and fast internet connectivity, the regression formulae of specific population groups, like those in the present study, can be computerised. In the future, personal identification may be achieved in a matter of a few seconds, even in this part of the country.
Footnotes
Declaration of Conflicting Interests
The authors declared no potential conflicts of interest with respect to the research, authorship and/or publication of this article.
Ethical Approval
Ethical clearance was taken for this study.
Funding
The authors received no financial support for the research, authorship and/or publication of this article.
Informed Consent
The informed consent has been obtained from the participants for the study.