
Abstract
Shifts in property markets are closely tied to changes in investment actors’ relations, shaped by wider economic and regulatory processes. However, the existing literature generally neglects the role of actors’ behaviour and agency within property market shifts, and how market shifts affect cities. In response, we establish a framework that systematically unpacks the role, characteristics and behaviour of property investors in investment market shifts within urban development. We consider market shifts as modifications to established economic and regulatory processes and argue that a multidimensional approach is required to understand property investors and their role within property investment markets that shapes the urban built environment. Our main contribution is a novel approach and methodology to read changing property investor landscapes by linking wider economic and regulatory changes to investment actors and their investment strategies. Empirically, we focus on Amsterdam’s changing investor landscape over the last 15 years. We investigate how crises, represented by far-reaching institutional disruptions of economic and regulatory systems, relate to Amsterdam’s landscape of property investors. Correspondingly, we define three distinct periods of analysis, based on transaction volumes and regulatory interventions at national and local levels: the pre-global financial crisis (GFC) period from 2005 to 2008, the post-GFC recovery period from 2009 to 2013, and the pre-Covid19 boom period from 2014 to 2020. We reveal how Amsterdam’s investor landscape changed over the course of these periods through a mixed methods analysis, including quantitative investment transaction analysis, mapping, and in-depth interviews with investors. We ultimately suggest that reading property market shifts through multidimensional characteristics would enable more targeted policy solutions, moving away from empirically ill-supported stereotypes of property actor behaviours.
Introduction
Considering property investment markets as social constructs helps elucidate that shifts within property markets are closely tied to investment actors and their relations, shaped by wider economic and regulatory processes (Guy and Henneberry, 2000). However, in the existing literature, property investment actors generally remain in the background when explaining wider economic and regulatory changes, which we define as ‘market shifts’. In the case of crises, representing far-reaching institutional disruptions, these market shifts become more pronounced. With critical scholars increasingly studying the intersection of finance and real estate affecting cities ‘through regulatory and socio-technical changes’ (Aalbers, 2019: 376), understanding where and how capital flows into the urban built environment beyond generalised and ad-hoc characterisations is of utmost importance. Scholars captured property market shifts either through larger structural alterations in market deregulation (Crotty, 2009; Oatley and Petrova, 2020), financialisation (Aalbers, 2009; Goldman, 2020; O’Callaghan and McGuirk, 2020), or shifting governmentalities (Gottlieb and Frederiksen, 2020). Alternatively, market shifts are explained on the basis of trends and emerging asset classes such as real estate investment trusts (REITs), hedge funds, derivatives, and other calculative market devices (Fields, 2018; García-Lamarca, 2020; Lagna, 2016; Mills et al., 2019; van Loon and Aalbers, 2017). Market volatility and institutional disruptions like financial crises tend to be attributed to the intrinsic cyclical nature of property markets (Ankenbrand et al., 2020; Fields, 2017; Jadevicius et al., 2017), and the failure of governments to fix them through institutional adjustments (Furton and Martin, 2019; Hassel et al., 2019; Tarullo, 2019).
We develop an alternative actor-centred framework to systematically unpack the effects of property investment market shifts on urban built environments. Thus, our main target is not to analyse crises in and of themselves, but to link related market shifts to investors’ profiles and behaviours. Property investment is a fast-paced industry, with new actors emerging and established actors adapting to novel circumstances and generating product innovations (Waldron, 2018). Nonetheless, much of the critical urban studies, geography and planning literature struggles to recognise property investor diversities. Investors are either treated as a homogenous group or generalised based on single characteristics (Özogul and Taşan-Kok, 2020). We argue that an alternative, multidimensional approach is needed for a more comprehensive understanding of property investors and their role in property market shifts affecting urban built environments.
The main contribution of this article is this novel approach to read changing investor landscapes through a multidimensional methodology, which integrates wider economic and regulatory changes in the understanding of investors. Crisis periods provide an excellent laboratory to analyse how investor landscapes change in relation to profound market shifts, against the context of changing economic and regulatory climates. Our approach moves away from property cycle metaphors that perceive property market shifts as purely economic processes (Weber, 2016). Cyclical perspectives risk overshadowing the dynamics of property market shifts (Weber, 2016). While crises have tangible effects on property investment markets, they do not only relate to property values. In this paper, we demonstrate that crises are moments of disruption of established institutional relationships that dynamically reconfigure urban investor landscapes. Investor landscapes, in our understanding, contain the assemblages of actors (diverse property investors) and their characteristics (operational, financial and organisational), as well as their locational and strategic behaviour in cities that are embedded in wider economic and regulatory processes. Thus, they contain collections of actors and their dynamic behaviours within a specific urban investment market.
Empirically, we focus on Amsterdam’s changing landscape of property investors over the last 15 years. As the capital city and financial centre of the Netherlands, Amsterdam is experiencing steady population growth and attracts considerable (foreign) investments (Deloitte, 2020). At the same time, the city’s property investment market is strongly shaped by regulations and policy directions as there remains limited land for new developments (Taşan-Kok and Özogul, 2021). Our main finding is that to understand investor behaviour, different dimensions of investor characteristics and behaviour should be analysed concurrently; investors’ scale of operation, ownership composition, type of capital, and locational and strategic behaviour help configure investment decisions in relation to property market shifts. Through a mixed methods analysis, including quantitative investment transaction analysis, mapping, and in-depth interviews with investors, we explore these changes in Amsterdam’s investor landscape over the course of 15 years.
The paper begins by establishing the link between property investment markets, crises as institutional disruptions, and urban development, presenting our actor-centred analytical framework to examine property market shifts through investor landscapes. Then, we elaborate on our data collection and methods of analysis, followed by an overview of the three periods that we define in economic and regulatory terms influencing property investment in Amsterdam: the pre- global financial crisis (GFC) period from 2005 to 2008, the post-GFC recovery period from 2009 to 2013, and the pre-Covid19 boom period from 2014 to 2020. Following this, we link the three periods to observable changes across four dimensions of investors’ characteristics, which stem from an interdisciplinary literature review and our contention to add locational behaviour to investor analyses. On the basis of applying our framework to the Amsterdam case, we illustrate how the four dimensions offer different insights when analysed individually or in combination. The paper ends with a discussion and conclusion, highlighting the importance of fine-grained, multidimensional analyses to capture property investment market dynamics and the effects crises have on urban actor landscapes.
An actor-centred approach to urban property investment market shifts
It has long been argued that financial crises are urban crises (Harvey, 2012). With the growing dominance of financial actors in urban development (Aalbers, 2019), we know that financial capital materialises in cities through real estate construction, development and investment (Theurillat et al., 2015). As Coiacetto and Bryant (2014: 305) argue, ‘The relationship between capital and development and the outcomes for the built environment are in a restless continual evolution.’ In today’s property markets, capital moves swiftly, for instance, in the form of investment vehicles (Waldron, 2018). Investors not only hope for returns of real property investments, but also for ‘capital gains derived from stock-market fluctuations’ (Theurillat et al., 2015: 1416). This ‘hyperactivity’ of capital means that national and even local crises can have global repercussions (Sassen, 2011). In recent years, scholars – particularly within the framework of financialisation – have provided mounting and valuable evidence on the influence of finance on urban development. Thereby, the GFC is often considered emblematic of the volatile integration of finance and property, specifically (Byrne, 2016). Yet, we see a major shortcoming in the existing literature: the neglect of actor-centred perspectives and insufficient knowledge of actors’ behaviour and agency in property investment market shifts, and its effects on cities.
In classic property scholarship, property investment markets are said to follow dynamics with different periodicity (Barras, 1994), parallel to (or followed by) economic, political, social or environmental changes. Property market cycles are also prominently discussed in planning and urban studies literature (Ryan-Collins, 2019; Salvati, 2019; Sorensen, 2018). However, these property cycle imaginaries, indicating temporal ups and downs of investments, are increasingly considered inadequate to explain market shifts (Barras, 1994; Hoyt, 2000; Jim, 1996; Weber, 2016). The lack of attention toward property market actors is central to scholars’ critiques. Weber (2016: 588) in particular emphasises the ‘performative nature of cycles by focusing on the networks of actors – brokers, appraisers, investors, and planners – that move capital through the built environment’. These actors, she argues, play an indispensable role in channelling capital into the built environment as they enable its circulation, attach (temporary) meaning to buildings and submarkets, and alter the course of investments (Weber, 2016). Thus, studying property industry actors in-depth moves away from the ‘objective’ ideal of classic microeconomics (Alexander, 2014). Instead, this approach can be placed within the growing body of literature applying relational approaches to generate novel insights into property dynamics (Adams et al., 2012; Adams and Tiesdell, 2012; Raco et al., 2019).
Despite the growth of relational analyses, in-depth discussion on the roles and positions of investors as property market actors remains limited in urban studies, planning and geography scholarship (Clark et al., 2010; Raco et al., 2019; Theurillat et al., 2015; Waldron, 2018). A systematic literature review on residential investor types revealed that investors in these disciplines are rarely thoroughly described, that categorisations and theorisations of investor types are scarce, and that generalisations are often made on the basis of simple divisions such as large and small, or local and global, investors (Özogul and Taşan-Kok, 2020). More technical differentiations on the type of investment finance, ownership composition and investment strategies can be found in the field of economics (Özogul and Taşan-Kok, 2020). Even financialisation literature tends to treat investors as a uniform actor group purely following ‘economic calculations and rationalities’ (Raco et al., 2019: 1069). Therefore, we propose to create a link between shifts in property investment markets and urban development: a framework is needed that takes into account investors’ multiple characteristics and links them to their locational and strategic investment behaviour in cities.
To create such a framework, we start from the premise that investors are complex and multifaceted entities that may exhibit diverse behaviours, which can be far from standardised or calculable. The first three dimensions that we selected for our framework to define an investor (see Figure 1 legend) stem from the extensive literature review that we conducted elsewhere (Özogul and Taşan-Kok, 2020). In this systematic review, we methodically searched for residential investor types and differentiations addressed in existing urban studies, urban and regional planning, geography, public administration, sociology and economics literature to counter the limited in-depth scholarly engagement with investors from an interdisciplinary perspective. While only 18% of the 642 articles that we found mentioning residential investors or investment in their title or abstract provided a more detailed description of investors, it allowed us to develop a preliminary framework of investor characteristics that scholars from several disciplines deem important (Özogul and Taşan-Kok, 2020). First, the investor’s scale of operation (i) indicates the extent to which an investor is headquartered close to the investment location. The differentiation between scales ranging from local to international matters, especially with regards to potentially divergent regulatory frameworks that shape investment activities. Second, the investor’s capital type (ii) refers to the dominant capital formation of property investment companies. As Coiacetto and Bryant (2014) showcase on the basis of debt and equity, the type of investment finance has repercussions on the urban built environment as it can be connected to investment strategies and risk aversion. Third, ownership composition refers to the organisational characteristics of the investment company or the investment fund. Existing literature outside of the wider urban studies links ownership composition to a variety of behaviours, such as opportunistic behaviour, growth pattern, debt structure, risk aversion strategy, institutional culture, and so forth (Brunnermeier and Julliard, 2008; Chernobai and Hossain, 2012; Goldstein, 2018; Mills et al., 2019). As our previous systematic literature review revealed, economics literature, and particularly real estate economics and finance articles, emphasise investment behaviour, while urban studies and geography literature largely neglects this aspect, and it was entirely absent in urban and regional planning articles (Özogul and Taşan-Kok, 2020). Even though we focused exclusively on residential investors in this literature review, the results are telling about wider scholarly engagement with investors.
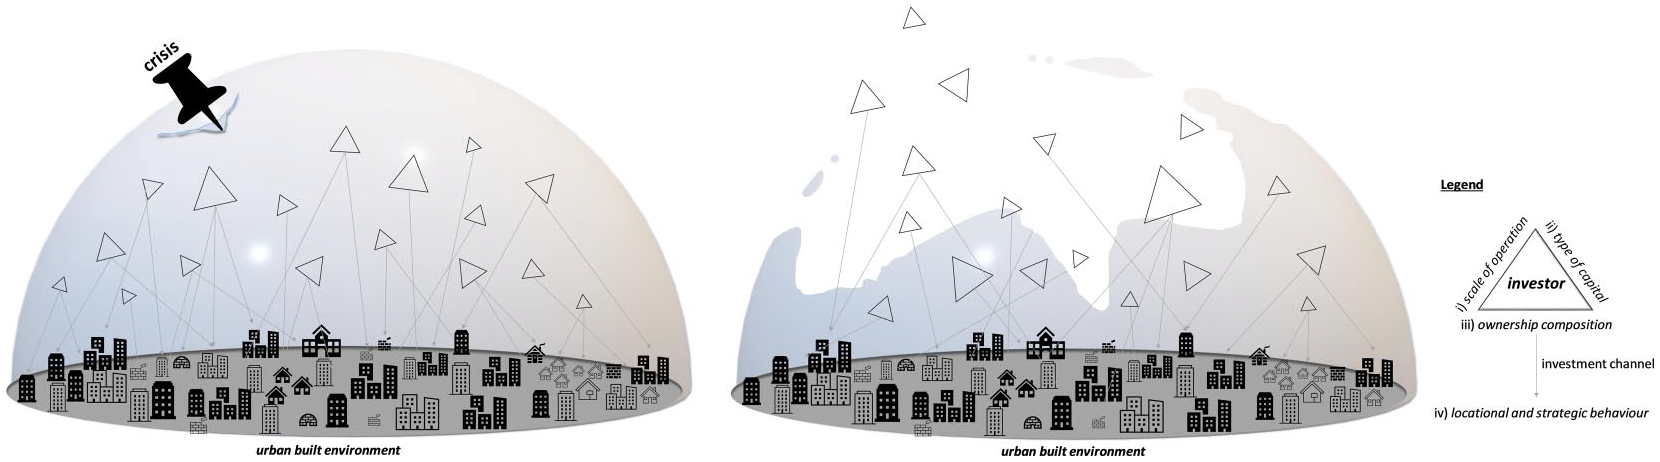
Landscapes of property investors channeling capital into the urban built environment before and after a crisis.
Thus, as a fourth dimension, we included an investor’s locational and strategic behaviour (iv). From an urban development perspective, location matters even though some authors argue that property should be considered as an asset class with a performance relative to the other assets in the financial markets such as equities (shares), bonds (fixed-interest stocks), gilts (government bonds) and other financial derivatives (Berry and McGreal, 1995). Ward (2020) highlights the contradiction of the mobility of capital and its temporal fixity in space, arguing that, through financial engineering, mobile investment products are created from otherwise spatially fixed locations. Nonetheless, we see property as a unique category that at least temporarily fixes capital in urban space. However, it does not only matter into which locations capital is channelled, but also how. Clark et al. (2010) differentiate between sophisticated investors with a long-term horizon, opportunistic investors that gamble with a short-term horizon, and myopic investors that short-sightedly follow dominant property market cycles. Thus, with the addition of strategic behaviour, we aim to capture strategies such as buy and hold. Similarly, fast and repeated property transactions provide clues about an investor’s consideration of property as a more location-independent, tradeable asset.
Combined, individual property investors form what we call a ‘property investor landscape’. An investor landscape consists of investors, and their characteristics and behaviour in a specific investment market (Figure 1). These investors are operating within an established system of institutional relations, economic processes and regulations. Crises disrupt this established system, visualised in Figure 1 by a bursting bubble. When a crisis shakes up and reconfigures existing relations, actors may transform their actions, behaviours and investment objects, and new actors may emerge in the landscape (Figure 1). In the analysis that follows, we illustrate the applicability of this framework in Amsterdam’s property investment market, concentrating on three periods representing market shifts surrounding the GFC and the current coronavirus pandemic. Furthermore, we showcase how a change in the investor landscape impacts the urban built environment.
Methodology
The paper combines quantitative and qualitative analyses. The quantitative analysis is based on data retrieved from Real Capital Analytics Inc. (RCA), a data and analytics firm that provides detailed insight on deals, players and trends in real estate investment markets. RCA meticulously gathers and reviews commercial transactions larger than 5 million Euros, or than ten units, creating one of the most comprehensive commercial property transactions databases available. Via the database’s ‘investor universe’, we had access to more than 200,000 investor profiles, including their holdings and transaction history, capital and ownership information, and investment locations. Our geographical focus lies in Amsterdam, and we selected the boundaries of the ‘Amsterdam, Amsterdam/Randstad’ market offered by RCA, as this is commonly used by property industry actors themselves. The selected area largely overlaps with the administrative boundaries of the Metropolitan Region Amsterdam (Figure 2). We then downloaded information from RCA on all investors active in this market, in all sectors of the commercial (office, industrial, retail), hospitality (hotels and other hospitality) and multi-family (apartments, senior-housing and care, res condo) sectors, as well as into development sites and land, from 2005 until March 2020.
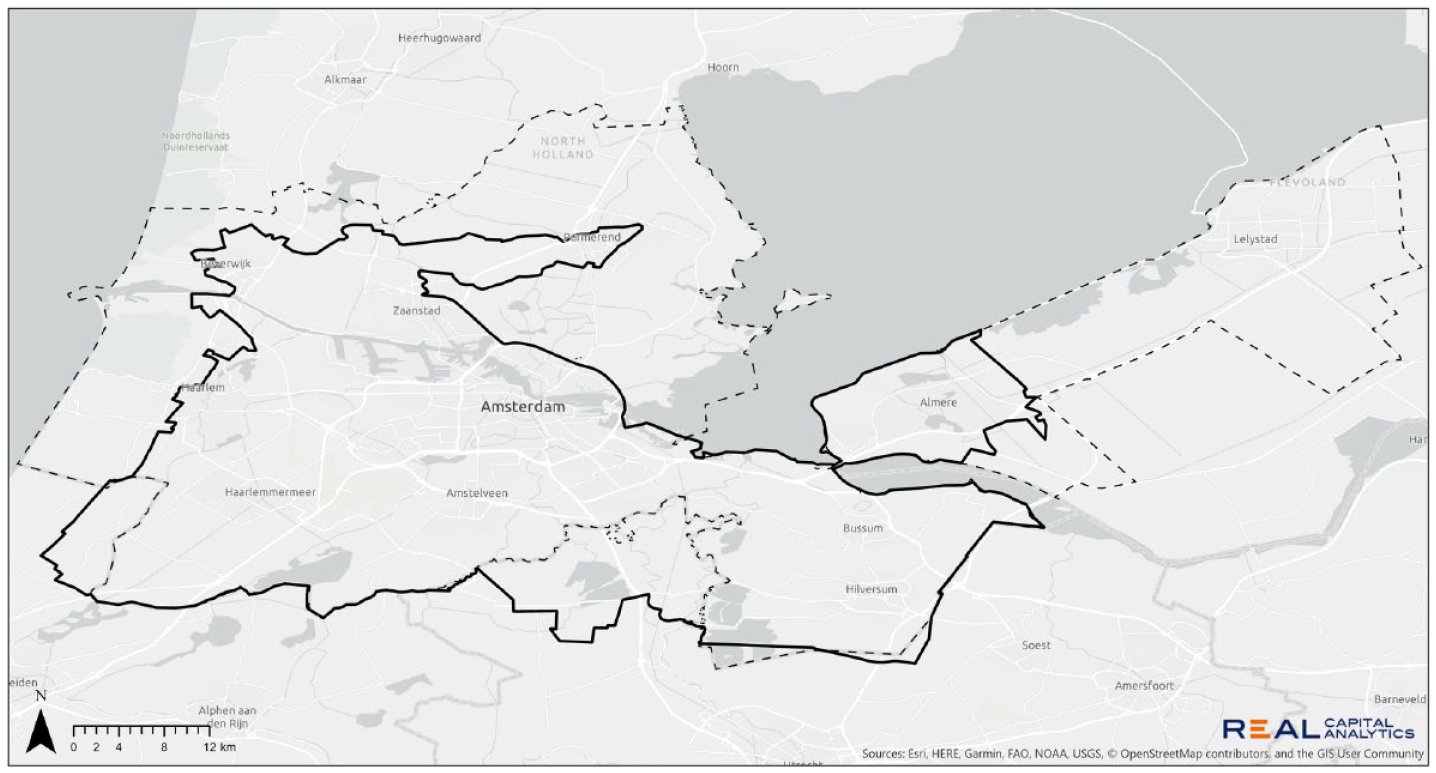
Map of analysed investment market (black outline) and Metropolitan Region Amsterdam (dashed black line).
Our extensive data analysis followed our analytical framework. For the scale of operation, we looked at cross-border and domestic activities based on investors’ headquarter locations. We could see whether investments into the Amsterdam market came from a cross-border or domestic source, but, following the investor profiles, also whether the involved investor generally operated in the Netherlands or beyond. For the types of capital circulating in Amsterdam’s property investment market, we followed RCA’s categorisation of institutional, listed/REIT, private and other capital. We expanded this categorisation with the dimension of ownership composition, which we examined in terms of a more detailed description of the investor being an institution such as banks, insurance and pension funds when investing institutional capital, being a REIT or real estate operating company, being a high net worth individual, and so forth, when investing other capital. Finally, we created maps in GIS to cross-reference investment volumes with different analytical dimensions to detect locational trends, and focused on temporal elements of property transactions to explore investors’ strategic behaviour through analysing transaction hold periods of different investors.
The qualitative analysis is based on a systematic investigation of policies and regulations affecting property investments, and a systematic collection of property market reports on Amsterdam by industry actors such as Savills, CBRE, Jones Lang LaSalle, and Colliers International in the background. We systematically collected public sector regulations affecting property investment in Amsterdam and categorised them by policy target, approach and focus to gain a comprehensive view of the regulatory processes that shape investors and their activities. Property industry reports allowed us to pinpoint discourses and perceptions on Amsterdam as an investment market, and the property industry’s perception of government regulation influencing activities. We then sought linkages between the regulatory and market changes, and the investment decisions of property actors through interviews. We conducted 22 in-depth interviews with property investors and investment consultants operating in the Amsterdam market to ask how they took certain decisions during the periods we defined, how they changed their behaviour, and, more importantly, how they perceived the changes. Interviewees ranged from foreign and domestic investors, institutional and private equity investors, and investors and consultants working for large pension funds, investment managers and investor-developers. Adhering to strict anonymity and confidentiality, interviews focused on Amsterdam’s investor landscape, assessments on economic and regulatory periods, and changes in actor constellations and their effects on urban development throughout time. Through the interviews, we gained insight into the multifaceted world of property investors and combined, our qualitative analysis enables us to substantiate our quantitative data findings.
Economic and regulatory periods affecting Amsterdam’s property investment market
Amsterdam provides an excellent laboratory to analyse complex and dynamic investor landscapes and market shifts due to its compact size and equally complex yet transparent institutional structure. Traditionally, Amsterdam is a city with a clearly defined and strongly positioned public administrative system equipped with sophisticated planning policy instruments, extensive public landownership and a unique leasehold system. Steadily, the city’s economy has been more internationalised and financialised in the last few decades, increasingly focusing on the financial and service economy. As a result, Amsterdam did not only become one of the strongest metropolitan cities in Europe for technology, investment and innovation 1 but also ranked among the top ten real estate markets in the world recently. 2 At the same time, affected by its favourable location, high living standards and attractive international work environment, the city started to attract more international short- and long-term international residents like students, tourists and expatriates. Amsterdam began struggling to balance the needs of its increasingly changing profile of residents who attracted new luxurious residential property production, and related retail and office spaces.
Within this framework, the GFC has been one of the most profound experiences in the last two decades affecting Amsterdam. Of a different nature, but with similar institutional disruptions in established economic and regulatory relations, the coronavirus pandemic is set to instigate new sets of government interventions, likely altering investor landscapes in the years to come. Based on our analysis of property transaction volumes at national and city levels, as well as interviews, we were able to define three distinct periods indicating market shifts in terms of economic performance and regulatory transformation: the pre-GFC period until 2008, the post-GFC recovery period from 2009 to 2013, and the pre-Covid19 boom period from 2014 to mid 2020 (Figure 3).
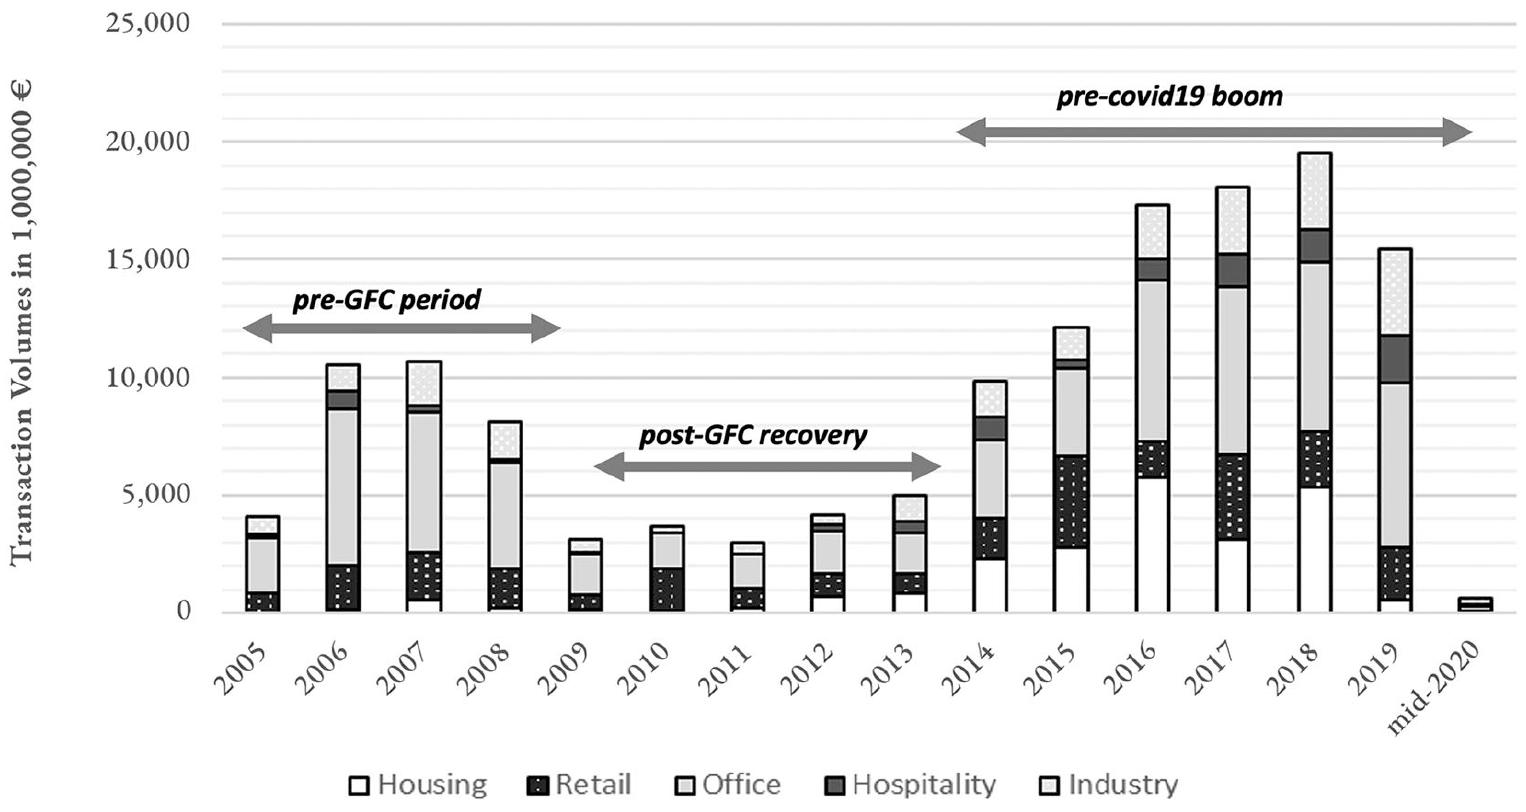
Annual sum of investment transaction volumes in € in the Netherlands, recorded by Real Capital Analytics (RCA).
Until the turn of the millennium, the Dutch economy experienced steady growth. As part of the early 2000s recession, growth rates slowed down considerably between 2001 and 2005. In 2006 and 2007, they picked up again, reaching a GDP growth of more than 3.5%. Investment volumes in the property sector in the pre-GFC period reflect this change (Figure 3). However, by September 2008, the first major effects of a crumbling global financial market were felt in the Netherlands (Scanlon and Elsinga, 2014). Banks did not have the resources anymore to grant mortgages or other long-term loans (Priemus, 2010: 102), which had a snowball effect on various economic sectors, including real estate. The national government stepped in and partly nationalised banks, starting with the ABN-AMRO Bank (Priemus, 2010).
In Amsterdam, important transformations in property markets took place both in terms of both financial outlooks, as well as regulatory change in the two decades prior to the GFC. Active land policy and extensive public landownership meant that the property industry closely worked with public authorities, with relatively clearly defined roles and responsibilities (Fainstein, 2014; Niitamo, 2020; Shahab et al., 2020). The private sector traditionally had a special position in political decision-making mechanisms due to an institutionalised way of collaboration between business and government, known as the ‘polder model’. This approach is directly reflected in the regulation of residential property markets, as housing has been one of the strongest focal points of the Dutch welfare state (Taşan-Kok and Korthals Altes, 2012). Like elsewhere in the country, where local governments have traditionally practised direct land development by buying and servicing land, and then disposing the serviced plots to development companies, housing associations and end-users, the City of Amsterdam held a strong role in active land policy. This fact is further strengthened by the City’s extensive landownership. The City of Amsterdam has been actively involved in shaping property markets in the pre-GFC period, through its straightforward and direct relations with the property industry and clear planning agenda.
When the GFC hit Amsterdam, the city’s property investment market was characterised by a threatening instability, during which the economy shrank 3.9% and property transactions dropped 2.5% (Global Property Guide, 2010). Amsterdam’s property market in the pre-GFC period was dominated by investments into offices, similar to the rest of the Netherlands. Country-wide, in 2007, 68% of all investments went into offices, followed by 12% into industrial properties and 9% into retail (CBRE, 2020). Residential property investments were almost non-existent. However, the GFC triggered substantive office vacancy rates, which various stakeholders blamed on each other: developers assigned responsibility to the high demand by users, investors blamed municipalities for focusing so extensively on offices in new land developments, and municipalities argued that developers threatened to move their activities to adjacent municipalities if they did not provide land for office development (Remøy, 2010); ‘the municipality acting as a “market party” in this situation eventually shouldered much of the blame’ (Remøy and Street, 2018: 812). In 2008, the proportion of office investments in the Netherlands fell to 40% and has continually shrunk since then, while other sectors, particularly residential investments skyrocketed (CBRE, 2020).
Moving forward, 2009 marked the beginning of the post-GFC recovery period. A new set of national government measures were implemented, particularly to restore the housing market (Scanlon and Elsinga, 2014) but also to enable and encourage office conversions (Remøy and Street, 2018). Furthermore, to curb risks, banks tightened their lending conditions (Priemus, 2010). In July 2009, the national mortgage guarantee was extended by the government ‘aimed to reduce risks for investors, using its own triple-A rating’ (Scanlon and Elsinga, 2014) and subsidies were implemented to encourage housing production. In 2010, national new legislation (Crises and Recovery Act) was issued, aiming to reduce formal procedures to enable continuous market activity in times of economic downturns, which inspired a larger regulatory change in the years to come to fundamentally change the Dutch planning legislation within the framework of the so-called Environment and Planning Act (Omgevingswet). Not only did the Crisis and Recovery Act streamline regulations and remove administrative barriers, but it allowed municipalities to reduce the planned capacity of office developments without compensation claims (Remøy and Street, 2018). It was followed by an agreement between national and local governments and market parties in 2012 ‘to stimulate the withdrawal of offices from the office market by conversion, adaptation or demolition’ (Remøy and Street, 2018: 814). Furthermore, the real estate transfer tax, which slowed down property transactions, was reduced temporarily from 6% to 2% which later became permanent in 2012 (Remøy and Street, 2018). In September 2013, a national housing market reform agenda was published to create ‘a flexible and future-proof housing market that offers greater choice to tenants and home buyers, more opportunities for investment, [and] greater resistance to economic shocks’ (Priemus, 2010: 10). Thus, the main shift that occurred in the post-GFC recovery period was a move away from office to residential investments, strongly supported and directed by a comprehensive set of government regulations. As a result, since early 2013, up to a quarter of economic growth in the Netherlands can be attributed to housing market recovery (ABN AMRO, 2019).
The pre-Covid19 boom period begins in 2014. From 2016 to 2017, investment volumes in the Netherlands increased by 20% to € 5.5 billion in 2017 (Bouwinvest, 2018). Within this period, Dutch property investment markets further internationalised. By 2017, 70% of all transactions were made by foreign investors and 30% of all transactions were between foreign investors (CBRE, 2018). In 2018, the Netherlands experienced a record volume of €19.5 billion in real estate investments, turning the country the third largest destination for property investors in continental Europe (Bouwinvest, 2018: 5). Due to the growing investment appetite, and a development and construction industry that can hardly keep up with demands, prices increased sharply (ABN AMBRO, 2018). Furthermore, new niche segments, such as student housing, senior housing and care facilities, attracted the interest of an increasing number of investors who were seeking better yields (Bouwinvest, 2019). The residential investment market reached a new record of €9.3 billion in 2019 in the Netherlands (Capital Value, 2020).
During this period, we also see how the national government started to retake control through new legislation such as the 2015 Amendments to the Housing Law, which restricted housing corporations’ activities to the supply of housing for affordable groups and intended to level the playing field for investors. Moreover, with another new legislation which is expected to be issued in April 2021, the property transfer tax is increased to 8% for property investors. While national regulations were seeking more control, the City of Amsterdam also took a stronger stance on steering development practices by imposing stricter regulations and policies as land values and investor interest were high, and the City did not experience the sense of desperation to attract investments into the urban built environment as had been the case in the post-GFC recovery period (Özogul, 2020). In 2018, the City introduced the ‘40–40–20 rule’ to regulate the inclusion of 40% social housing, 40% affordable (middle-income) housing, and 20% high-end housing production in each new project, restricting the owner to keep individual units for a minimum 25 years with very limited rent increases. Investors expressed that these regulations would considerably diminish the profit margins and create an unprofitable residential investment market (Capital Value, 2020), but investment transactions remained high.
Covid19 has contributed to new market shifts in Amsterdam, albeit the full impact is yet to be determined. Even though the first quarter of 2020 showed limited effect of Covid19 on the residential investor market (Jones Lang LaSalle, 2020), in Amsterdam there was a strong decline in overbidding (Colliers International, 2020), an indicator of slowing-down residential markets. Some developments and transactions continued due to investor appetite in the residential sector (Savills, 2020a), and generally the Dutch property investment market is described as more resilient than before the GFC due to its diversification across different sectors (CBRE, 2020). Nonetheless, investment volume in the first months of 2020 dropped compared with the same period in 2019 (Savills, 2020b), marking the end of the pre-Covid19 boom period. Amsterdam benefits from investors’ focus on the Randstad area, the economic hub of the Netherlands, to curb risks particularly regarding office investments. The overall share of investment transactions in the four major cities Amsterdam, Rotterdam, The Hague and Utrecht rose from 64% in 2019 to 79% in the first two quarters of 2020 (CBRE, 2020). A similar trend had already occurred in 2008, when the investment transaction shares in the four major cities rose from 38% in 2007 to 58% (CBRE, 2020). Yet, the city suffered a more severe recession during the first half of 2020 than the rest of the country and its economy shrunk by an estimated 5.9% in 2020, the largest ever recorded drop (Oxford Economics, 2020). The following section will scrutinise the impact of the market shifts across the three periods on Amsterdam’s property investor landscapes in further detail.
Amsterdam’s changing landscape of property investors
Following the definition of the three periods, we are able to link them to changes in the property investor landscape of Amsterdam. Building up the analysis from the four dimensions of our framework, we find that investors’ scale of operation, type of capital, ownership composition, and strategic and locational behaviour each closely associate and, together, help configure investment decisions. The exemplary application of our framework to the Amsterdam case furthermore reveals how analyses focusing on one-dimensional descriptions might fall methodologically short when analysing how investors interact with the built urban environment. Thus, we demonstrate how investor landscapes are products of multidimensional interactions between the different dimensions that remain ill-depicted within urban scholarship.
Investors’ scale of operation
The first dimension of our framework looks at the scale of operation of investors active in Amsterdam’s property market. Interviewees had mixed opinions on the importance of the scale of operation in characterising an investor. Some argued that foreign investors are more prone to risk, while domestic investors are more conservative but better integrated in local industry networks. Others stated that it is purely impossible to generalise on the basis of an investor’s headquarters. Nonetheless, scale of operation is a prominent categorisation in the wider urban studies (Özogul and Taşan-Kok, 2020) and industry reports and data attest to an interplay between foreign and domestic investors. For instance, a recent CBRE (2019) report explains how Dutch banks made considerable commercial real estate investments in the first half of 2018. As traditionally leading property financiers in the Netherlands, this action created space for foreign investors to further invest in the city, acquiring small shares and creating a diverse and varied landscape with many different lenders (CBRE, 2019). Thus, while scale of operation of an investor matters, this dimension and its presentation needs to undergo careful considerations when considering the local investor landscape.
Within our database, we find that the number of domestically and foreign headquartered investors within Amsterdam underwent distinct changes over the course of the three periods. In the pre-GFC period (2005–2009), we identified 332 investors with transactions that involved more than €5 million or ten or more units. Of these 332 investors, 215 were internationally headquartered and 117 had domestic headquarters. In the post-GFC recovery period (2009–2013), the number of investors within Amsterdam slumped; there were 313 actors within Amsterdam, with 230 companies domestically headquartered and 83 headquartered in a foreign location. In the last period, the pre-Covid19 boom period (2014–2020), the number of investors within Amsterdam more than quadrupled, with 1499 investors with transactions within Amsterdam, – 1009 investors with domestic headquarters and 490 with foreign headquarter locations. While the periods differ in length, the proportions of foreign and domestic investors are surprisingly near equal during the pre-GFC and pre-Covid19 boom (Figure 4).
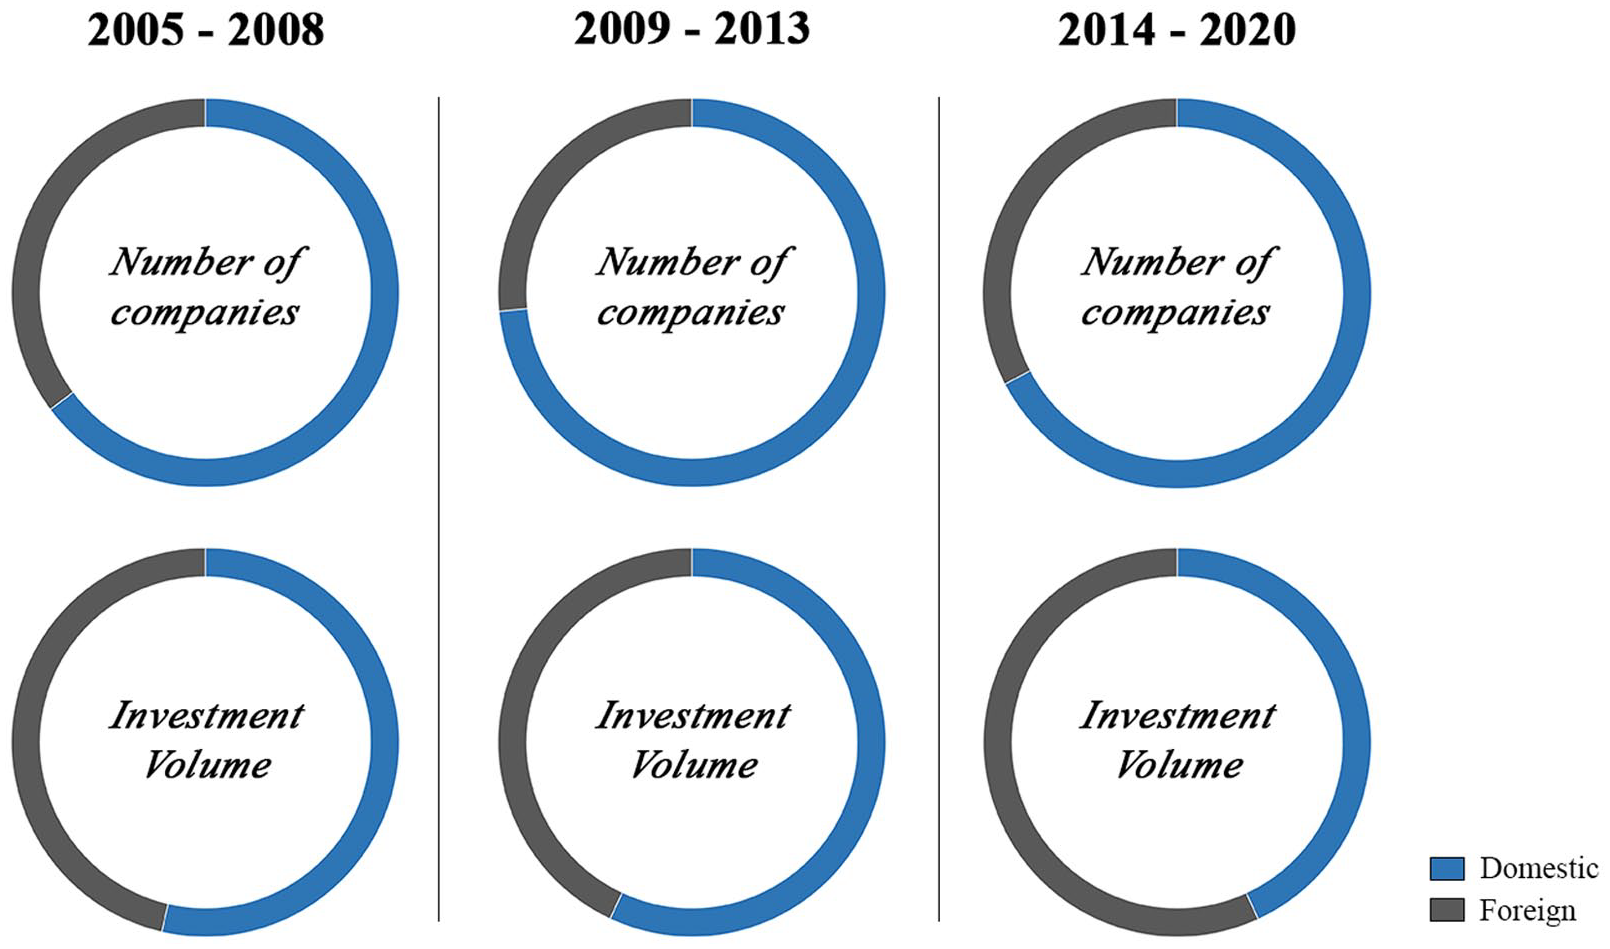
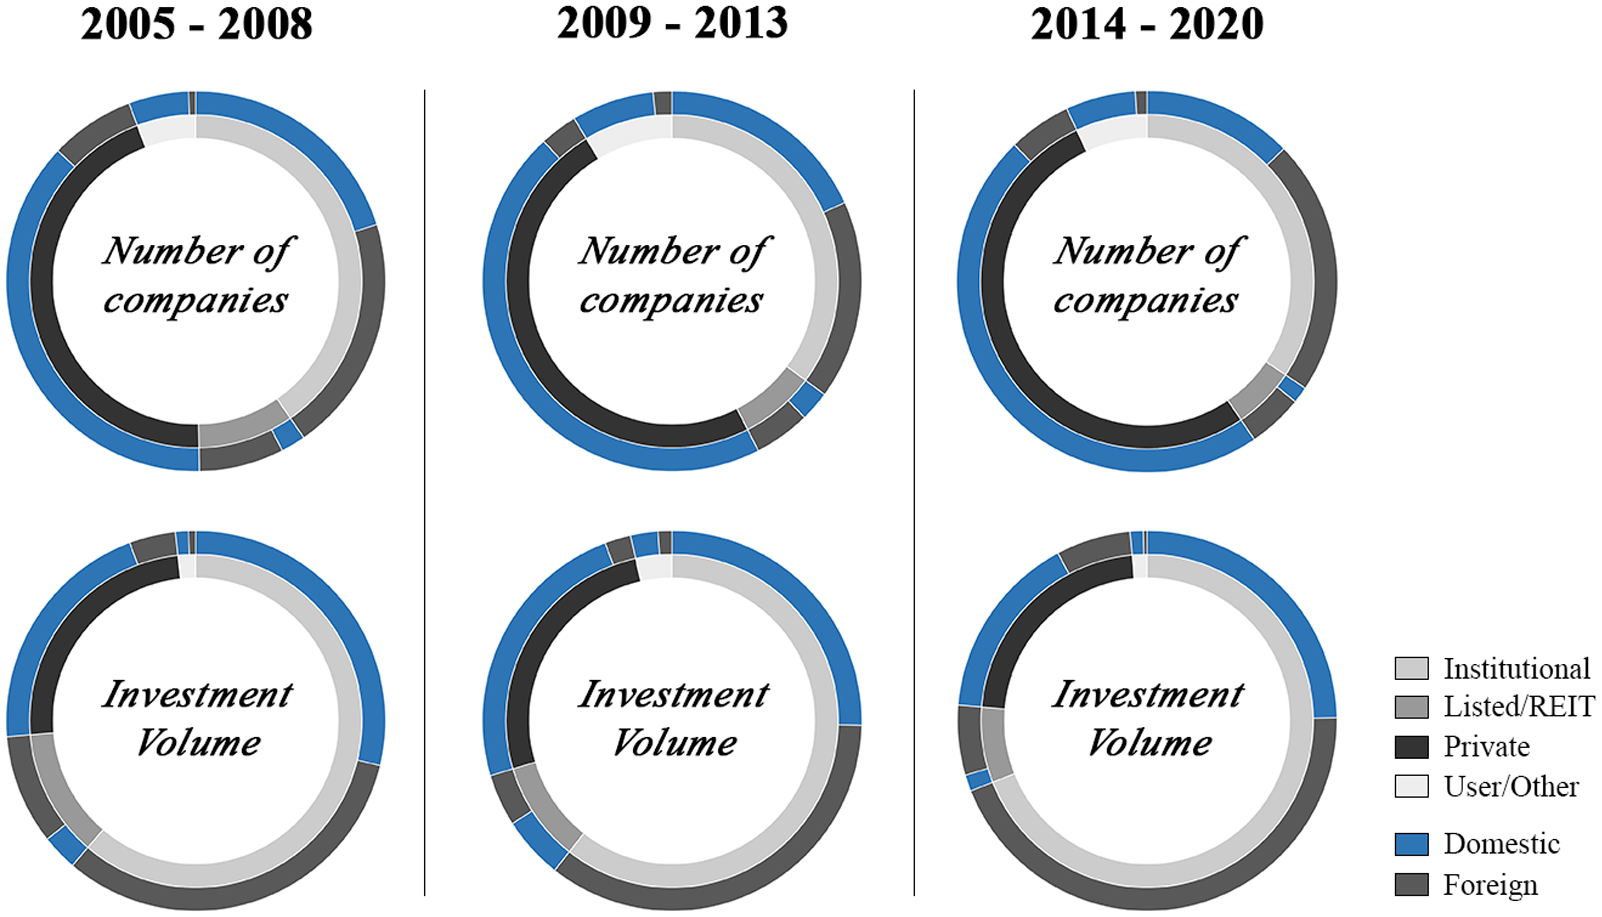
Share of companies and share of total property investment volume by headquarter location.
Along with the numbers of companies, we also examined investors’ investment volume. During the 2005–2008 and the 2014–2020 periods, investment volume by foreign investors grew from roughly 45% to 60% (Figure 4). Investment volume also as a whole grew by nearly 4.5 times between the pre-GFC and pre-Covid19 period. During the pre-Covid19 period, foreign investors funnelled more capital than their domestic counterparts into Amsterdam. Additionally, within the last period, only about one-third of the companies with transactions within Amsterdam had foreign headquarters, while, during the same period, foreign investors comprised nearly 60% of all investment volume within Amsterdam.
These figures are interesting in terms of the critical urban literature that tends to problematise foreign investors in local property markets. Numbers, alone, fall short in explanatory power if they do not relate specifically what the ‘problem’ is and why. Even if carefully specified, these numbers present sets of investors within a group as perfectly rational and understandable. However, we move to highlight the inability to generalise solely on the basis of investors’ scale of operation, by implementing a more fine-tuned analysis adding additional dimensions in each section below.
Investors’ type of capital
The second dimension of our framework is investors’ type of capital. Within our interviews, we learned that simply referencing foreign and domestic headquarter locations did not elicit clear investment behaviour. While some interviewees pointed to foreign investors being more eager in cities such as Amsterdam and Rotterdam than in smaller cities within the Netherlands, several investors emphasised how the different forms of capital that investors utilise shape their investment decision-making processes. Therefore, within our analysis, we focused on investors’ type of capital in relation to investors’ scale of operation.
To visualise how different capital types materialise within Amsterdam across different periods, we add a variable for the investors’ type of capital to our previous figure. Once we add the additional ring (Figure 5), we see diversities across the sub-categories of both foreign and domestically headquartered investors. We represent investors’ capital type by the categories from the RCA database of Institutional, Listed/REIT, Private, and User/Other. By combining the two dimensions into one figure, we can visualise the link to scale of operation.
Share of companies and share of total property investment volume by type of capital and scale of operation.
The inner ring in Figure 5 represents the number of companies (upper row) and the investment volume (lower row) by capital type. For instance, in the pre-GFC period, from the upper row we can see that the number of companies using private and institutional capital dominated the investor landscape. The lower row shows that institutional investors clearly dominated the overall investment volume in this period. The outer rings provide information on domestic and foreign investors. Thus, we can see, for example, not only how the percentage of the total investment volume of institutional investors grew from the pre-GFC period to the pre-Covid19 period, but that the percentage of foreign institutional investment grew considerably.
Indeed, institutional investment is a controversial topic of discussion in Amsterdam, with local authorities having turned to institutional investors to provide middle-income housing as a way to tackle the city’s housing shortage. Interviewees working for institutional investors active in the wider Amsterdam area explained that domestic and foreign institutional investors frequently have different return targets, with Dutch institutional investors tending to be conservative and targeting high yields. In this sense, the growing presence of foreign institutional investors was considered as negative in terms of competition for Dutch investors. Meanwhile, however, some interviewees explained that the existence of foreign institutional investors creates diversification in Amsterdam’s property investment market and can be advantageous for the city as it reduces its dependence on local or national economic upheaval.
Also notable in Figure 5 is the steady increase in the percentage of private investors relative to the overall number of investment companies. Even in the post-GFC recovery period, the number grows, nearing 50%. The explanation of this trend can be found in regulations. For the first time ever, in 2014 the European Central Bank adopted a negative interest rate policy for the eurozone, turning investment into property much more profitable than keeping money in savings accounts (Smith, 2020). Furthermore, interviewees explained that foreign private equity investors commonly perceive the Netherlands, and Amsterdam in particular, as a safe haven for their investment due to the popularity of the city, strong housing demand and political stability in the country. At the same time, Figure 5 indicates that the majority of private equity flowing into the built environment comes from domestic investors. This is partly linked to the state-initiated revival of a private rental sector in Amsterdam (Hochstenbach and Ronald, 2020).
By adding the dimension of investor’s capital type to our analysis, we begin to elicit diversities across investors within our study area. This two-dimensional approach responds to critical urban literature that generally focuses on singular-dimensional investor characteristics. However, as the case of institutional investors illustrates, they are not a singular group – and include members such as pension funds, insurance companies, and so forth – who each have different economic interests and behaviours that we can target in more fine-tuned analysis.
Investors’ ownership composition
The third dimension of our framework is ownership composition. By this, we further differentiate the previous four types of capital and can see diversity across both investors’ scale of operation and type of capital. To visualise the addition of the dimension of ownership composition, we add an additional ring to Figure 5 to represent investors’ ownership composition, as defined by categories from the RCA database. The addition of this ring helps elicit the diversities across investors categorised by capital type or scale of operation, alone (Figure 6).
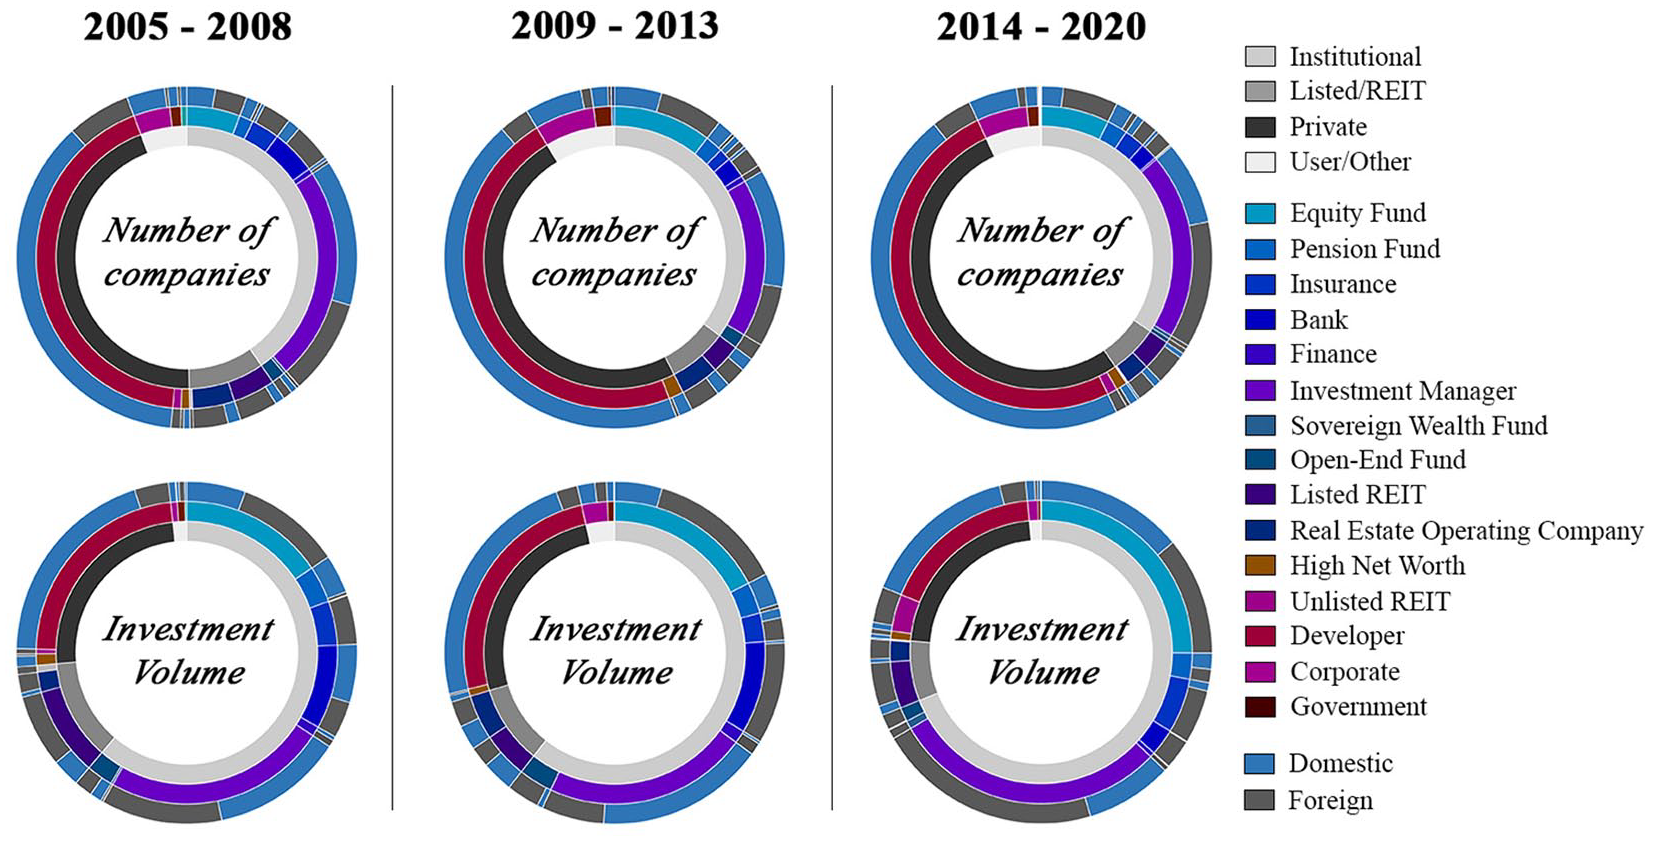
Share of total property market investment volumes by ownership composition, type of capital, and of operation.
To read and interpret Figure 6, we start in the inner ring which indicates investors’ capital type. From there, we move to the middle ring to see that for instance in the pre-Covid19 boom period, investment managers had the largest percentage of the investment volume of institutional investors. Moving to the outer ring, we can moreover read that out of all investment managers, more than two-thirds were foreign. According to our analysis, investment managers have become the most influential investor group in Amsterdam. Also, investment managers have the highest estimated property holdings and the largest acquisition numbers both in actual numbers and percentages of total acquisition volumes compared with other investor types. As interviewees pointed out, understanding the specific ownership composition can reveal crucial information on investor behaviour, something that is rarely done in the critical urban literature which usually does not go further than describing investors as institutional investors, for example. However, one interviewee pointed out that, at times, lines between investment managers and other institutional investors are blurred, and investors change their profile. Institutional investors such as pension funds decide to utilise specialised companies to reduce risks, which enables the creation of investment managers, but, sometimes, this expertise is taken back in-house, reabsorbing investment managers into larger funds. This adds to the dynamism of property investment markets and should be acknowledged when reading investor landscapes.
We can also read, for instance, how the number of development companies remained rather stable in relative terms, withstanding the GFC. This is surprising, as interviewees pointed out how many small development companies active in Amsterdam went bankrupt following the GFC. Furthermore, developers are primarily domestic companies, speaking to the local ecosystem of developers and the context-specific knowledge and established social relationships with municipalities that developers tend to utilise in development practices.
To conclude this section, the examples show that this three-dimensional approach, which includes specific attention to investors’ scale of operation, type of capital, and ownership composition responds to singular dimensional analyses of urban investment – providing a framework to help understand investment within urban space. As real estate reinvestment remains a key urban process that shapes the built urban environment, our framework moves to grapple with investors’ locational and strategic behaviour and the spatial and temporal implications of our previous Figures 4–6.
Investors’ locational and strategic behaviour
The fourth and last dimension of our framework is investors’ locational and strategic behaviour, where we examine investment hold periods and locational preferences of investors within Amsterdam in relation to previous dimensions. From private sector reports, we know, for example, that the housing shortage in the Netherlands is projected to reach between 360,000 and 380,000 units in 2022, and almost 80% of the foreign investments in the Netherlands are made to keep the asset for a long period of time (which is referred as a buy-and-hold strategy) (Capital Value, 2020). Behavioural dimensions of investors such as this are vastly understudied in the wider urban (planning) studies but constitute one of the most promising insights for interdisciplinary knowledge transfer (Özogul and Taşan-Kok, 2020).
We can investigate investors’ strategic behaviour and types of capital of investors for transactions within the RCA database from investors with multiple transactions within Amsterdam. To do so, we focus on properties with multiple transactions to determine the hold period of the previous purchaser. Using this investor level data, we can then visualise diversities within investors’ scale of operation, ownership composition and type of capital, even within investors who have seemingly similar strategic investment behaviour (i.e. property hold periods). This multiple-dimensional, temporal representation (Figure 7) helps visualise the diversities of investors who invest in Amsterdam.
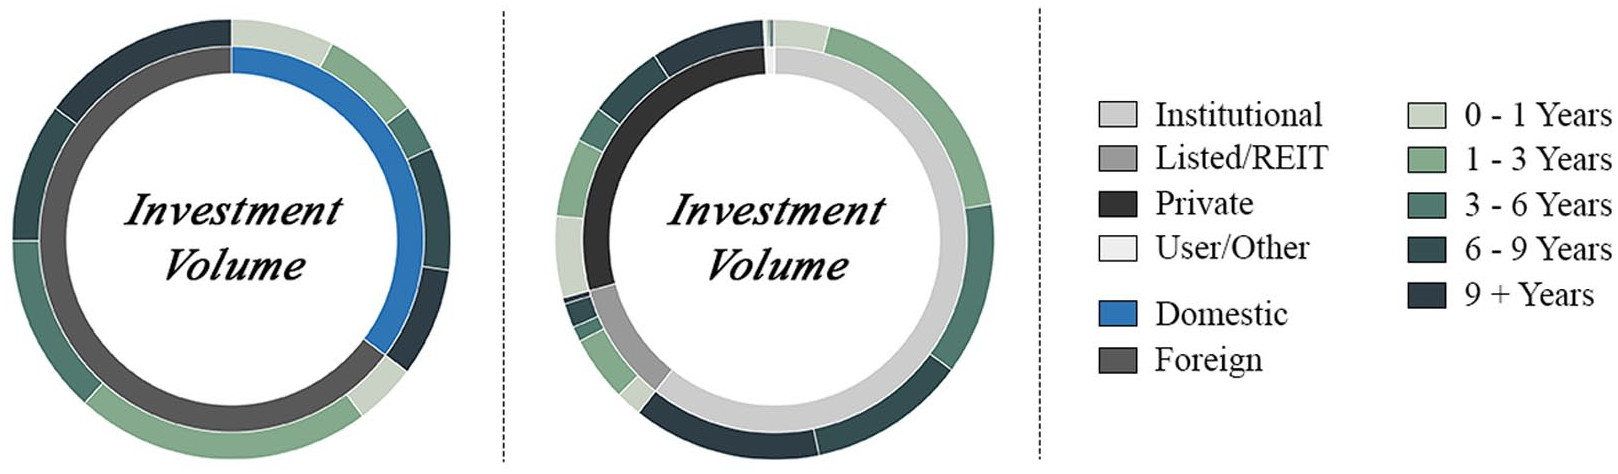
Share of companies and share of total property investment by hold period, type of capital and scale of operation (for properties within multiple transactions in the Real Capital Analytics (RCA) database).
This figure points toward how different investors share particular characteristics (e.g. foreign headquarters, institutional investors) have different strategic behaviour when it comes to their investment decision. Literature generally points toward institutional investors having long hold periods. And while our analysis reveals that the median hold period for institutional investors is longer than non-institutional investors, Figure 7 points to the diversities of hold periods between institutional investors with near-even proportions of institutional investors holding property for 1–3, 3–6, 6–9 and 9+ years. Many interviewees also pointed toward different strategies across seemingly similar investor types. When discussing how institutional investors see investments in the Netherlands, one interviewee pointed toward how some institutional investors actually utilise more aggressive strategies than others, buying up a lot of properties in the hope of making profits fast. Continuing the discussion on the rise of investment managers, interviewees also stressed that, in terms of urban policy and planning, the time horizon of investment for an investor is most crucial. While most investment managers were described as rather specialised and sophisticated, industry interviewees recommended urban policymakers and planners not pay too much attention to whether an investor is foreign or domestic, but whether they follow long-term or short-term strategies.
Bringing the discussion to a more urban focus, we looked at the locational dimensions of investment. Within our analysis, we investigated investors’ locational behaviour against other previous dimensions. In order to systematically investigate investors’ locational behaviour, we produced separate maps on account of investors’ scale of operation, type of capital, and ownership composition (see Figure 8). After producing the maps, we analysed the maps’ elicit spatial preferences of particular investors (for instance, foreign headquarter pension funds).
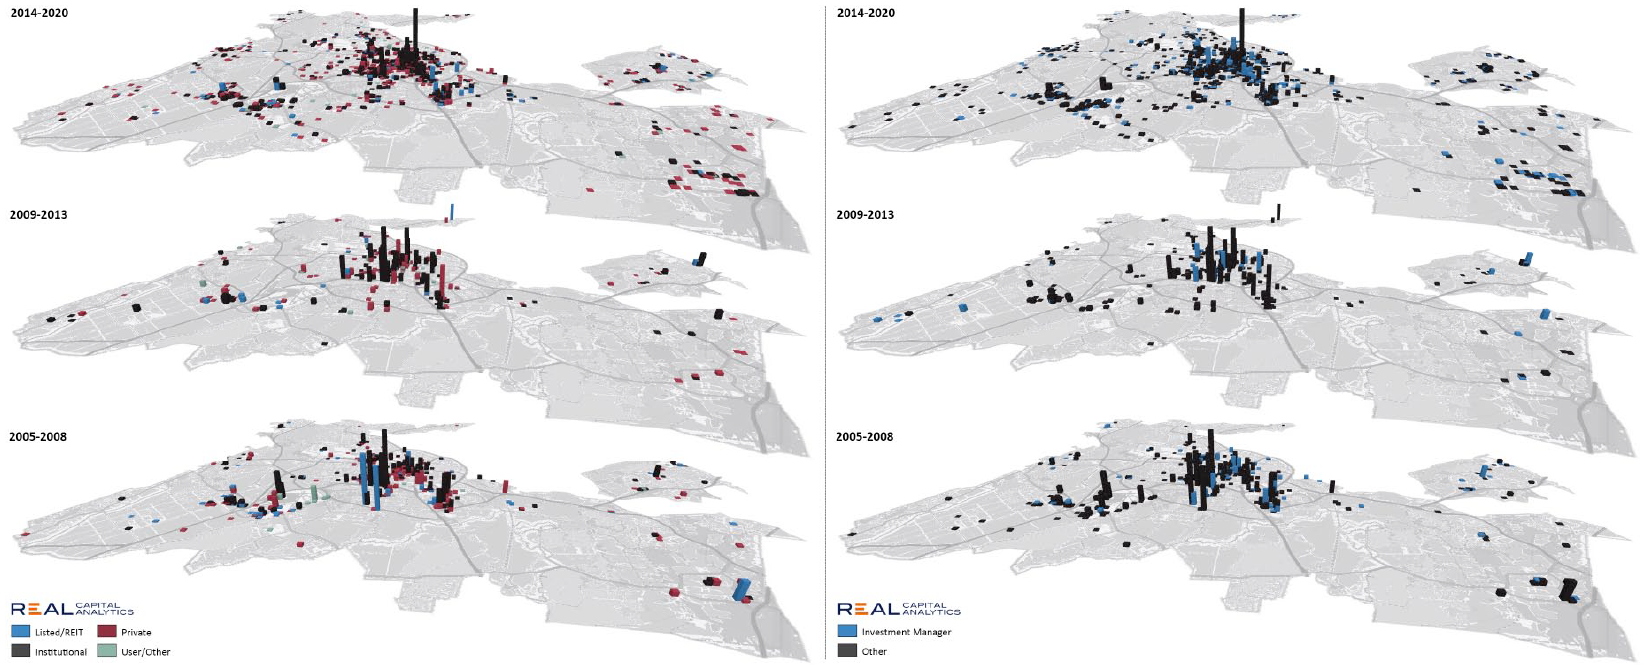
Location of investments by type of capital (left) and ownership composition (i.e. investment managers) (right).
We found that, within our three periods of investigation, neither foreign nor domestic investment is concentrated within specific geographies across the region. Within the study area, we see diversities across space–time of both foreign and domestically headquartered property market actor investment. The same is true for capital type and also for ownership composition. This does not mean that location does not matter, but rather that there are no clear-cut distinguishable differences between types of investors and their investment locations. As such, we find that locational preferences within Amsterdam are products of individual investor preferences – and do not clearly stem from macro-investor categorisations. That is, foreign headquarter investors do not more clearly invest within central Amsterdam than the periphery. Within our analysis, we also found that there are investors who departed the region during the post-GFC recovery period and re-joined the landscape in the pre-Covid19 period. Similarly, there are investors who joined the landscape during the post-GFC crisis and left the landscape during the pre-Covid19 period. This points toward investors having strategic and locational preferences that influence when they enter and exit particular markets.
The findings tie in with our interview outcomes in which interviewees pointed toward the complexity of investor preferences. In other words, not all institutional investors – or domestic investors – are necessarily interested in the same projects. Nor are investor preferences, based on singular-dimensional typologies, easily generalisable. The ownership composition, capital types, and scale of operation of investment actors, alone, are single-dimensional entry points that do not necessarily have the empirical depth to grapple with the questions surrounding why certain investors are attracted to particular spaces at specific moments.
Discussion and conclusion
Descriptions of property market cycles remain important within urban studies literature to explain changing dynamics in cities, especially in relation to market-dependency in urban planning (Ryan-Collins, 2019; Salvati, 2019; Sorensen, 2018; Weber, 2016). In this paper, we bring the relationship between urban change and property cycles a step further by arguing that we can link the changing economic and regulatory processes in cities to the multidimensional characteristics of investor landscapes. This link is established by systematically analysing market shifts in terms of economic and regulatory changes in combination with investor profiles and behaviour within urban development. This approach fills a gap, as we believe the predominance of ‘cyclical thinking’ might remain, in part, due to the missing link between crises, property market actors, and the urban built environment.
In our analysis, we demonstrate a relational conceptualisation of crises by focusing on the actor landscapes through multidimensional characteristics, which are embedded in wider economic and regulatory processes. We specifically demonstrate that crises represent discontinuities and disruptions of established systems of social and institutional relationships. This empirically driven approach to periods preceding and following crises provides a rich analytical approach that can help reveal discontinuities and transitions within the built urban environment – resisting property market metaphors and prioritising empirically demonstratable changes within property markets.
Our findings underscore that, to understand investors, we should not merely focus on one dimension – but rather, work to carefully understand how different dimensions of investors (i.e. scale of operation, ownership composition, type of capital, and locational and strategic behaviour), together, help configure investment decisions in relation to wider economic and regulatory changes. Focusing on a specific company’s (like Blackstone, as a very popular example) (Garcia-Lamarca, 2020; Janoschka et al., 2020) or specific types of companies’ behaviours (Chinese, REITs, etc.) (Rogers et al., 2015; Waldron, 2018) provides interesting insights on how a specific type of investor may behave under certain circumstances. However, this type of analysis usually disregards the wider factors that play a role in this behaviour and does not account for space, but, more importantly, contributes to stereotyping behaviour. Most of these studies assume ‘rationality in decision-making start from the premise of the detached individual’ (Öhman et al., 2013: 538).
Our findings show that the number of investors decreased slightly following the GFC but increased dramatically in the pre-Covid19 boom period in Amsterdam. Similarly, overall investment volumes grew by nearly 4.5 times over the course of 15 years. The relative distribution of foreign and domestic investors changed too, with two-thirds of the investment volume coming from foreign investors between 2014 and 2020. A major reason is the rise of foreign institutional investors, with particular subtypes, such as investment managers, gaining the strongest foothold in Amsterdam. Nonetheless, it is notable that the share of companies and the share of investment volumes between foreign and domestic investors in relative terms is not as drastic as it is often perceived. Furthermore, the percentages of private capital in property transaction remained relatively stable throughout economic upheaval and regulatory transformations. We also noticed that investments were spread relatively evenly geographically, and hold periods of properties of all sub-types of investors included ranges from 1 to 9 years, and were hence difficult to generalise.
Based on our analysis, we can conclude that, while it is quite interesting and tempting to reference, for instance, an investors’ scale of operation to describe their behaviour in local and international markets, such one-dimensional description falls methodologically short of understanding how investors interact with the built urban environment. Looking at single-dimensional indicators does not allow a comprehensive reading of the investor landscape. Our multidimensional analysis, which is layered one on top of another (see the evolution of Figures 4–6), enables a more comprehensive reading of the assemblage of property investors’ operational, financial and organisation characteristics as well as their locational and strategic behaviour in cities.
Reading property investment market shifts not only contains crucial information for urban policymakers but this reading also enables them to step aside from standard analysis to investigate the overlooked choices in the market (Campbell et al., 2014). Local government regulations, like the 40–40–20 rule in Amsterdam, have an influence on investor behaviour. Our interviews confirmed that smaller investors, particularly, may move out of Amsterdam’s market to more flexible investment markets elsewhere in the country. At the same time, the 40–40–20 rule may not necessarily influence the behaviour of larger international investors, as national regulatory trends stimulate their activities (for instance, the new national Environment and Planning Act (Omgevingswet) which enables more flexibility). Even when domestic institutional investors might be deterred from investing large-scale in Amsterdam due to the increasingly restrictive regulations, it will create an opportunity for foreign institutional investors to fill the void. For the urban built environment, the presence of foreign institutional investors does not automatically lead to negative consequences. Instead, what is more important for urban development are investors’ strategies in terms of investment location and hold periods.
Thus, following a more comprehensive understanding of investor landscapes can be beneficial for public sector actors, including policymakers or urban strategists, that are confronted with growing volumes of investment capital while having to tackle a number of problems, including housing shortages and vacant office spaces. Looking beyond stereotypes, these actors need to better understand investors in terms of their strategic and locational behaviour and develop new policy approaches and strategic decisions to attract investors who are interested in investing in areas that overlap with policy targets, and who are in it for the long term. Understanding who and what actually shapes the city requires giving attention to these multiple dimensions of investor characteristics, and their interplay, as this knowledge will empower local policymakers to develop targeted regulations to shape, stimulate, regulate and build capacity in the property market (Adams and Tiesdell, 2012; Healey, 1998).
At the same time, reading the multidimensional characteristics also enables us to see why and how certain regulatory changes may have taken place in relation to the market shifts. Through comprehensive analytical methods, urban scholars can develop more pointed questions to understand why investors leave or come back to particular geographies at different moments. Ultimately, performing spatial–temporal analyses of investor landscapes provides an alternative methodology to identify actors and analyse property market shifts, while prioritising empirically demonstratable behaviour and actor preferences. While many scholars agree that the Covid19 pandemic is a crisis moment (Söderström, 2020), we need to be able to comprehensively ‘read’ the related urban changes. The Covid19 pandemic intensifies the pressing need for new methodological approaches to understand market shifts through more comprehensive forms of analysis, such as our actor-centred analysis of property market shifts through investor landscapes.
Footnotes
Declaration of conflicting interests
The author(s) declared no potential conflicts of interest with respect to the research, authorship and/or publication of this article.
Funding
The author(s) disclosed receipt of the following financial support for the research, authorship, and/or publication of this article: The paper was written within the framework of the WHIG Project (What is Governed in Cities: Residential Investment Landscapes and the Governance and Regulation of Housing Production), which examines the inter-relationships between contemporary investment flows into urban property markets, and the governance arrangements and public policy instruments that are designed to regulate them. The project (![]() ) has received funding from the Open Research Area for the Social Sciences (ORA) under grant agreement no. 464.18.113.
) has received funding from the Open Research Area for the Social Sciences (ORA) under grant agreement no. 464.18.113.