
Abstract
Since the 1980s, U.S. finance has grown disproportionately in power and influence as American investment funds have become the largest shareholders of U.S. corporations, managing tens of trillions of dollars in investments. This paper provides a novel empirical analysis of the ascent of asset manager capitalism in the United States and explores the extent of its global spread by examining the SEC Form 13F filings of U.S. institutional investors along with an extensive global corporate ownership dataset provided by Orbis. This paper finds that U.S. finance owns approximately 60% of U.S. listed companies (an increase from 3% in 1945) and 28% of the equity of all globally listed firms. As the largest global shareholders and the exemplars of U.S. asset managers, the Big Three hold investments in 81% of U.S. listed companies and own 17% of the U.S. equity market, while also appearing as a shareholder in 20% of non-U.S. listed companies and owning 4% of the non-U.S. equity market. This paper illustrates that the ascent of the age of passive investment and universal ownership, exemplified by the activities of the Big Three, has produced a sectorally and geographically uneven landscape of capital flows, exacerbating the existing divides between the heartlands and hinterlands of global financial markets. With the ownership of listed companies being increasingly concentrated in the hands of a small number of increasingly powerful funds, this paper ultimately argues that it is in the ownership of the majority of global capital that the power of modern finance lies.
Introduction
Since the 1980s, the American financial sector has grown disproportionately in terms of profit, power, and influence (Epstein, 2005; Krippner, 2005). With high interest rates following financial deregulation and the monetarist turn, some of the earlier scholarly accounts attributed the surging profitability of U.S. finance to the increased profitability of U.S. banking (e.g. Krippner, 2011; Tomaskovic-Devey and Lin, 2011). More recently, however, Braun (2022) suggested that the structural power of modern finance emanates from the large, illiquid, and highly diversified equity holdings of investment funds, and not from bank lending to non-financial corporations. With the ownership and management of capital surpassing credit intermediation as the most profitable financial activity in the United States (Gibadullina, 2023), the Wall Street Journal proclaimed that “banks lost the battle for power on Wall Street” as “[p]rofits, assets and influence have moved from investment banks such as Goldman to money-management giants such as BlackRock and Vanguard” (Hoffman, 2018). The most powerful financial intermediaries of today are no longer commercial or even investment banks, but asset management firms which have acquired historically unprecedented amounts of capital (Braun, 2021; Fichtner, 2020; Fichtner et al., 2017), while the rise of financial institutions engaged in investing has led to a deeper intertwining between industrial and financial capital (Keenan et al., 2022; Maher and Aquanno, 2022). Faced with these rapid financial transformations, Auvray et al. (2021) proposed that the post-2000 financialization phase, characterized by low interest rates, high shareholder payouts, and the centralization of financial ownership, needs to be conceptually demarcated from the earlier phase of financialization of the 1980–1990s extensively documented by Krippner (2011). While contemporary finance appears to no longer facilitate productive investments during the ongoing period of secular stagnation (Davis, 2018; Tori and Onaran, 2018), Dafe et al. (2022) argue that finance, nonetheless, continues to hold structural power, even though the underlying bases of its power have fundamentally changed.
This paper focuses on one aspect of the contemporary phase of financialization—the rise of asset manager capitalism and its uneven geographical spread around the world. I argue that the extent to which capital across effectively all economic sectors is being increasingly owned and managed by financial intermediaries has been one of the most significant, yet not sufficiently understood, transformations observed in the U.S. economy in the past four decades. Initially termed “investor capitalism” (Useem, 1996) and “pension fund capitalism” (Clark, 2000), this phenomenon was largely driven by private pension funds throughout the 1970s and the 1980s (Ippolito, 1995), but by the mid-1990s mutual funds surpassed private pension funds as the largest shareholder of U.S. corporations following a series of (de)regulatory changes (Braun, 2021). Drawing on Hilferding’s (1910) analysis of finance capitalism in the early 20th century, Davis (2008: 11) coined the term “new finance capitalism” to describe a new system of corporate ownership that began to emerge in the 1990s in the United States, in which “a small number of investment funds find themselves with substantial ownership positions in hundreds of corporations simultaneously.” In 2014 Andrew Haldane (2014), the Chief Economist of the Bank of England, proclaimed that the “Age of Asset Management may be upon us,” with Braun (2016) subsequently coining the term “asset manager capitalism” to describe this new corporate governance regime dominated by index funds. As asset managers continued to gain prominence throughout the 2010s, scholars in international political economy began to devote their attention to the rising global influence of index funds (Fichtner and Heemskerk, 2020) and the consequences of the “re-concentration of corporate ownership” for the U.S. economy (Fichtner et al., 2017). Concurrently, economic geographers began to examine the uneven, variegated geographies of corporate ownership (Haberly and Wójcik, 2017) and how technological advances have reshaped the asset management industry (Haberly et al., 2019). Amidst this financial turn, Ouma (2023: 1) called for a “more systematic attempt to politicize contemporary logics of property ownership and the extractive financial schemes based on them.”
In the United States, the changes in the composition of the owners of listed companies are striking. The Federal Reserve estimates that while at the end of World War II 95% of U.S. stocks were held directly by American households, by 2020 this number had dropped to 40% as a new set of financial intermediaries, providing investment advisory and asset management services, emerged (Figure 1). According to the Federal Reserve, since 1945 the share of equities owned directly by U.S. financial firms has grown altogether from 3% to 40%. Since the Federal Reserve classifies private equity firms and hedge funds under the “households” and “the rest of the world” categories, Braun (2021) estimates that the true share of corporate equities owned by U.S. finance is likely to be at least 12%–13% higher than reported. Together with exchange-traded funds (ETFs), mutual funds account for 27% of the American equity market, followed by 10% of equity owned by private pension funds and government retirement funds. The Federal Reserve data offers much needed long-durée historical estimates of U.S. equity owners not available elsewhere. However, it has several limitations, including under-estimating the investment holdings of U.S. mutual funds, not providing a sectoral breakdown of their holdings, grouping all mutual funds together which prevents one from measuring increasing ownership concentration, and finally lacking comparative data from other countries. Given these limitations, researchers have been relying on firm-level databases (Thomson Reuters, Refinitiv Eikon, or Orbis) to study the emerging dynamics of asset manager capitalism in the United States and globally.
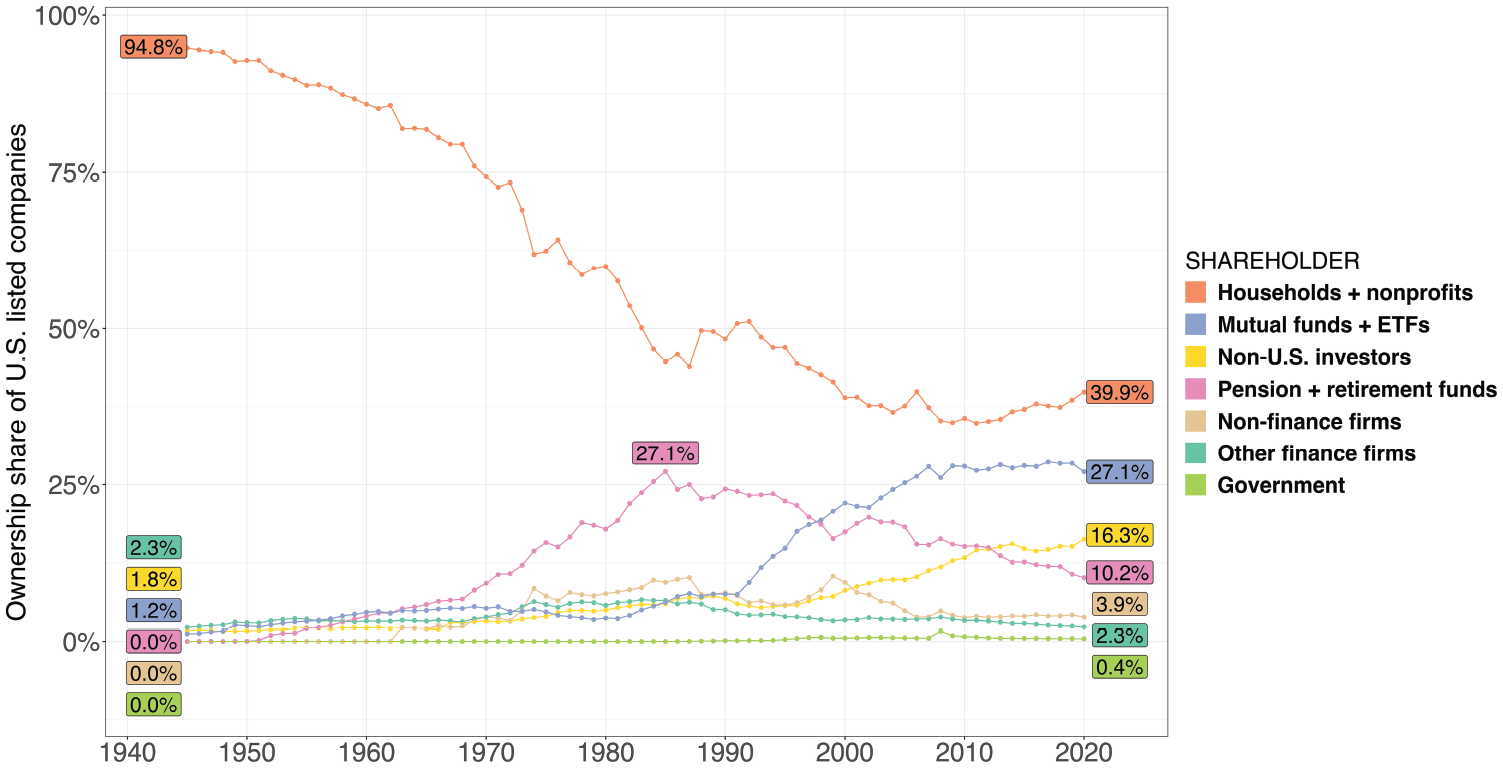
Share of U.S. listed companies owned by different types of shareholders, 1945–2020.
Although the literature on asset manager capitalism is rapidly growing, the scholarship is still in its nascency. There are four primary methodological limitations prevalent in the literature that this paper aims to address. First, as the initial analyses of corporate ownership data were largely aspatial, this paper aims to contribute to the growing comparative literature on financialization (Bonizzi, 2013; Engelen and Konings, 2010; Hardie and Howarth, 2013; Karwowski et al., 2020; Karwowski and Stockhammer, 2017; Maxfield et al., 2017; Petry et al., 2023; Rethel and Sinclair, 2014; Torchinsky Landau, 2022) by examining national and transnational financial ownership ties and observing how they vary geographically. Secondly, while most of the existing literature provides generalizations of corporate ownership dynamics based on the analyses of relatively small samples of firms (often limited to specific indices such as the S&P 500), this paper examines all the equity holdings of U.S. institutional investors between 1997 and 2020 and all the available ownership data for all the globally listed companies in 2018. Thirdly, while there is now a growing number of studies which examine the impacts of financial ownership in particular sectors, such as agriculture (Clapp, 2019; Ouma, 2020a, 2020b), real estate (Christophers, 2022; Janoschka et al., 2020; Sanfelici and Magnani, 2023), the fossil fuels and mining industry (Banes and Hager, 2022; Carroll and Huijzer, 2018; Christophers, 2019), and healthcare (Gupta et al., 2021; Strauss, 2021), as of yet, we are still lacking studies that would provide cross-sectoral comparisons of financial ownership. To address this empirical gap, I use firm-level data to develop sectoral estimates for the share of equity owned by U.S. financial firms, including the “Big Three” asset managers—BlackRock, Vanguard, and State Street (Fichtner et al., 2017), in the U.S. and abroad. Finally, as insufficient attention has been paid to the national and transnational power exerted by finance in the global corporate ownership networks, this paper provides a systematic investigation of the extent to which financial firms own capital domestically and globally.
This paper makes several empirical contributions to the emerging literature on asset manager capitalism. First, by examining the SEC 13F filings of U.S. institutional investors and U.S. mutual funds (provided by Thomson/Refinitiv database), I estimate that the share of U.S. equities owned by U.S. institutional investors has increased from 48% to 59% between 1997 and 2020, with all ownership gains attributable to the growth in the equity holdings of U.S. index funds, whose respective ownership share increased from 2% to 15%. During this time, the Big Three have exhibited remarkable growth, increasing the share of U.S. listed companies in which they held investments from 56% to 81%, the share of U.S. listed companies in which they were the largest shareholder (among U.S. institutional investors) from 4% to 40%, and their overall ownership share of the U.S. equity market from 5% from 17%. Beyond being permanent universal owners, I find that the Big Three do not hold proportional investments across all sectors, with their ownership shares ranging from 14% in the information sector to 25% in real estate, highlighting how the rise of the Big Three has been sectorally uneven in the United States.
Expanding on the historical analysis of the shareholders of U.S. listed companies, this paper examines the presence of asset manager capitalism in other countries. Relying on an extensive global corporate ownership dataset provided by Orbis, featuring 262,331 unique shareholders of 39,029 listed companies located in 139 countries, I develop estimates for the share of equity owned by different shareholder groups in nine world regions and across 16 sectors. I find that, as of 2018, 55% of global equity was owned by various financial intermediaries (including 27% by mutual and pension funds), followed by 16% owned by non-financial firms, 6% by government, and another 6% by individuals and foundations, with the remaining 16% of equity not having any identifiable shareholders. While asset manager capitalism is not limited to the United States, its geographical presence is highly variegated. In some countries (e.g. Australia), it is driven by the investment holdings of domestic mutual and pension funds, while in others (such as the U.K.), the largest shareholders are U.S. asset managers. Largely because of the Big Three’s presence in non-U.S. markets, the equity holdings of U.S. investment funds spread far beyond the borders of the United States, enabling them to occupy the core of the global corporate network. The unmatched influence of the Big Three is demonstrated by the fact that they appear as a shareholder in 20% of non-U.S. listed companies, account for 9% of cross-border investments, and own 4% of non-U.S. equity. As the three largest shareholders worldwide, the Big Three are also among the 10 largest shareholders in Europe and East Asia. The Big Three’s investments, however, are largely absent in several world regions, including the Post-Soviet States, the Middle East, Africa, and South and South East Asia, highlighting the importance of stock market indices and index providers in determining where the capital of asset managers gets allocated.
Conceptually, this paper aims to make three broad arguments. First, given that over half of all globally listed companies are now directly owned by financial firms, this paper proposes that finance plays a new role in the global economy as an owner of enterprises, granting financial actors direct forms of influence over the economic activities of these companies. Secondly, as the increase in financial ownership over the past two decades has been driven by the proliferation of index funds, it is argued that the Big Three have come to occupy a position of structural prominence in the global corporate ownership network. As the three largest shareholders in the world, their activities can serve as an indicator of the future developments in the global investment landscape. Thirdly, even though the predominately passive investment strategy of the Big Three renders them universal owners, this paper shows that the Big Three hold investments of disproportionate sizes across not only economic sectors but also world regions. This uneven distribution of investments suggests that the spread of passive investing has resulted in certain sectors and regions becoming privileged sites of investment through their inclusion in the stock market indices. While existing research highlights how asset managers can be geographically selective as active investors, this paper emphasizes that the rise of passive investment has produced a distinctly new, geographically uneven, landscape of global capital flows.
The rest of this paper is structured as follows. In the following section, I identify the three primary mechanisms through which asset managers can exert influence over listed companies, asking whether asset managers hold structural power. In the third section, I describe the two datasets used (SEC 13F filings and Orbis) and compare their respective data coverage and finance ownership estimates. By examining the equity holdings of U.S. institutional investors and U.S. mutual funds between 1997 and 2020, the fourth section documents the rise of asset managers in the United States, overall and across economic sectors. In the fifth section, the paper examines the shareholders of all globally listed companies in 2018 to explore the uneven geographies of asset manager capitalism and document the hegemonic position occupied by the Big Three in the global corporate network. The conclusion discusses the political and economic implications of the age of asset manager capitalism and identifies opportunities for further research.
Structural power of asset managers
While it is widely acknowledged that the ownership of equity today is largely attained through a decentralized process involving the purchase of a company’s share on the stock market (a service that in principle is available to everyone), what has been less problematized is how the corporatization of the U.S. economy and the subsequent rise of financial markets has empowered financial firms to become the central link connecting companies to shareholders and has subsequently led to the centralization (rather than democratization) of capital ownership. The concentration of capital ownership has become so severe that the Big Three now account for 80%–90% of all assets under management (AUM) in U.S. passive equity (Fichtner et al., 2017), having acquired over 21% of the average firm listed in the S&P 500 index (Bebchuk and Hirst, 2022). Concurrently, the largest three index providers (MSCI, S&P Dow Jones Indices, and FTSE Russell) that develop indices used by many institutional investors now hold a combined market share of almost 80% (Burton-Taylor, 2018 cited in Petry et al., 2021). Coates (2018) called this phenomenon the “Problem of the Twelve,” worrying that most of the U.S. listed companies will soon fall under the control of a dozen or fewer people.
The recent concentration in equity ownership has been driven by the exceptional growth of index funds (Backus et al., 2021), which are passively managed investment portfolios tied to particular stock market indices. Because of their much lower overhead costs, index funds can offer management fees 10 times lower than those charged by active funds, making them increasingly attractive to prospective investors (Braun, 2021). While index funds have a passive investment strategy insofar as they passively track the stock market indices in their portfolios, they are not necessarily passive investors when it comes to issues of corporate governance (Iliev and Lowry, 2015). Lacking the threat of exit enjoyed by active investors, index funds rely on other mechanisms to pursue their objectives. In lieu of exiting investments, they have three primary influence channels available to them: (1) proxy voting during annual general meetings, (2) engaging in private, behind-the-scenes communication with companies, or (3) exerting indirect influence on companies through their sheer shareholder presence. 1
With approximately 70% of the shares of retail investors not being voted on, Bebchuk and Hirst (2019a) found that the voting power of the Big Three far outpaces their ownership claims: in 2017 the Big Three collectively owned about 16.5% of the Russel 3000, but they cast approximately 22% of total votes. Extrapolating from past trends, Bebchuk and Hirst (2019a) estimate that by 2038, the Big Three could own 30% of companies in the Russel 3000 index and cast as much as 37% of the total votes. By examining data on the voting margins at the Fortune 250 companies in 2018 and 2019, Griffin (2020) further found that the Big Three already have enough power to determine the outcomes of most shareholder proposals in the largest U.S. companies. Baines and Hager (2022), on the other hand, examined the influence of the Big Three as a shareholder in 55 companies listed within the “Carbon Majors” (Griffin, 2017), finding that of 141 environmental governance resolutions proposed between 2014 and 2021, the votes of the Big Three were pivotal in 42 cases (or 30%), swinging resolutions toward failure in 30 cases (or 21%). While in principle index funds can voice their displeasure with management by voting against either the (re)election of certain board members or the executive compensation increases (Wigglesworth, 2021), in practice the Big Three side overwhelmingly with the management, following their voting recommendations in more than 90% of cases (Fichtner et al., 2017). The Big Three also vote nearly unanimously in support of say-on-pay proposals about the levels of executive compensation (Bebchuk and Hirst, 2019b) and short-terminist governance practices, such as share buybacks and mergers and acquisitions (Fichtner and Heemskerk, 2020). A BlackRock executive in charge of the company’s proxy voting explained their pro-managerial voting position by stating that “meetings behind closed doors can go further than votes against management, and that BlackRock typically gives companies a year to change before casting a dissenting vote” (Krouse et al., 2016, cited in Fichtner et al., 2017).
In addition to being able to sway the voting results on key issues or lend significant support to management’s decisions, Fichtner et al. (2017) suggested that holding such large ownership stakes in a wide range of companies enables the Big Three to exert “hidden” power over the activities of companies in two additional ways: via private engagements with the management of corporations and by encouraging corporations to internalize the objectives of investment funds without needing to provide explicit directives. Examining the proxy votes of mutual funds, Hshieh et al. (2021) found strong evidence that a higher proportion of passive ownership was associated with a higher chance of proposals being accepted for voting, suggesting that passive funds engage in behind-the-scenes communication to influence which agenda items appear during shareholder meetings. While in recent years the Big Three have been committing more resources to expanding their stewardship teams, including hiring more personnel and privately engaging with a wider range of companies, Bebchuk and Hirst (2019b) argued that the size of their stewardship teams (ranging from 12 to 45 people per firm) cannot possibly enable them to actively govern the tens of thousands of companies in which they hold investments. And although the Big Three openly broadcast the aggregate frequency of their private engagements as part of their public relations (Krouse, 2018), Bebchuk and Hirst (2019b) estimated that between 2017 and 2019 the Big Three had annual contact with only 7.5% of their portfolio companies. Through interviews with investor relations (IR) managers, Jahnke (2019: 338) further found that the nature and focus of these private engagements have recently changed with one IR manager describing “a much bigger marketing element to governance.” Bebchuk and Hirst (2022: 1580) thus argued that the reason why the Big Three can claim that their involvement results in notable impacts, despite the number of private engagements remaining low relative to the number of companies in their portfolios, is because “the directors and executives of those portfolio companies believe that the Big Three have significant power and therefore prefer to take the courses of action that the Big Three prefer.” The indirect influence of the Big Three therefore appears to be as important, if not more important, than their private engagements.
Braun (2021) further posited that the compensation structure employed by the Big Three in their index funds makes them less invested in the overall prosperity of their investees compared with other institutional investors with actively managed portfolios. As index funds are expected to pass on any investment gains (or losses) to the ultimate owners of assets, their main source of revenue are management fees, charged as a fixed percentage of AUM. Due to this compensation structure, Braun (2021) argued that asset managers are incentivized to maximize AUM rather than investment returns, which leads them to become universal yet disinterested owners. Christophers (2023) similarly suggested that asset managers overseeing index funds prefer minimal levels of corporate control, making a distinction between an asset manager society, characterized by the growing asset-manager ownership of physical infrastructure (such as housing), and asset manager capitalism, characterized by the growing asset-manager ownership of equity in listed companies. In the former case, asset managers cherry-pick the best investment opportunities and seek out complete control over their investments in order to maximize the asset price when they dispose of said investments in a few years’ time. In the latter case, asset managers benefit from the economies of scale by simultaneously investing in thousands of stocks in perpetuity and spending minimal resources in overseeing their portfolios.
How does this speak to issues of structural power? In the IPE literature, structural power refers to a diffuse and indirect form of institutional power that is exercised by influencing the preferences and the conditions under which other actors make decisions (Guzzini, 1993; Konings, 2007). Strange (1988: 24) defined this concept as “the power to shape and determine the structures of the global political economy, within which other states, their political institutions, their economic enterprises… have to operate.” For Strange structural power entailed setting the agenda that determines the choices of actions available to others (Cohen, 2014). While much of the initial political economy literature attributed the structural power of finance to its ability to threaten to exit investments (Culpepper and Reinke, 2014; Lindblom, 1977), Braun (2022) proposed an alternative theory to explain how finance retained its structural power during the current era of capital abundance. Braun (2022) argued that capital abundance, while weakening the exit-based structural power of finance, strengthens its ownership and control-based power, enabling asset managers to gain more influence through increased voting and diversified ownership. Building on Young (2015), Fichtner et al. (2017) similarly argued that the central position occupied by the Big Three in the global corporate network provides them with structural prominence in corporate governance, potentially giving them disciplinary power over thousands of listed companies. While the current literature highlights that collectively the Big Three already possess enough votes to determine the outcomes of many proposals and are likely to continue increasing their voting power in the decades to come, the current business model of passive asset management makes it somewhat unlikely that the Big Three will be actively overseeing their investments. A more probable interpretation is that the structural prominence enjoyed by the Big Three grants them a unique ability to influence companies in a more indirect manner, compelling firms to internalize their broader objectives. Therefore, although actively governing their investments is not economically feasible for the Big Three, they have acquired a historically unprecedented capacity to potentially exert control over thousands of companies, warranting further research. In the following sections, the paper will explore the scale, scope, and structure of the investment holdings of asset managers to understand the underlying bases of their structural prominence.
Data and methods
To examine the rise of asset manager capitalism in the United States and its global reach, I used two distinct corporate datasets (see Appendix 1 for a comparative overview). For the historical changes in the shareholder composition of U.S.-based listed companies, I examined the SEC Form 13F filings between 1997 and 2020 (provided by Thomson/Refinitiv), which list all equity holdings of U.S. institutional investors (and their mutual funds) with at least $100 million in AUM. To analyze the geographical variation in the composition of shareholders of globally listed companies, I relied on the Orbis database (provided by Bureau van Dijk) to create a dataset of shareholders of all globally listed companies in 2018.
SEC Form 13F data
Thomson/Refinitiv provides information separately for the equity holdings of U.S. institutional investors and U.S. mutual funds with each mutual fund being given an associated parent company from the list of U.S. institutional investors (parent companies are further categorized as either having a passive or active investment strategy). The analyzed dataset contains information on over 14 million distinct equity holdings of 9306 institutional investors and over 13 million equity holdings of 9118 mutual funds (holdings were recorded as of December of each year). With each equity holding being given a CUSIP identifier, I merged Thomson/Refinitiv shareholder data with Compustat firm-level data for all U.S. listed companies with known market capitalization between 1997 and 2020, of which there were 16,364. Combining shares held and value held (in $) information for each equity holding with the number of outstanding shares and market capitalization data provided by Compustat, I estimated the share of each U.S. listed company owned by the Big Three, passive and active U.S. mutual funds, and passive and active U.S. institutional investors. In cases when, for a given firm, the ownership shares added up to more than 100%, I proportionally redistributed the individual equity holdings. In cases when a firm was present in Compustat but had no mentions in the Thomson/Refinitiv database, ownership shares by institutional investors, mutual funds, and the Big Three were assigned zero. Using market capitalization values and companies’ industry classifications, I developed estimates for the weighted share of companies (in each sector and overall) owned by the Big Three, U.S. mutual funds, and other U.S. institutional investors. I also calculated the percentage of companies which had the Big Three and U.S. mutual funds as shareholders in a given year, overall and within each sector.
Orbis data
Orbis aggregates information from hundreds of different sources to offer comprehensive coverage of owners of both listed and privately held firms around the world in addition to providing detailed financial, geographical, and sectoral information about each firm. In 2018, it identified 42,056 globally listed companies with a combined market capitalization of $68.06 trillion. After removing 3027 mutual, pension, and exchange-traded funds from the dataset, the final list contained 39,029 companies located in 139 countries with a combined market capitalization of $64.53 trillion that altogether had 262,331 unique shareholders, featuring 881,075 weighted ownership ties between them and totaling $54.03 trillion in owned equity. To examine how the composition of shareholders varied geographically, each company was grouped into one of nine regions: Northern America, Latin America, Europe (including Turkey), Middle East and North Africa (MENA), Sub-Saharan Africa (SSA), Post-Soviet States (PSS), East Asia, South Asia and South East Asia, and Australia and Oceania (see Appendix 2 for a detailed list of countries with the associated number of listed companies per country/region). While East Asia accounted for the highest number of listed companies—27%, Northern America accounted for the largest share of global equity—42% (see Appendix 3 for the regional distribution of world stock market capitalization). Shareholders were separated into six primary categories: mutual and pension funds (including trusts), other financial firms, non-financial firms, individuals and foundations, government, and other (see Appendix 1 for more information on what fell under each category). Mutual and pension funds and other financial firms were further broken down into U.S.-based, domestic (excluding U.S.), and foreign (excluding U.S.) with a separate category for the Big Three. Using direct and total ownership information provided by Orbis, I estimated the share of each listed company owned by each shareholder group. In cases when the ownership shares added up to more than 100%, I proportionally adjusted the ownership values. Using market capitalization values and companies’ industry classifications, I calculated the absolute size of each investment holding (in $) and estimated the weighted share of companies in a country/region owned by each shareholder group (overall and by sector). I also calculated the percentage of companies in a country/region which had the Big Three or any U.S. mutual and pension funds as shareholders (overall and by sector). Finally, I identified the top 10 shareholders based on the weighted ownership share within each region. While Orbis provides extensive coverage of global firms and their shareholders, 16% of the equity of globally listed companies in its dataset does not have any identifiable owners. With these considerations in mind, Orbis-derived estimates can be used as a lower bound measure of ownership rates.
Comparison of SEC 13F and Orbis
The examined datasets offer complementary information about the nature of asset manager capitalism with the SEC 13F filings providing a historical yet geographically limited view of institutional investors in the United States and Orbis giving a geographically complex yet atemporal snapshot of the shareholders of globally listed companies in 2018. To make the best use of both datasets and understand their respective differences, it was important to ensure that the variable categories used were commensurate with one another. To compare ownership rates by asset managers across both datasets, I estimated the share of listed companies owned by the Big Three and U.S. (mutual) funds. In the Orbis dataset, it was not possible to separate mutual funds from pension funds due to how the data was initially coded. Although mutual funds accounted for the vast majority of entities classified under the category of U.S. mutual and pension funds, because of the inclusion of pension funds, we should expect that the Orbis data will tend to provide higher estimates for “fund” ownership compared to the SEC 13F data. To compare sector-level estimates of ownership rates across datasets, the industry classifications needed to be made commensurate as well. With the equity holdings from the SEC 13F filings only having NAICS codes (extracted from Compustat) and Orbis using NACE codes, I synthesized the two industry classifications to produce 19 distinct economic sectors (see Appendix 5 for a NAICS/NACE correspondence table). After making the shareholder and sector categories commensurate, I compared market capitalization of companies and ownership shares by the Big Three and U.S. funds across sectors for the time-period and geographical area that these datasets have in common—U.S. listed companies in 2018. Appendix 4 plots the distribution of the share of companies owned by the Big Three (top graph) and U.S. funds (bottom graph) across different sectors with SEC 13F data shown in orange, Orbis data in green, and their respective weighted means presented as vertical lines. Text boxes provide information on the weighted means of the Big Three and U.S. fund ownership shares, arithmetic means of market capitalization, and the number of examined companies by sector. Significance levels for the difference in means were calculated using a two-sample t-test for means with unequal variance. While the two datasets are not identical (as demonstrated by differences in their distributions and summary statistics), they are relatively similar. The SEC 13F data includes more firms (4731) with a larger mean market capitalization ($5.77 billion) compared to Orbis (4443 firms with an average market capitalization of $5.67 billion), which could partly explain its lower estimates of both the Big Three ownership share (16.5% for SEC 13F vs 17.5% for Orbis) and the U.S. funds’ ownership share (30.6% for SEC 13F vs 33.8% for Orbis). However, apart from a few sectors (e.g. real estate, information, and agriculture), the sectoral weighted means of ownership shares are mostly within a few percentage points of each other, giving us confidence about the overall reliability of our estimates (at the very least in the U.S. context).
The rise of U.S. asset managers
The decades following World War II saw a structural transformation in the composition of shareholders of U.S. listed companies, first characterized by the rise of private pension funds throughout the 1970s and 1980s, followed by the rapid growth of mutual funds in the early 1990s, and succeeded by the surge of index funds in the 2000s. The ascent of private pension funds ensued following the de-unionization of the American workforce and the subsequent dissolution of defined-benefit plans and their gradual replacement with defined-contribution schemes (Rutterford and Hannah, 2016), whose share—based on number of participants—has grown from 26% in 1975 to 78% in 2020 (U.S. Department of Labor, 2022). By the mid-1980s, however, the share of equity owned directly by private pension funds began to rapidly fall as mutual funds started to gain significant presence in the stock market, surpassing pension funds as the largest shareholder in the late-1990s. Braun (2021) suggested that the rapid growth of mutual funds can be partly attributed to the reorganization of the U.S. investment chain following the introduction of new fiduciary requirements to the Employment Retirement Income Security Act (ERISA) in 1979, which necessitated that pension funds follow the prescriptions of modern portfolio theory in their investment decisions (Montagne, 2013). Following these stricter requirements, from the 1980s onward pension funds were incentivized to outsource the management of retirees’ savings to professional asset managers instead of directly investing in the stock market themselves (van der Zwan, 2017). As a result, retirement assets as a share of all assets managed by mutual funds have grown from 20% to 45% between 1987 and 2018, while the power held by direct investors has shifted from pension funds to mutual funds (Braun, 2021).
The launch of the first index fund by Vanguard in 1976, although initially viewed as a failure by its founder John Bogle, marked the beginning of a major transformation in the asset management industry (Wigglesworth, 2021). As passively managed funds were able to offer both superior returns (S&P Global, 2022) and much lower management fees (Urban, 2018), between 2006 and 2018 over $3 trillion of equity has flown from actively managed funds into index funds (Fichtner and Heemskerk, 2020). And in 2019, for the first time in U.S. history, assets in index-based mutual funds and ETFs have surpassed those in actively managed funds (Gittelsohn, 2019). The almost endless economies of scale present in digital asset management platforms enabled the largest asset managers to benefit from falling expense ratios and expand their control over the U.S. economy at higher rates than their less powerful competitors, leading to the exceedingly high rates of market concentration in the U.S. asset management industry (Haberly et al., 2019).
The historical changes in the composition of shareholders in the U.S. can be seen in Figure 2, which plots the weighted share of U.S. listed companies owned by U.S. institutional investors, U.S. mutual funds, other (i.e. non-mutual fund) U.S. institutional investors, and the Big Three from 1997 (the first year the SEC 13F data was available) to 2020, with each shareholder group further broken down into passive and active investors based on the declared investment strategy of their parent company. I estimate that between 1997 and 2020 the share of U.S. companies owned by U.S. institutional investors has grown from 48% to 59%. During this period, the share of companies owned by passive investors increased from 9% to 26% while the share of companies owned by active investors decreased from 39% to 33%. The 11% increase in ownership by U.S. institutional investors can be alternatively split up into a 14% ownership increase by mutual funds (whose share grew from 17% to 31%) and a 3% ownership decrease by other institutional investors (whose share declined from 31% to 28%). Almost all the post-1997 growth of mutual funds has been driven by index funds, whose respective share increased from 2% to 15%. During this period, the Big Three drastically expanded their ownership of the U.S. stock market from 5% to 17%—a surge which was similarly driven by their passively managed funds. Taken together, all of the ownership increases gained by U.S. institutional investors as a whole since 1997 emanated from the equity holdings of U.S. index funds, and particularly the Big Three.
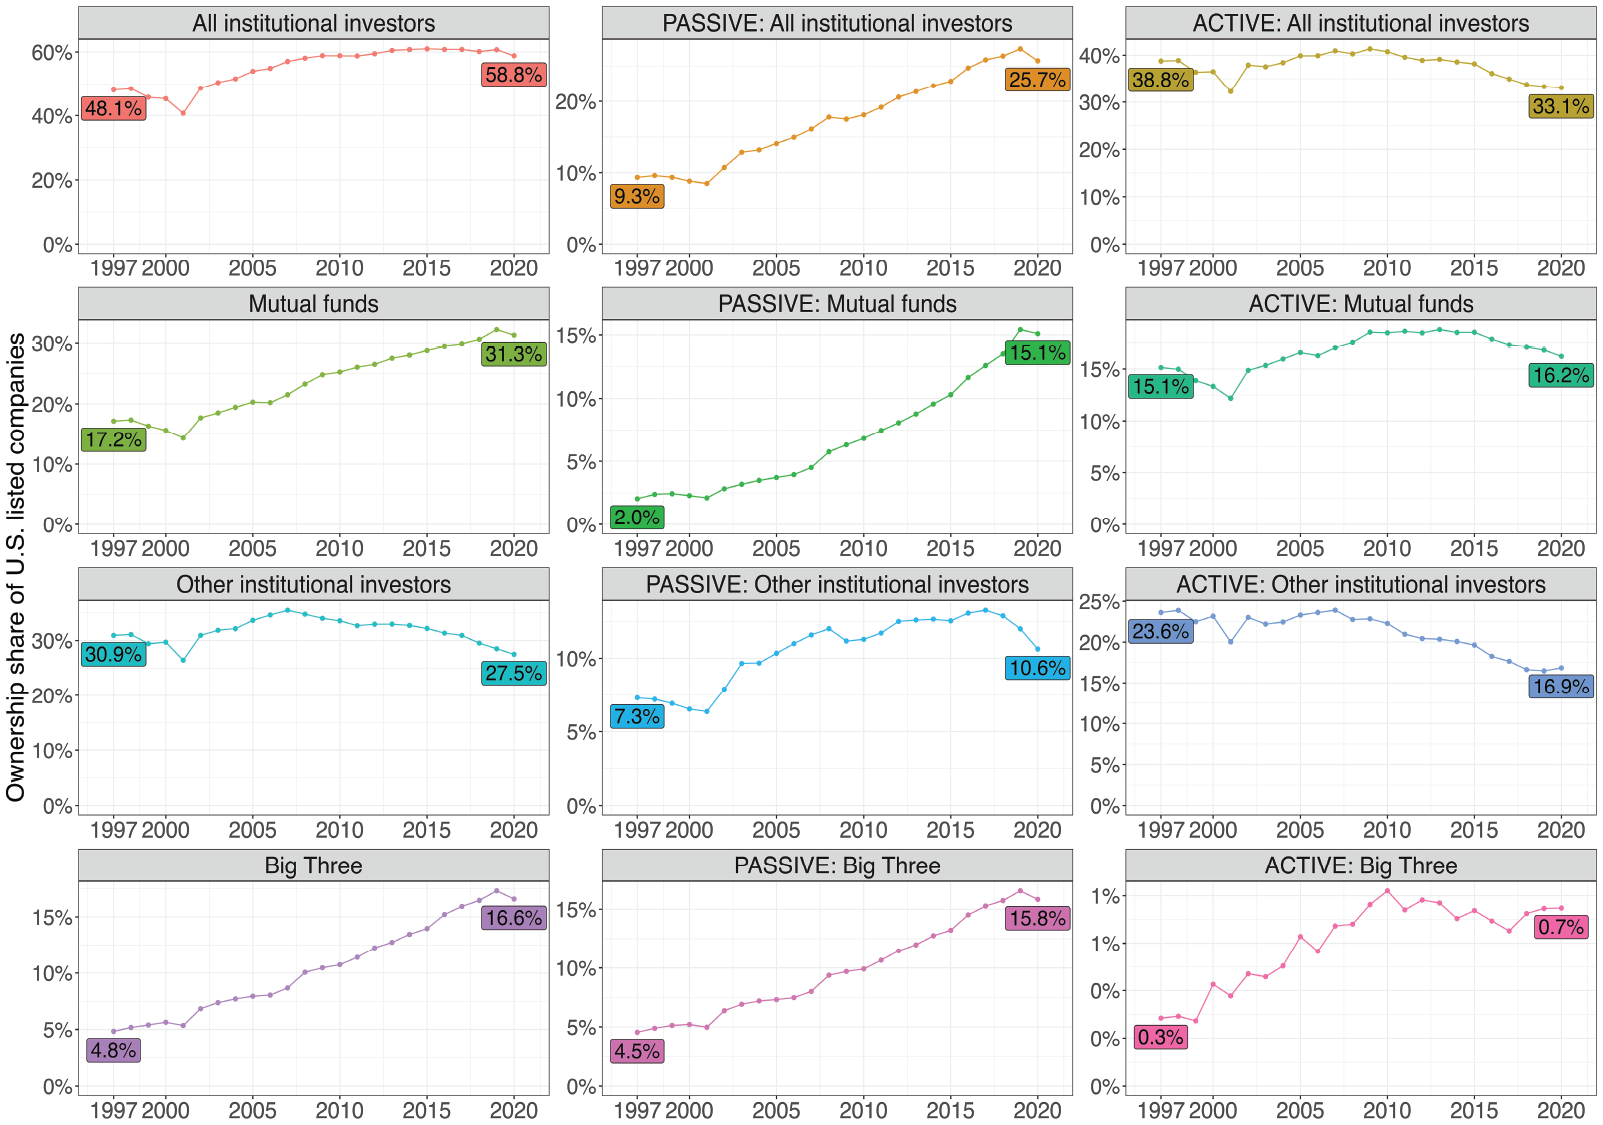
Share of U.S. listed companies owned by different types of U.S. institutional investors, 1997–2020.
Figure 3 provides the breakdown of shareholder composition for U.S. companies across 16 economic sectors in 2000, 2010, and 2020, showing both a significant sectoral variation in the ownership rates as well as non-linear growth during the past two decades. For U.S. institutional investors as a whole most of the gains happened in the first decade, with all sectors apart from mining experiencing increases in institutional ownership between 2000 and 2010, compared to only six sectors which continued to have increases in the following decade. There was also significant reorganization amongst sectors with the highest and lowest rates of institutional ownership during that period. If in 2000 it was the accommodation and mining sectors which had the highest rates of ownership by institutional investors, by 2020 it was the construction and real estate sectors. While for institutional investors as a whole the second decade seemed rather uneventful, once we shift our focus to index funds and the Big Three, the picture radically changes. All 16 sectors experienced significant and approximately linear increases in index fund and Big Three ownership during both the 2000s and 2010s, with the real estate and agriculture sectors experiencing the most notable growth of more than 20% during that time. Overall, differences in the weighted ownership rates by the Big Three have persisted across economic sectors overtime, ranging from 14% in information to 25% in real estate (as of 2020).
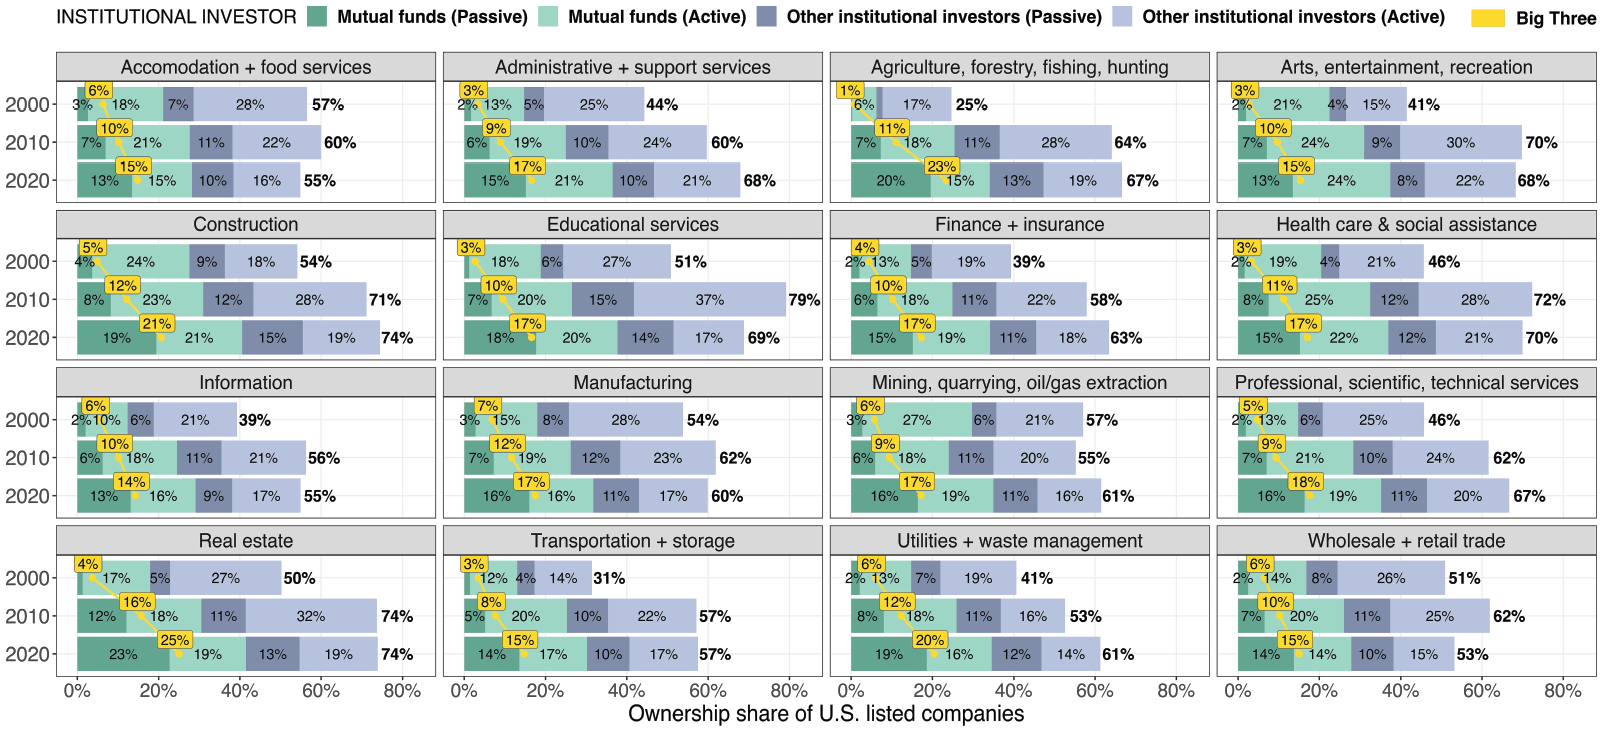
Share of U.S. listed companies owned by different types of U.S. institutional investors, by sector.
Appendix 6 further visualizes the percentage of U.S. listed companies in a given sector which had the Big Three or any of the U.S. mutual funds (including the Big Three) as a shareholder in a given year. Between 2000 and 2020, the Big Three expanded the share of U.S. listed companies in which they held investments from 56% to 81%, showing a notable and accelerating growth in their overall investment penetration. The growth in the shareholder presence of the Big Three occurred across all sixteen economic sectors during both the 2000s and the 2010s. Similar to the sectoral variation present in ownership rates, there is also significant sectoral variation amongst companies which have the Big Three as a shareholder, ranging from 60% of firms in the agricultural sector to 95% of utilities and waste management firms (based on 2020 data). Among U.S. institutional investors, the Big Three by 2020 were also the largest shareholder in 40% of U.S. listed companies (with Vanguard accounting for 21% of companies and BlackRock for the other 19%), a significant increase from only 4% in 2000. In terms of the sectoral composition of the Big Three investments (Figure 4), as of 2020, companies in manufacturing still account for the majority of their AUM—although manufacturing has seen a significant decline from 50% to 41% since 2000—followed by the information (20%) and finance (13%) sectors, with a noteworthy increase in investments in real estate from 0.5% to 5% of AUM between 2000 and 2020. Altogether, the SEC 13F data highlights that the Big Three, while being universal owners with significant holdings across all industries, have highly varying (although continuously growing) levels of ownership and investment penetration in each sector.
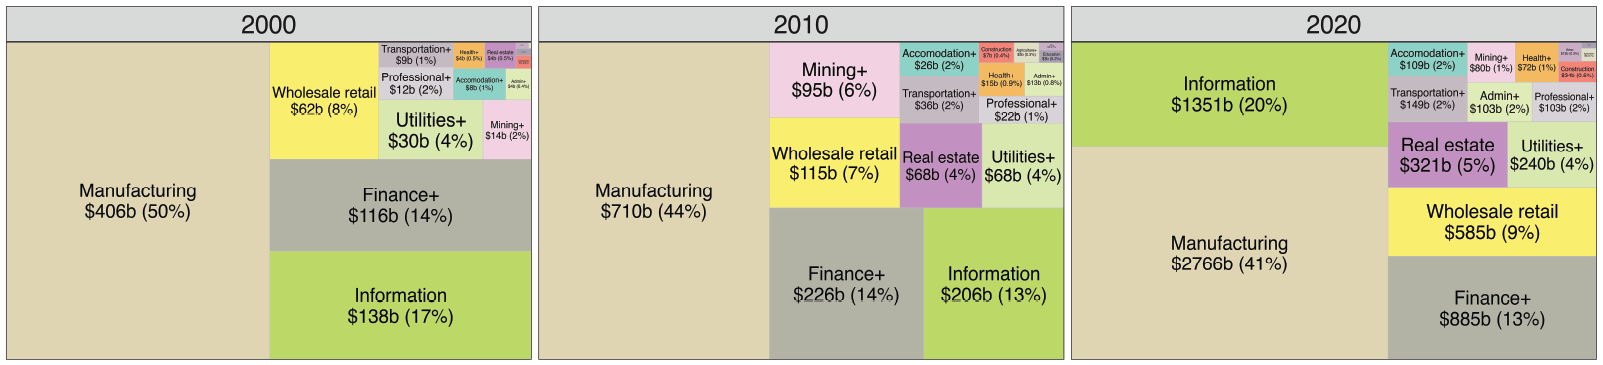
Sectoral distribution of the Big Three’s U.S. investments (in $bil and %), by year.
Uneven geographies of asset manager capitalism
With the rapid ascent of asset manager capitalism in the United States, it is important to understand whether the transformations in the composition of shareholders of U.S. corporations reflect broader shifts in the global economy. Given the inherently global, uneven, and variegated nature of contemporary financialized capitalism (Bonizzi et al., 2021, 2022; Karwowski, 2020; Kvangraven et al., 2021), this section explores the position of asset managers in the United States in comparison with other countries and examines the structural prominence of U.S. funds (particularly the Big Three) as global investors using Orbis data. Vitali et al.’s (2011) examination of the ownership ties of 43,060 transnational corporations was the first systematic attempt to assess who controls the global corporate network. They found that the network had a bow-tie structure, in which 45 predominately American financial firms exerted control over a third of the (mostly non-financial) multinational corporations. Expanding on Vitali et al.’s (2011) influential study, Brancaccio et al. (2018) examined the changes in the ownership concentration of 5515 globally listed companies with at least $1 billion in market capitalization between 2001 and 2016, finding that the global network was highly centralized with the top 2% of shareholders controlling 80% of global economic value and the centralization trend continuing to accelerate after the global financial crisis. Yet, because of their analysis at the level of individual firms, neither study offers insight into how the network structure varies geographically. As there are no available macro-economic global databases of capital owners, cross-country studies of shareholders rely on various firm-level databases (e.g. Orbis, Thomson, Refinitiv) and often derive country-level estimates from relatively small samples of firms.
For instance, La Porta et al. (1999) examined the shareholder composition of 691 corporations located in 27 wealthy economies, finding that at the end of 1995, these firms were largely controlled by families or the state, rather than financial institutions. Two decades later, Peetz et al. (2013: 726) compared the owners of the top 929 industrial corporations in the U.S., Canada, Germany, and Australia, finding “a tremendous financialisation of ownership in the US in particular, but to a lesser degree in other countries.” While Haberly and Wojcik (2017), examining the corporate ownership network of the 205 largest (by sales) firms around the world, discovered a core-periphery structure wherein the network’s center was occupied by a handful of American money managers, enclosed by a geographically heterogeneous state capital periphery dominated by sovereign wealth funds. Fichtner and Heemskerk (2020) further zoomed in on the 3% and 5% blockholdings of the Big Three in globally listed companies, finding that outside of the United States, the Big Three had the strongest presence in the U.K., Japan, and Australia, with significant regional differences between the three funds. The most comprehensive analysis of global capital owners to date has been offered by De La Cruz et al. (2019) who examined the shareholders of the 10,000 largest (out of 41,000 listed) companies. The study found that institutional investors owned 41% of global market capitalization, holding particularly large investment stakes in the U.S. (72%), the U.K. (63%), and Canada (47%). The report also shows that the U.S. was both the largest recipient of cross-border equity investments and the largest owner of companies listed abroad, accounting for almost one-third of total cross-market equity investments globally (De La Cruz et al., 2019: 15). Expanding on the analysis of De La Cruz et al. (2019), Buller and Braun (2021) explicated that while the ownership structures of U.S. companies were dominated by domestic institutional investors, the largest investors in U.K. corporations were U.S. investment funds (BlackRock, Vanguard, and Capital Group) with the share of foreign-owned U.K. capital approaching 50%.
Figure 5 plots the share of globally listed companies owned by different shareholder groups in 2018 across nine regions. The figure illustrates that 34% of U.S. equity is owned by U.S. mutual and pension funds (including the Big Three), while 19% is owned by other U.S. financial firms (banks, private equity and venture capital firms, hedge funds, and insurance companies). Outside of Northern America, U.S. mutual and pension funds own 8% of global equity, having a significant presence in Europe (12%), Australia and Oceania (9%), and East Asia (6%). While many view the U.S. and the U.K. as two “exemplar” financialized economies, the rate of ownership by “domestic” asset managers in the U.K. is significantly lower compared to the U.S., with British mutual and pension funds owning only 9% of U.K. listed companies and other British financial firms owning another 13%. However, once we examine the share of U.K. equity owned by both foreign (including U.S.-based) and domestic financial firms, the ownership share increases to 68%, illustrating the outsized influence of foreign investors in the U.K. stock market. In fact, U.S. financial firms own a higher share (28%) of U.K. equity than do British financial firms themselves (22%), while investments by U.S. mutual and pension funds, spanning 54% of British companies (Appendix 7), account for a shocking 19% of the country’s equity.
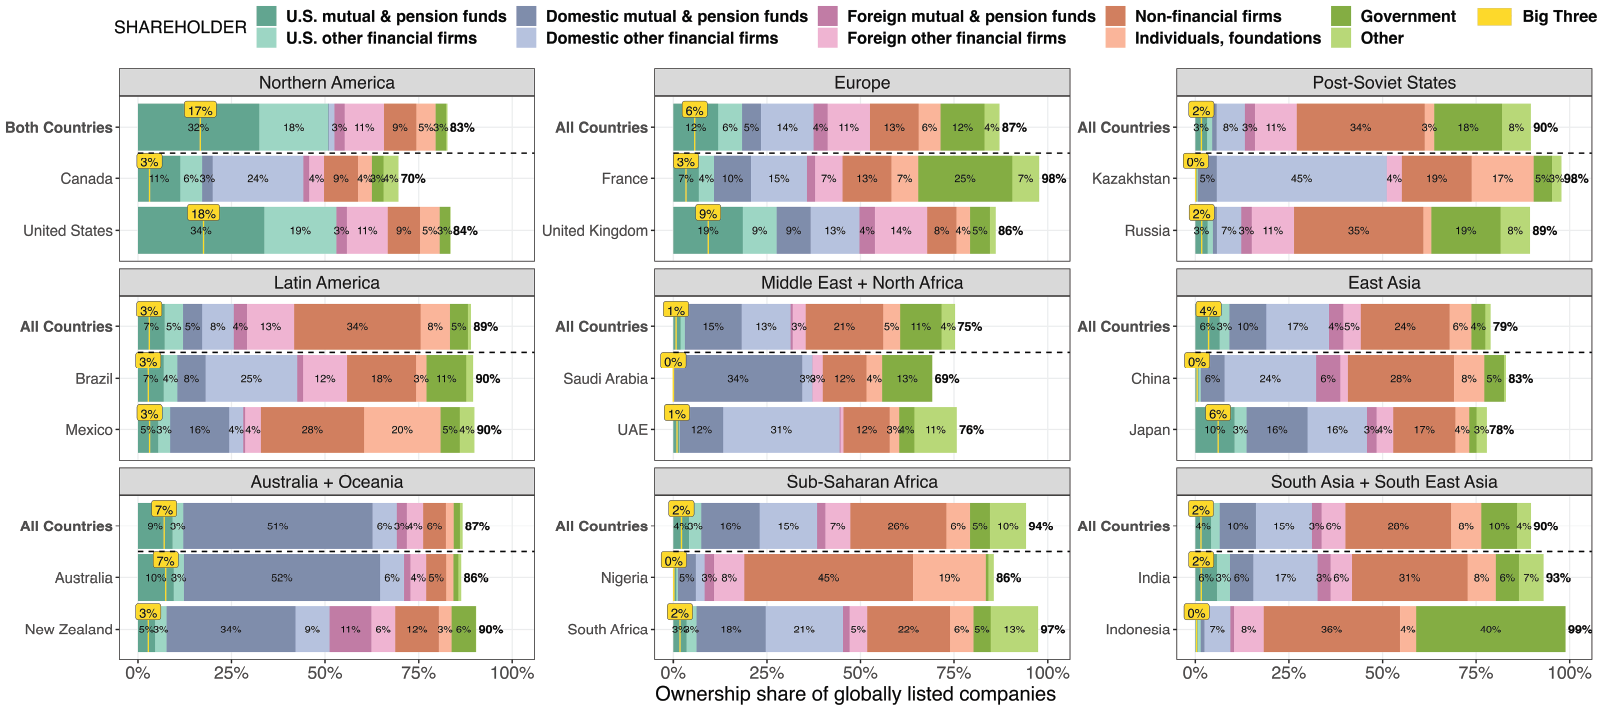
Share of globally listed companies owned by different types of shareholders in 2018, by region.
Over half of the global investments of U.S. mutual and pension funds emanate from the equity holdings of the Big Three, which own 17% of equity in Northern America, 7% in Australia and Oceania, 6% in Europe (including 9% in the U.K.), 4% in East Asia (including 6% in Japan), and 1%–3% in the remaining regions. The Big Three funds constitute the three largest shareholders worldwide and are amongst the top 10 shareholders in Europe and East Asia, with BlackRock and Vanguard also appearing in the top 10 shareholders in Latin America, Australia and Oceania, and South and South East Asia (see Appendix 9). Altogether, with $6 trillion in global equity holdings, the Big Three own 9% of global stock market capitalization. With 26% of their equity portfolio invested outside of the United States (totaling $1.5 trillion), they own approximately 4% of equity in non-U.S. listed companies. In terms of the geographical distribution of the Big Three’s foreign investments (see Figure 6), 46% emanate from Europe (including 17% from the U.K.) followed by 31% from East Asia (including 21% from Japan). Overall, the Big Three hold equity investments in 25% of globally listed companies, including 20% of non-U.S. firms (Appendix 7). Outside of the United States, the Big Three have the highest investment penetration amongst East Asian (31%) and European (24%) companies and the lowest presence amongst companies based in Post-Soviet States (9%), the Middle East and North Africa (9%), and South and South East Asia (8%). This regional variation is likely an outcome of the geographical unevenness present in the stock indices favoring Western Europe, Japan, and certain emerging economies (e.g. FTSE 350 Index, the Nikkei 225 Index, and the MSCI Emerging Markets Index), which the Big Three actively follow (see Petry et al., 2021 for a discussion on how index providers “steer” the capital of asset managers).
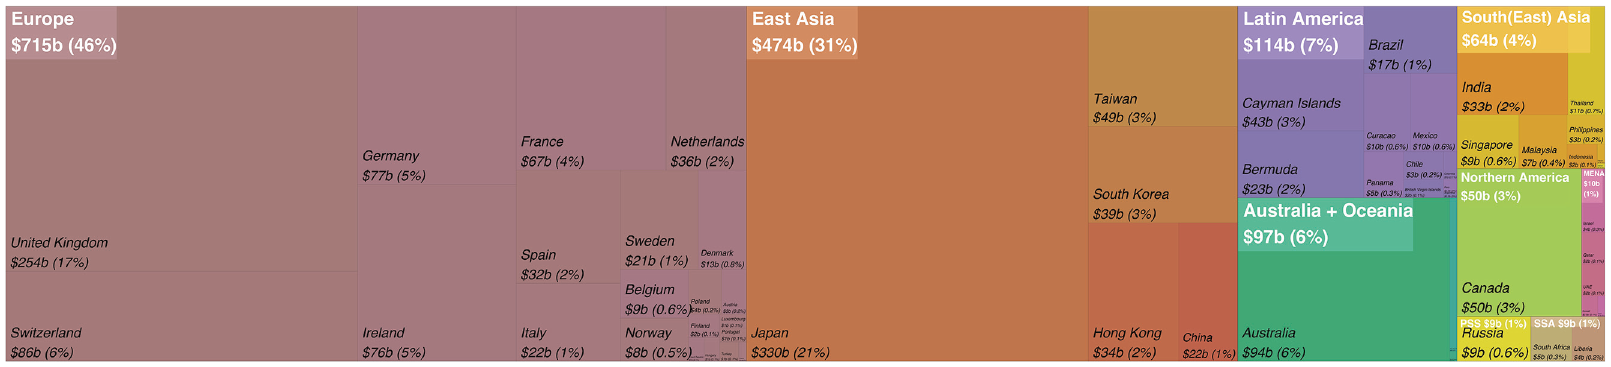
Geographical distribution of the Big Three’s investments outside the U.S. in 2018 (in $bil and %).
Examining the share of non-U.S. listed companies owned by U.S. financial firms across different industries (Figure 7), one notices both notable sectoral and regional variation. U.S. finance owns 22% of non-U.S. companies in the professional, scientific, and technical services sector, which includes firms in engineering and advanced producer services such as law and accounting—a high ownership share largely driven by European firms. It has the lowest ownership share of companies in education (3%) and agriculture (4%). Although in the latter sector, there are a great deal of regional differences with U.S. finance owning 22% of agriculture companies in Canada and close to zero in Europe, the Post-Soviet States, the Middle East and Africa. Looking at the ownership rates by the Big Three, there is very little variation at the sectoral level with their ownership rates ranging between 1% and 6%. However, within each sector, there is significant regional variation. For instance, while the Big Three own approximately only 3% of the non-U.S. companies in real estate, the regional real estate ownership estimates range from 0% in Post-Soviet States to 14% in Australia and Oceania. Overall, geography appears to be a much stronger predictor of the Big Three’s foreign investments in comparison to a firm’s economic sector. In terms of the Big Three’s shareholder presence across industries outside of the U.S., there is more sectoral variation here compared to the Big Three’s ownership rates. The percentage of non-U.S. companies which have the Big Three as a shareholder in a given sector ranges from 11% in agriculture to 30% in transportation (Appendix 8), with the share of companies in the remaining sectors fluctuating around 20%. In comparison with the sectoral composition of the Big Three’s domestic investments (discussed in the previous section), their foreign investments are more heavily skewed toward companies in finance (21%) and mining (7%), while having significantly fewer investments in the information (8%) and wholesale and retail trade (5%) sectors (see Figure 8). At the same time, manufacturing companies, located largely in Europe and Asia, account for the majority of the Big Three’s foreign investments (42%), similar to the share of equity the Big Three invested domestically in the U.S. manufacturing sector.
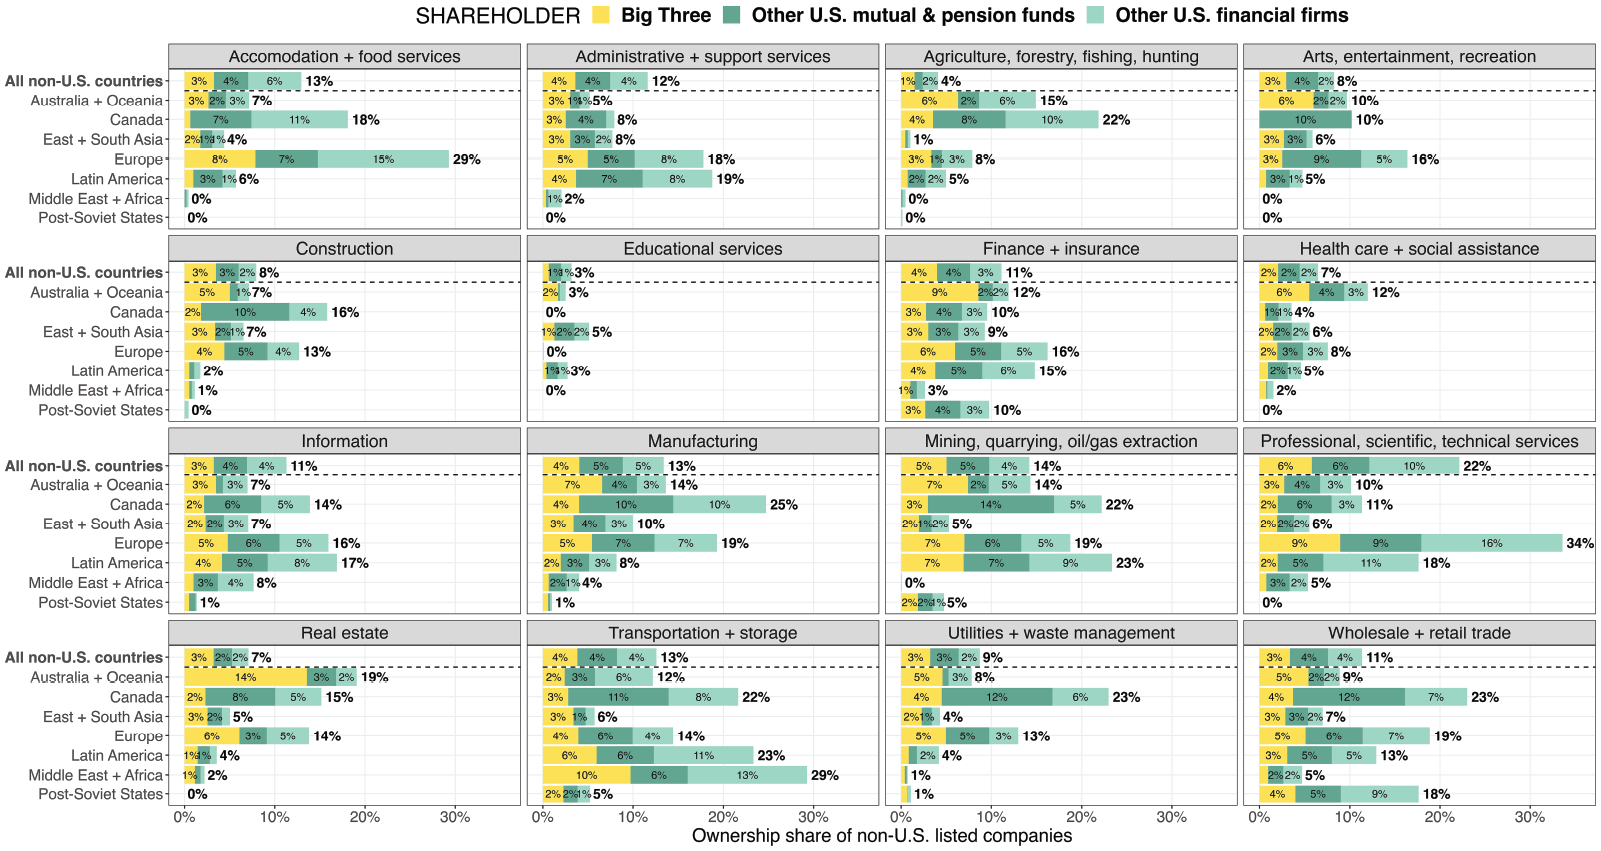
Share of non-U.S. listed companies owned by U.S. financial firms in 2018, by sector.
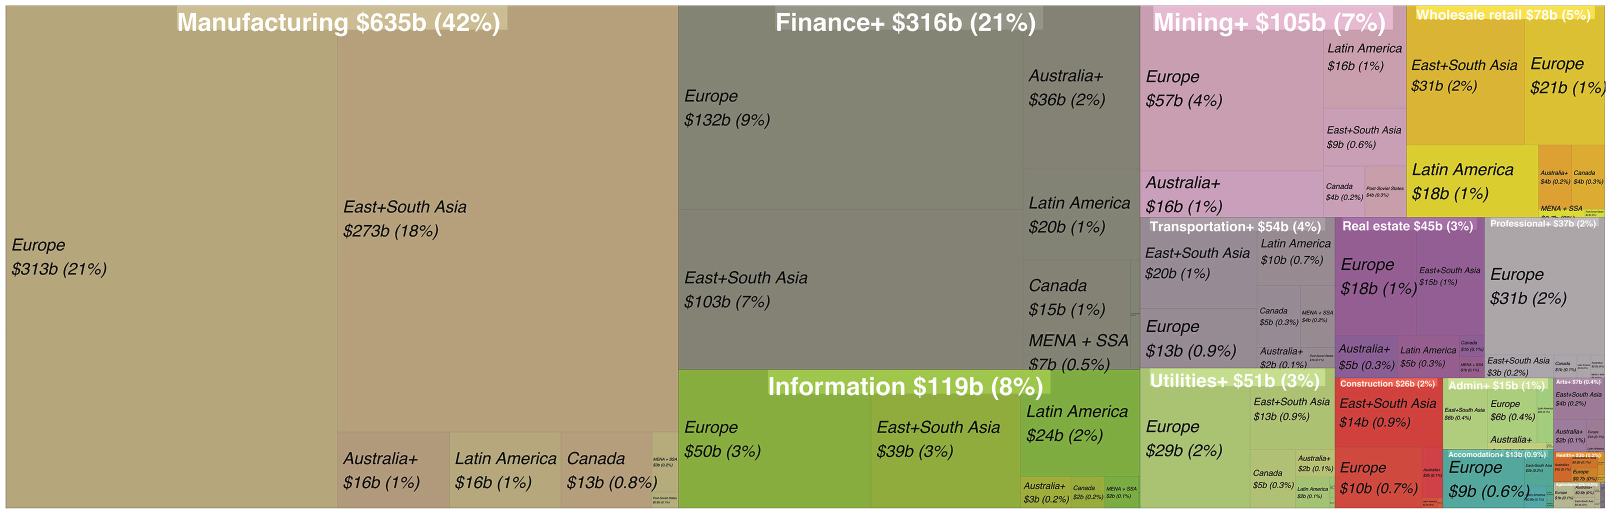
Sectoral and regional distribution of the Big Three’s non-U.S. investments in 2018 (in $bil and %).
In addition to the United States, asset manager capitalism appears to be also very present in Australia and Oceania, with their domestic mutual and pension funds owning 51% of equity in the region (Figure 5). Firm ownership in Australia and Oceania appears to be highly concentrated with investments of HSBC Custody Nominees (Australia), a custodian fund managing assets on behalf of other institutional investors, accounting for 21% of regional equity (Appendix 9). The magnitude of HSBC Custody Nominees is further collaborated by a report published by the Principles for Responsible Investment, which found that in 2020 they were the largest shareholder in 70 companies listed in the S&P/ASX 100, an index capturing the largest 100 companies in Australia based on their market capitalization. 2 The dominance of mutual and pension funds in Australia and Oceania across effectively all sectors can be further seen in Figure 9, which plots investment flows between different shareholder groups and economic sectors in a given region, showing that regional mutual and pension funds in Australia and Oceania have particularly large investment holdings in finance, manufacturing, and mining.

Investment flows between different shareholder groups and economic sectors of a region, 2018.
Figure 9 also shows that regional mutual and pension funds have a notable presence in the Middle East and Africa. Some of the largest shareholders in the MENA region are sovereign-wealth funds, such as Saudi Arabia’s Public Investment Fund and the U.A.E.’s Emirates Investment Authority (Appendix 9). At the same time, a significant share of global equity (16%) is owned by non-financial firms, which are often large conglomerates or holding companies. In Post-Soviet States, for instance, where non-financial firms own 34% of the region’s equity, the largest non-government shareholders are oil and gas companies (Rosneftegaz, Gazprom, BP). In Latin America, some of the largest listed companies are Chinese conglomerates (e.g. Tencent Holdings, Alibaba, Jardine Matheson), legally domiciled in offshore jurisdictions (such as the Cayman Islands) and owned by other non-financial conglomerates (e.g. Prosus) or holding companies (e.g. Jardine Strategic). Government is also a significant investor in several regions, including the Post-Soviet States (owning 18% of regional equity), Europe (12%), MENA (11%), and South and South East Asia (10%). In Indonesia, for instance, the government’s investments account for 40% of the country’s equity. Individuals (including foundations), on the other hand, directly own only 6% of global equity, although they account for significant holdings in certain countries in the Global South such as Mexico (20%), Nigeria (19%), and Kazakhstan (17%).
Figure 10 visualizes the global corporate ownership network of listed companies aggregated at the scale of nine regions and six primary actors: mutual and pension funds, other financial firms, non-financial firms, individuals (including foundations), government, and all other entities. The network illustrates that U.S. mutual and pension funds are the largest shareholder globally, followed by other U.S. financial firms, and other European financial firms. Altogether, financial firms (domestic and foreign) currently own over half of equity (55%) of globally listed companies (including 28% owned by U.S. financial firms) with 27% of global equity directly overseen by mutual and pension funds. While asset manager capitalism appears to be much more of a global phenomenon than previously understood, the global aspect of this has been largely driven by the investment holdings of U.S. asset managers, particularly the Big Three, who are the three largest foreign investors in the world, accounting for 9% of cross-border equity investments globally. The ownership structures of listed companies expose not only how U.S. companies are now increasingly owned by U.S. mutual and pension funds, but also how the ascent of asset manager capitalism in other countries, such as the U.K., has been driven by the world-spanning investment practices of U.S. funds (particularly the Big Three). At the same time, the global geography of U.S.-led asset manager capitalism appears to be highly variegated. The relative absence of investments made by the Big Three in the Post-Soviet States, the Middle East, Africa, and South and South East Asia further highlights the importance of stock indices in determining the regional levels of penetration by asset management firms. With the economic activities of companies mattering a lot less than where the companies are domiciled, asset manager capitalism appears to spread through the geographically uneven stock market pathways created by the index providers. Despite its increasingly “passive” investment approach, asset manager capitalism is actively remaking the geography of global capital flows, privileging regions and sectors which are included in the stock market indices and favored by the index providers. The shift from active to passive investing therefore did not bring about the end of geography, rather the rise of universal ownership, exemplified by the investment practices of the Big Three, is further widening the gap between the heartlands and the hinterlands of global financial markets.
Global corporate ownership network of listed companies in 2018.
Conclusion
In light of the extraordinary profits accrued by U.S. financial institutions since the 1980s, this paper aimed to examine how, when, and why U.S. asset managers have replaced households as the primary shareholder of U.S. corporations, and to explore the uneven and variegated development of asset manager capitalism globally. Using a combination of firm-level data and macro-economic statistics, this paper established that today the U.S. financial sector owns approximately 60% of the U.S. stock market (a 20-fold increase from 3% in 1945). A significant share of these investments is currently held by U.S. index funds which aggregate savings from millions of households into passively managed and highly diversified portfolios. A combination of technological advancements and economies of scale present in digital asset-management platforms, coupled with a series of (de)regulatory changes, resulted in a highly monopolized asset management industry with the Big Three effectively controlling the market for institutional investments. With over half of global equity owned by financial firms, this paper finds that the Big Three are, by a large margin, the world’s largest investors, with significant holdings in Europe, East Asia, and Australia. Although U.S. asset managers are not the ultimate shareholders and thus are not necessarily the primary beneficiaries of their world-spanning investment portfolios, they have acquired a historically unprecedented capacity to potentially exert control over thousands of companies simultaneously. This paper, therefore, aims to show that centering the transformation in ownership structures of firms is crucial not only because it helps us to explain the underlying source of profits accrued by U.S. financial institutions, but also because it enables us to capture the actual influence exerted by finance over the real economy.
The ascent of asset manager capitalism in the United States and its spread in other countries raises several questions about the long-term consequences of this economic transformation and its future developments. While this paper examined the owners of globally listed companies (taking a relatively narrow view of capital), other studies could examine the historical and geographical changes amongst the owners of privately held firms. It is likely that this analysis will illustrate very different ownership patterns, including identifying a much larger role played by governments and individuals. Secondly, future research could explore the broader macro-economic conditions conducive to the high capital growth environment that facilitated the ascent of asset managers in the United States. With new evidence suggesting that a significant share of U.S. equity growth occurred at the expense of labor compensation (Greenwald et al., 2021), more systematic research is needed to examine the precise reasons for the monetary success of U.S. financial markets despite the overall lackluster economic performance of the United States. Thirdly, despite the prevalence of increasingly passive and universal ownership that in principle should be equalizing the spatial distribution of capital, asset manager capitalism has been developing in geographically uneven ways. Therefore, it would be important to understand how the contradictory tendencies toward differentiation and equalization are presently articulated in global financial markets and the role index providers currently play in these processes. Are asset managers just enacting the will of index providers or do they have control over which companies and regions are included in their index funds? Furthermore, with the rapid growth in ESG investments (Archer, 2023), it also would be important to gain a deeper understanding of the long-term priorities of asset managers, how they negotiate competing social, financial, and environmental demands, and through which channels they communicate their various interests. With Vanguard removing themselves from the Net Zero Asset Managers initiative yet still proclaiming a commitment to reducing environmental impacts (Flood et al., 2023), it would be important to understand how asset managers respond to structural crises of capitalism (such as climate change). Finally, as the ownership patterns documented here cannot by themselves be seen as manifestations of asset managers’ corporate control and structural power, further analyses of asset managers’ proxy voting behavior, the nature of their private engagements and the extent of their indirect influence, along with the examination of how their governance approaches vary for U.S. versus non-U.S. companies, are needed.
Footnotes
Appendix
NAICS and NACE correspondence table.
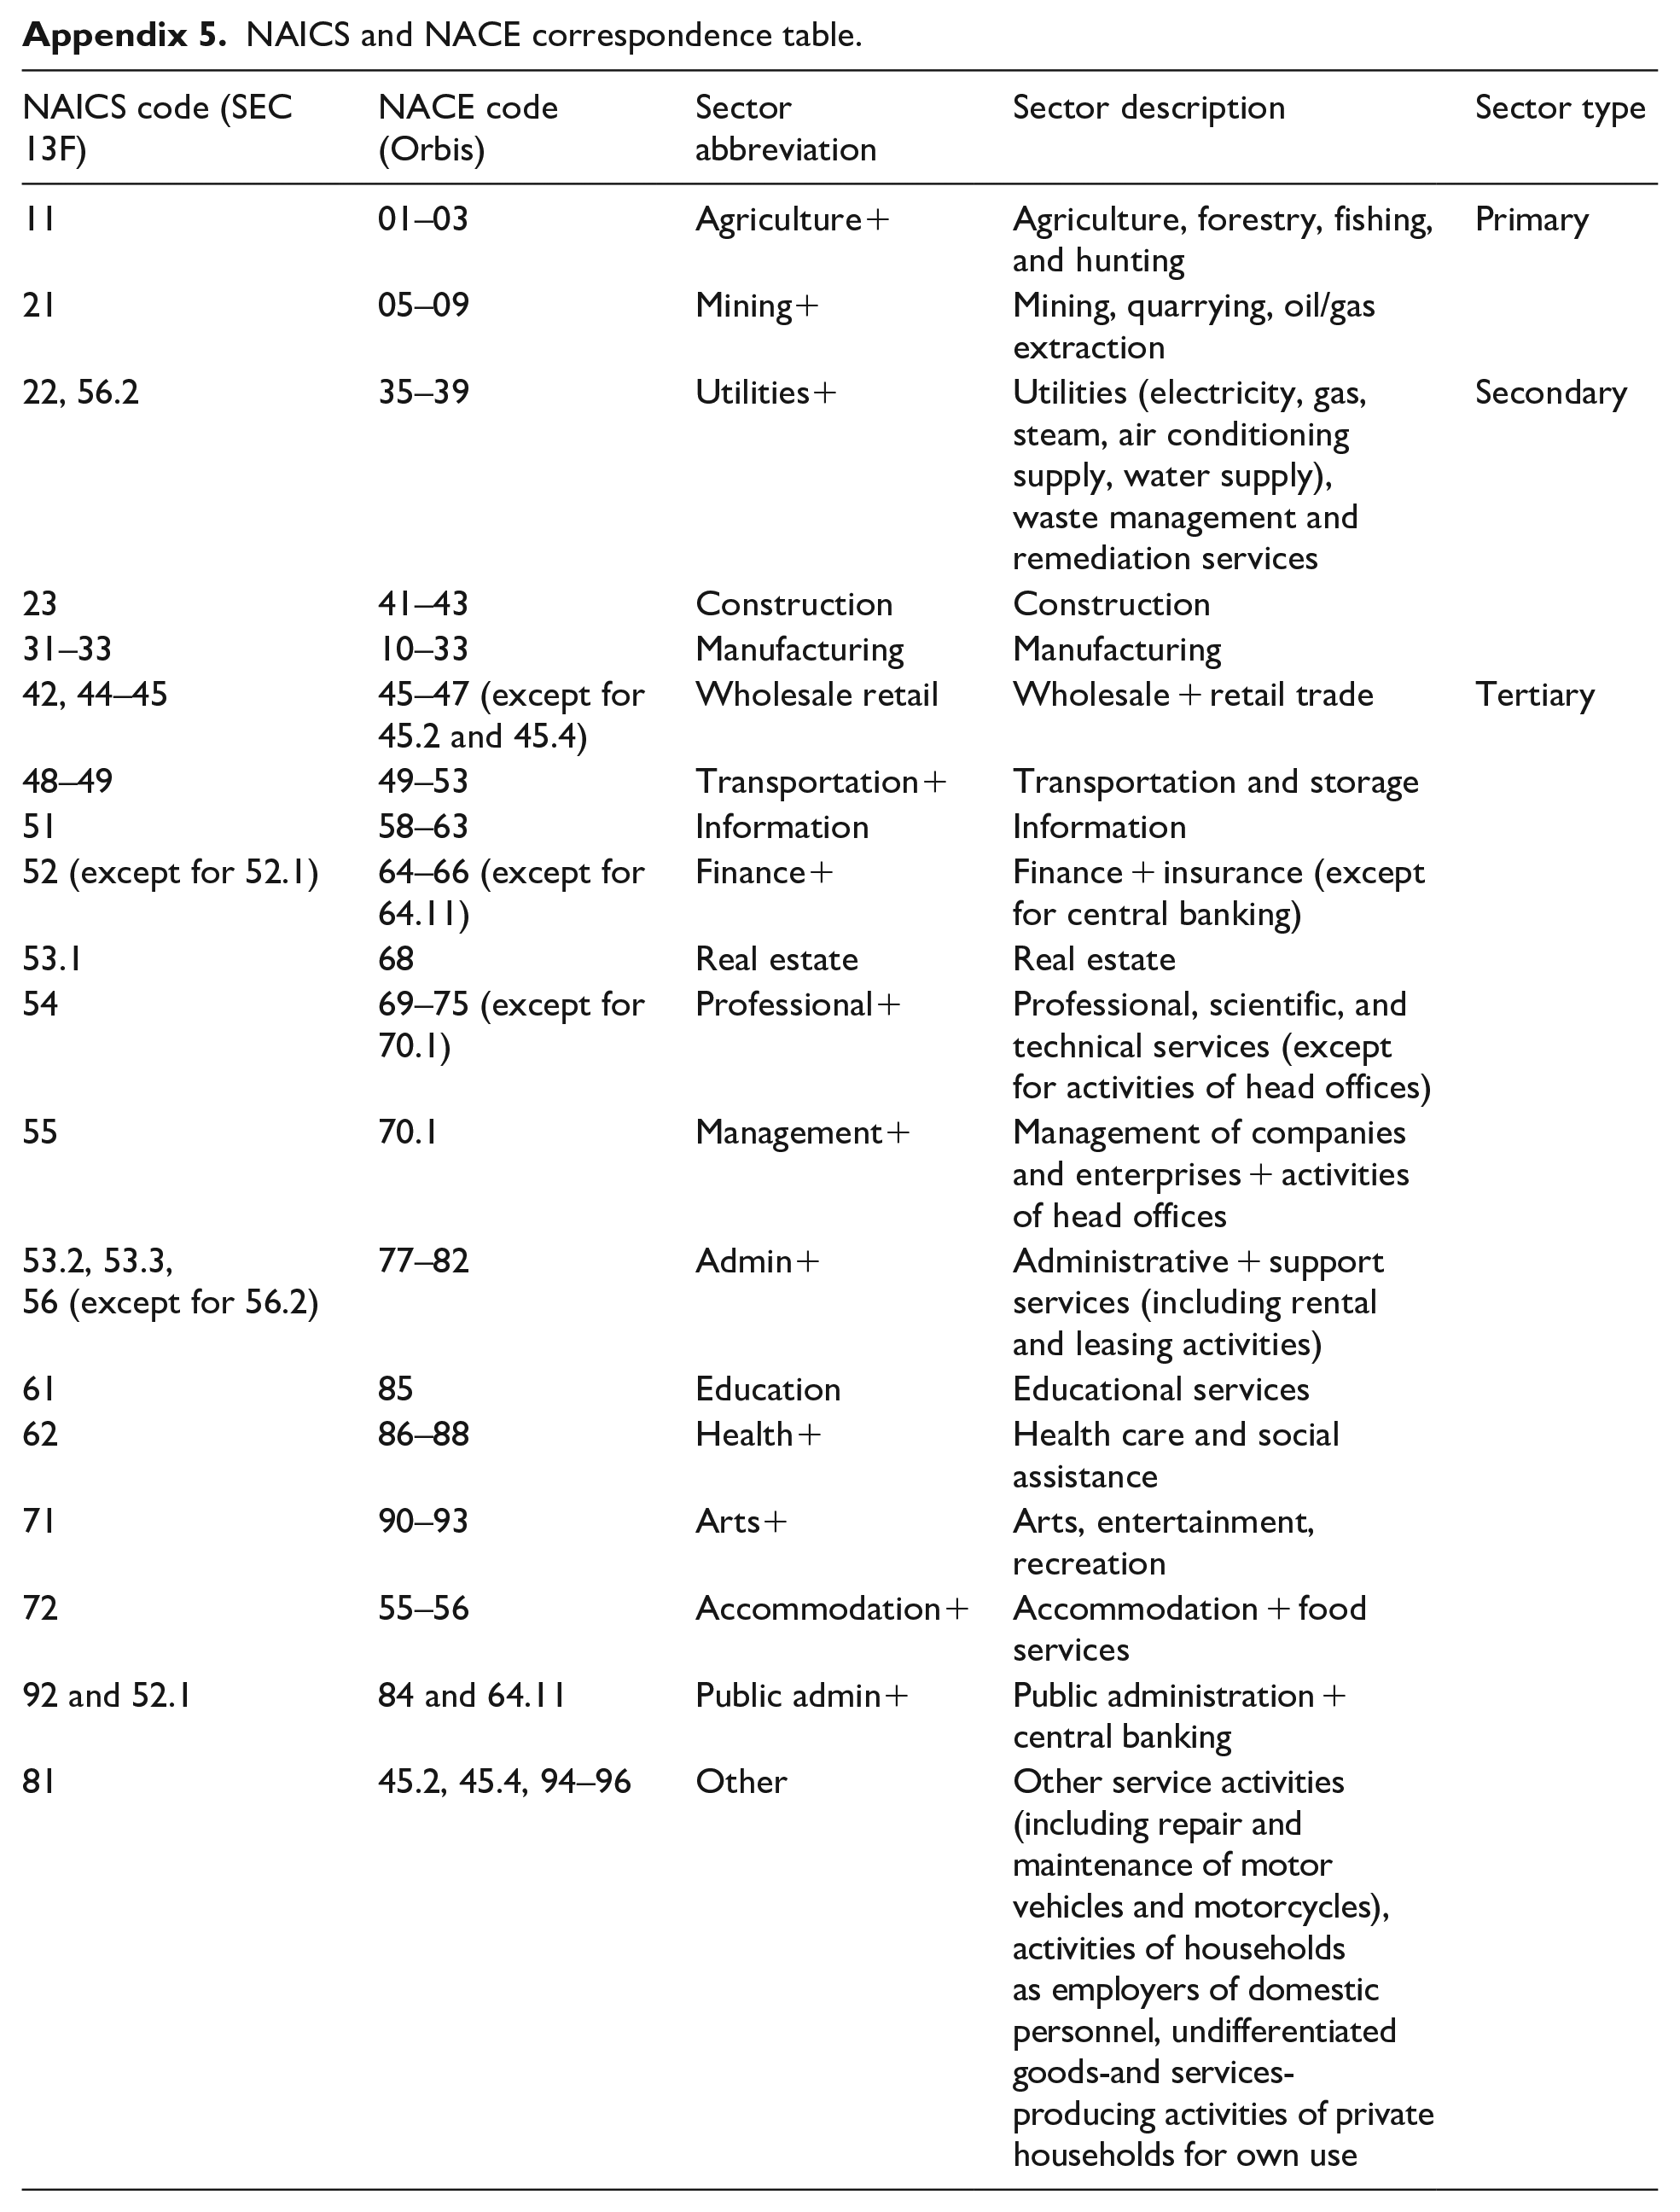
| NAICS code (SEC 13F) | NACE code (Orbis) | Sector abbreviation | Sector description | Sector type |
|---|---|---|---|---|
| 11 | 01–03 | Agriculture+ | Agriculture, forestry, fishing, and hunting | Primary |
| 21 | 05–09 | Mining+ | Mining, quarrying, oil/gas extraction | |
| 22, 56.2 | 35–39 | Utilities+ | Utilities (electricity, gas, steam, air conditioning supply, water supply), waste management and remediation services | Secondary |
| 23 | 41–43 | Construction | Construction | |
| 31–33 | 10–33 | Manufacturing | Manufacturing | |
| 42, 44–45 | 45–47 (except for 45.2 and 45.4) | Wholesale retail | Wholesale + retail trade | Tertiary |
| 48–49 | 49–53 | Transportation+ | Transportation and storage | |
| 51 | 58–63 | Information | Information | |
| 52 (except for 52.1) | 64–66 (except for 64.11) | Finance+ | Finance + insurance (except for central banking) | |
| 53.1 | 68 | Real estate | Real estate | |
| 54 | 69–75 (except for 70.1) | Professional+ | Professional, scientific, and technical services (except for activities of head offices) | |
| 55 | 70.1 | Management+ | Management of companies and enterprises + activities of head offices | |
| 53.2, 53.3, |
77–82 | Admin+ | Administrative + support services (including rental and leasing activities) | |
| 61 | 85 | Education | Educational services | |
| 62 | 86–88 | Health+ | Health care and social assistance | |
| 71 | 90–93 | Arts+ | Arts, entertainment, recreation | |
| 72 | 55–56 | Accommodation+ | Accommodation + food services | |
| 92 and 52.1 | 84 and 64.11 | Public admin+ | Public administration + central banking | |
| 81 | 45.2, 45.4, 94–96 | Other | Other service activities (including repair and maintenance of motor vehicles and motorcycles), activities of households as employers of domestic personnel, undifferentiated goods-and services-producing activities of private households for own use |
Acknowledgements
I would like to thank Luke Bergmann, Benjamin Braun, Jim Glassman, Nick Halme, Annina Kaltenbrunner, Tamara Munzner, Lenore Palladino, Jamie Peck, Arjan Reurink, and Elvin Wyly for their useful comments on previous versions of this paper, attendees of the AAG, Networks 2021, SASE, and ASA paper sessions and the Max Planck’s Managing wealth workshop for their constructive feedback, three anonymous reviewers for their deeply insightful suggestions that radically improved the paper, Katie Nudd for her vital editorial support, and Benjamin Braun and Brett Christophers for organizing this special issue with such thought and care.
Declaration of Conflicting Interests
The author declared no potential conflicts of interest with respect to the research, authorship, and/or publication of this article.
Funding
The author disclosed receipt of the following financial support for the research, authorship, and/or publication of this article: This research was funded by the Li Tze Fong Memorial Fellowship and the Vanier Canada Graduate Scholarship.