
Abstract
Objectives
Insight into the aggressiveness of potential breast cancers found in screening may optimize recall decisions. Specific growth rate (SGR), measured on mammograms, may provide valuable prognostic information. This study addresses the association of SGR with prognostic factors and overall survival in patients with invasive carcinoma of no special type (NST) from a screened population.
Methods
In this historic cohort study, 293 women with NST were identified from all participants in the Nijmegen screening program (2003–2007). Information on clinicopathological factors was retrieved from patient files and follow-up on vital status through municipalities. On consecutive mammograms, tumor volumes were estimated. After comparing five growth functions, SGR was calculated using the best-fitting function. Regression and multivariable survival analyses described associations between SGR and prognostic factors as well as overall survival.
Results
Each one standard deviation increase in SGR was associated with an increase in the Nottingham prognostic index by 0.34 [95% confidence interval (CI): 0.21–0.46]. Each one standard deviation increase in SGR increased the odds of a tumor with an unfavorable subtype (based on histologic grade and hormone receptors; odds ratio 2.14 [95% CI: 1.45–3.15]) and increased the odds of diagnosis as an interval cancer (versus screen-detected; odds ratio 1.57 [95% CI: 1.20–2.06]). After a median of 12.4 years of follow-up, 78 deaths occurred. SGR was not associated with overall survival (hazard ratio 1.12 [95% CI: 0.87–1.43]).
Conclusions
SGR may indicate prognostically relevant differences in tumor aggressiveness if serial mammograms are available. A potential association with cause-specific survival could not be determined and is of interest for future research.
Background
Breast cancer is a heterogeneous disease that can range from rather indolent to life-threatening.1–3 After a breast cancer diagnosis, detailed knowledge of its prognosis is essential to inform patients and make adequate therapeutic decisions. 4 In screening, knowledge about tumor aggressiveness may help the timely detection of those tumors that would otherwise become life-threatening and at the same time reduce the overdiagnosis of tumors that would cause no harm. 5 In either a clinical or screening setting, the growth rate could be measured if serial mammograms, previously acquired in screening examinations, are available and may indicate differences in tumor aggressiveness.
Most existing prognostic models incorporate at least lymph node involvement, histologic grade, and tumor size. 6 When a pathological assessment is not yet available, as in screening, tumor size could also be estimated from mammograms. Not all small tumors would become life-threatening larger tumors if left untreated, but some small tumors possess unfavorable biological characteristics and have a poor prognosis despite their size. Some large tumors with favorable biological features may have a better prognosis than small tumors of the unfavorable type. 7
Therefore we need information beyond size to distinguish aggressive from indolent tumors. While histopathological or molecular analyses may fill this gap, information from mammograms may be valuable as well. 8 If, as for many screened patients, serial mammograms are available, temporal features such as growth rate could be assessed. Overlooked or misinterpreted features that are in hindsight visible on previous mammograms may be related to a patient's prognosis. 9 At diagnosis, such information could be prognostically relevant in addition to histopathological or molecular markers. 10 In screening, it could support radiologists in their referral decisions, as they inevitably have to rely on information that can be obtained from mammograms.
Growth rate is an intuitive marker that has previously been hypothesized to indicate differences in tumor aggressiveness. However, very few studies have been carried out that study the association between growth rate and known clinicopathologic factors or patient outcomes.11,12 Gaining knowledge of such associations is an important first step to determining whether growth rate should be posed as a candidate prognostic marker. Hence, this study investigates the association between specific growth rate (SGR), as calculated from serial mammograms, and established prognostic clinicopathologic factors as well as overall survival in patients with invasive carcinoma of no special type (NST) from a screened population.
Methods
Study population and design
In this historic cohort study, women diagnosed with NST were identified from all women who participated in the Nijmegen screening program (Nijmegen, The Netherlands) between 2000 and 2007. A detailed description of this program, which started inviting women for biennial mammographic screening in 1975 and became part of the nationwide screening in 1989, has been published elsewhere. 13 Women in the study cohort received a biennial invitation to the breast cancer screening program between the ages of 50 and 74 years. At the first visit, screen-film mammograms were made in two views, mediolateral-oblique (MLO) and craniocaudal (CC). Contrary to current screening practice, the CC view was only made on indication in subsequent screening visits (e.g. because of dense glandular tissue).
A flowchart showing the selection of breast cancer patients to be analyzed in this study is presented in Figure 1. The screened population gave rise to 635 breast cancer cases, of whom 439 were diagnosed with NST, 88 with invasive lobular carcinoma (ILC), 64 with ductal carcinoma in situ (DCIS), and 44 with other types of breast cancer. In this study, we looked at patients with NST only as it is the most common type of breast cancer and it presents as a discrete mass in approximately 70% to 75% of cases, allowing for direct measurement of tumor size, whereas patients with ILC often show more subtle mammographic changes, for example, architectural distortion.14,15 From the 439 NST cases, 94 were excluded because cancer did not present as a mass (but as calcifications only, architectural distortion, or asymmetry). Another 52 patients were excluded because their mammograms could not be traced. 16
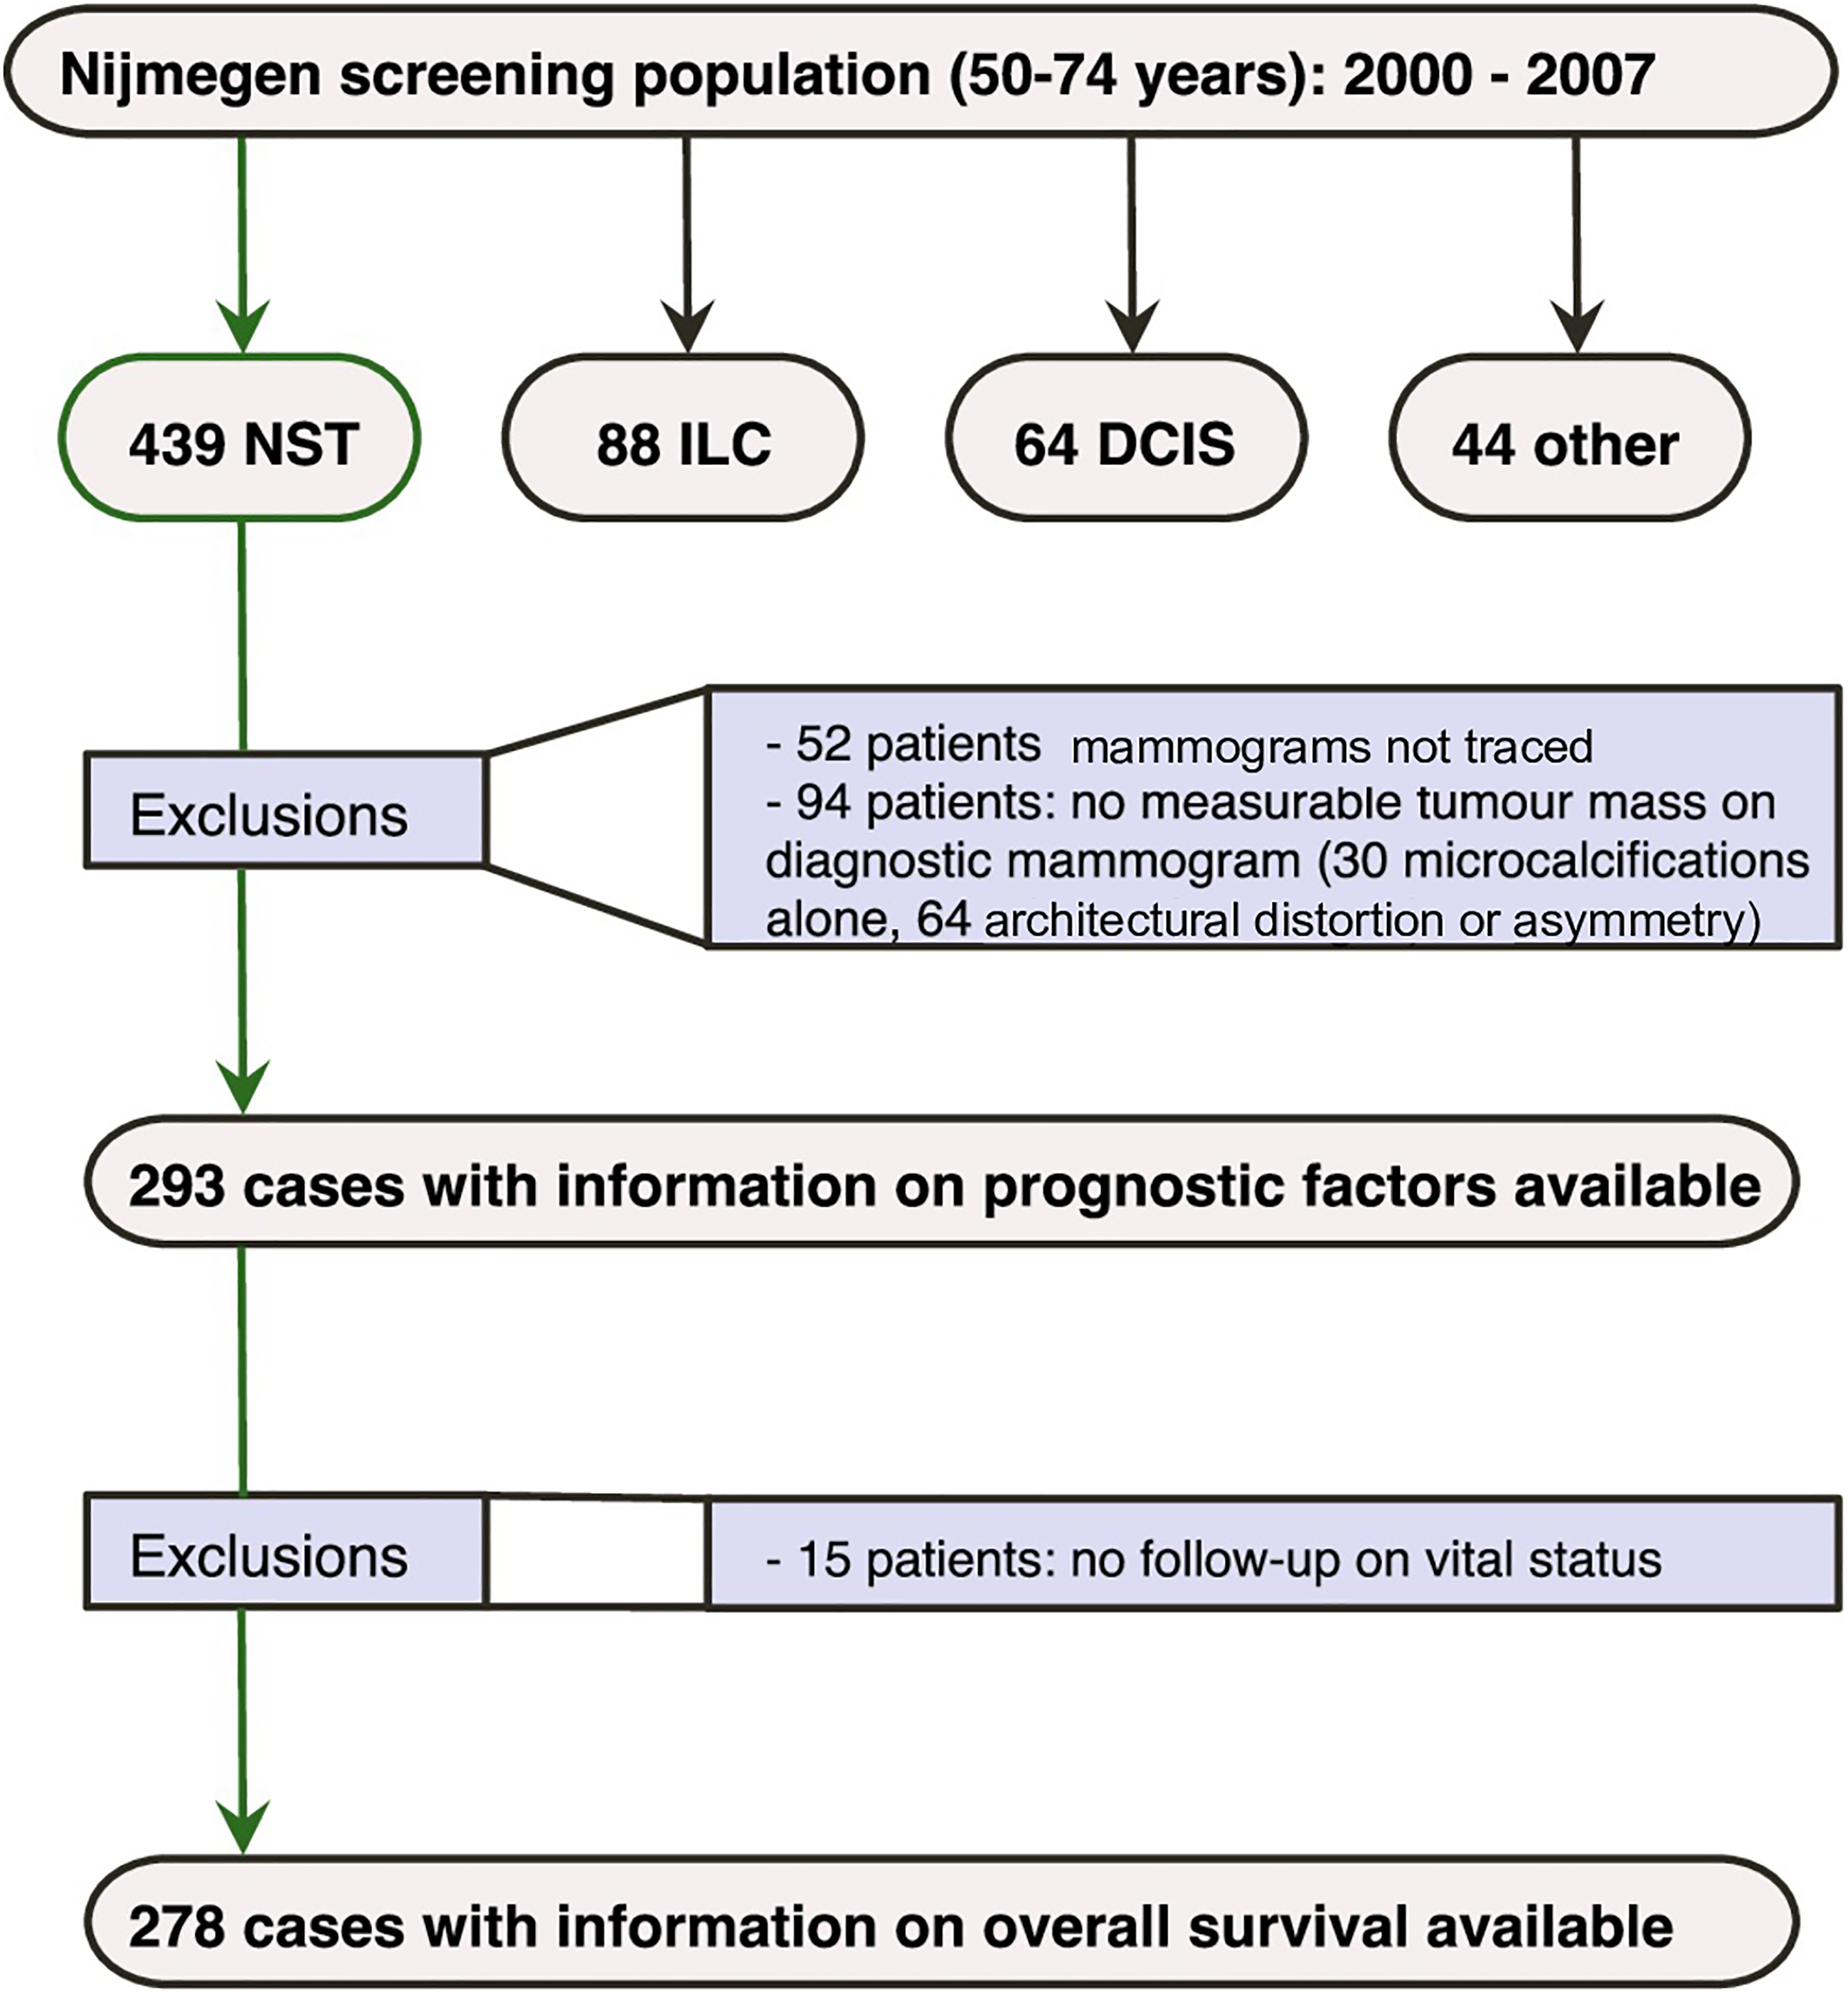
Flowchart showing the selection of 293 NST cases that have been used for analyses.
Ethics approval and consent to participate
This study was conducted in accordance with the declaration of Helsinki and the Code of Conduct for the Use of Data in Health Research (see https://www.federa.org/codes-conduct). The Central Committee on Research involving Human Subjects (METC Oost-Nederland) has declared that approval from our local Institutional Review Board for this study with no extra burden for participants is not required according to the Dutch Medical Research Involving Human Subjects Act. No explicit written or verbal informed consent was obtained, as consent was obtained through an opt-out procedure that exists in the Dutch national breast cancer screening program. Women who participated in the breast cancer screening program were informed in writing about the use of personal data for research and had the opportunity to object to this by filling out a form or otherwise automatically consent by participating in screening. In this study, no data were used of women who objected to the use of their data.
Information on clinicopathologic factors and follow-up for vital status
Information on a range of established prognostic factors could be derived from patient files for 293 of the NST cases. These included age at diagnosis and tumor characteristics (screen-detected or interval cancer, palpability, pathologic size, histologic grade, mitotic activity index (MAI), axillary lymph node involvement, number of positive lymph nodes, and estrogen/progesterone receptor (ER/PR) status).
The nine municipalities in which the patients lived were contacted to gather information on vital status and duration of follow-up until December 2019. As one municipality did not participate in our study, follow-up was not possible for 15 patients and hence information on overall survival was available for 278 NST cases.
Measurement of tumor size and calculation of tumor volume
Tumor size was determined on the diagnostic mammogram, the last screening mammogram, and the penultimate screening mammogram. For screen-detected cancers, the last screening mammogram was the positive mammogram that prompted a referral to a hospital and usually preceded the diagnostic mammogram by a few days or weeks. For interval cancers, the last screening mammogram was the last negative screening mammogram, which preceded the diagnostic mammogram by a median of 16.9 (interquartile interval (IQI) 13.0–21.7) months. The penultimate mammogram was made a median of 24 months (IQI 23.5–24.6) months before the last screening mammogram for both screen-detected and interval cancers. Tumor size was measured on mammograms in MLO views, as CC views were only available for ∼50% of the cases. On each mammogram, a researcher and a research assistant determined the longest axis of the tumor (length) and the diameter perpendicular to the longest axis (width) by consensus. In case of disagreement, a screening radiologist was consulted. For 55 out of 223 screen-detected cancers, no diagnostic mammogram was available. Here, tumor volume at diagnosis was assumed to be equal to that at the screening mammogram that prompted referral given the short time in between. For patients with multiple visible masses (N = 54) the largest mass was measured. For 24 out of 70 interval cancers, no diagnostic mammogram was available. Here, the diameter at diagnosis as annotated in the patient file was used for both length and width. The lengths measured on the available diagnostic mammograms (N = 214) showed excellent agreement with the diameter as annotated by the radiologist (intraclass correlation coefficient = 0.94 [95% confidence interval (CI): 0.93–0.96]).
For 60 patients, no measurable tumor mass could be observed on either the screening mammogram prior to diagnosis (for interval cancers) or the penultimate screening mammogram (for either screen-detected cancers or interval cancers) and it was assumed that the tumor was too small to be visible. In such cases, both tumor length and width were set to be equal to a threshold value above which the tumor would have been visible. As the density of surrounding breast tissue greatly influences tumor visibility, this threshold value was equal to the smallest observed tumor size in all mammograms with similar density.
17
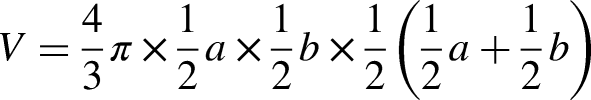
Breast density was assessed using Wolfe's categories and classified as having densities that occupy <25% of the breast area (Wolfe's N,P1) or over 25% of the breast area (Wolfe's P2,Dy), which correlates well with the 4th edition of the American College of Radiology Breast Imaging Reporting and Data System classification for breast density.18,19 Tumor volume was estimated for each mammogram assuming a spheroid tumor shape, by the following formula:
Statistical analysis
Comparison of growth functions and calculation of SGR
We compared the fit of five growth functions to describe the relationship between volume and time, as it is unknown which function characterizes the growth of breast tumors best.20–22 To compare fits, at least three measurements were needed, which is why only 70 patients with interval cancers were used. The following functions were considered and fit using non-linear mixed effects models: exponential, power law, Gompertz, Von Bertalanffy, and generalized logistic growth. 23 Formulas are given in Supplemental Table S1. Three equations all assume that a tumor could not grow beyond a carrying capacity (Vmax), which was set at 1000 cm3 based on the preceding literature. For each patient, the volume measured on the penultimate screening mammogram (V0) was treated as a fixed variable, volume as the dependent variable, SGR as a random independent variable that can vary between patients, and scaling exponent α as a fixed independent variable to be estimated for the power-law function. The goodness of fit of these five models was compared by calculating weights based on Akaike's information criterion, modified for small sample sizes, that express the probability that a model is the best model, given the data and the models under consideration.24,25
Based on the best-fitting growth function (power law, see Supplemental Table S1), SGR was then calculated by linearly regressing Vα on time and dividing the slope of the regression line by α for each patient. Here, α is a constant scaling exponent that is characteristic of the power law growth function and was estimated to have a value of 0.18. For analyses of associations between SGR and prognostic factors or overall survival, SGR was standardized.
Associations between SGR and established prognostic factors
As a summary measure that distinguishes patients with good, moderate, or poor prognosis, the Nottingham prognostic index (NPI) was calculated, using the pathologic tumor size, number of lymph nodes involved, and histologic grade. 26 Furthermore, patients were, based on histologic grade and hormone receptor status, classified as having a favorable (grade I and ER+ and/or PR+), intermediate (grade I and ER- and PR-, grade II and ER+ and/or PR+, grade III and ER+ and PR+) or unfavorable (grade II and ER- and PR-, grade III and ER- and/or PR-) biologic breast cancer subtype. 7 To study the association between SGR and NPI, linear regression was used, for which core assumptions (linearity, normal distribution, and homoscedastic residuals) were met, based on visual evaluation. The association between SGR and other continuous prognostic factors (age, tumor volume at diagnosis, and MAI) was also studied by linear regression, yielding regression coefficients and 95% CIs. Associations between SGR and categorical prognostic factors (biologic subtype, breast density, palpability, histologic grade, lymph node involvement, ER status, and PR status) were studied by (polytomous) logistic regression, yielding odds ratios (ORs), and 95% CIs.
Associations between SGR and overall survival
The association between SGR and overall survival (after diagnosis) was first assessed with Kaplan–Meier curves after categorizing SGR into slow, intermediate, or fast-growing tumors. Secondly, SGR was used on a continuous scale in a Cox regression model, yielding hazard ratios (HRs) and 95% CIs. The proportional hazard assumption and nonlinearity were evaluated by scaled Schoenfeld residuals and martingale residuals, respectively, and did not show violations. A directed acyclic graph was constructed by the authors based on the existing literature on growth rate and breast cancer prognostication and in consultation with other experts in the IMAGINE consortium. The graph was constructed using open-source software, to identify a minimal sufficient adjustment set of variables that were added in a multivariable Cox regression model to estimate the total confounding-adjusted effect of SGR on overall survival.27,28 Assuming the causal structure presented in Supplemental Figure S1, adjustments were made for age at diagnosis, MAI, histologic grade, and ER and PR. In an additional analysis, mammographic tumor volume at diagnosis was added to the multivariable model, as it could, such as SGR, serve as a proxy for tumor aggressiveness that can be measured on mammograms. This analysis provides information on a potential association between SGR and overall survival that is not explained by volume at diagnosis as an intermediary variable. Detailed information on the goodness of fit of all regression models is provided in Supplemental Table S2.
Sensitivity analyses
The impact of setting a threshold value for tumor volume on a previous mammogram without an observable mass for 60 patients was assessed by repeating all analyses, assuming a volume of 0 cm3 for these tumors instead (see Supplemental Table S3). Although the time period from tumor onset to screen-detectable breast cancer cannot be observed, it can be derived from previously reported tumor volume doubling times that it may take longer than the time between two screening examinations. 29 Setting tumor volume on mammograms without an observable mass to their threshold value for detectability therefore provides a lower bound of tumor growth rates for these cancers, while the sensitivity analysis of assuming 0 cm3 provides an upper bound of tumor growth rates. By evaluating whether the conclusions of this study are similar in both situations, we also assume that this is true if the actual tumor volume of mammographically invisible tumors lies between 0 cm3 and their detectable size. The impact of different assumptions regarding tumor shape (cylindric or spherical instead of spheroid) on results was also assessed. Both the main analyses and sensitivity analyses were performed using R version 3.6.3, using packages nlme, lm, glm, and coxph. Hypothesis testing was two-sided with a significance threshold of 0.05.
Results
Baseline characteristics
Table 1 presents baseline characteristics for the 293 patients with NST. Of note, 223 cancers were detected through screening and 70 were interval cancers. Most patients had an intermediate biologic subtype of breast cancer and the median NPI (4.1) indicates a moderate prognosis. 30
Baseline characteristics for 293 screened women diagnosed with invasive carcinoma of no special type.
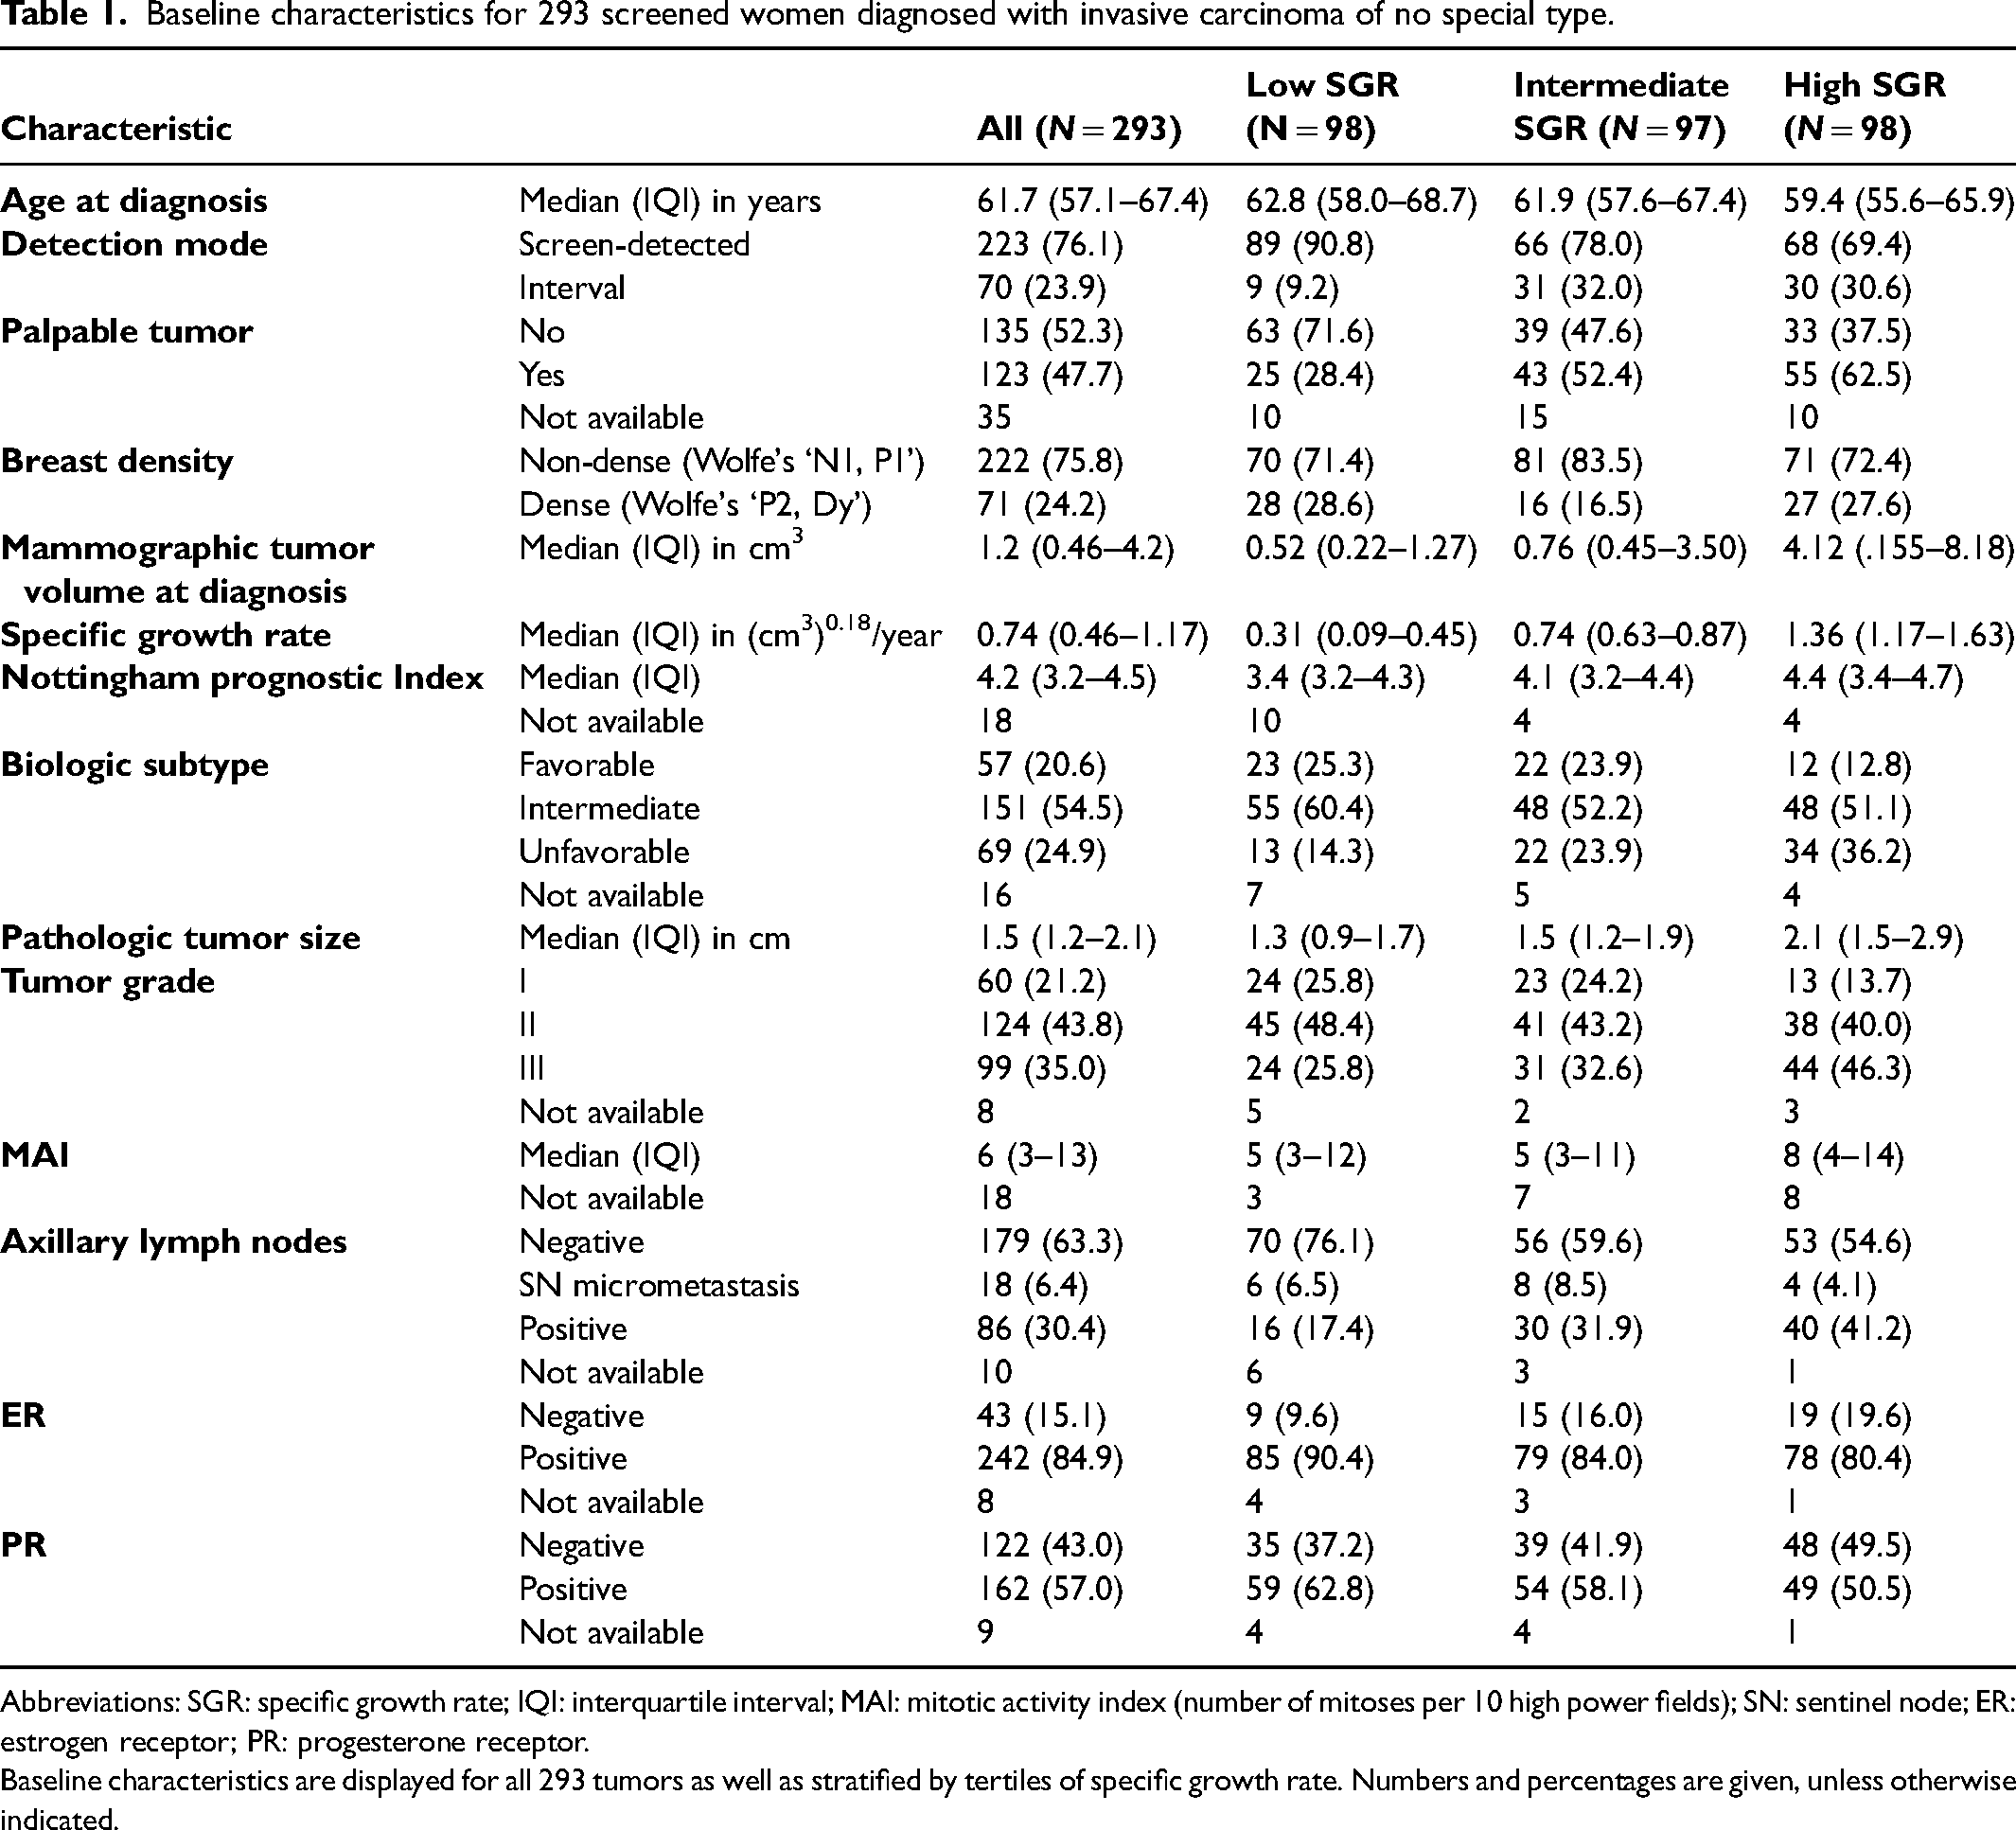
Abbreviations: SGR: specific growth rate; IQI: interquartile interval; MAI: mitotic activity index (number of mitoses per 10 high power fields); SN: sentinel node; ER: estrogen receptor; PR: progesterone receptor.
Baseline characteristics are displayed for all 293 tumors as well as stratified by tertiles of specific growth rate. Numbers and percentages are given, unless otherwise indicated.
Five different growth functions were compared based on Akaike weights (see Supplemental Table S1). A power-law function with an estimated exponent α of 0.18 fitted best to the growth of 70 tumors with three measurements available, compared to the other functions, given its Akaike weight of >99%. Using this function to calculate SGR for all patients, the median SGR was 0.74 [IQI 0.46–1.17] (cm3)0.18/year. Using only the 233 cases where the tumor could be observed on all mammograms, the median SGR was 0.68 [IQI 0.43–1.10] (cm3)0.18/year. Figure 2 shows the distribution of SGR for screen-detected and interval cancers separately, where interval cancer growth rates are shifted to the right, implying faster growth. Median SGR was 0.93 [IQI 0.62–1.33] (cm3)0.18/year for interval cancers and 0.69 [IQI 0.40–1.09] (cm3)0.18/year for screen-detected cancers.
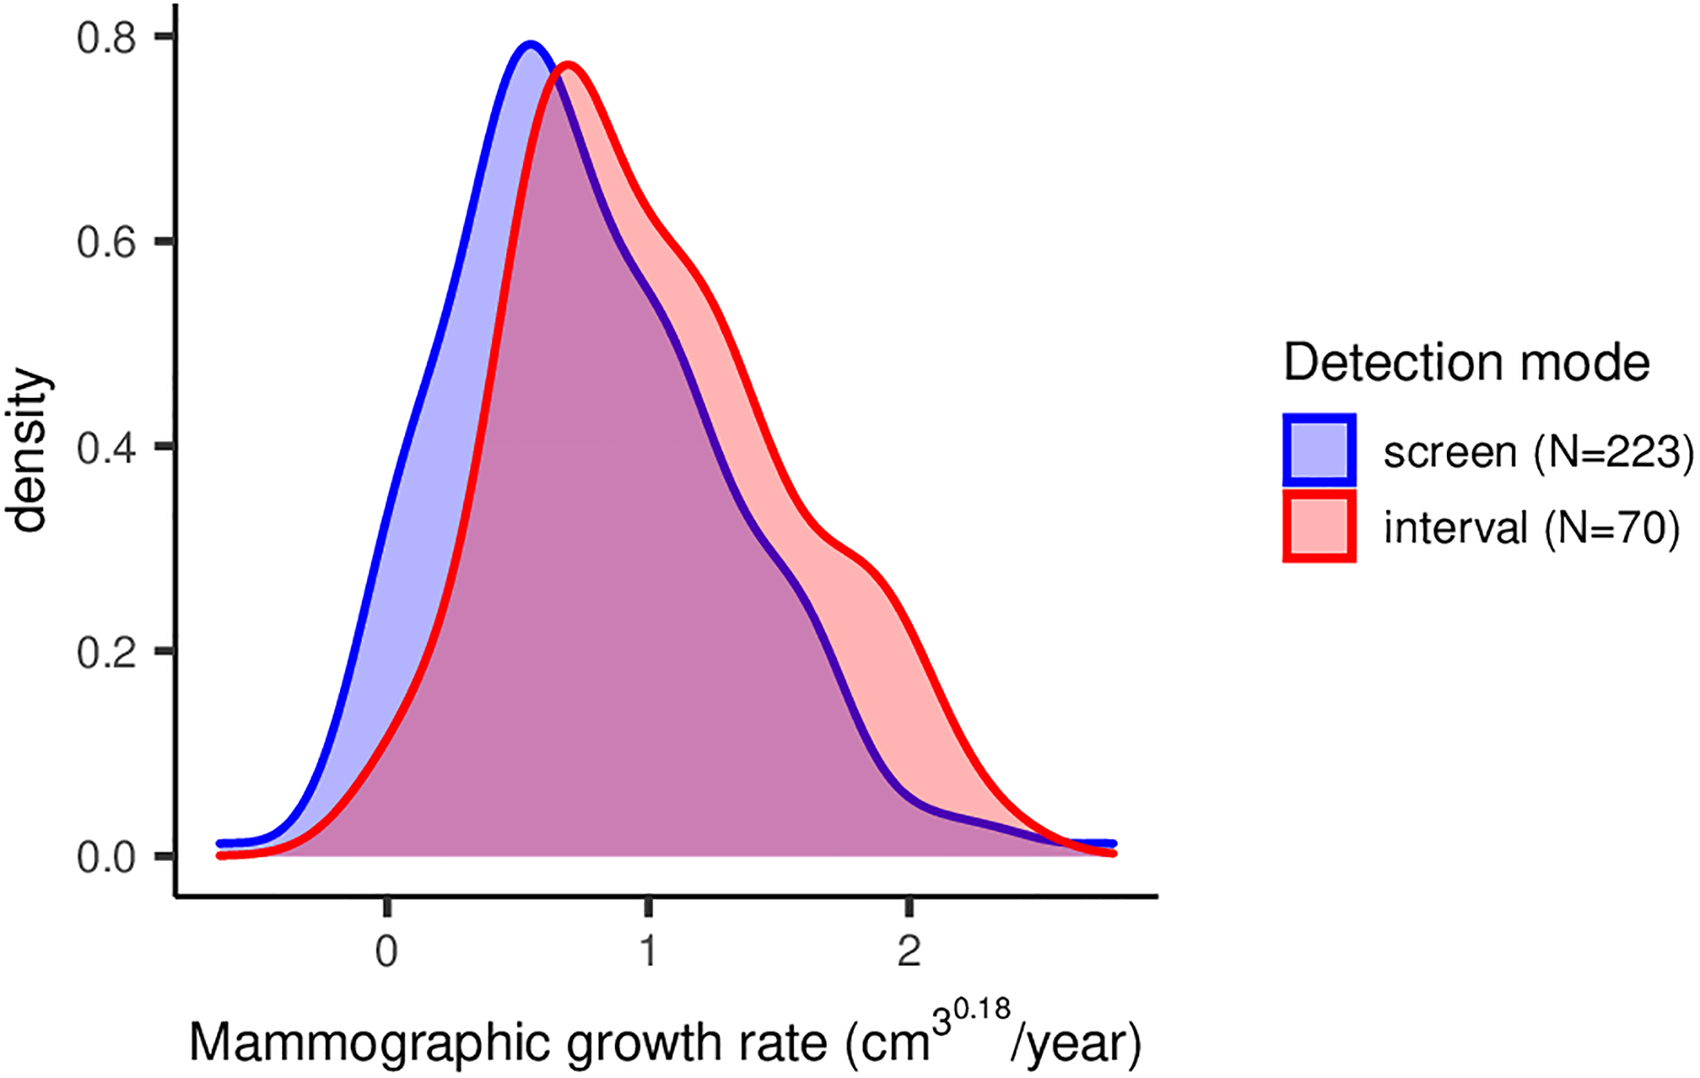
Density plot showing the distribution of specific growth rate, stratified by detection mode. The distribution of specific growth rates of invasive breast cancer of no special type in screened women is given, based on a power-law growth function.
Associations between SGR and prognostic patient and tumor characteristics
Table 2 shows associations between SGR (standardized and on a continuous scale) and established clinical prognostic factors. Associations between SGR and continuous prognostic factors are presented as regression coefficients per one standard deviation increase in SGR. For associations with categorical prognostic factors, OR per one standard deviation increase in SGR is given. Each one standard deviation increase in SGR was associated with an increased score on NPI of 0.34 [0.21–0.46], lower age at diagnosis (−0.94 [−1.69 to −0.19]), an increased mammographic tumor volume of 3.52 cm3 [1.52–5.53], and increased pathologic size of 0.46 cm [0.34–0.58] at diagnosis. Furthermore, increasing SGR was associated with an increased odds ratio of having a tumor with an unfavorable biologic subtype (OR 2.14 [1.45–3.15], compared to favorable biologic subtype), of high histologic grade (OR 1.97 [1.37–2.83], compared to low grade) and an increased odds to have a palpable tumor (OR 2.00 [1.50–2.65]). Lastly, there was an increased odds to be detected as an interval cancer (OR 1.57 [1.20–2.06] per one standard deviation increase in SGR).
Associations between SGR and prognostic factors.
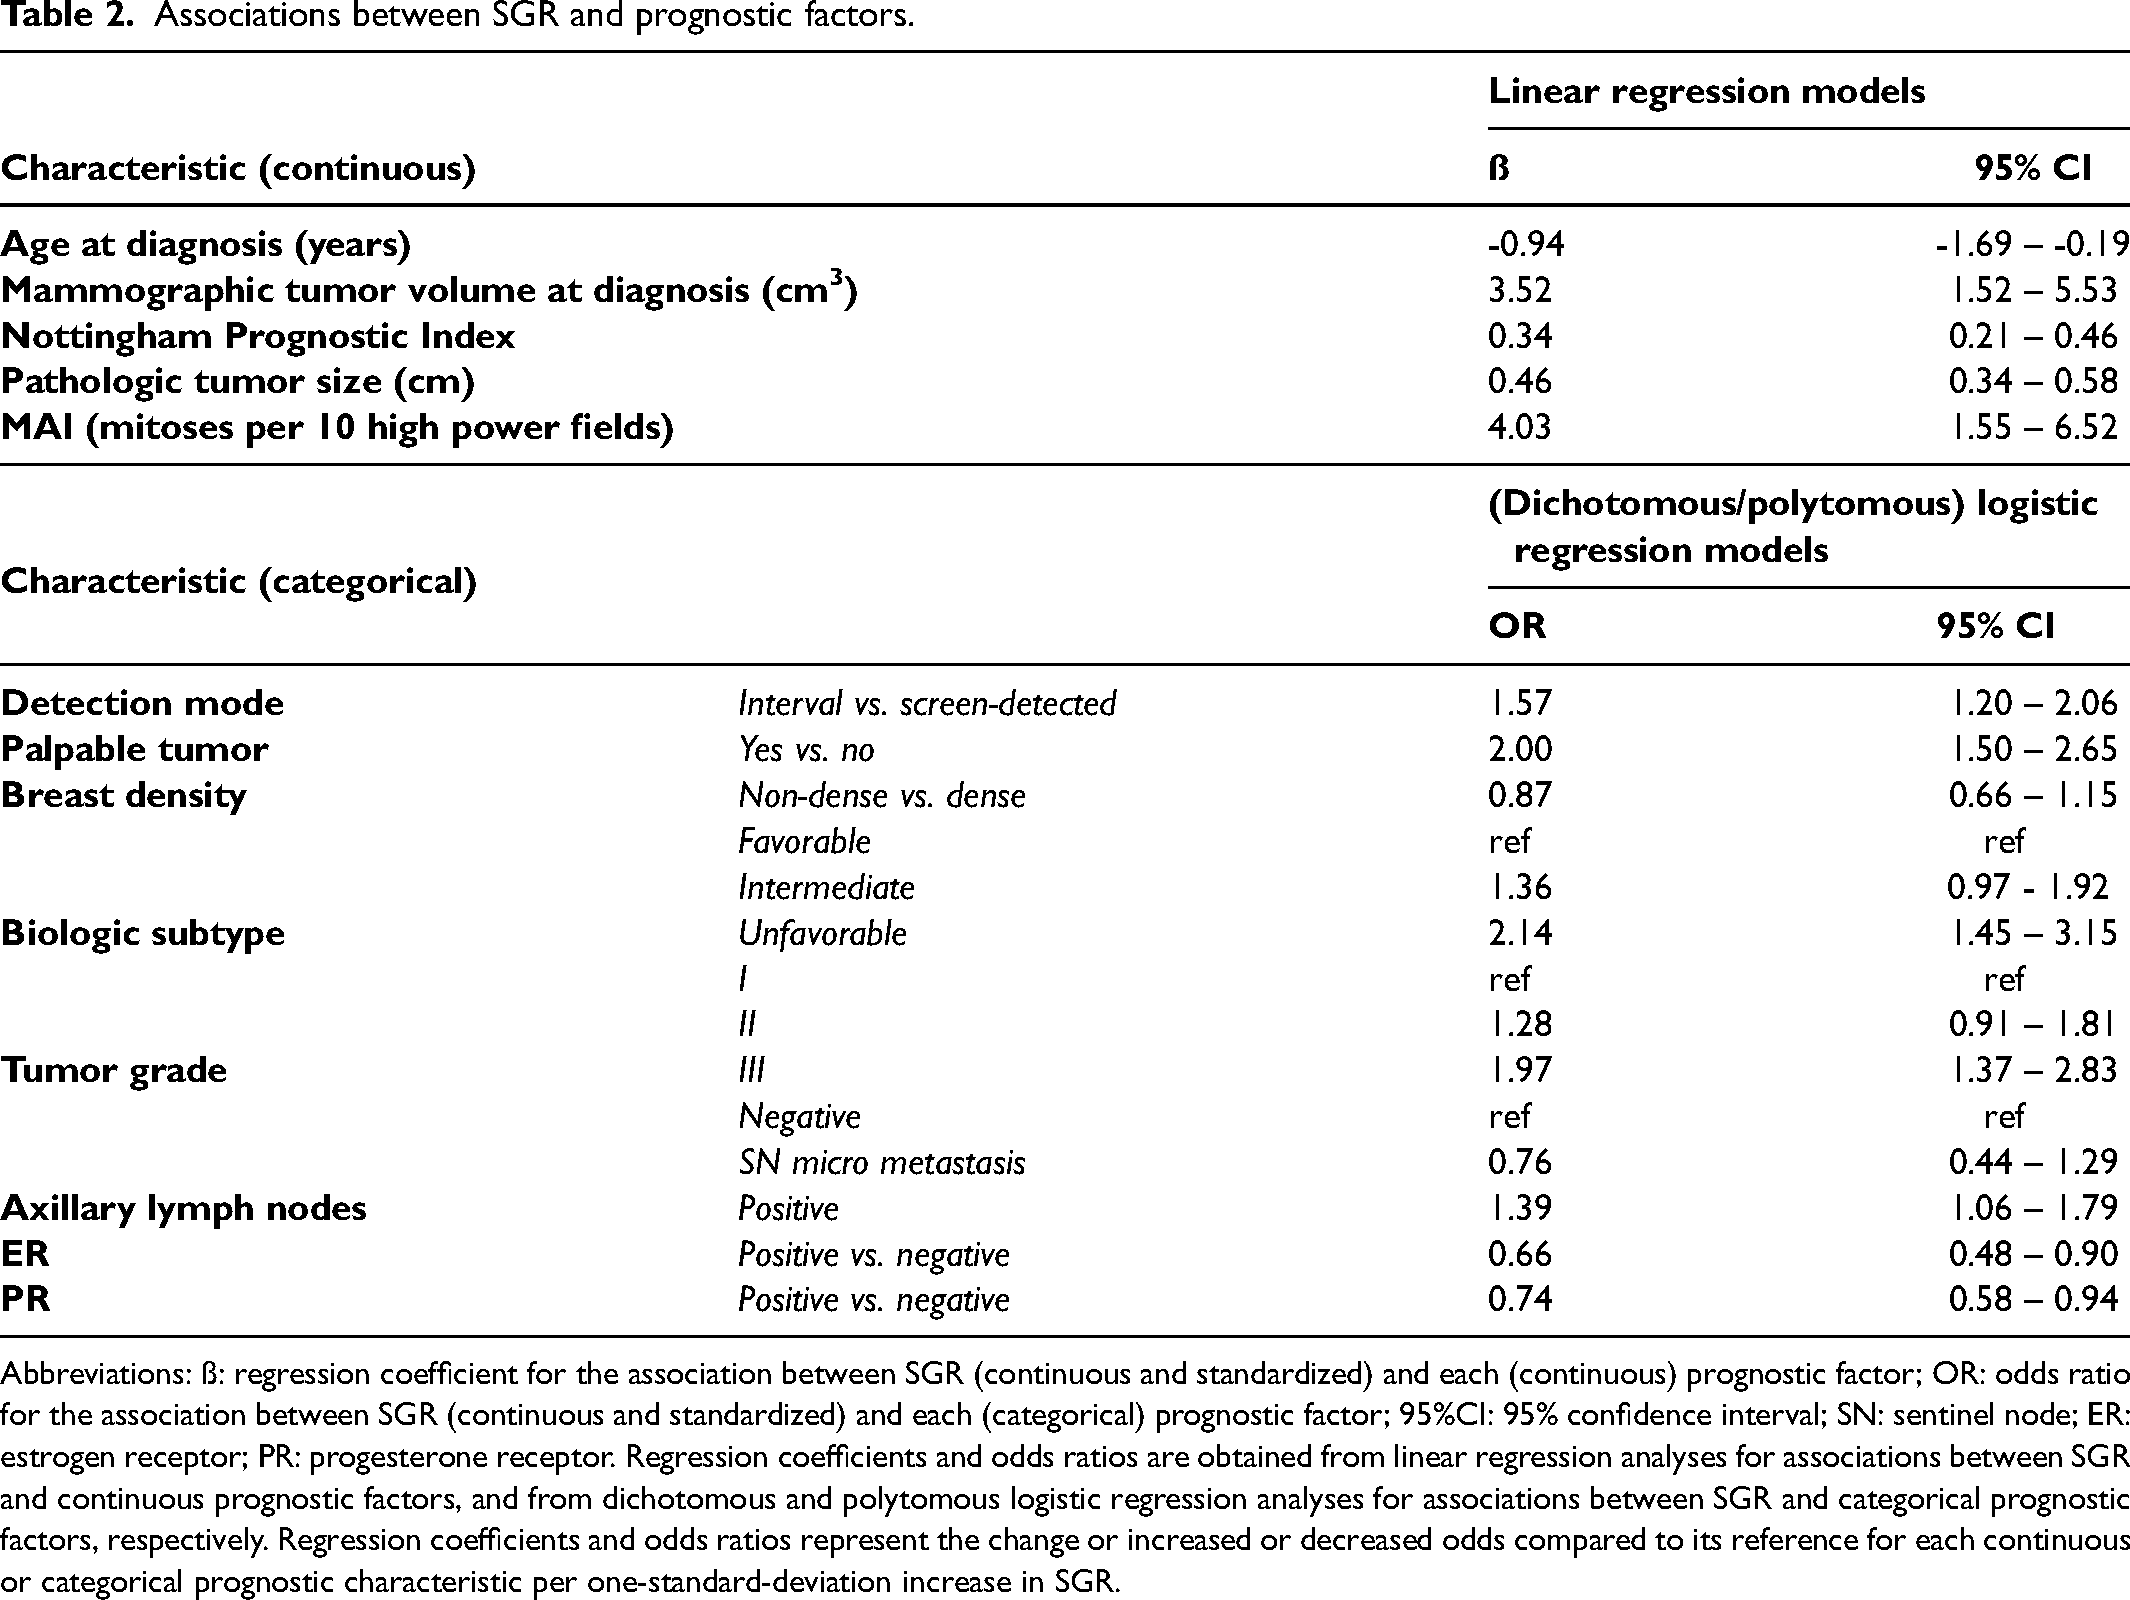
Abbreviations: ß: regression coefficient for the association between SGR (continuous and standardized) and each (continuous) prognostic factor; OR: odds ratio for the association between SGR (continuous and standardized) and each (categorical) prognostic factor; 95%CI: 95% confidence interval; SN: sentinel node; ER: estrogen receptor; PR: progesterone receptor. Regression coefficients and odds ratios are obtained from linear regression analyses for associations between SGR and continuous prognostic factors, and from dichotomous and polytomous logistic regression analyses for associations between SGR and categorical prognostic factors, respectively. Regression coefficients and odds ratios represent the change or increased or decreased odds compared to its reference for each continuous or categorical prognostic characteristic per one-standard-deviation increase in SGR.
Associations with overall survival
Based on 278 patients, the median follow-up time was 12.4 years (range 1.2 to 19.1) and 78 deaths occurred. Overall, 5-, 10- and 15-year survival rates were 94, 81, and 66%, respectively. Figure 3 shows the survival curves, stratified by SGR, and does not indicate differences between SGR tertiles. Table 3 shows no association of SGR with overall survival (adjusted HR = 1.12 [0.87–1.43] per one standard deviation increase in SGR). The effect of SGR on overall survival that was furthermore adjusted for mammographic volume at diagnosis also did not show an association (adjusted HR = 0.98 [0.74–1.30] per one standard deviation increase in SGR).
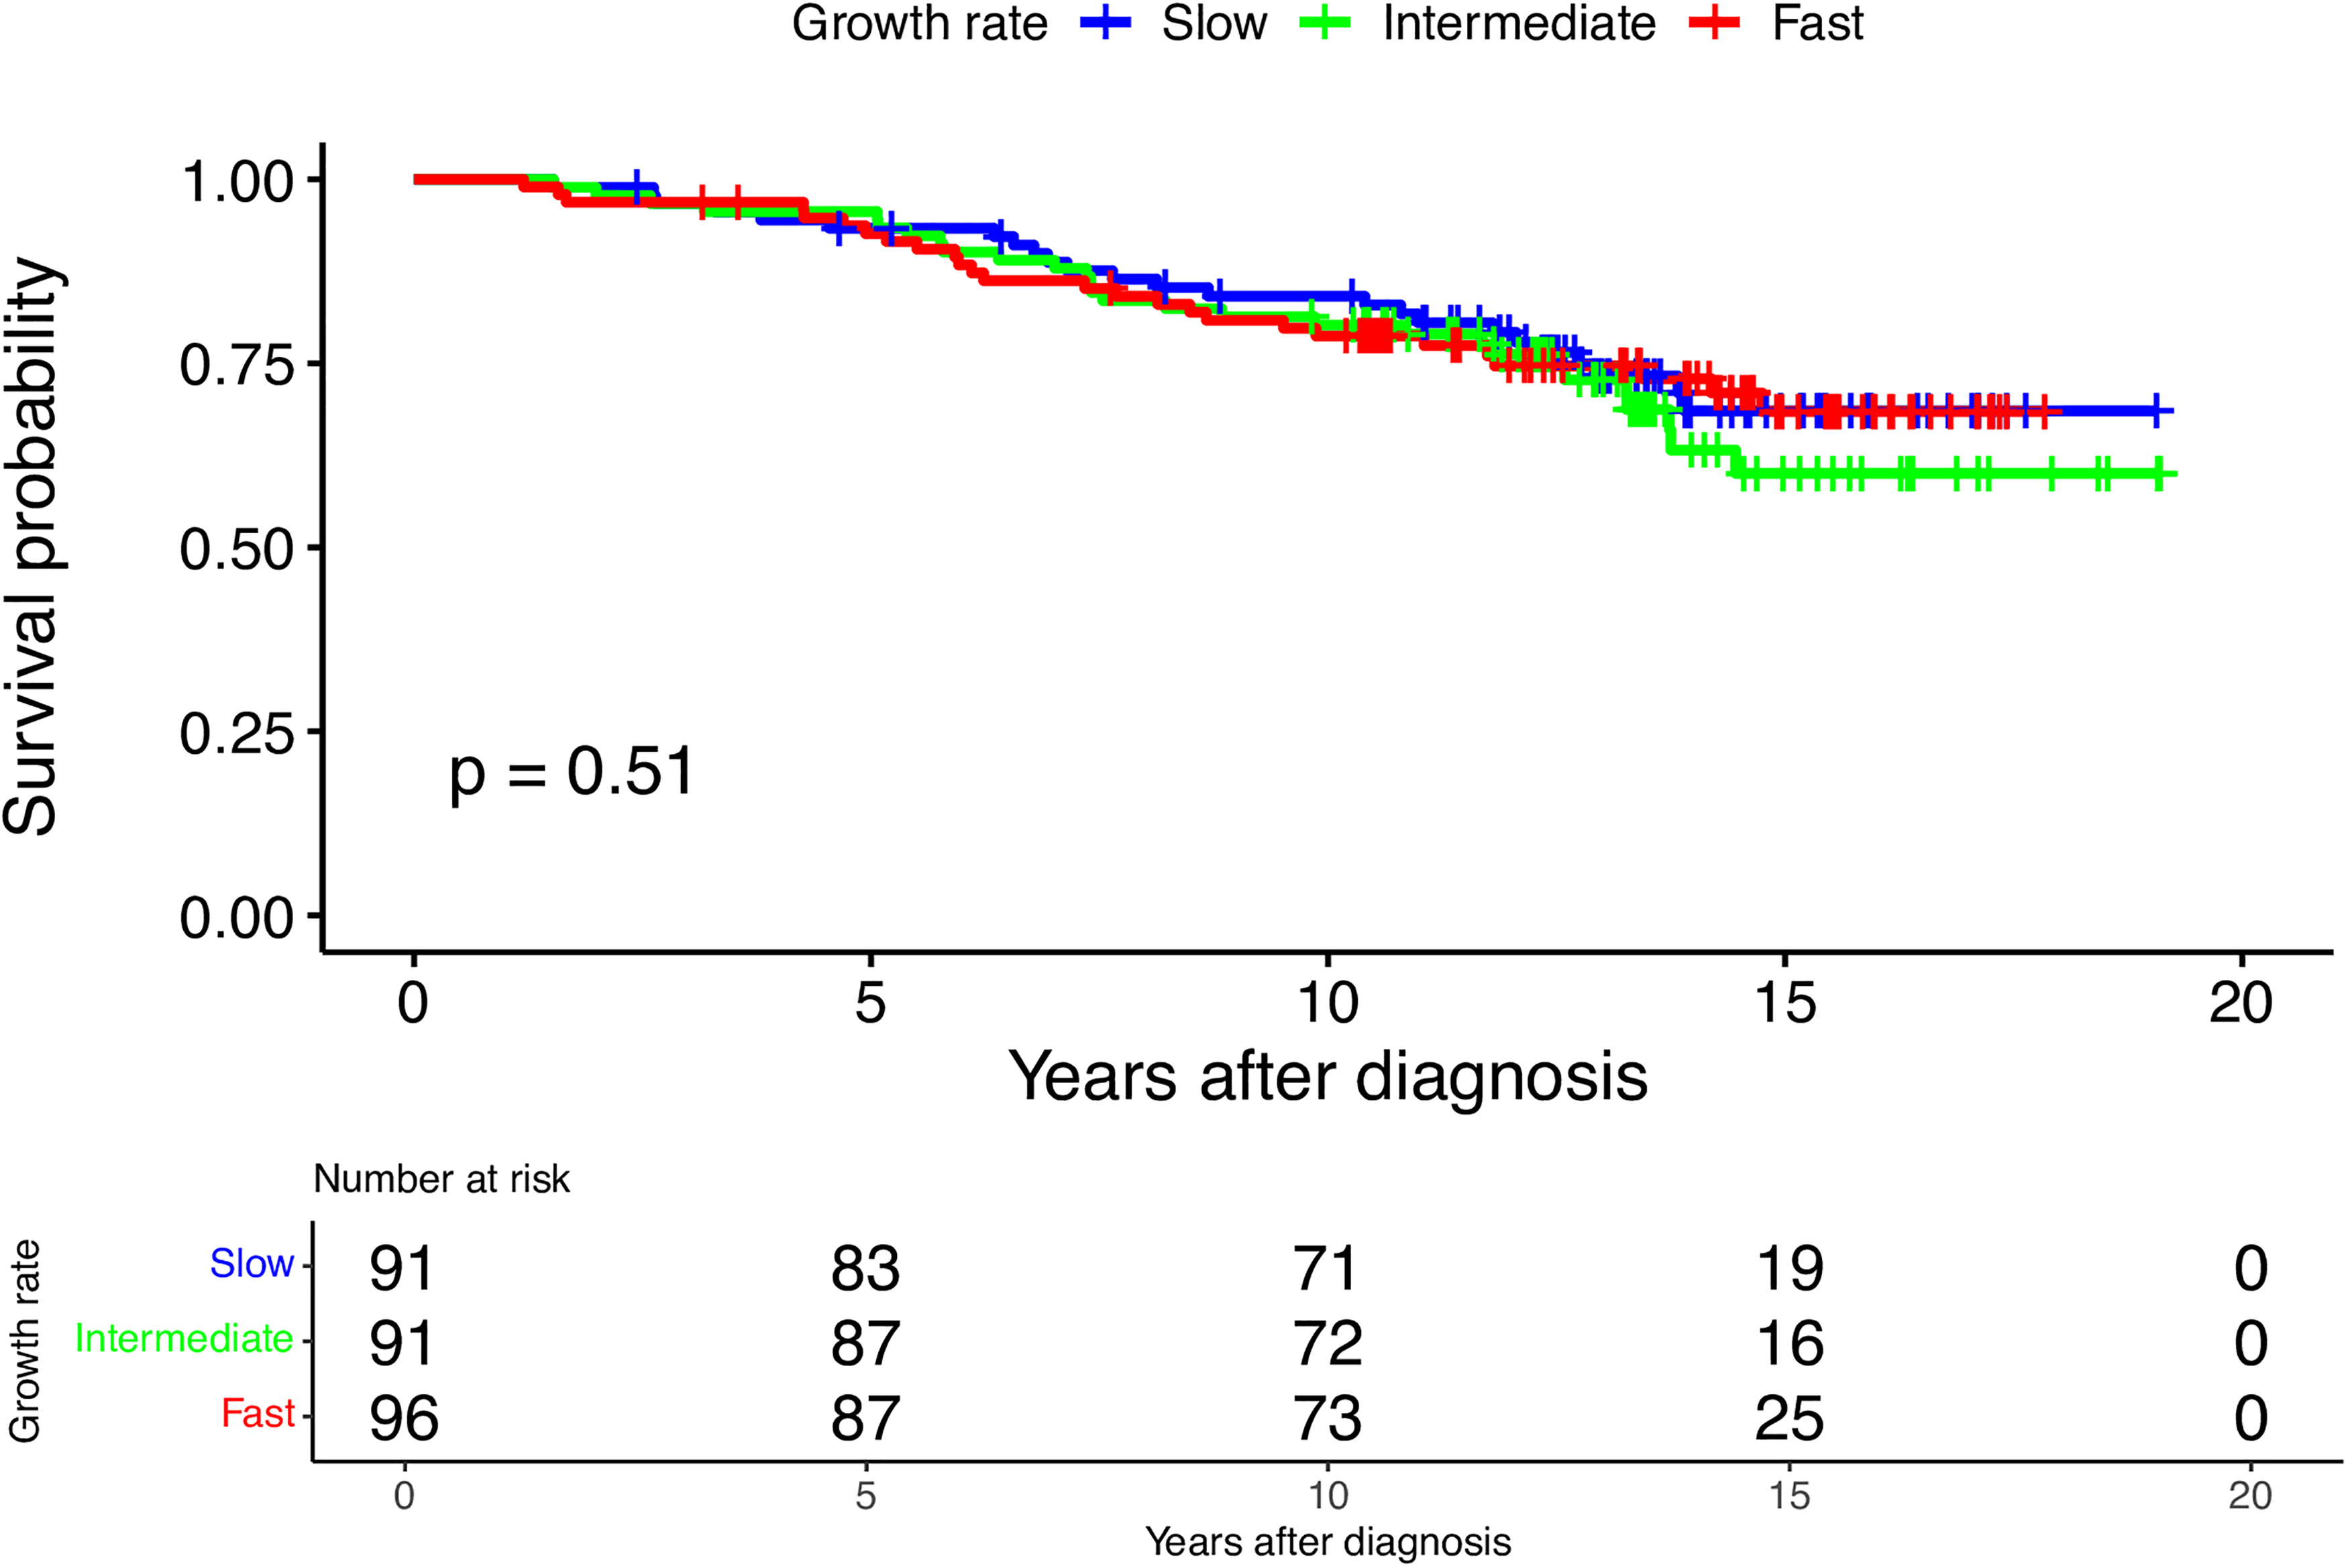
Overall survival probability for screened women diagnosed with invasive carcinoma of no special type. Survival probabilities are stratified by specific growth rate (SGR) (slow vs. intermediate vs. fast).
Associations with overall survival for SGR and prognostic factors that were used for adjustment.
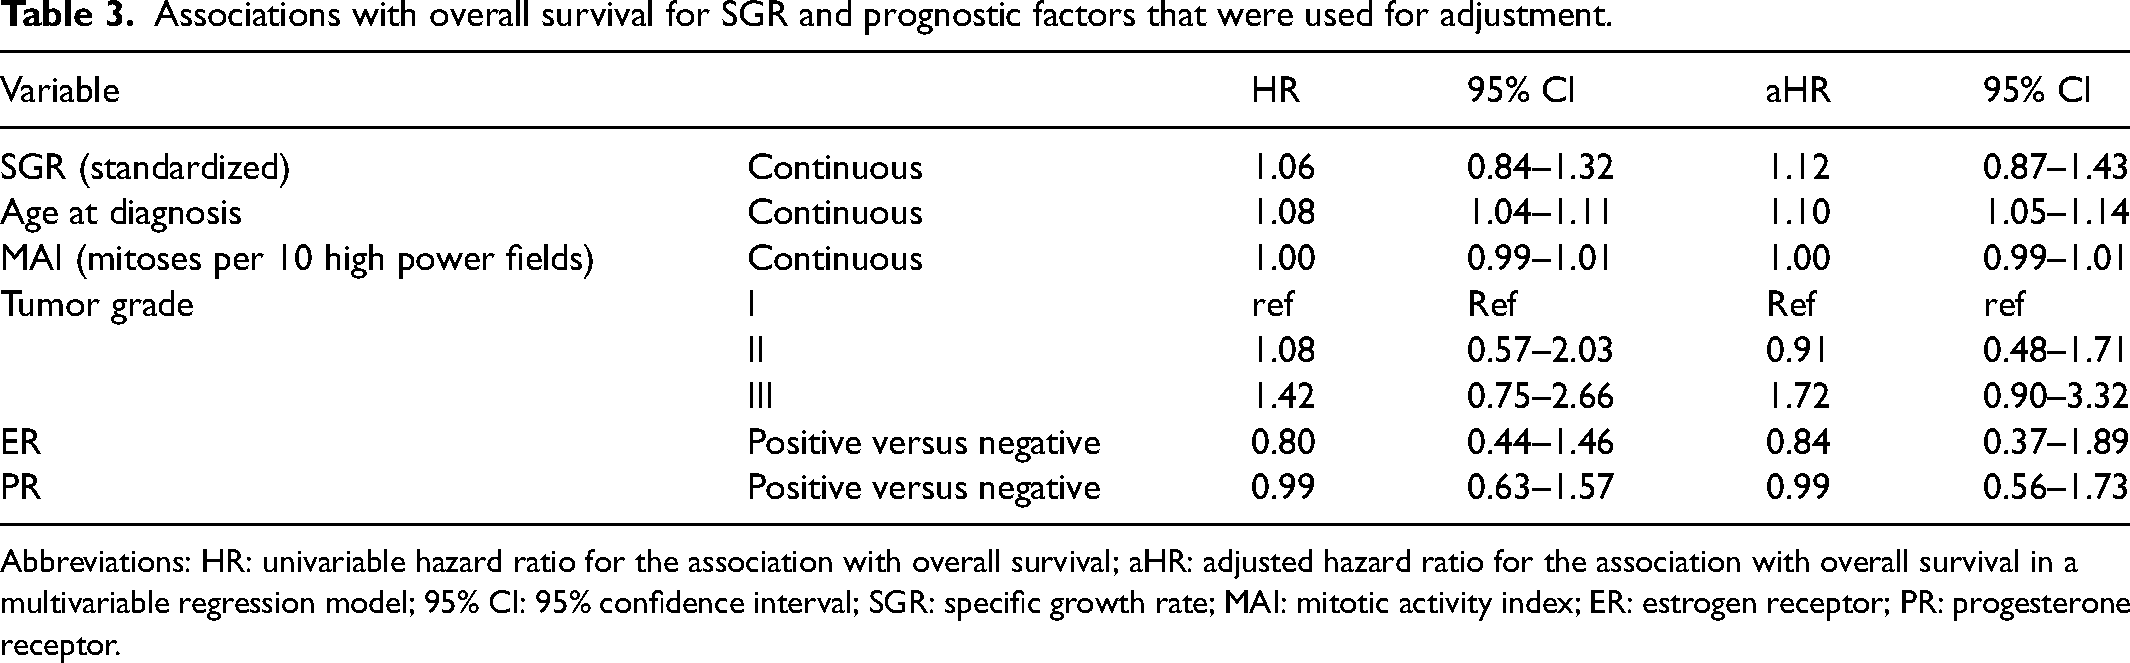
Abbreviations: HR: univariable hazard ratio for the association with overall survival; aHR: adjusted hazard ratio for the association with overall survival in a multivariable regression model; 95% CI: 95% confidence interval; SGR: specific growth rate; MAI: mitotic activity index; ER: estrogen receptor; PR: progesterone receptor.
Discussion
This historic cohort study of 293 screened NST patients explored whether SGR could indicate differences in tumor aggressiveness and whether it shows potential to be used as a prognostic marker. SGR was associated with various clinicopathologic factors that are known to have such potential in a clinical setting. Patients with faster-growing tumors scored on average higher on the NPI, were more likely to have a tumor of an unfavorable biologic subtype and higher histologic grade, were on average younger and presented with tumors that had reached a larger volume at diagnosis and that were more likely to be palpable. While these findings indicate that SGR could contain information relevant to breast cancer prognosis, an association with overall survival was not found. Whether SGR is useful for predicting a long-term patient outcome therefore remains up for debate.
Comparison to literature
Studies on growth rate and prognostic factors in breast cancer are scarce. Age, tumor size, stage, grade, axillary lymph node involvement PR status, Her2, and Ki-67 have previously been linked to the growth rate.31–36 In previous studies, measurements were often based on clinical serial mammograms or ultrasound, with a short time interval, instead of screening mammograms, with generally longer time intervals. Many of these studies may suffer from selection bias, excluding patients without visible growth (slow-growing tumors) or patients where no tumor was observed on previous images (likely to be fast-growing tumors), affecting the distribution of growth rates. A direct comparison of the distribution of growth rates in the present study to the previous literature is not possible, as most literature assumed growth to be exponential, yielding a different unit for growth rate.11,32,37–42 This study preserved information from mammograms without a visible tumor by assuming a density-based threshold volume. In a sensitivity analysis where this threshold volume was set to 0 cm3, results were not altered.
To the best of our knowledge, only five studies have previously assessed the association between tumor growth rate and survival.37,43–46 Kusama et al. suggested that faster-growing tumors are associated with lower overall survival rates than intermediate or slow-growing tumors. 45 Galante et al. 44 evaluated 180 patients and did not find an association between tumor volume doubling time and disease-free survival. Kuroishi et al. 37 did find growing tumors were associated with poorer overall survival when compared to slow-growing tumors in a study where mammograms of 122 patients were reviewed. More recently, Yoo et al. evaluated tumor growth on ultrasound in 957 patients and were the first to use SGR rather than the commonly used tumor volume doubling time. 46 They found a significant association between SGR and disease-free survival. Even though the largest study to date, the difference in imaging methods and the short time interval between serial measurements in the study by Yoo et al. hamper a direct comparison. Our study does compare well to a recent study that also compared growth function assumptions and, using a power-law growth function to calculate SGR, found associations with NPI, Ki-67, size, grade, mitotic activity, and breast cancer-specific survival. Important differences were the exclusion of patients when no tumor was visible on a previous mammogram and the analysis of fewer cases (N = 90). 43 Advances in screening and treatment have led to decreased breast cancer mortality. 47 Hence, to study associations with breast cancer prognosis, cause-specific survival is often the preferred outcome measure in more recent cohorts, as overall survival measured in a cohort of breast cancer patients is increasingly affected by competing risks for death.
Strengths and limitations
An important challenge for any study on tumor growth is to accurately measure tumor size. The close correlation between measured diameters on diagnostic mammograms and the diameters as annotated by the radiologist in patient files in our study supports that the error of this manual measurement may have been small. Next, we assumed a three-dimensional tumor shape (spheroid) and calculated tumor volumes. Assuming a different shape (cylindric or spherical) did not alter the results of this study, confirming previous findings. 11 It may seem intuitive to calculate the lesion area instead, as the lesion is observed as a two-dimensional phenomenon on a mammogram. However, calculating volumes is expected to produce a more valid estimation, motivated by the fact that lesion area measurements vary more widely between CC and MLO views. 48
Another challenge involves selecting a mathematical growth function to calculate SGR. Previous studies do not provide a definite answer on which growth function is most likely to be correct.11,23,49 In light of this, it is a major strength of this study to first consider the fit of different relevant growth functions, instead of assuming a function to calculate SGR. Given the fact that the fit of growth functions could only be tested on 70 patients with interval cancer, a definite conclusion regarding the actual growth pattern of all breast tumors is however not possible. A power-law function seems a plausible assumption, as several studies have challenged the idea of a constant doubling of all cells, as is assumed in an exponential function (and the early stages of a Gompertzian function).20,50–52 The marked differences in model fit between growth functions in this study (see Supplemental Table S1) highlight the relevance of comparing those functions before calculating SGR.
A limitation of this study is the lack of information on cause-specific survival, which would be preferred over overall survival. A possible association between SGR and cause-specific survival may have been obscured by the use of overall survival, as SGR is unlikely to be related to competing causes of death. The dilution of a possible association between SGR and cause-specific survival may be considerable, as a recent study showed that only half of deaths after a breast cancer diagnosis were caused by breast cancer itself. 53 The choice of factors to adjust for, in order to minimize confounding in the estimated association between SGR and overall survival, was motivated by a directed acyclic graph. As the literature on breast cancer growth rate is scarce, strong assumptions regarding the true causal relationships between growth rate and other factors, for example, other mammographic features or pathological variables, were required. Therefore, residual confounding resulting from the misspecification of variables to adjust for cannot be ruled out. Another limitation concerns the generalizability of our results: the choice to only include NST was motivated by the fact that other cancer types commonly present as different lesion types than masses. Naturally, this implies results of this study are only valid for NST cases that mammographically present as a mass in a screened population. Furthermore, despite this being one of the larger studies on breast cancer growth rate, studies with larger cohorts and the availability of double-view digital mammograms are desirable. 54 Lastly, with more modern markers (e.g. Ki-67, Her2, and gene expression assays) available, it would be possible to categorize the biological subtypes (favorable, intermediate, or unfavorable based on ER, PR, and grade) better (e.g. some ER+/PR + tumors in our study would not be classified as a favorable subtype if Her2 status was known). 55
Conclusions
The association between SGR and several clinicopathologic markers found in this study underlines that SGR may be able to predict tumor aggressiveness. To measure SGR validly, a clearer understanding of breast cancer growth in vivo is needed, to which this study contributes by comparing the fit of different growth functions instead of making an arbitrary assumption. To formulate more definite answers on the prognostic value of SGR, future research should be aimed at investigating its association with recurrent breast cancer after treatment or cause-specific survival. If SGR contains such information, it should be investigated whether it does so in addition to existing histopathological and molecular markers or only serves as a proxy for these markers. This distinction is particularly important for SGR to be valuable in a clinical setting. In screening, it may be sufficient if SGR serves as a proxy for other markers that are not yet available to the screening radiologists. The use of digital mammography and increased possibilities to measure a range of image features automatically will require further studies on the predictive capacity of SGR to evaluate this in the context of other data that can be obtained from mammograms. Combined, this information may further improve breast cancer prognostication, and growth rate may be an important feature to consider when serial mammograms are available.
Supplemental Material
sj-docx-1-msc-10.1177_09691413231222765 - Supplemental material for The prognostic potential of mammographic growth rate of invasive breast cancer in the Nijmegen breast cancer screening cohort
Supplemental material, sj-docx-1-msc-10.1177_09691413231222765 for The prognostic potential of mammographic growth rate of invasive breast cancer in the Nijmegen breast cancer screening cohort by Jim Peters, Jos A.A.M. van Dijck, Sjoerd G. Elias, Johannes D.M. Otten and Mireille J.M. Broeders in Journal of Medical Screening
Footnotes
Acknowledgments
The authors thank all other members of the IMAGINE Consortium for their valuable input during research meetings. The IMAGINE consortium is formed by the following researchers: Carla van Gils, Sjoerd Elias, Bas Penning de Vries (Julius Center for Health Sciences and Primary Care, UMC Utrecht, Utrecht, The Netherlands), Ruud Pijnappel (Dutch Expert Center for Screening, Nijmegen, The Netherlands), Esther Lips, Jelle Wesseling, Sandra van den Belt, Merle van Leeuwen (Division of Molecular Pathology, Netherlands Cancer Institute, Amsterdam, The Netherlands), Marja van Oirsouw, Ellen Verschuur (Dutch Breast Cancer Association, Utrecht, The Netherlands), Nico Karssemeijer, Ritse Mann (Department of Medical Imaging, Radboud university medical center, Nijmegen, The Netherlands), Jonas Teuwen, Nikita Moriakov (Department of Radiation Oncology, Netherlands Cancer Institute, Amsterdam, The Netherlands), Jim Peters, Jos van Dijck and Mireille Broeders (Department for Health Evidence, Radboud university medical center, Nijmegen, The Netherlands). The consortium is led by Mireille Broeders (Mireille.Broeders@radboudumc.nl). The authors furthermore thank Monique Eijgenberger and Guido van Schoor for their valuable contributions in measuring tumor sizes, assessment of mammographic densities, and contributions to preceding work and Kit Roes and Jordache Ramjith for statistical advice. his study was financially supported by the Dutch Cancer Society (project number KWF11835). The funders had no role in study design, data collection and analysis, decision to publish, or preparation of the manuscript.
Data availability
Data cannot be shared publicly because of legal and ethical reasons that are a consequence of the informed consent procedure in this study. In the Dutch screening program, women automatically consent to the use of their data for scientific research by participating in the program, unless they object to this (an opt-out procedure). Women are informed about this option, and no data have been used on women who objected to this. Consent to public sharing of individual data can, however, not be assumed. Data that support the conclusions of this work is on an aggregated level available in the manuscript and its supporting information. Researchers who meet the criteria for access to confidential data may contact the corresponding author.
Declaration of conflicting interests
The authors declared no potential conflicts of interest with respect to the research, authorship, and/or publication of this article.
Funding
The authors disclosed receipt of the following financial support for the research, authorship, and/or publication of this article: This work was supported by the KWF Kankerbestrijding (grant number KWF11835).
Supplemental material
Supplemental material for this article is available online.
References
Supplementary Material
Please find the following supplemental material available below.
For Open Access articles published under a Creative Commons License, all supplemental material carries the same license as the article it is associated with.
For non-Open Access articles published, all supplemental material carries a non-exclusive license, and permission requests for re-use of supplemental material or any part of supplemental material shall be sent directly to the copyright owner as specified in the copyright notice associated with the article.