
Abstract
Objective
As breast cancer growth rate is associated with menopause, most screening programmes target mainly women aged 50–74. We studied the association between age at diagnosis and growth rate in this screening-specific age range.
Methods
We used data from breast cancer patients diagnosed in the screening programme in Nijmegen, the Netherlands. The data were restricted to the screening rounds when analogue mammography was used in both the screening and clinical setting. Growth rate expressed as tumour volume doubling time was based on increasing tumour size in longitudinal series of mammograms. Estimates were based on (a) tumours showing at least two measurable shadows, (b) tumours showing a shadow at detection only (left censored), and (c) tumours showing no growth (right-censored observation). All 293 tumours were consecutively diagnosed invasive ductal breast cancers in participants of the Nijmegen screening programme in the period 2000–2007.
Results
Depending on the assumptions made on tumour margins and mammographic density, the relation of volume doubling time with age non-significantly varies from a decrease of 3.3% to an increase of 1.4% for each year increase in age at diagnosis (all P-values ≥ 0.18). Applying left censoring on indistinct tumours, the geometric mean volume doubling time was 191 days (95% confidence interval 158–230).
Conclusion
We found no significant change in growth rate with age in women diagnosed with invasive ductal breast cancer in the screening age range 50–74. This outcome does not support differential screening intervals by age based solely on breast cancer growth rate for this particular group.
Introduction
A 2009 meta-analysis of randomized screening trials demonstrated a 14% breast cancer mortality reduction in women aged 50–59 and a 32% reduction in the age group 60–69. 1 As growth rate is a strong predictor of breast cancer-related mortality, 2 differential age-specific tumour growth could be an important explanation for the smaller mortality reduction observed in women under age 60, compared with that in women aged over 60. The inference that tumours in younger patients tend to grow faster than tumours in older patients is often made on the basis of differences in volume doubling time (VDT) between pre- and post-menopausal women. Data from the screening programme in Nijmegen, the Netherlands, initially showed age-specific differences in growth rate, stratified by age <50 and ≥50. 3 The Dutch screening programme now invites women aged 50 and over. As the menopausal age in the Netherlands is around 51, 4 the screening population is mainly post-menopausal. We investigated the association between age at diagnosis and breast cancer growth rate in the mainly post-menopausal screening group aged 50–74.
Methods
Source population
We designed our study within the population of breast cancer patients diagnosed in the screening programme in Nijmegen, the Netherlands, between 2000 and 2007. From 1998 the programme invited women aged 50–74 for an initial screen using two-view mammography (a mediolateral oblique and craniocaudal view). In subsequent screening examinations, the mediolateral oblique view was standard. Additional craniocaudal views in subsequent screening examinations were performed on indication (e.g. due to a high percentage of dense glandular tissue, the presence of implants, or when abnormalities were suspected). In our study, from 2000 to 2007, about 50% craniocaudal views were made. Since 2014, mediolateral and craniocaudal views are the standard in all screening examinations. A detailed description of the programme was published previously. 5 We restricted the data to the four last screening rounds, when analogue mammography was used in both the screening and clinical setting, and during which time 636 cancers were diagnosed in women who had participated in the programme. Of this group, 440 (69%) patients had invasive ductal carcinoma, 88 (14%) invasive lobular carcinoma, 64 (10%) ductal carcinoma in situ, and the remaining 44 (7%) patients had other types.
Study population
Invasive ductal carcinoma, the most common type of breast cancer, occurs in about 70% of breast cancer patients 6 and usually presents as a discrete mass on the mammogram, allowing for a direct measurement of tumour size. In contrast, invasive lobular carcinoma, the second most common type (10% of the patients with invasive breast cancer), predominantly shows an architectural distortion on the mammogram, making it difficult to accurately measure tumour diameter. 7 To adequately measure any age-specific difference in tumour growth, we restricted the study population to the 440 patients diagnosed with invasive ductal carcinoma. In 52 (12%) of the patients we could not trace the patient files, and 94 (21%) patients had no measurable tumour mass on the diagnostic mammogram. These cancers were detected through microcalcifications alone (n = 30) or other indirect signs (n = 64) such as diffuse asymmetric density. One woman was too old to match the 50–74 age criteria.
Consequently, 293 cancers were available for the analysis. A researcher (GvS) and a research assistant were responsible for measurement of the tumour mass on the mammographic series, i.e. the diagnostic (clinical) mammogram, the last screening mammogram before diagnosis, and two years before the last, the penultimate screening mammogram (Figure 1). Tumour size was based on consensus between the researcher and research assistant, according to the longest axis and the perpendicular to the longest axis. If tumour sizes between the researchers were different, a screening radiologist was consulted. For screen-detected cancers, the last screening mammogram was the positive mammogram based on which women were recalled for diagnostic assessment. For interval cancers, i.e. those diagnosed within 24 months after a negative screening examination, the last screening mammogram was the negative screening mammogram prior to diagnosis. For both, the penultimate screening mammogram was the examination two years earlier than the last screening mammogram. The tumour mass was only measured on the mammographic mediolateral oblique view, because this view was standard procedure in all consecutive (diagnostic, last, and penultimate) examinations.
5
In case of a stellate mass, the centre of the tumour mass was measured. For 24 women with interval cancer, the diagnostic mammogram was not available; we used the diagnostic diameter noted by the radiologist in the patient file instead.
Calculation of tumour growth rate based on tumour sizes from a series of mammograms: display of left and right censoring. Glandular tissue of the breast is depicted as the hatched filled area and a visible carcinoma as a circle. * Last screening/second time interval: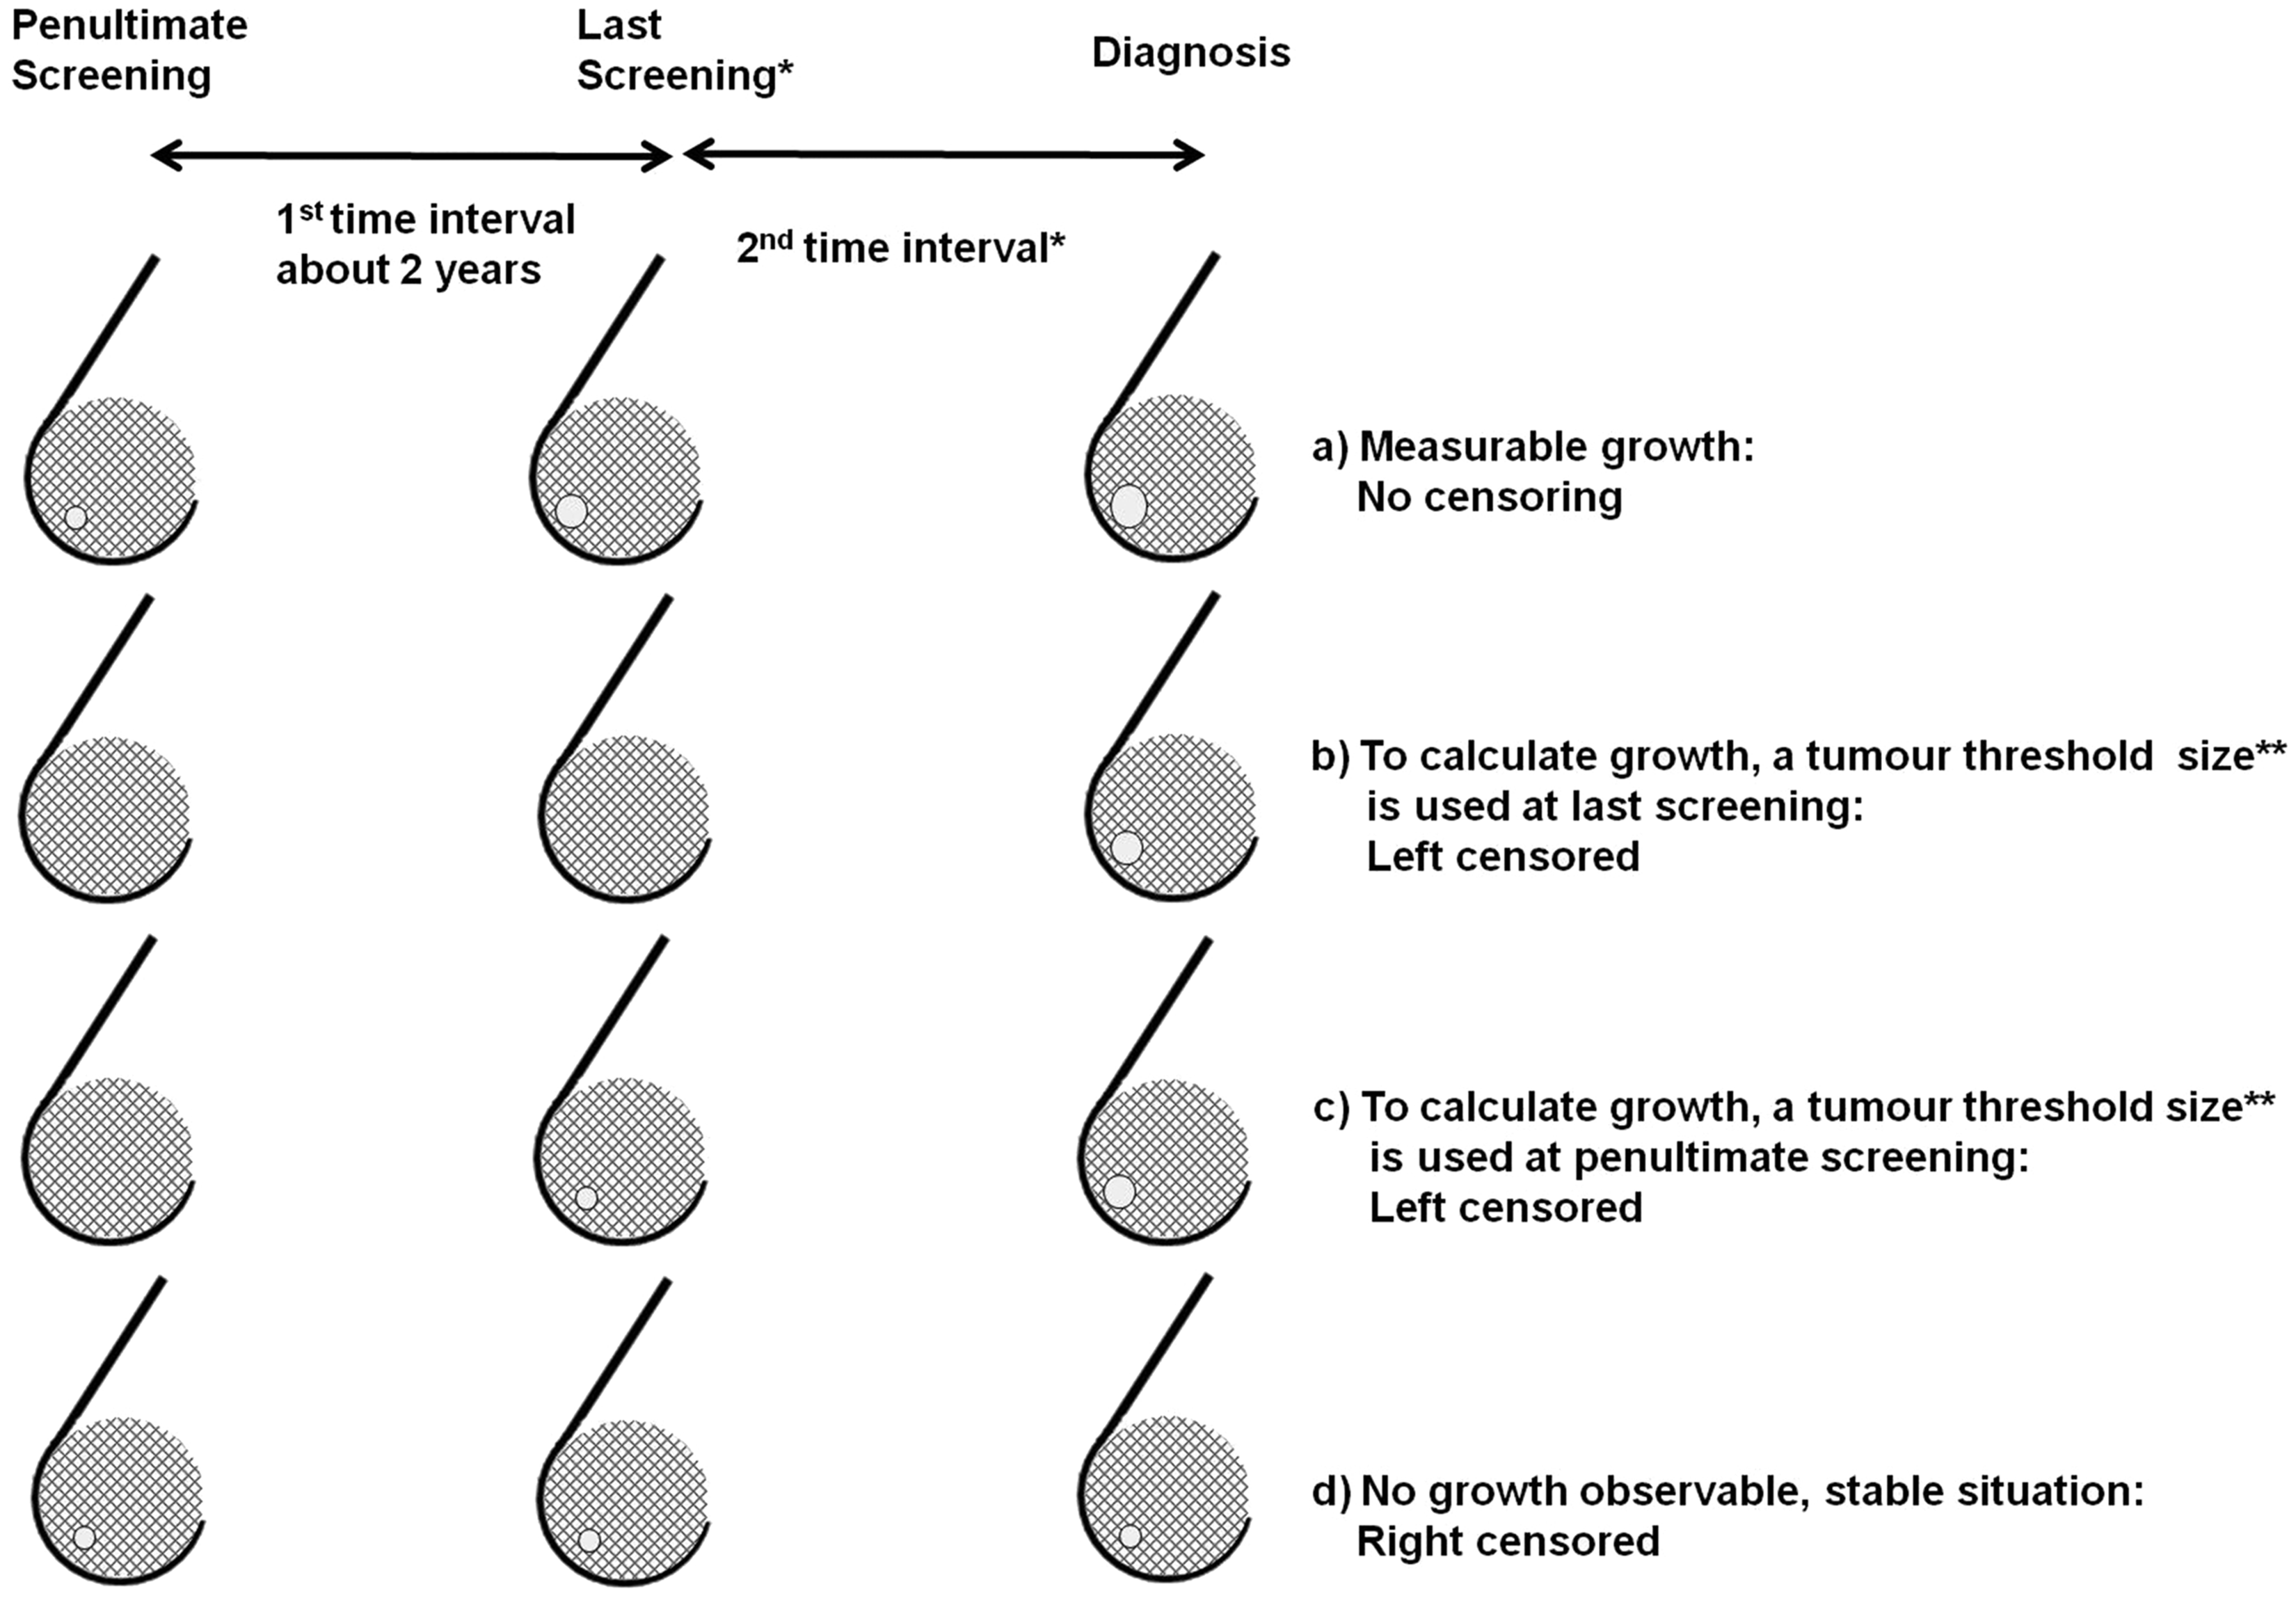
Calculation of growth rate
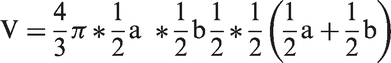
To calculate the tumour volume (V) we used the formula for spheroids proposed by Heuser et al.
8
If at least two mammograms with a measurable tumour nucleus shadow were available, the VDT could be inferred directly from the increase in tumour volume, i.e. the slope of the regression line (Figure 1, part a). If there were no observable growth, the VDT was longer than the time interval between the two measurements, yielding a right-censored value for the tumour VDT (Figure 1, part d). In screen-detected cancers where a tumour mass could be observed on the diagnostic mammogram and on the last (positive) screening mammogram, but not on the penultimate screening mammogram, the size of the tumour mass at the time of the penultimate mammogram was presumed to be too small to be radiographically visible. A threshold size on the penultimate mammogram was assumed, based on the mammographic breast density (see next paragraph). In these cases, the actual VDT must be smaller than the calculated doubling time, yielding a left-censored value (Figure 1, part c). A similar situation is observed in patients with an interval cancer where a tumour mass could only be observed on the diagnostic mammogram (Figure 1, part b), or on the last screening mammogram (by hindsight as minimal sign or obvious tumour mass), but not on the penultimate screening mammogram (Figure 1, part c). Also in these cases, a threshold was assumed depending on visibility to estimate the VDT and a left-censored value was used for the actual VDT.
Visibility of tumours depends largely on mammographic density, i.e. the amount of glandular tissue and stroma. 9 On a mammogram with little density, i.e. at most, 25% of the breast tissue area (Wolfe’s N1, P1), tumours with a diameter of approximately 5 mm could still be detected. 3 This threshold of visibility increases on mammograms with greater density. Therefore, on mammograms with a density of more than 25% (Wolfe’s P2, Dy), we assumed that a tumour could be visible with a diameter of at least 10 mm. The classification of mammographic density, based on the amount of glandular tissue and stroma, was derived from the clinical mammogram and was determined by the research assistant using a semi-quantitative estimate of breast density, based on Wolfe.10,11 This semi-quantitative estimate corresponds well with that of the American College of Radiology Breast Imaging Reporting and Data System for breast density.12,13
In addition to mammographic density, a masked margin in a case of a poorly outlined tumour mass hampers the measurement of the tumour size. 14 The outline of the tumour was subjectively assessed on a 9-point scale (1 = ill-defined margin/indistinct to 9 = well-defined margins/circumscribed). We performed a sensitivity analysis to explore the influence of poorly defined margins on the relation between age and VDT. If the subjective assessment of the tumour margin was worse than a specific cut-off, we considered the tumour to be not observable, which therefore yields a left-censored value for VDT based on mammographic density. For each cut-off on the 9-point scale, the relation between VDT and age was addressed. We presented the relation of VDT and age for that specific cut-off at which the per cent left censored was in line with what could be expected on the basis of site visits in the Dutch screening programme.5,15
Statistical analysis
Our study objective was to examine growth rates along the 50–74 screening-specific age range. We assumed a linear relation for the logarithm of the VDT and age. Because of the left and right censoring,
16
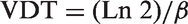
the parameters in the model are estimated with the maximum likelihood method using the SAS procedure LIFEREG, where Ln (VDT) = b0 + b1 *
Results
All 293 women were older than 50 at diagnosis, with a median age of 61 (P25 = 57; P75 = 67). The geometric mean of the tumour volume at diagnosis was 1.44 cm3 (P25 = 0.50; P75 = 4.19) overall, 1.01 cm3 (P25 = 0.44; P75 = 2.08) for screen-detected tumours (N = 224), and 4.55 cm3 (P25 = 2.01; P75 = 11.36) for interval cancers (N = 70). The median time interval between diagnostic and last screening mammogram for interval cancers was 515 days (P25 = 395; P75 = 661), which is about 17 months, and between diagnostic and last (negative) screening mammogram for screen-detected cases, about 25 months (750 days, P25 = 734; P75 = 770).
Irrespective of the masking of tumour margins, 233 (80%) cases were uncensored, which decreased to 153 (52%) uncensored cases to bring this into line with the site visits using the masking of the tumour margins (cut-off > 2). The 80 extra censored tumours were mostly small (P25 = 5 mm; P75 = 12 mm for the longest axis), with indistinct margins (ill-described tumours, cut-off ≤ 2). There were 52% (n = 153/293) uncensored observations. These uncensored cases have an obvious tumour density or a minimal sign on the last screening mammogram (in case of interval cancer), or on the penultimate mammogram (in case of screen-detected cancer), and the VDT could be calculated directly. If no mass could be assessed on the penultimate (interval and screen detected) or last (true negative interval) mammogram (n = 127, 43%), a threshold diameter was assumed, and the VDT was left censored in the analysis. For seven patients (2%), the volume on the diagnostic mammogram was smaller than the threshold value, which means that no left-censored value could be calculated (drop out). If there were non-progression or a shrunken tumour (regression), the VDT was right censored at interval length (n = 6, 2%).
The geometric mean VDT rose non-significantly by 0.06% for every year of increase in age at diagnosis (regression coefficient b1 = 0.0006; 95% CI −0.027 to 0.028). The sensitivity analysis revealed no relation between VDT and age for all different cut-off points; the change in VDT per year of age varied between −3.3 and 1.4% (all P-values ≥ 0.18). The association between age and VDT is displayed in Figure 2, together with the uncensored, left- and right-censored observations. We chose a cut-off point in which the proportion of left-censored observations was 43% (see ‘Methods’ section). In this case, the geometric mean VDT was 191 (95% CI 158–230) days.
Tumour volume doubling time according to age at diagnosis. This figure is based on 293 breast cancer patients (1000 days limit maximum of tumour volume doubling time (VDT), only for presentation). The function plotted is: ln VDT = 5.2104+0.0006*AGE, where VDT is the median volume doubling time and AGE is age at diagnosis on a continuous scale (50–74). Geometric mean VDT = 191 days (95% confidence interval 158–230 days). • = uncensored observation, * = left-censored observation, + = right-censored observation.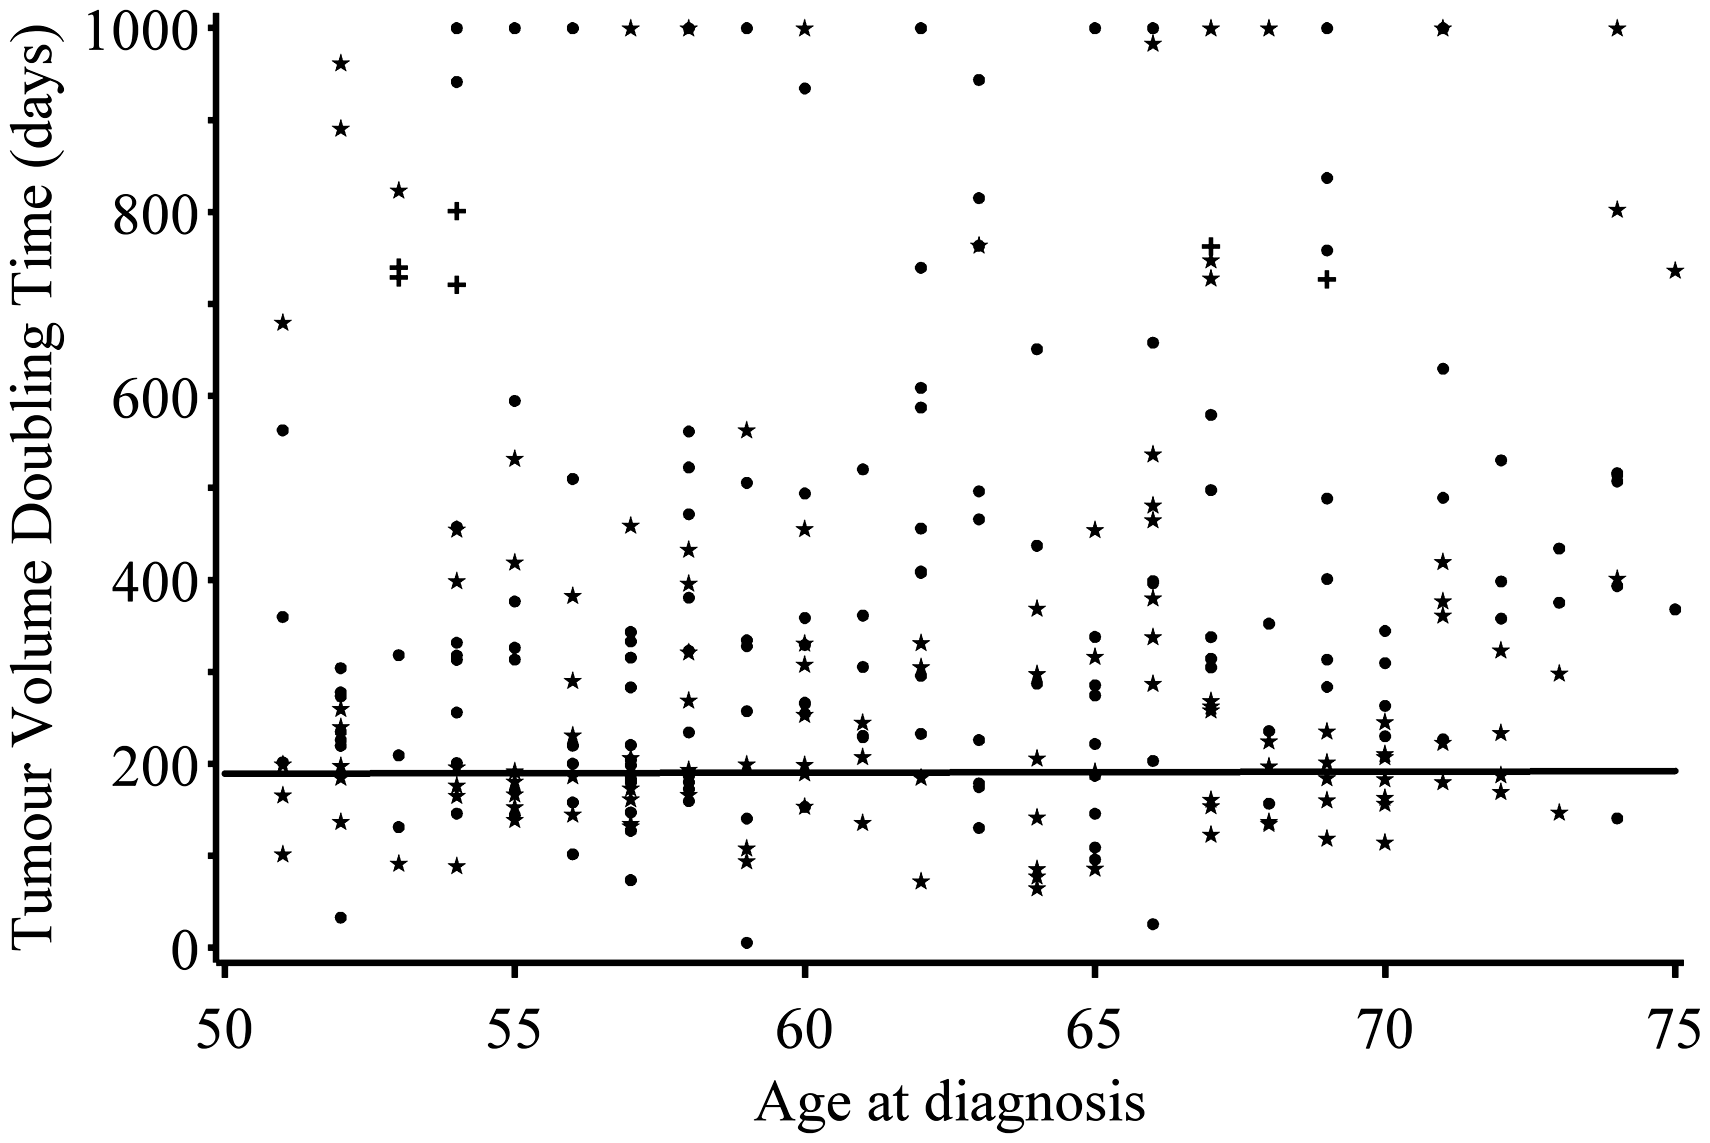
Discussion
Our results suggest that age is not associated with different growth rates of breast cancer, as demonstrated in the serial mammograms of 293 invasive ductal carcinomas characterized with a mass in patients aged 50–74. This implies that an age-adapted screening frequency based solely on tumour growth for invasive ductal carcinoma is not indicated.
Overview of studies on age and breast cancer volume doubling time.

CI: confidence interval; m: mean; md: median; MRI: magnetic resonance imaging; gm: geometric mean; n: number; VDT: volume doubling time.
Age-specific figures were not presented, but can be inferred under certain assumptions.
To our knowledge the only study that has examined age and breast cancer growth rate using serial screening mammograms and censoring in the analysis was performed by Peer et al. 3 This study, analysing data from the early years of the Nijmegen screening programme, calculated a geometric mean VDTs of 80 days in women younger than age 50, 157 days in women aged 50–69, and 188 days in women aged 70 and older. Peer’s study and our current study both used series of mammograms from the same screening programme, but in different periods. The geometric mean VDT of 191 days (age 50–74) in our study is somewhat higher (slower growing) than that reported in Peer’s study, possibly due to the exclusion of lobular breast cancers (which have a lower VDT 14 ) in our study.
We estimated growth rate assuming a constant tumour VDT, however, the Gompertz function, where growth is exponential in the beginning and slows down at a later phase, is probably a more realistic model for tumour growth over time. 25 Under influence of the available blood supply for the nucleus of the tumour, growth may slow due to central tumour cell necrosis in larger tumours. We did not have enough longitudinal measurements (i.e. patients with a tumour mass on ≥ 3 consecutive screening mammograms) to fit this function to our data, but the Gompertz function approximates the exponential function in the early pre-clinical stages of tumour development, as will be the case in screening. 25
Our study relied on serial mammographic measurements of masses to estimate growth rate, and so our results are based on a selection of cases from the Nijmegen breast cancer screening programme, i.e. 80% of all invasive ductal carcinomas. Carcinomas with indirect signs, such as architectural distortion (ILC and 10% of all IDC), or microcalcifications (9% of all IDC), were excluded due to the absence of a measurable tumour mass. These types of features on mammography are often related to interval cancers, probably with a lower VDT. Whether these kinds of tumours are associated with age would have to be studied using another method, e.g. that proposed by Michaelson et al., 26 which measures VDT based on the numbers of tumours seen at screening and tumour sizes assessed on pathologic analysis alone. 26
In conclusion, our study found no significant change in growth rate with age in women diagnosed with invasive ductal breast cancer in the screening age range 50–74.
Footnotes
Acknowledgments
The authors thank research assistant Monique Eijgenberger for her valuable contribution in measuring tumour sizes and assessment of the mammographic densities.
Declaration of conflicting interests
The author(s) declared no potential conflicts of interest with respect to the research, authorship, and/or publication of this article.
Funding
The author(s) received no financial support for the research, authorship, and/or publication of this article.