
Abstract
Objective
A rolling circle amplification (RCA) based commercial methodology using cell-free (cf)DNA to screen for common trisomies became available in 2018. Relevant publications documented high detection but with a higher than expected 1% false positive rate. Preliminary evidence suggested assay variability was an issue. A multi-center collaboration was created to explore this further and examine whether subsequent manufacturer changes were effective.
Methods
Three academic (four devices) and two commercial (two devices) laboratories provided run date, chromosome 21, 18, and 13 run-specific standard deviations, number of samples run, and reagent lot identifications. Temporal trends and between-site/device consistency were explored. Proportions of run standard deviations exceeding pre-specified caps of 0.4%, 0.4% and 0.6% were computed.
Results
Overall, 661 RCA runs between April 2019 and July 30, 2022 tested 39,756 samples. In the first 24, subsequent 9, and final 7 months, proportions of capped chromosome 21 runs dropped from 39% to 22% to 6.0%; for chromosome 18, rates were 76%, 36%, and 4.0%. Few chromosome 13 runs were capped using the original 0.60%, but capping at 0.50%, rates were 28%, 16%, and 7.6%. Final rates occurred after reformulated reagents and imaging software modifications were fully implemented across all devices. Revised detection and false positive rates are estimated at 98.4% and 0.3%, respectively. After repeat testing, failure rates may be as low as 0.3%.
Conclusion
Current RCA-based screening performance estimates are equivalent to those reported for other methods, but with a lower test failure rate after repeat testing.
Keywords
Introduction
The relationship between Down syndrome and maternal age was described in the 1930s and diagnostic amniocentesis was available 30 years later. These led to the first screening test for Down syndrome: asking pregnant women their age. The association of maternal serum alpha-fetoprotein with Down syndrome was reported in 1984 1 and by 2003 combinations of multiple serum and ultrasound markers in the first and second trimesters were available.2,3 These phenotypic markers have been widely implemented for nearly 40 years. 4
In 1997, a seminal finding of placental/fetal cell-free (cf)DNA in the maternal circulation would eventually change these screening practices. 5 However, the breakthrough that allowed this genotypic finding to become a screening test for common trisomies required the availability of a new technology: massively parallel sequencing. In 2009, two proof of concept studies reported successful identification of common trisomies using cfDNA.6,7 Two years later a large blinded validation study documented detection, false positive, and test failure rates for the common trisomies in the first and second trimesters of pregnancy.8,9 Multiple clinical cfDNA methodologies were subsequently developed that relied on existing sequencing technology and novel bioinformatics. Commercial developers of these tests provided clinical testing and the early methods were difficult to implement in existing serum screening laboratories where the expertise in prenatal screening was present. In 2018, a less complex and innovative methodology based on rolling circle amplification (RCA) was published.10,11 A commercial version of this RCA test was made available later that year in Europe that was targeted for prenatal serum screening laboratories and did not require extensive environmental controls or sequencing and bioinformatic expertise (Vanadis Diagnostics, Sollentuna, Sweden, a wholly owned subsidiary of PerkinElmer, Waltham, MA, USA).
In 2020, a large external evaluation study identified potential issues with the RCA/Vanadis methodology that could be responsible for higher than expected false positive rates and somewhat lower detection rates. 12 That study speculated that maintaining high chromosome-specific precision, expressed as a low run-specific standard deviation (SD), was key to high screening performance. 12 Preliminary evidence of these findings was reported to the manufacturer in early 2020.
Questions posed by the current report on the RCA methodology are fourfold. Is the chromosome-specific assay precision consistent between laboratories and/or devices? Has the assay precision changed over time? Have sources of variability been identified and addressed by the manufacturer? What performance improvements are expected? To address these questions, an informal collaboration of three academic and two commercial laboratories performing RCA screening on six devices provided relevant data. The manufacturer provided additional information regarding timing of reagent changes and relevant software modifications aimed at improving precision.
Methods
As a result of a discussion at a 2021 Vanadis laboratory users meeting, five laboratories in Europe and the United States agreed to contribute relevant non-identified summary data suitable for an analysis of run precision over time. This quality control assessment project did not require internal review board approval. Four sites reported summary data as part of clinical testing of a general population including both affected and unaffected pregnancies, while one site provided summary data from a published research project that included an over-representation of affected pregnancies. 12 Preliminary internal validation runs were not included for any sites. Data summarizing each run included the laboratory, device number, run date, number of patient samples, run precision (i.e. run-SDs) for chromosomes 21, 18, and 13, and identification numbers for key reagents and buffers lots. Only successful runs were included, as a failed run would not have run-SDs computed. Data were entered and collated in Excel (Microsoft, Redmond, WA, USA) and results reviewed by the respective laboratory directors. Graphics were produced via GraphPad Prism 9.4.1 (San Diego, CA, USA).
Methods for computing chromosome ratios, run-SDs, and z-scores were defined and implemented by the manufacturer. Briefly, run-SDs for chromosome 21 (C21) are computed after a trimming algorithm has identified and removed outlying values from the bivariate distributions of chromosome ratios for 21/18 and 21/13. Outliers are usually related to trisomic pregnancies. The trimmed C21 data is normalized to have a mean of 1.0 and the SD is then computed. Since the mean is 1.0, the C21 SD, expressed as a percentage, can be interpreted as the C21 coefficient of variation. However, it is reported by the software as the C21 run-SD. Patient-specific z-scores are computed using this run-SD when it falls below a pre-specified, chromosome-specific ‘cap’. For chromosomes 21, 18, and 13, these manufacturer-set caps were 0.4%, 0.4%, and 0.6%, respectively. Were a run-SD to exceed its cap, the z-score would be computed using the chromosome-specific cap value instead. This ‘capping’ of a run-SD has the effect of systematically increasing z-scores with the aim of maintaining high detection at the expense of an increase in false positive results. The focus of the current data collection/analysis is the variability over time of the chromosome-specific run-SDs used to compute the z-scores.
Trends for chromosome-specific run-SDs over the entire study window of 40 months were generated using Prism's built-in non-parametric locally weighted scatterplot smoothing (LOWESS) method to aid in visualization. Time was stratified into three periods. The earliest 24 months included monitoring of run-SDs as a critical quality control measure. High variability seen in one study 12 was communicated to the manufacturer in 2020 who then began exploring potential sources. The second time period (9 months) included introduction of both modified reagents and improvements to the image analysis software. The last time period (7 months) began when changes were fully implemented at all sites performing clinical testing in 2022. The proportion of run-SDs above 0.4%, 0.5%, and 0.6% were computed for each chromosome and the first and last time period were compared using a 2 × 3 table and a Chi-squared linear test of trend, with statistical significance at the 0.05 level. No corrections for multiple comparisons were made. Estimates for improved performance based on reduced run-SDs are derived from data collected from one participating laboratory that published validation results. 12 Computed proportions are associated with 95% confidence intervals (CI). 13
Results
Table 1 shows the five participating laboratories using RCA methodology, with one site reporting on two devices. Earliest reporting was from April 2019 (one site, one device) while the final data were collected for the month of July 2022 from four sites (five devices). Overall, data were reported for 661 successful runs including 39,756 patient samples. Average number of patients on a given run was 61 (range 39–84), with 84 being the maximum for a single run.
Overview of RCA-based cell-free DNA testing performed at five clinical laboratories.
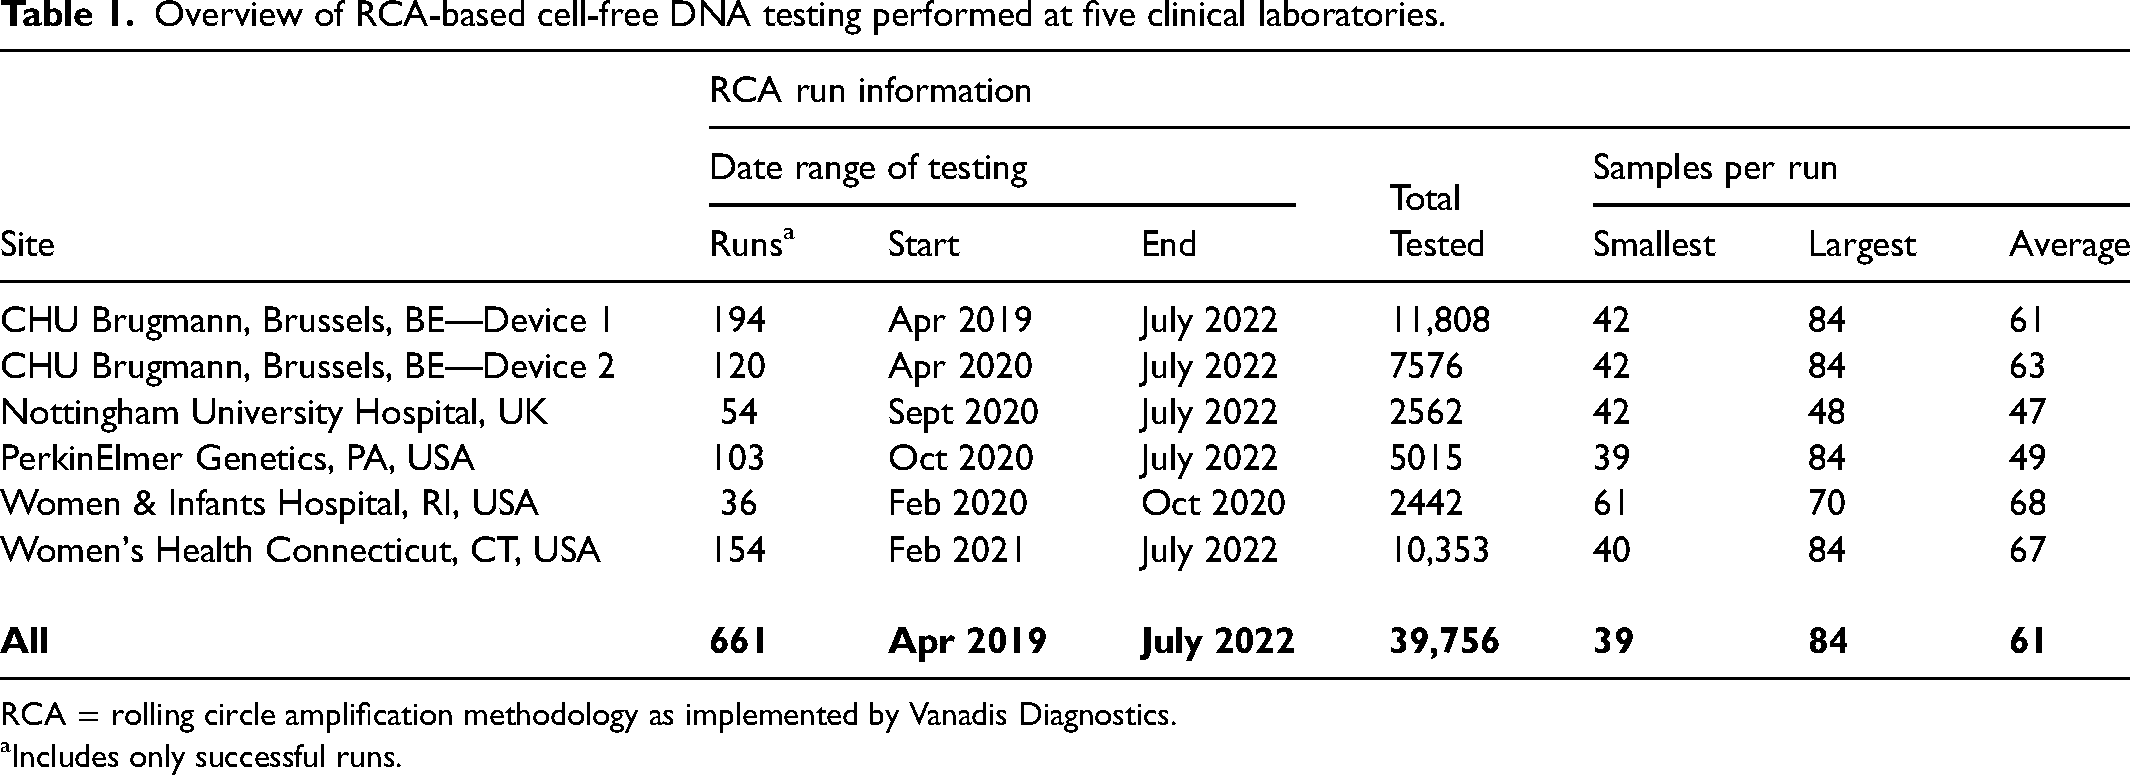
RCA = rolling circle amplification methodology as implemented by Vanadis Diagnostics.
Includes only successful runs.
Table 2 provides details for chromosome-specific run-SDs from each site for the entire time period, including the median, minimum, and maximum. Proportions of run-SDs above 0.40%, 0.50%, and 0.60% are also provided. The first section examines results for chromosome 21 where the median run-SD is 0.33%, below the cap of 0.4%. However, 23% of all runs were above this level. Results for chromosome 18 are similar, with a median of 0.37% and 40% of results over the cap of 0.4%. The chromosome 13, median run-SD of 0.40% is the highest of all three but only 3% fall above the cap of 0.6%.
RCA chromosome-specific run standard deviations (run-sds) at five laboratories.
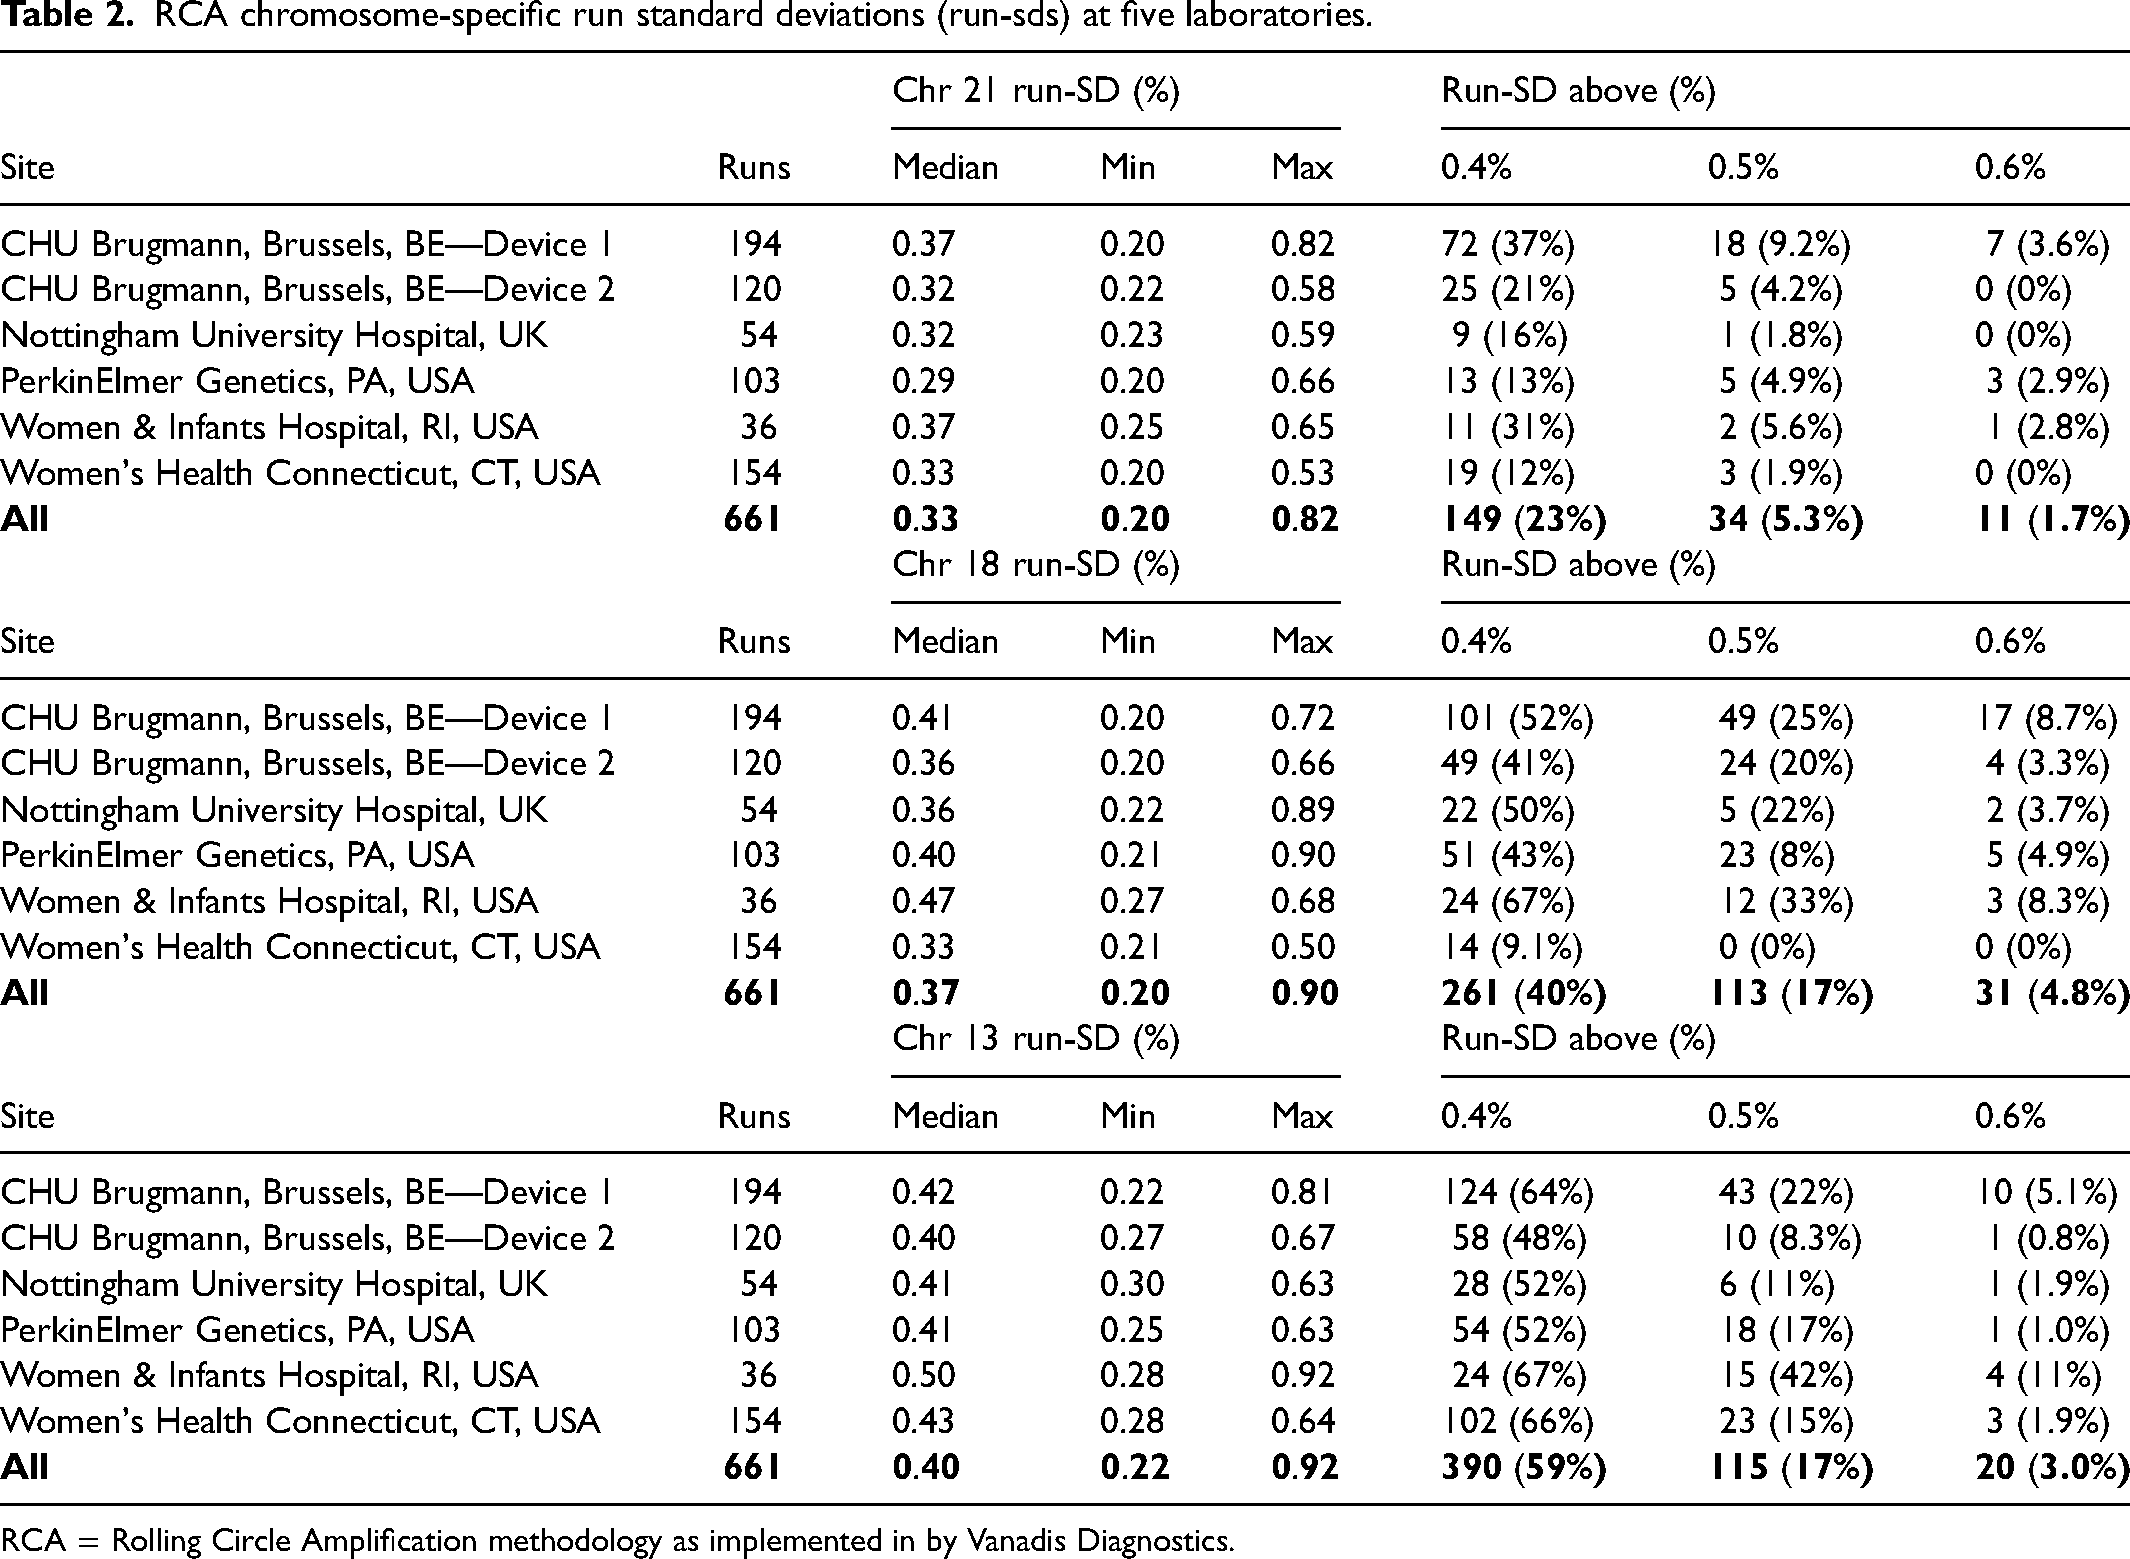
RCA = Rolling Circle Amplification methodology as implemented in by Vanadis Diagnostics.
Results in Table 2 show variability between laboratories/devices as they do not account for potential temporal trends. For example, were the run-SDs to improve over time, those laboratories utilizing the RCA methodology in 2019 and 2020 would likely have higher run-SDs than those laboratories beginning use in 2021 or later. To address this, run-SDs for all three chromosomes were plotted versus their run date (Figure 1). For chromosome 21 (Figure 1A), the grey-filled area shows the uncapped run-SD target at 0.40% or lower. Outlying observations over 0.80% are indicated by a filled circle and upwards arrow. In 2019, observations were often above 0.40%. In 2020, there were more runs reported, but the central tendency increased to 0.45%. Beginning in late 2021, run-SDs began to decline and by 2022, they were relatively steady at a lower level of 0.35%. For chromosome 18 (Figure 1B), the pattern was similar but more exaggerated with run-SDs approaching 0.50% to 0.60% in late 2020 and early 2021, well above the 0.40% cap. However, the same pattern of improvement is evident in late 2021 and a steady state at 0.35% was reached and maintained in 2022. Chromosome 13 (Figure 1C) had a higher cap at 0.60% and this was rarely exceeded. The pattern of improvement beginning in late 2021 is more muted, but the median level was slightly below 0.40%.
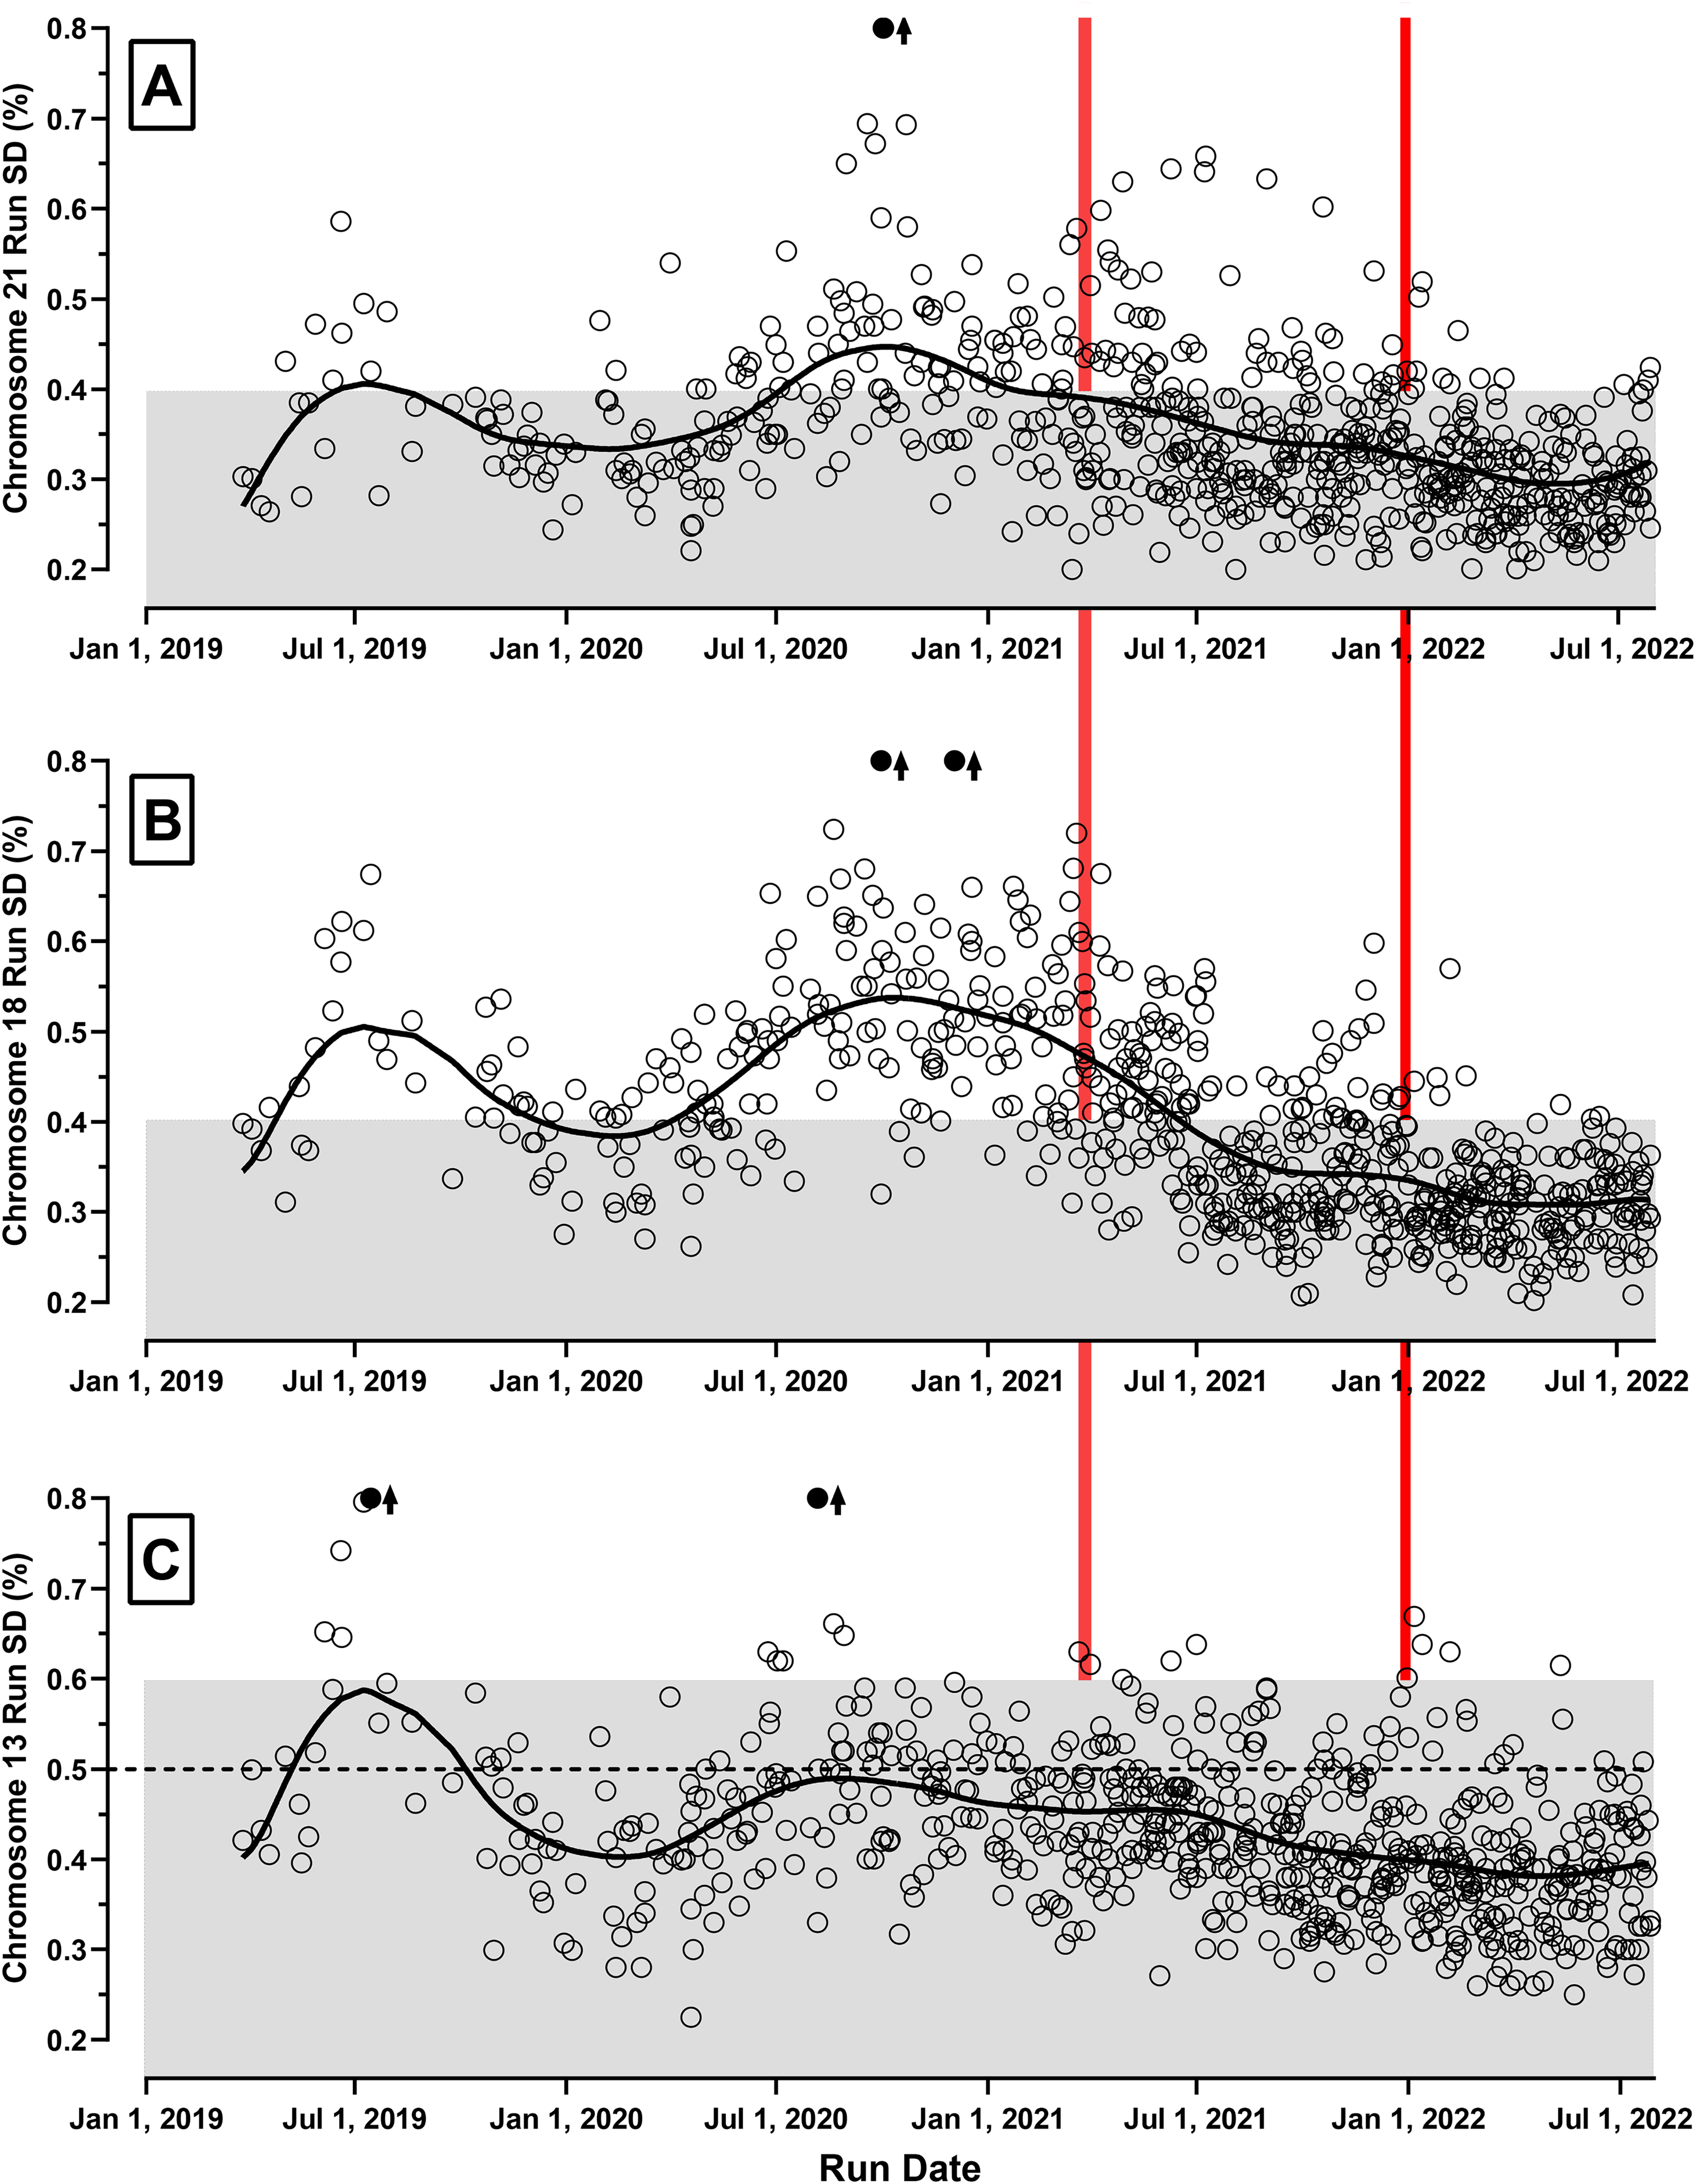
RCA run-SDs from five laboratories over time. The chromosome-specific run-SDs are shown for the 661 successful runs reported between March 26, 2019 and July 31, 2022 for chromosomes 21 (A), 18 (B) and 13 (C). All used the rolling circle amplification (RCA) methodology. The horizontal axis provides the run date, while the vertical axis shows each run's standard deviation (SD) expressed as a percentage (e.g. 0.40% = 0.0040). Laboratory operations were overlapping, with only one site/device active in 2019 and four sites/five devices active in 2022. The solid fitted curve indicates the consensus trends over time. The grey-filled areas show the target run-SD region below each chromosome's cap. Above this level, z-scores would be computed using the chromosome-specific caps (0.4%, 0.4%, and 0.6%, respectively). If a run-SD exceeded 0.8%, it is shown as a filled circle with an associated arrow. Two vertical lines categorize results into three time periods. The earlier runs (left-most) have a relatively high proportion of results above the respective caps (Table 2) and show high variability over those 24 months. In the middle section, there is a general decrease in run-SDs over the 9 months, especially for chromosome 18. In the most recent time period (first 7 months of 2022), all three chromosome-specific run-SDs have stabilized for all sites/devices, with only a small percentage falling above their respective caps. Most of these capped runs occurred in the first 2 months of 2022.
In late 2019 and early 2020, the manufacturer was informed by multiple sites that run-SDs were often being capped and the initial positive rate was higher than expected. In response, the manufacturer identified two potential issues: reduced effectiveness of buffer detergent lots over time and limitations in the imaging software that counted amplification products. Suspect buffers were subjected to a shortened expiration date and were eventually replaced with modified material. Imaging software was also revised and improved. However, laboratories chose to update software at various times in late 2021. By January 2022, all devices were using both new reagents and updated software.
Based on this information, the temporal analyses of run-SDs were divided into three time periods: April 2019 to March 2020 (24 months), April 2020 to December 2021 (9 months), and January 2022 to July 2022 (7 months). The three intervals could be characterized as before changes, during implementation of changes, and a steady state after changes to reagents and software.
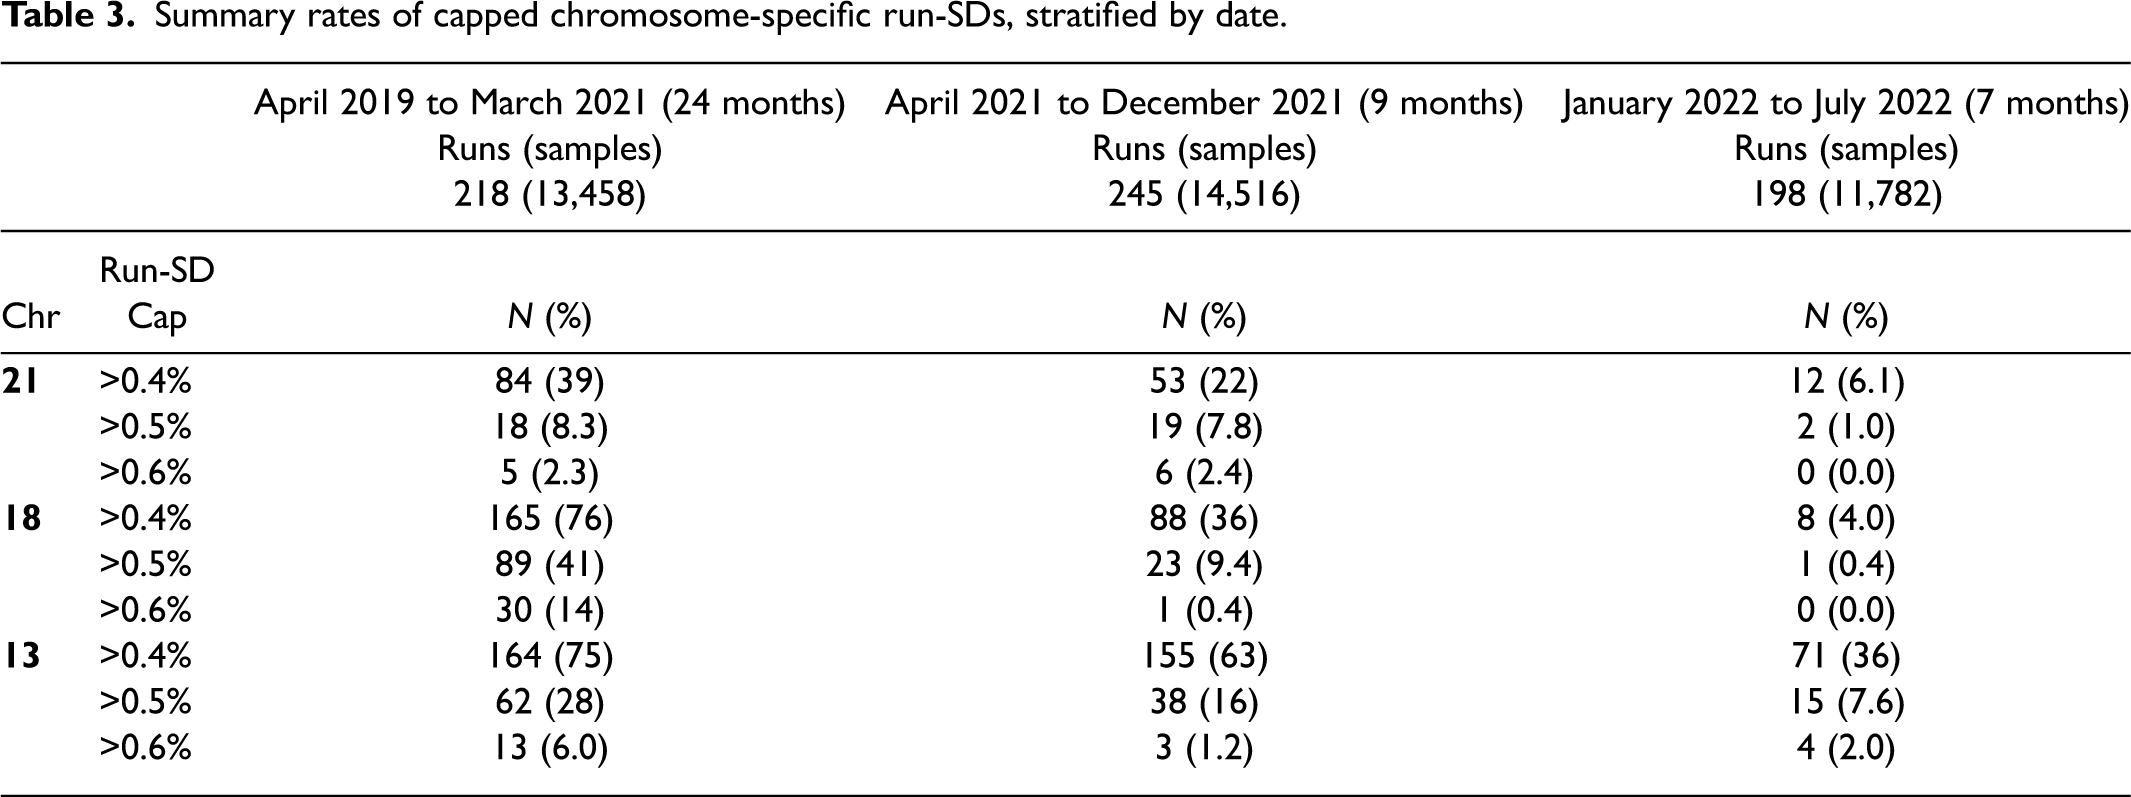
Table 3 shows the proportion of chromosome-specific run-SDs above 0.40%, 0.50%, and 0.60% stratified by time period. For example, the proportion of chromosome 21 runs above 0.40% significantly declined from 39% to 22% to 6.1% (Chi-squared test of trend, p < 0.001). Furthermore, the proportion of run-SDs above 0.60% declined from 2.3% to 2.4% to 0.0% in the last time period. More impressive reductions were found for chromosome 18 run-SDs, with proportions above 0.4% declining from 76% to 36% to 4.0% (p < 0.001). For chromosome 13, the proportions above the current cap of 0.60% dropped from 6.0% to 1.2% and 2.0%. Given these relatively low percentages in all three time periods, it may be reasonable to consider lowering the chromosome 13 cap to >0.50%. Were this lower cap used, the decline in rates would be 28% to 16% to 7.6% (p < 0.001). Median run-SDs for chromosomes 21, 18, and 13 in the 2022 time period were 0.30%, 0.30%, and 0.38%, respectively. Device-specific median run-SDs for the 2022 data are available (Supplemental Table 1).
Summary rates of capped chromosome-specific run-SDs, stratified by date.
Discussion
Data collected from five laboratories running six RCA devices from April 2019 through July 2022 show that all devices had comparable temporal trends in run-SDs for chromosomes 21, 18, and 13. After reagent modifications and improvements to the imaging software were fully implemented in late 2021, the 2022 run-SDs were significantly lower with few moderate outliers (Figure 2). Median run-SDs by site (Supplemental Table 1) are 0.30%, 0.30%, and 0.38% for chromosomes 21, 18, and 13, respectively. Although there remain some between-device differences in median run-SDs in 2022, all show considerable improvement over time and meet the expectations first described for the RCA methodology. 10 The issues with analytic validity have been addressed, but what impact might that have on clinical validity?
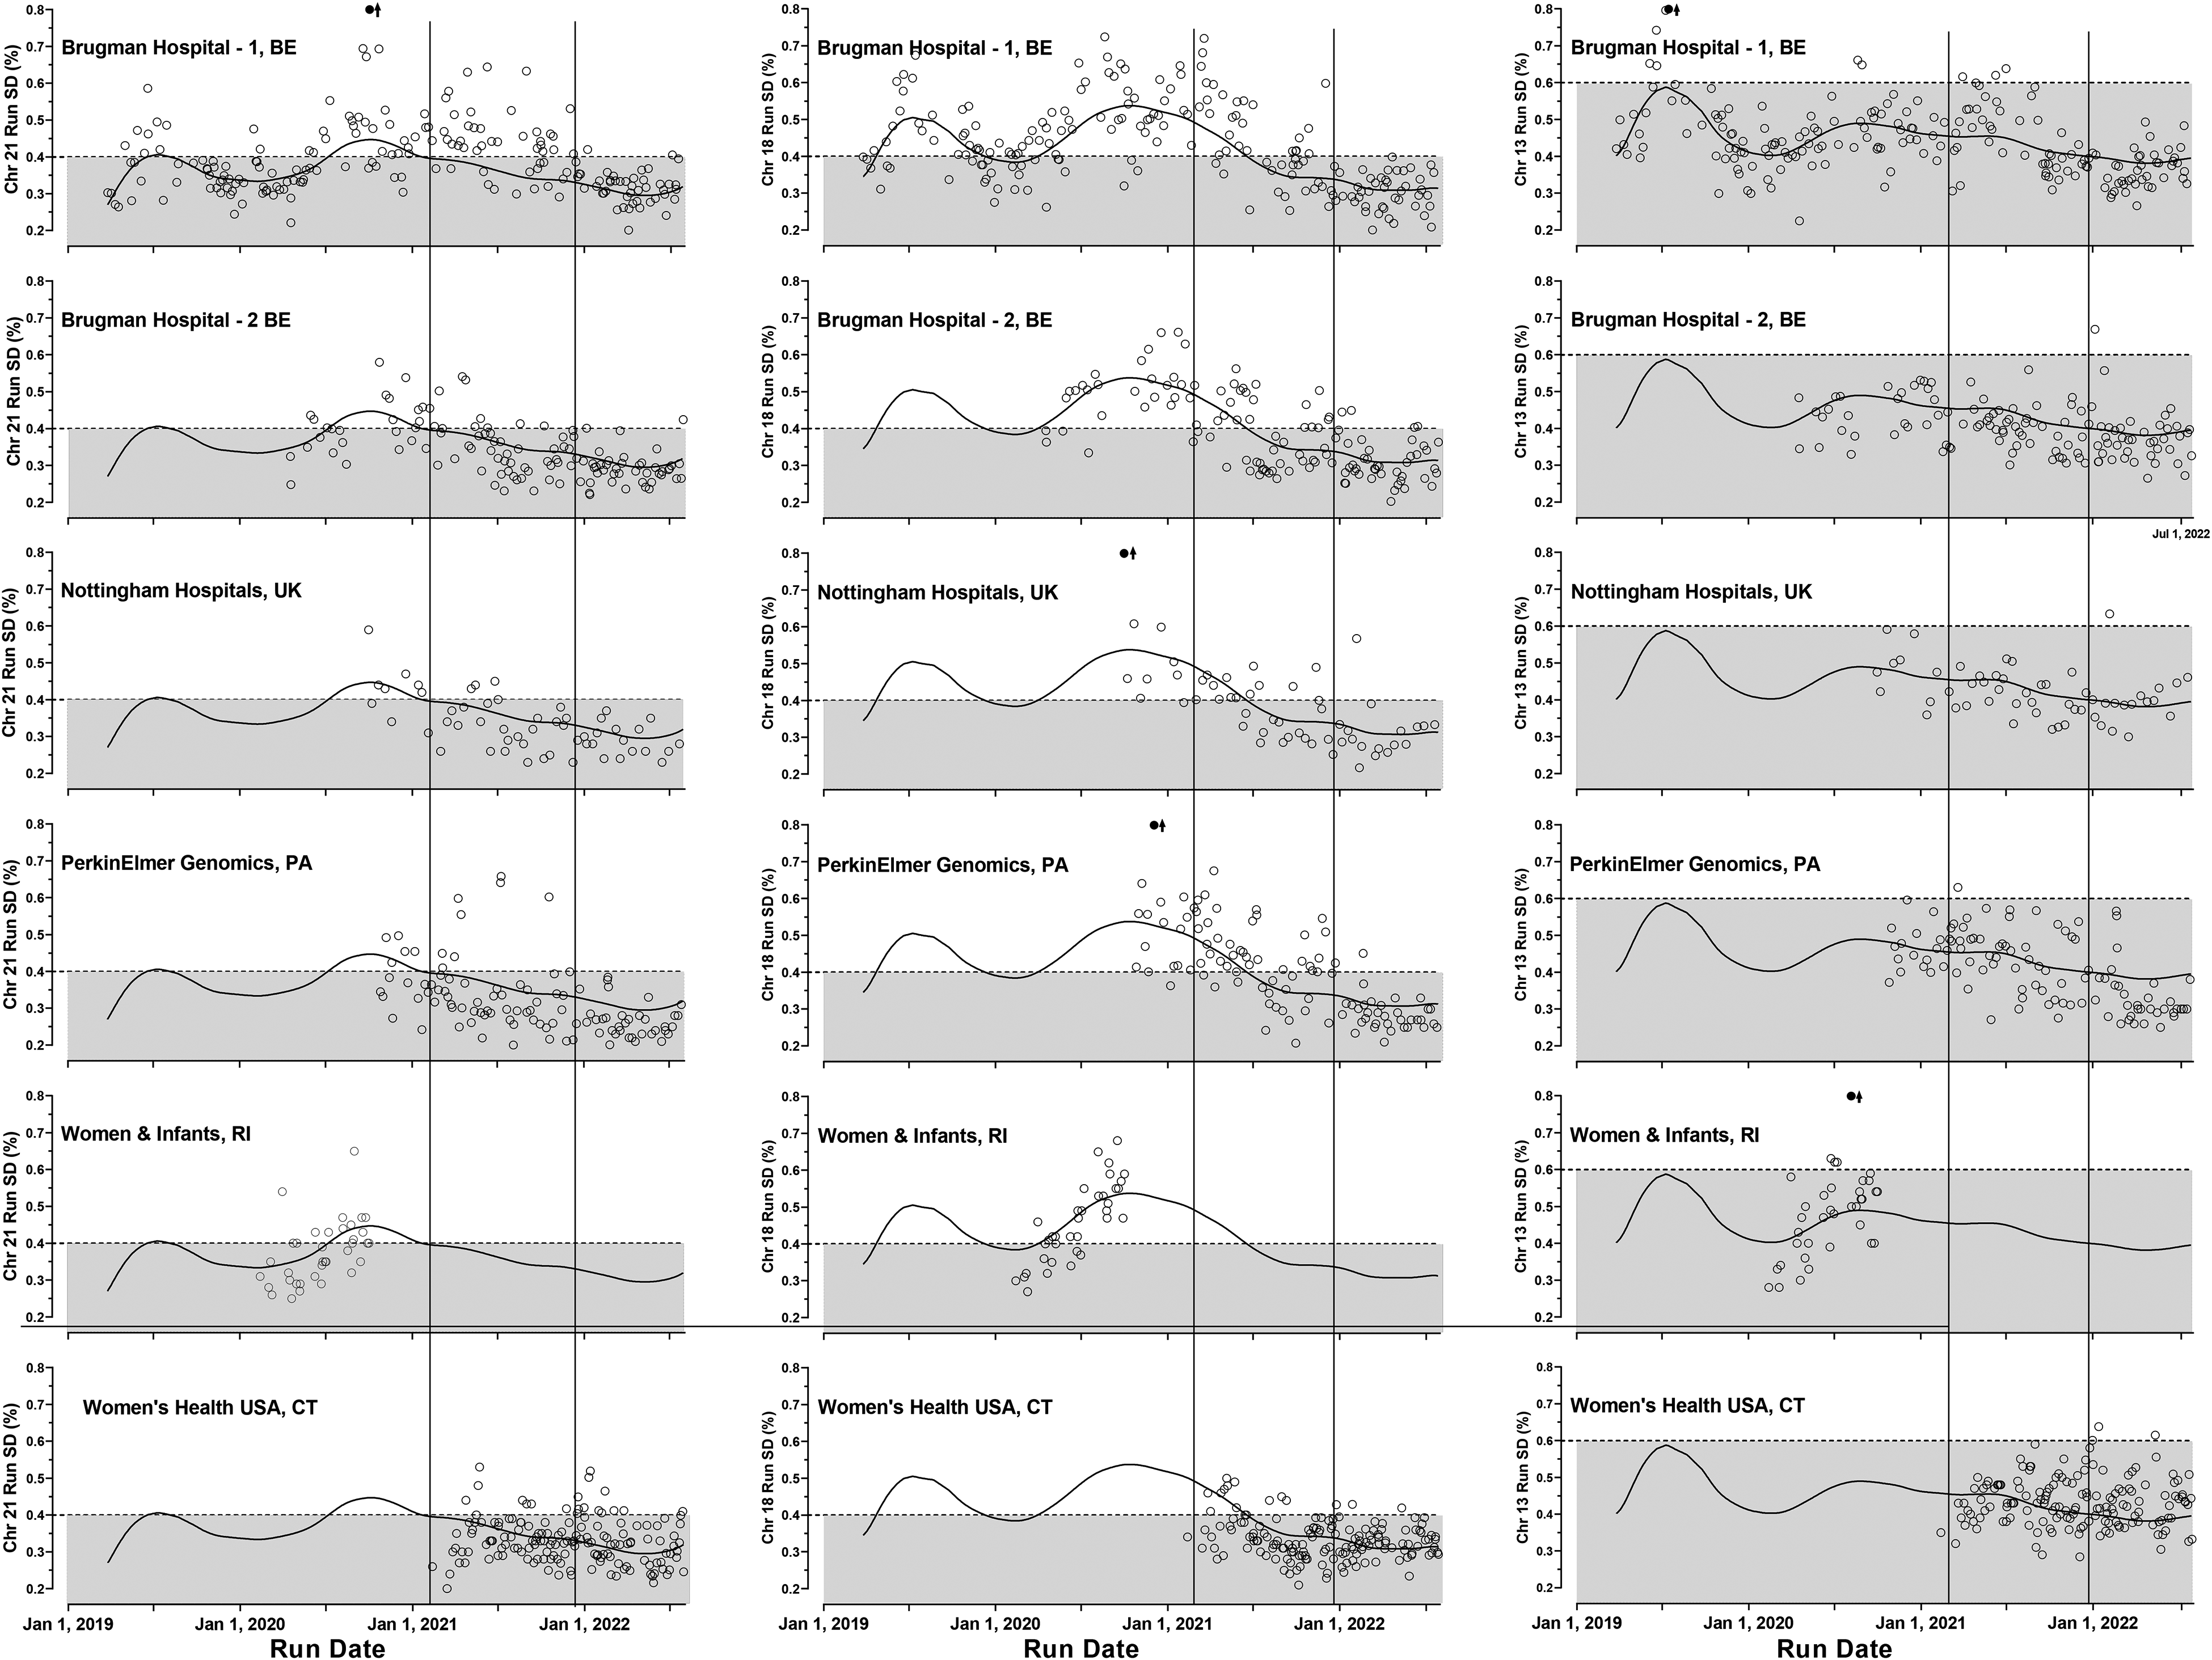
RCA device-specific run-SDs for chromosomes 21, 18, and 13 from five laboratories. The first column shows the chromosome 21 run-SDs over time for each of the six devices using the rolling circle amplification (RCA) methodology. For comparison, the overall weighted curve fit derived from the combined chromosome 21 results is included in each graphic for comparison (solid curve). The second and third columns show the device results for chromosome 18 and 13 run-SDs in the same order. Each row shows the results for a given laboratory/device. Two vertical lines separate the graphic into the three time periods: investigation, reagent and software implementation, and most recent ‘steady-state’ data.
In a previous validation study with samples run in 2020, 12 the effect of higher-than-expected run-SDs on both false positive and detection rates was estimated by stratifying results by whether run-SDs were capped or uncapped. The overall false positive rate in uncapped runs was 0.30% compared to 1.69% in capped runs. For uncapped runs, the median run-SDs for chromosomes 21, 18, and 13 were 0.32%, 0.34%, and 0.34%, similar to findings in this collaborative study for data collected in 2022 (0.30%, 0.30%, and 0.38%) providing confirmation that the false positive rate for all three chromosomes in 2022 is expected to be approximately 0.30%. Three meta-analyses provided summary false positive rates for other cfDNA methodologies of 0.39%, 14 0.13%, 15 and 0.30%, 16 consistent with these updated RCA-based estimated rates.
The overall detection rate in a large validation study 12 was 95.9%. For uncapped and capped runs, the rates were 94.6% and 97.1% and were not significantly different. However, this comparison was complicated due to the high proportion of cases on capped runs (45%, 86%, and 50% for chromosomes 21, 18, and 13). Were the chromosome 13 cap reduced to 0.50%, as suggested here, that rate would increase to 88%). Five false negative or borderline cases had sufficient sample to be retested, and four repeated as being screen positive (z-scores of 6 or higher) while one repeated negative. That report also suggested two modifications to the calling algorithm: the cap for chromosome 13 be reduced from 0.60% to 0.50% and runs with excessively high run-SD (e.g. ≥0.70%) be flagged for further evaluation and potentially rerunning those samples. Had these changes been implemented prior to the validation study 12 expected detection rates can be estimated at 84 of 85 (98.8%), 29 of 29 (100%), and 7 of 8 (97.6%) for trisomies 21, 18, and 13, respectively. The overall detection rate would then be 98.4% (120/122, 95% CI 93.9%–99.9%).
Relevant published meta-analyses14–16 using other methodologies reported summary detection rates for trisomy 21 of 99.5%, 99.7%, and 99.3%. For trisomy 18, these three estimates were 97.6%, 98.2%, and 97.4%, and for trisomy 13, 96.1%, 99.0%, and 97.4%. However, these rates are certainly overestimates as cases with an initial “no-call” or “test failure” were excluded. One report suggested these detection rates were overestimated by 1.7%, 1.6%, and 7.1% for trisomies 21, 18, and 13. 16 When an initial sample failed and a second sample collected at the same time was available, RCA methodology provides a result in nearly all instances. In one study, 35 of 35 initial failures were run successfully, including three trisomy 21 cases. 12 In another, 17 7 of 8 were successful. The summary success rate is 97.7% (95% CI 86.8%–99.9%). For example, at an initial failure rate of 1.5%, the revised failure rate is likely to be no higher than 0.3% (using the lower CI of success).
This study has limitations. Only five sites with six devices provided data and it is possible they do not represent overall performance of the RCA method. However, only one site (Women & Infants Hospital) monitored run-SDs while testing samples prior to 2022. Given the consistency of results over the 40 months, 661 runs and nearly 40,000 patients tested, those data are likely representative of the RCA devices in use over this time period. The estimated increases in the detection rates and reductions in the false positive rates are based on a previous publication. 12 Although this is an indirect method of analysis, the differences in the false positive rate, and the ability to have a repeated test in many of the false negatives on a run with a lower SD provide a level of confidence that there are important performance improvements. Lastly, both initial failures and failed runs still occur, and clinical laboratories can address this issue by initial collection of two blood samples.
In summary, early reports of the high performance using RCA methodology as well as reports of less stellar estimates are most likely due to variations in production of reagents and subsequent software updates. Initially, reagents were produced in small custom batches and validated prior to use in the laboratory that developed the test. When RCA-based testing was commercialized, reagents became mass-produced and quality measures improved over time with feedback from users. These transitional issues have now been addressed. In the future, quality assessment that closely monitors run-SDs should be readily available in the RCA-based software. Consistently high performance is achievable in a serum screening laboratory setting using the RCA methodology, with throughput as high as 14,000 samples per year for one full-time equivalent.
Supplemental Material
sj-doc-1-msc-10.1177_09691413231173315 - Supplemental material for Cell-free DNA-based prenatal screening via rolling circle amplification: Identifying and resolving analytic issues
Supplemental material, sj-doc-1-msc-10.1177_09691413231173315 for Cell-free DNA-based prenatal screening via rolling circle amplification: Identifying and resolving analytic issues by Glenn E Palomaki, Geralyn M Lambert-Messerlian, Donna Fullerton, Madhuri Hegde, Stéphanie Conotte, Matthew L Saidel and Jacques C Jani in Journal of Medical Screening
Footnotes
Acknowledgments
We thank Edward M Kloza, MS, CGC for assistance in identifying the run-SD as an issue and both the Vanadis and PerkinElmer employees for describing how the molecular testing was performed, analyzed, and the timing of changes to reagents and statistical methodology. After laboratory consent, PerkinElmer staff collected run-specific information from select sites as well as reagent lot information for all sites.
Declaration of conflicting interests
The authors declared no potential conflicts of interest with respect to the research, authorship, and/or publication of this article. G Palomaki and G Lambert-Messerlian have received authorship royalty from UptoDate and a previous research grant to Women & Infants Hospital for an international collaborative study of the Vanadis cfDNA technology's clinical validity (published: Clin Chem, 2022).
Employment or leadership
M Hedge is an employee of PerkinElmer, the company that commercially provides the Vanadis system. G Palomaki was a board member of the International Society for Prenatal Diagnosis (ISPD) and a past member of the CAP/ACMG Biochemical and Molecular Genetics Committee.
Funding
The authors received no financial support for the research, authorship, and/or publication of this article. M Saidel received travel funding from PerkinElmer to present at a scientific meeting.
Role of sponsor
PerkinElmer/Vanadis did not sponsor the project, but did assist in the collection of data from some sites as well as an overview of changes made to reagents and software updates.
Supplemental material
Supplemental material for this article is available online.
References
Supplementary Material
Please find the following supplemental material available below.
For Open Access articles published under a Creative Commons License, all supplemental material carries the same license as the article it is associated with.
For non-Open Access articles published, all supplemental material carries a non-exclusive license, and permission requests for re-use of supplemental material or any part of supplemental material shall be sent directly to the copyright owner as specified in the copyright notice associated with the article.