
Abstract
Objective
Despite Australia’s National Cervical Screening Program, Indigenous women have a disproportionately high burden of cervical cancer. We describe temporal and area-level patterns in prevalence of histologically conformed high-grade cervical abnormalities (hHGA) among cytologically screened women by Indigenous status.
Methods
This was a population-based study of 2,132,925 women, aged 20–69, who underwent cervical screening between 2008 and 2017, in Queensland, Australia. Of these, 47,136 were identified as Indigenous from linked hospital records. Overall patterns in hHGA prevalence by Indigenous status were quantified using prevalence rate ratios (PrRR) from negative binomial models. Bayesian spatial models were used to obtain smoothed prevalence estimates of hHGA across 528 small areas compared to the state average. Results are presented as maps and graphs showing the associated uncertainty of the estimates.
Results
Overall, screened Indigenous women had significantly higher hHGA prevalence than non-Indigenous women. However, the magnitude of the difference reduced over time (p < 0.001). Adjusted for age and area-level variables, Indigenous women had 36% higher hHGA prevalence (PrRR 1.36, 95% confidence interval [1.21–1.52]) than non-Indigenous women between 2013 and 2017. The overall effect of age decreased over time (p = 0.021). Although there was evidence of moderate spatial variation in 10-year prevalence estimates for both groups of women, the high levels of uncertainty for many estimates, particularly for Indigenous women, limited our ability to draw definitive conclusions about the spatial patterns.
Conclusions
While the temporal reduction in Indigenous: non-Indigenous differential in hHGA prevalence is encouraging, further research into the key drivers of the continuing higher risk among Indigenous women is warranted.
Keywords
Introduction
Cervical cancer incidence and mortality rates in Australia have declined rapidly 1 since the introduction of the National Cervical Screening Program (NCSP) in 1991 2 and are now among the lowest globally. 3 Despite it being one of the most preventable cancers, Aboriginal and Torres Strait Islander Australians (henceforth respectfully referred to as Indigenous women), continue to experience a disproportionately high cervical cancer burden.1,2
A key strategy to reduce cervical cancer incidence is cervical screening for early detection of cervical abnormalities and appropriate treatment to prevent progression to invasive tumours. 4 This focus has continued with the “Renewal” of the NCSP in late 2017, with the two-yearly Pap test for women aged 18 to 69 changing to a five-yearly primary human papillomavirus (HPV) testing for those aged 25–74. 4 While most low-grade abnormalities resolve without treatment, high-grade abnormalities (HGA) can indicate a true precancerous cervical lesion. 5
A Queensland study found that, up until 2011, Indigenous women undergoing cervical screening had a consistently higher prevalence of histologically confirmed HGA (hHGA) than non-Indigenous women, 6 with marked regional variation in these estimates across n = 78 local government areas (LGA’s) in Queensland. 7 The lack of Indigenous status information on pathology forms across Australia 2 has meant more contemporary hHGA prevalence estimates among Indigenous women are not available.
With the first population-based data on screening-related performance measures from the Renewed NCSP, including the prevalence of HGA, not being available until after 2022, 8 here we extend the previous study to include the most recent data (up to 2017) from the previous program. The key aim was to investigate overall temporal changes in hHGA prevalence and assess area-level variables associated with this prevalence by Indigenous status among screened women in Queensland during 2008–2017. Geographical mapping of health indicators has a long-standing history in public health. In particular, these analyses can potentially identify areas with higher or lower than average risk (in this case hHGA prevalence), thereby potentially allowing future assessment of the reasons for areas having low risk to subsequently inform the development of interventions targeting higher-risk areas. Hence, we also mapped hHGA prevalence estimates across 528 homogenous Statistical Area Level 2 (SA2) areas in Queensland that are deemed socio-economically relevant to their residents. 9
Methods
Ethics approval was obtained from the Human Research Ethics Committee (HREC) of Queensland Health (HREC/15/QCH/19–957), the Northern Territory Department of Health and Menzies School of Health Research (HOMER-2012–1737), and Charles Darwin University (H12093) for the previous study (until 2011) with waiver of consent. The Queensland Metro South HREC (HREC/2018/QMS/44,576) approved the updated study (2012–2017) with waiver of consent. Data access and record linkage were approved by the office of the Director-General of Queensland Health, relevant data custodians, and the Queensland Data Linkage unit.
Study cohort
The study cohort included all female residents of Queensland aged 20 to 69 who had a Pap test between 1 January 2008 and 31 December 2017. A screened woman was considered to have a hHGA if there was a record of a cytology-detected high-grade precancerous lesion or malignancy 2 confirmed through biopsy within six months (183 days) of a Pap test.6,7 Women with an hHGA report but no preceding cytology test and those with no corresponding PSR record within the previous six months were excluded. Indigenous women in the NCSP were identified by linking the population-based Queensland Health Pap Smear Register (PSR), which recorded all Pap tests performed state-wide, and the Queensland Hospital Admitted Patient Data Collection (QHAPDC) which has high-quality information on Indigenous status. 10 Indigenous status was defined using the majority-based algorithm 11 with a woman coded as Indigenous if at least 50% of her linked QHAPDC records within the study period identified her as Indigenous. All other women were considered non-Indigenous. Record linkage was carried out in two instalments, first covering women screened in 2006–20117,11 and then those screened in 2012–2017 (Supplemental Methods). 8
Geographical details
Population-weighted geographic correspondences 12 were used to map residential suburb and postcode at screening to the 2016 Queensland SA2 boundaries 9 as described previously. 8 Women without geographical information for all records were excluded.
Women were classified into three accessibility groups according to the travel distance from their SA2 at screening to major hospitals in 2016. 8 Area-level socio-economic status (SES) was assessed using the Index of Relative Socioeconomic Advantage and Disadvantage (IRSAD) 13 and remoteness using Remoteness Areas, 14 a measure of relative access to services. Area-level data on the Indigenous female population (%) was based on the 2016 Australian Census 15 and categorised as low (<1.9%) or high (≥1.9%), with the cut-off chosen to provide broadly similar distribution of populations in the two categories.
Statistical analysis
Bayesian spatial models were implemented in R 16 with the CARBayes package (version 5.1.3). 17 All other statistical analyses were performed using Stata/SE (Version 16.1, Special Edition; Stata Corporation, College Station, TX, USA). Maps were generated using MapInfo Professional (version 16.0, Pitney Bowes, Stamford, CT, USA).
Analysis for total Queensland
The prevalence of hHGA was calculated as the number of abnormalities among women in a given time period divided by the corresponding number of screened women for the same interval. Estimates were directly age-standardised to 2001 Australian standard population (per 1000 women) and stratified by Indigenous status. 6 A woman was considered to be screened in any given interval if she had at least one Pap test during that time.
Negative binomial models were used to quantify the Indigenous: non-Indigenous differential in hHGA prevalence. These models were chosen to account for extra-Poisson variation in the data. The outcome was the number of screened women with a hHGA with the offset variable being the log of the number of screened women. A stepwise model building process was used, starting with the full model that included age group, time period, Indigenous status, accessibility, SES, remoteness, and Indigenous population (%). Variables were then dropped from subsequent models based on likelihood ratio tests (p ≥ 0.20). Once dropped, each variable was given the opportunity to re-enter subsequent models.
All models were adjusted for Indigenous status, age group, and time-period. The final main-effect model also included SES, remoteness, and Indigenous population (%). We assessed temporal trends in hHGA prevalence by fitting an interaction term between each independent variable and time period. An interaction term between each variable and Indigenous status was also tested, but these were not included in the final models as their inclusion did not improve model fit (p ≥ 0.20).
Results are presented as prevalence rate ratios (PrRR) with 95% confidence intervals (CI). For each category of the included variables, the adjusted PrRRs for Indigenous versus non-Indigenous women were generated using the post-estimation lincom command in Stata. Individual coefficients and interaction terms were assessed with the Wald test (significant if p ≤ 0.05, two-sided).
Analysis by SA2
Unlike the total Queensland estimates, obtaining stable prevalence estimates by SA2s was only possible for all ages combined over the entire study period due to the low numbers (especially for Indigenous women) across various strata. For each SA2, and for Indigenous and non-Indigenous women separately, the indirectly age-standardised prevalence ratio (SPrR) was calculated by dividing the ten-yearly SA2-specific observed counts of abnormalities by their expected counts. Expected counts were obtained by applying the age-specific count of hHGA for total Queensland aggregated over 2008–2017 to the corresponding SA2-specific population of screened women (Supplementary Figure 1). Hence the SPrR estimates the area-specific hHGA prevalence relative to the Queensland average. Confidence intervals for the SPrR at the 95% level were calculated using modified gamma distribution. 18
Bayesian spatial Leroux models 19 were used to reduce the likelihood of spurious variation between small areas through spatial smoothing 20 (Supplemental Methods). Level of spatial variation was assessed using Tango’s maximised excess events test (MEET) global clustering test. 21
The median value of the smoothed SPrR was mapped using a diverging colour gradient where yellow represents the Queensland average (=100), orange/red higher than average, and blue lower than average hHGA prevalence. The colour gradient was linear on the log scale. The same colour scheme was used to graph the ranked mapped estimates with the associated 95% credible interval (CrI) 8 from the spatial models.
Results
The study cohort included 2,132,925 women with known geographical information who underwent a total of 3,998,523 Pap tests over the study period. Of these, 47,136 (2.3%) women were identified as Indigenous with 84,138 records. There were 26,571 screened women who had a hHGA within six months of a cytologically detected HGA, of whom 1,157 (4.3%) were Indigenous.
Overall prevalence
After full adjustment, hHGA prevalence was significantly higher for Indigenous women over both screening intervals: 2008–2012 (PrRR 1.86, 95% CI [1.66–1.99]) and 2013–2017 (PrRR 1.36, [1.21–1.52]) with the magnitude of the difference reducing over time (p < 0.001) (Table 1). Prevalence was lower in older women and higher for women from outer regional and remote/very remote areas. For 2008–2012 only, it was higher for women from areas with higher Indigenous population (%). There was no evidence of a significant association of hHGA prevalence with SES in either time period, or with Indigenous population (%) for 2013–2017. The overall effect of age decreased over time (p = 0.003) but remained highly significant. There was no statistical evidence for an interaction between SES, remoteness, or Indigenous population (%) and time (all p ≥ 0.07, Table 1).
Prevalence rate ratios (PrRR) [95% CI] of histologically confirmed high-grade cervical abnormalities by screening period; women aged 20–69, Queensland (Australia), 2008–2017.
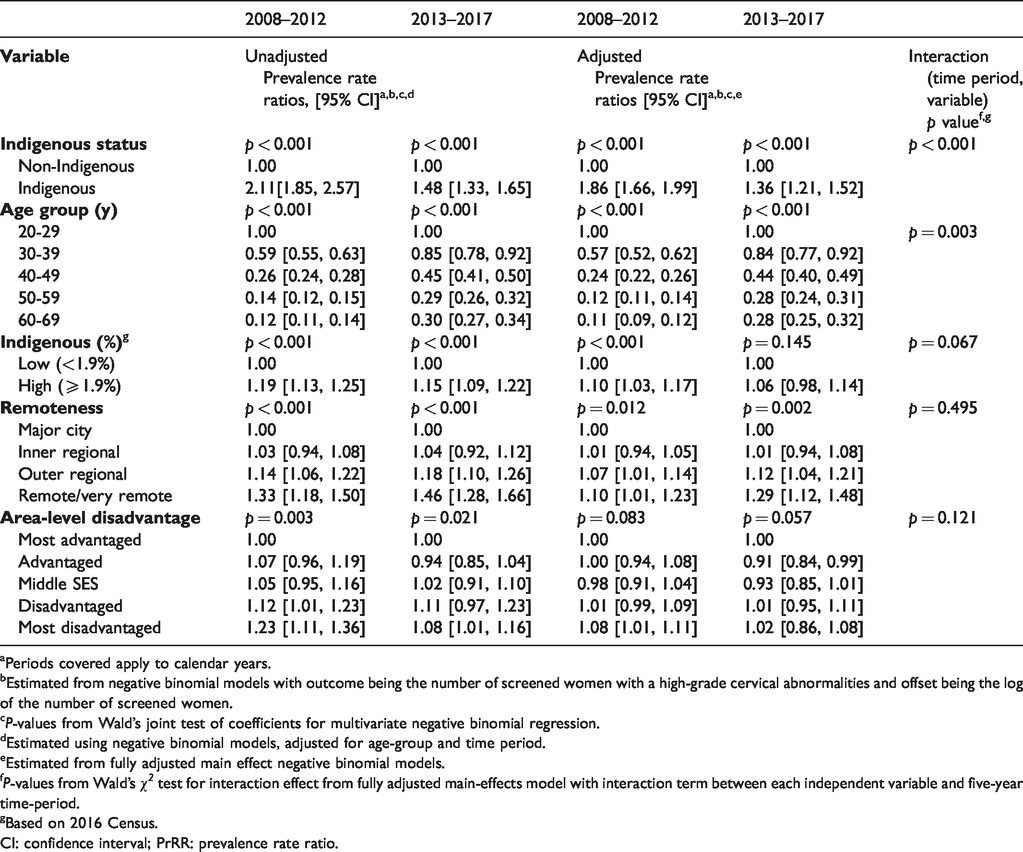
aPeriods covered apply to calendar years.
bEstimated from negative binomial models with outcome being the number of screened women with a high-grade cervical abnormalities and offset being the log of the number of screened women.
cP-values from Wald’s joint test of coefficients for multivariate negative binomial regression.
dEstimated using negative binomial models, adjusted for age-group and time period.
eEstimated from fully adjusted main effect negative binomial models.
fP-values from Wald’s χ2 test for interaction effect from fully adjusted main-effects model with interaction term between each independent variable and five-year time-period.
gBased on 2016 Census.
CI: confidence interval; PrRR: prevalence rate ratio.
For the most recent period (2013–2017), the adjusted Indigenous: non-Indigenous differential varied by age group (p = 0.021). For example, Indigenous women aged 20–29 had a 20% higher hHGA prevalence than non-Indigenous women (PrRR 1.20, 95%CI [1.01, 1.42]), while the differential was nearly three times higher among 50–59 year-olds (PrRR 2.75, 95%CI [1.95, 4.02]). There was no evidence (all p≥0.15, Table 2) that the differential varied by SES, remoteness, or Indigenous population (%).
Estimated prevalence of histologically confirmed high-grade cervical abnormalities by Indigenous status and Indigenous: non-Indigenous differential; women aged 20-69, Queensland (Australia), 2013–2017.
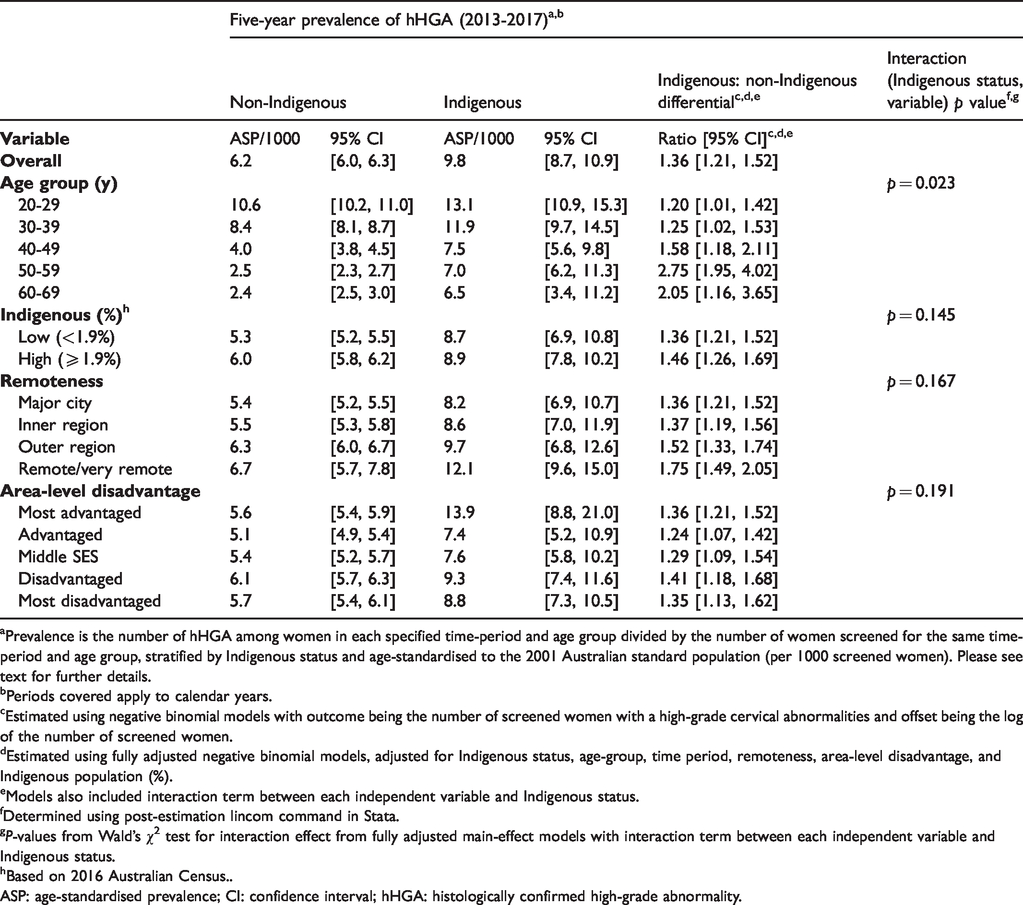
aPrevalence is the number of hHGA among women in each specified time-period and age group divided by the number of women screened for the same time-period and age group, stratified by Indigenous status and age-standardised to the 2001 Australian standard population (per 1000 screened women). Please see text for further details.
bPeriods covered apply to calendar years.
cEstimated using negative binomial models with outcome being the number of screened women with a high-grade cervical abnormalities and offset being the log of the number of screened women.
dEstimated using fully adjusted negative binomial models, adjusted for Indigenous status, age-group, time period, remoteness, area-level disadvantage, and Indigenous population (%).
eModels also included interaction term between each independent variable and Indigenous status.
fDetermined using post-estimation lincom command in Stata.
gP-values from Wald’s χ2 test for interaction effect from fully adjusted main-effect models with interaction term between each independent variable and Indigenous status.
hBased on 2016 Australian Census..
ASP: age-standardised prevalence; CI: confidence interval; hHGA: histologically confirmed high-grade abnormality.
Spatial patterns
There was evidence for moderate spatial variation (Tango’s MEET test) in the smoothed SA2-specific prevalence of hHGA for both groups of women (Tango’s p = 0.032 Indigenous, Tango’s p = 0.023 non-Indigenous). Compared to the total state average (2008–2017), prevalence estimates from the spatial models were higher for Indigenous women in over half (60%) of the 528 SA2’s, whereas for non-Indigenous women only seven SA2’s (1%) had higher prevalence. Of note is the greater uncertainty associated with the estimates for Indigenous women (Figure 1).
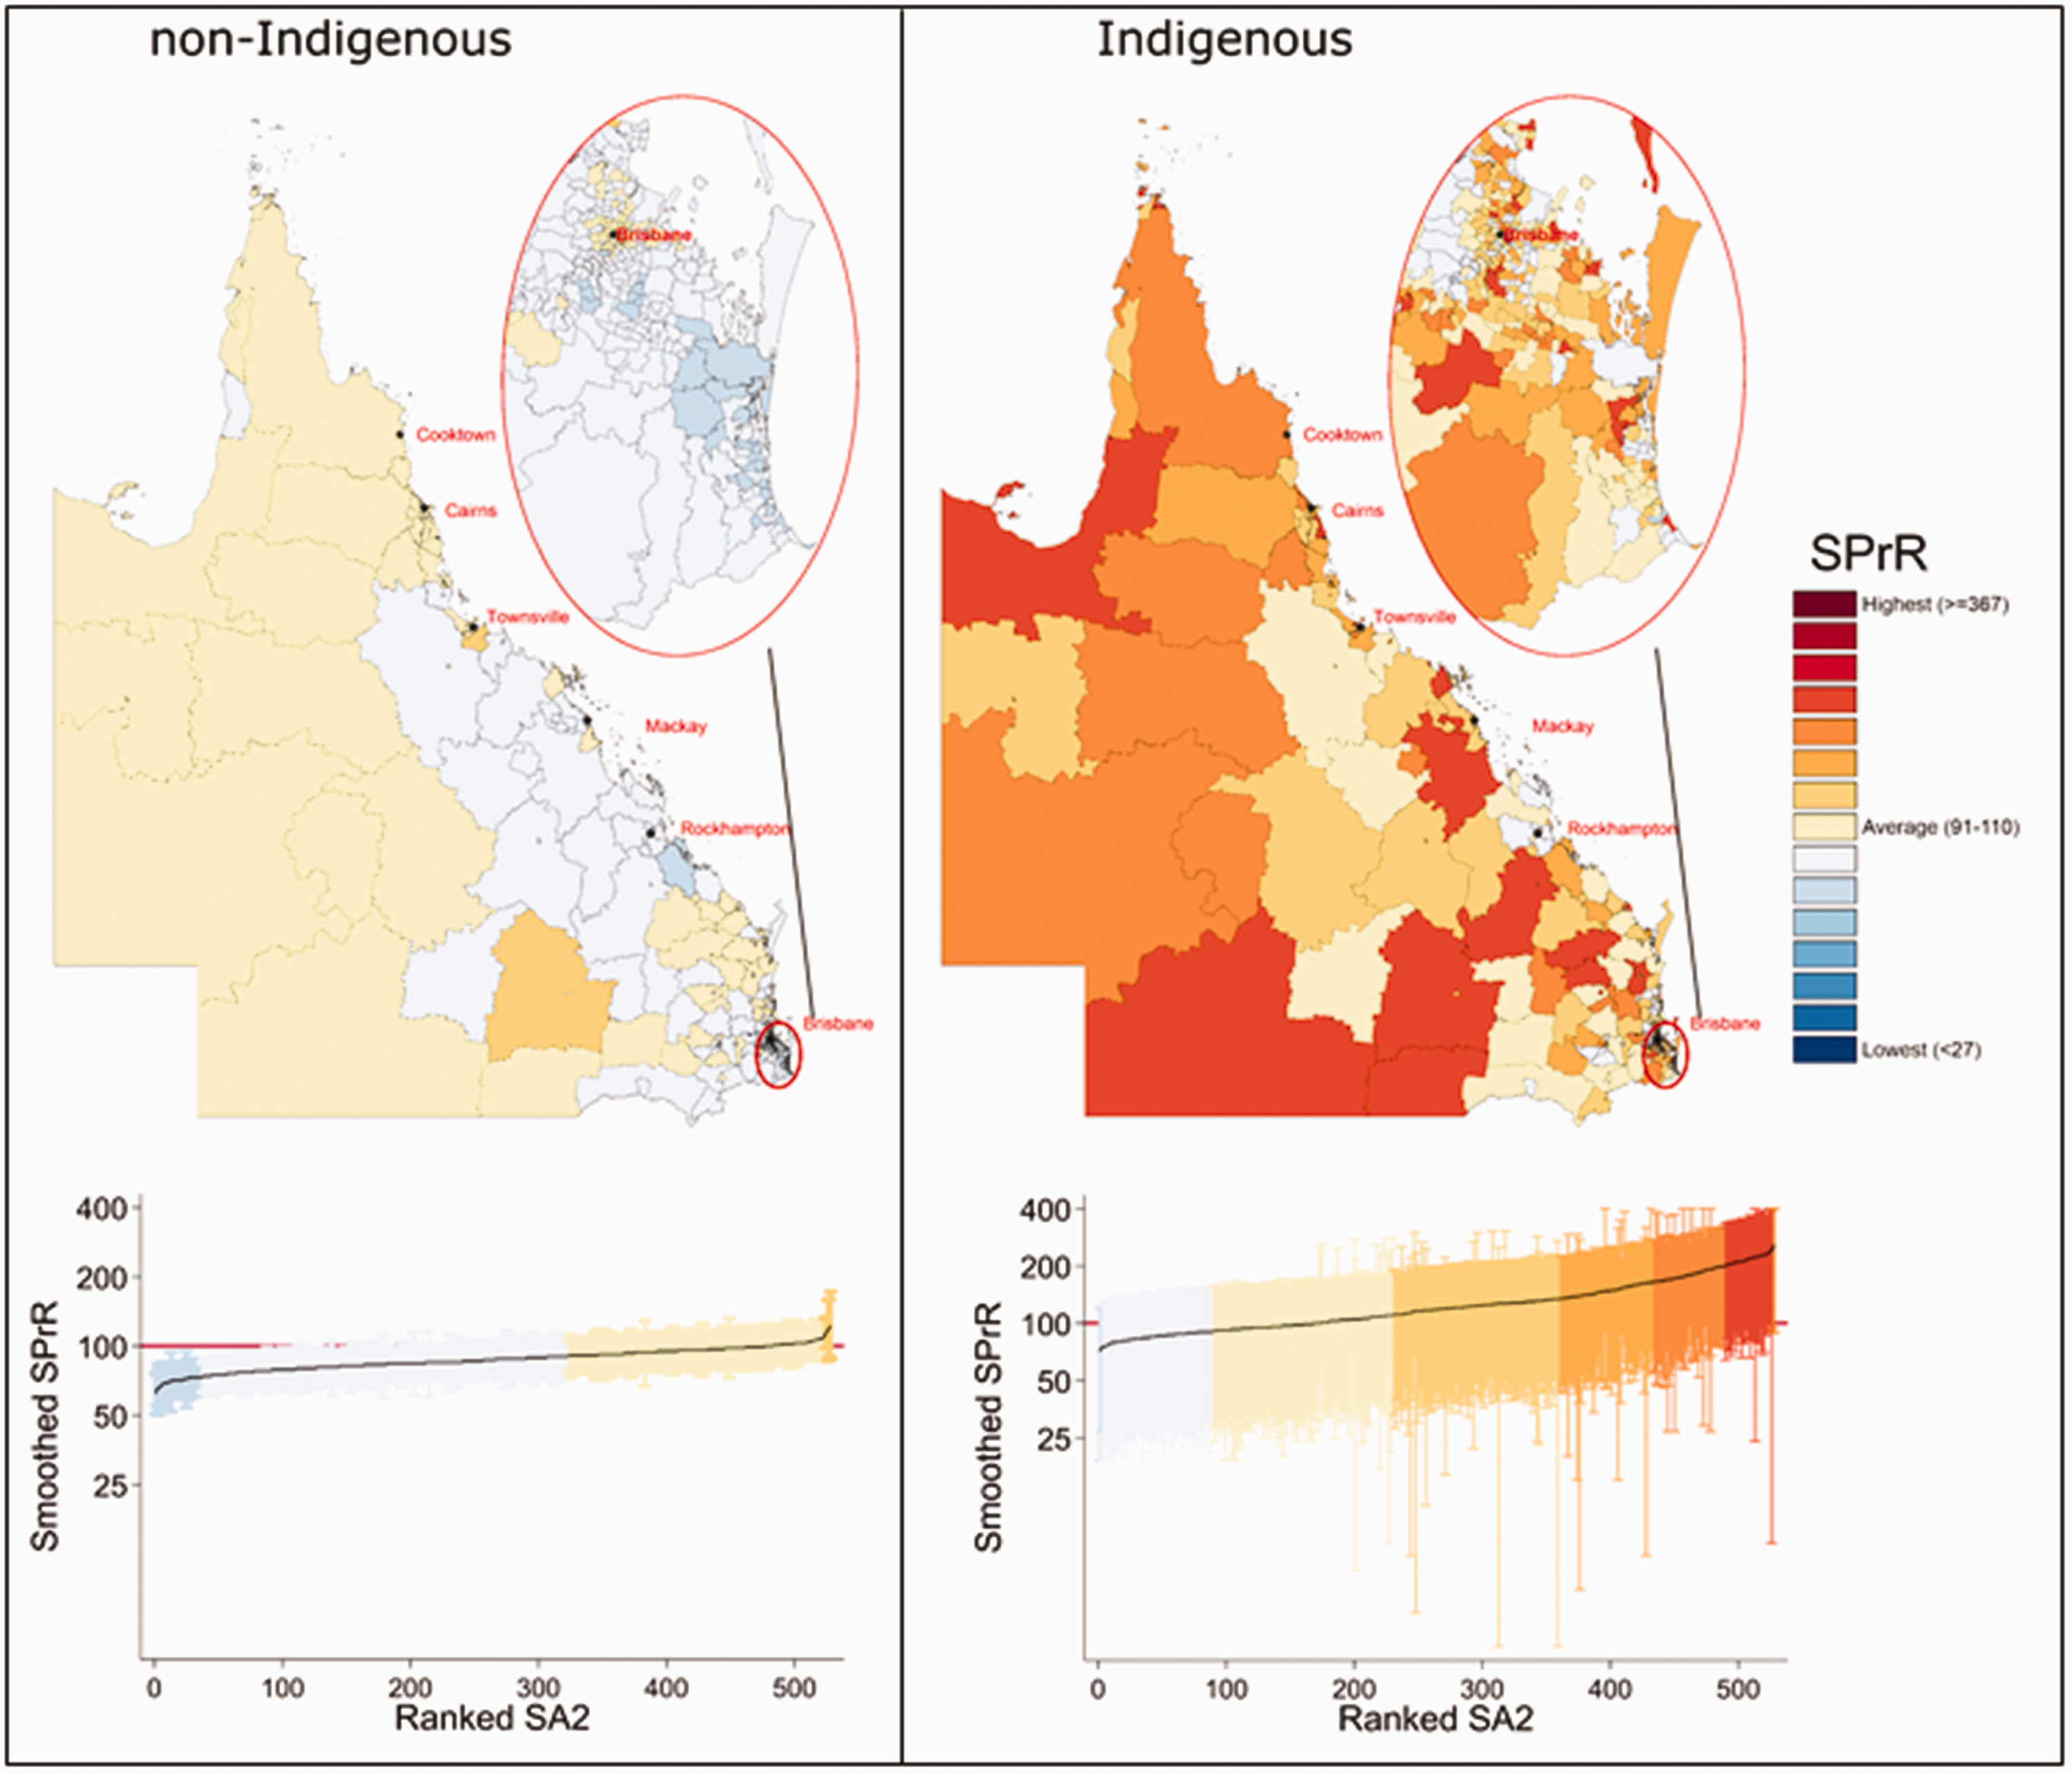
Spatial variation in smoothed prevalence ratio (SPrR) of histologically confirmed high-grade cervical abnormalities by Indigenous status and SA2; women aged 20–69, Queensland, 2008–2017. Reference population is for total Queensland. Graphs show associated uncertainty, using the same colour scheme as for the maps; solid line is the mapped estimate and dashed line is the estimate for total Queensland (2008–2017).
Discussion
This study highlights the consistently higher overall prevalence of hHGA among Indigenous women who underwent cervical screening in 2008–2017 compared with non-Indigenous women, in Queensland. This differential remained after adjustment for age group, area-level SES, remoteness, and Indigenous population (%), although the magnitude reduced over time. The smoothed SA2-specific estimates also suggested that hHGA prevalence was consistently higher among Indigenous women in small geographical areas across Queensland; however the high uncertainty associated with these estimates, consistent with sparse data, made it difficult to quantify the spatial patterns with a high degree of confidence.
Persistent oncogenic HPV infection is considered a necessary but not sufficient cause for precancerous cervical lesions.5,22 One possible reason for the observed differentials in hHGA prevalence may be population-level differences in the prevalence of recognised co-factors for progression to HGA among women with persistent oncogenic HPV infections, such as sexual and reproductive behaviours including earlier and higher parity, 22 hormonal factors, 23 smoking, 24 human immunodeficiency viral (HIV) infections, 25 chronic inflammation, 22 and lower SES. 26 Although we lacked the necessary data to explore these issues further, Indigenous women are, on average, more likely to live in lower SES areas, have higher smoking rates, and earlier and higher parity.27,28 Research to better understand the impact of these factors on observed prevalence patterns will likely require more purposeful and extensive data collection than what can be achieved through data linkage studies.
Although prior to the national HPV vaccination program no difference was found in the prevalence of high-risk oncogenic HPV16/18 among Australian women aged 17–40, by Indigenous status, other oncogenic HPV types appeared to be more prevalent among Indigenous women aged 31–40. 29 The consistently higher prevalence of cervical abnormalities among screened Indigenous women suggests that a difference in HPV infection patterns by Indigenous status may exist.6,7
However, our findings also suggested a temporal reduction in the magnitude of the overall Indigenous: non-Indigenous differential in hHGA prevalence. This change may reflect the protective impact of HPV vaccination among younger women against high-grade cervical abnormalities. 30 Since the introduction of Australia’s National HPV vaccination program in 2007, which included an ongoing school-based program for girls aged 12–13 and a ‘catch-up’ program for females aged 14–26 until 2009, 2 HGA prevalence has decreased in vaccine-eligible age cohorts. 30 While the greatest temporal reduction post vaccination occurred among younger women (<26 years), 31 decreases are now being observed among those aged ≤34.2,32 Over time, as vaccinated cohorts continue to age, continuing decreases in hHGA prevalence are expected with decline extending to older age groups. However, until there are contemporary data on HPV vaccination rates by Indigenous status, understanding its impact on hHGA prevalence patterns for our cohort is not feasible.
The impact of HPV vaccination on outcomes such as diagnosis of genital warts33,34 and cervical prevalence of vaccine-targeted HPV types 35 seems similar in young women irrespective of Indigenous status. However, despite an initially high uptake of the first dose for the three-dose vaccine, vaccination completion rates for the third dose were found to be lower for Indigenous than non-Indigenous adolescent girls from 2015–2016 in Queensland. 36 Hence ongoing strategies to ensure high coverage and to increase the currently lower course completion for HPV vaccination, particularly among Indigenous women, are crucial.
The higher hHGA prevalence among younger women and those living outside major cities are consistent with a previous Queensland study. 6 Age-specific patterns most likely reflect the natural history of HPV infections 22 which are most prevalent shortly after becoming sexually active. 5 That the magnitude of the Indigenous: non-Indigenous differential reduced after adjusting for area-level remoteness, SES, and Indigenous population (%) implies there may be underlying factors associated with these variables that also impact hHGA prevalence. While addressing these causes may help alleviate the existing disparities, the elevated adjusted PrRR suggests there are additional currently unmeasured factors also contributing to the disparity. Identifying these drivers is crucial to inform future interventions. Regardless, any strategies designed to reduce the burden of cervical hHGA among Indigenous women must be developed, implemented, and assessed by Indigenous communities to ensure they are culturally sensitive and address the key factors as identified by Indigenous women.37,38
Study strengths include using a contemporary population-based cohort that covers the period until the end of the previous NCSP in December 2017. While Indigenous status is not included in the Queensland Health PSR, record linkage with the QHAPDC enabled us to quantify the Indigenous differential in hHGA prevalence. Bayesian spatial models were used to generate more robust and interpretable smoothed estimates and preserve data confidentiality. However, the substantial uncertainty in many area-specific estimates, particularly for Indigenous women, limited our ability to draw definitive conclusions about spatial patterns.
Limitations include potential geographical misclassification reflecting reliance on the accuracy of self-reported address information at screening, and population-weighted geographic correspondence files. 8 Although the QHAPDC database is considered to have sufficiently reliable Indigenous status for research purposes, 10 and linkage quality was deemed to be high, potential misclassification of women through incomplete self-identification or during record linkage cannot be excluded. Lack of information on HPV vaccination status and known co-factors (e.g. smoking) for increased risk of cervical HGA5,22,25 also limited insights into reasons for the observed patterns.
The prevalence of hHGA for overall Queensland was reported using directly standardised rates (per 1000 women). However, SA2-specifc prevalence estimates were indirectly standardised to remove the substantial sampling variation that would occur with sparse data using direct standardisation. 39 These direct and indirect standardised rates cannot be directly compared. Aggregating the SA2-specific prevalence estimates over the entire 10-year study period ignores the significant reduction over time in the Indigenous: non-Indigenous differential in hHGA prevalence during the study period.
Spatial patterns should be interpreted in terms of which SA2s had higher or lower hHGA prevalence than the Queensland average, rather than a reflection of specific individuals living within that area. Hence, they cannot be used to either directly compare two areas or non-Indigenous versus Indigenous women. They cannot also be directly compared to previously reported LGA-specific estimates for Queensland 7 due to the differences in geographical units and methodology between the two studies.
Conclusions
This study highlights the consistently higher prevalence of cervical abnormalities among screened Indigenous women over 10 years in Queensland. While the reduction in this differential over time, notably among younger women, is encouraging, further research into the key causes of this continuing differential is crucial. This includes having contemporary data on HPV vaccination coverage by Indigenous status and information on potential barriers (or facilitators) to commencing and completing the vaccination course. Engagement with Indigenous communities will be integral to any successful interventions to achieve equitable cervical cancer-related outcomes for all Australian women.
Supplemental Material
sj-pdf-1-msc-10.1177_0969141320984199 - Supplemental material for Temporal and area-level variation in prevalence of high-grade histologically confirmed cervical abnormalities among Indigenous and non-Indigenous women, Queensland, Australia, 2008–2017
Supplemental material, sj-pdf-1-msc-10.1177_0969141320984199 for Temporal and area-level variation in prevalence of high-grade histologically confirmed cervical abnormalities among Indigenous and non-Indigenous women, Queensland, Australia, 2008–2017 by Paramita Dasgupta, Joanne F Aitken, John Condon, Gail Garvey, Lisa J Whop, Claire DeBats and Peter D Baade in Journal of Medical Screening
Supplemental Material
sj-pdf-2-msc-10.1177_0969141320984199 - Supplemental material for Temporal and area-level variation in prevalence of high-grade histologically confirmed cervical abnormalities among Indigenous and non-Indigenous women, Queensland, Australia, 2008–2017
Supplemental material, sj-pdf-2-msc-10.1177_0969141320984199 for Temporal and area-level variation in prevalence of high-grade histologically confirmed cervical abnormalities among Indigenous and non-Indigenous women, Queensland, Australia, 2008–2017 by Paramita Dasgupta, Joanne F Aitken, John Condon, Gail Garvey, Lisa J Whop, Claire DeBats and Peter D Baade in Journal of Medical Screening
Footnotes
Data availability statement
Data analysed for this paper are not able to be shared on any publicly available repository due to legal and confidentiality requirements.
Acknowledgements
We acknowledge the contributions of the Data Custodians of the Queensland Health Pap Smear Register, the Queensland Hospital Admitted Patient Data Collection, and the Queensland Data Linkage unit.
We would also like to acknowledge the contribution of Dr Jessica Cameron, Research Fellow, Cancer Council Queensland, for assistance with the spatial models and sensitivity analyses in R.
Declaration of conflicting interests
The author(s) declared no potential conflicts of interest with respect to the research, authorship, and/or publication of this article.
Funding
The author(s) disclosed receipt of the following financial support for the research, authorship, and/or publication of this article: This work was made possible by the generous support from the Jack and Madeleine Little Foundation, and the E Robert Hayles & Alison L Hayles Charitable Trust. Gail Garvey is supported by National Health and Medical Research Council (NHMRC) Investigator Grant (#1176651). Lisa J Whop is supported by a NHMRC Early Career Fellowship (#1142035).
Funding bodies had no role in the study design, collection, analysis, and interpretation of data, writing of this article or the decision to submit this article for publication.
Supplemental material
Supplemental material for this article is available online.
References
Supplementary Material
Please find the following supplemental material available below.
For Open Access articles published under a Creative Commons License, all supplemental material carries the same license as the article it is associated with.
For non-Open Access articles published, all supplemental material carries a non-exclusive license, and permission requests for re-use of supplemental material or any part of supplemental material shall be sent directly to the copyright owner as specified in the copyright notice associated with the article.