
Abstract
Objective
According to the Independent UK Panel on Breast Cancer Screening, the most reliable estimates of overdiagnosis for breast cancer screening come from stop-screen trials Canada 1, Canada 2, and Malmo. The screen-interval overdiagnosis fraction is the fraction of cancers in a screening program that are overdiagnosed. We used the cumulative incidence method to estimate screen-interval overdiagnosis fraction. Our goal was to derive confidence intervals for estimated screen-interval overdiagnosis fraction and adjust for refusers in these trials.
Methods
We first show that the UK Panel’s use of a 95% binomial confidence interval for estimated screen-interval overdiagnosis fraction was incorrect. We then derive a correct 95% binomial-Poisson confidence interval. We also use the method of latent-class instrumental variables to adjust for refusers.
Results
For the Canada 1 trial, the estimated screen-interval overdiagnosis fraction was 0.23 with a 95% binomial confidence interval of (0.18, 0.27) and a 95% binomial-Poisson confidence interval of (0.04, 0.41). For the Canada 2 trial, the estimated screen-interval overdiagnosis fraction was 0.16 with a 95% binomial confidence interval of (0.12, 0.19) and a 95% binomial-Poisson confidence interval of (−0.01, 0.32). For the Malmo trial, the estimated screen-interval overdiagnosis fraction was 0.19 with a 95% binomial confidence interval of (0.15, 0.22). Adjusting for refusers, the estimated screen-interval overdiagnosis fraction was 0.26 with a 95% binomial-Poisson confidence interval of (0.03, 0.50).
Conclusion
The correct 95% binomial-Poisson confidence interval s for the estimated screen-interval overdiagnosis fraction based on the Canada 1, Canada 2, and Malmo stop-screen trials are much wider than the previously reported incorrect 95% binomial confidence intervals. The 95% binomial-Poisson confidence intervals widen as follow-up time increases, an unappreciated downside of longer follow-up in stop-screen trials.
Keywords
Introduction
Overdiagnosis is the screen-detection of a preclinical cancer that would not have developed into clinically diagnosed cancer in the absence of screening. Because overdiagnosis causes unnecessary treatment estimating the fraction overdiagnosed is important for the evaluation of cancer screening. Three measures for the fraction overdiagnosed are
the screen overdiagnosis fraction (SOF), the probability of overdiagnosis among screen-detected preclinical cancers, the screen-interval overdiagnosis fraction (SIOF), the probability of overdiagnosis among cancers diagnosed in the screening program (preclinical cancers detected on screening and clinical cancers arising in subsequent intervals), the program overdiagnosis fraction (POF), the probability of overdiagnosis among persons entering the screening program.
SOF is most relevant for patient decision-making, but estimation requires data on the number of screen detections, which may be difficult to obtain. Some investigators favor SIOF because it is less dependent on screening frequency than SOF. 1 , 2 POF is relevant for policy analysts weighing harms and benefits of a screening program. We primarily discuss estimation of SIOF and briefly discuss the direct extension to SOF as well as estimation of POF.
A stop-screen trial randomizes participants to a no-screening control group or a screening group with follow-up after the last screen. Under the cumulative incidence method (CIM), the estimated SIOF (with equal numbers randomized to each group) is the excess cumulative number of cancers in the screened group versus the control group divided by the number of cancers diagnosed during the screening period. 3 , 4 If follow-up is longer than the maximum lead time, the estimated SIOF is an unbiased estimate of the true SIOF. 3 , 4
According to the Independent UK Panel on Breast Cancer Screening (the UK Panel), 1 , 2 the “most reliable estimates of overdiagnosis” in breast cancer screening are CIM estimates from three stop-screen trials: Canada 1 ages 40–49, Canada 2 ages 50–59, and Malmo ages 50–69. The UK Panel estimated SIOF in these trials and reported a 95% binomial confidence interval (BCI) that makes an incorrect assumption about the variance. Jacklyn et al., 5 Baker et al., 6 and Nelson et al. 7 also reported incorrect 95% BCIs for estimated SIOF or SOF. In the Methods section, we explain the problem with using the 95% BCI and derive a correct 95% confidence interval for estimated SIOF, which we call the binomial-Poisson confidence interval (BPCI).
Another important issue in estimating SIOF is adjusting for refusers, participants randomized to screening who do not receive screening. In the Malmo trial, approximately 30% of woman invited for screening were refusers. The adjustment for refusers increases the estimated SIOF and the estimated variance of the estimated SIOF. To adjust for refusers, we used the one-sided version of the method of latent class instrumental variables 8 that was independently formulated in 1994 by Baker and Lindeman 9 and Imbens and Angrist. 10 The method of latent class instrumental variables estimates a quantity often called the local average treatment effect (LATE) 10 , 11 or the complier average causal effect (CACE). 12 The one-sided version was independently formulated in 1983 by Baker in a technical report 8 and in 1984 by Bloom. 13 In the Methods section, we explain how it uses randomization and latent classes to avoid bias while requiring an assumption that almost certainly holds. The two-sided version adjusts for both refusers in the screened group and participants in the control group who immediately receive screening outside the trial. Although the more general two-sided method of latent class instrumental variables generally yields identical estimates to the estimates from the deattenuated method of Newcombe 14 (which Jacklyn et al. 5 applied to overdiagnosis), and the method of Cuzick et al., 15 the assumptions differ.
We reanalyzed the data from the UK Panel using the one-sided method of latent class instrumental variables to adjust for refusers and using a corrected variance to obtain confidence intervals. We also compared the BPCI to bootstrap confidence intervals calculated in lung cancer screening trials.
Methods
For the specified follow-up after the time of the last screen, the estimated SIOF under the CIM is

n0 = cumulative number of clinical cancers in the control group,
n1 = cumulative number of screen-detected preclinical cancers and clinical cancers in the screened group,
nS = number of diagnosed cancers (screen-detected preclinical cancers and clinical cancers) in the screened group during the screening period,
r = ratio of sample sizes of the screened to control groups.
BCIs—an incorrect measure of uncertainty
The UK Panel reported a 95% BCI for the estimated SIOF, which implicitly assumed the following binomial estimated variance for SIOFCIM,

Equation (2) is an incorrect estimated variance for SIOFCIM because the numerator of SIOFCIM in equation (1) is not a realization from a binomial distribution. A binomial random variable is defined as the sum of independent Bernoulli random variables (random binary indicators for each individual). The numerator of SIOFCIM is not a sum of realizations of independent Bernoulli random variables, so the use of an estimated binomial variance is incorrect.
A likely reason that some investigators use equation (2) for the estimated variance of SIOFCIM is the mistaken view that SIOFCIM is equivalent to SIOFBin = x/nS, where x is the number of diagnosed cancers in the screening program that are overdiagnosed. (SIOFBin is not used because it is not possible to observe x.) Let Yi denote a Bernoulli random variable, where Yi = 1 if the ith diagnosed cancer in the screening program is overdiagnosed, with probability SIOF, and 0 with probability (1–SIOF). Let random variable X (with realization x) equal Σi Yi, for i = 1, 2, … , nS. Based on probability theory, X follows a binomial distribution with expected value nS SIOF and variance nS SIOF (1–SIOF). For this binomial distribution, the maximum likelihood estimate of SIOF is SIOFBin = x/nS, and the estimated variance for the binomial distribution is SIOFBin (1–SIOFBin)/nS., which has the same form as the estimated variance in equation (2) and is a correct variance for SIOFBin.
In summary, because the numerator of SIOFCIM is a weighted difference in the cumulative numbers of cancers in the two randomization groups and not the sum of realizations of independent Bernoulli random variables (unlike the numerator of SIOFBin), the use of a 95% BCI for SIOFCIM is incorrect.
BPCIs—a correct measure of uncertainty
To obtain the correct variance of the estimated SIOF, we first rewrite the estimated SIOF as

We assume the cumulative number of cancers at a given time follows an independent Poisson distribution for each group, as specified by n0 ∼ Poisson(1/μ0) and n1 ∼ Poisson(1/μ1). A Poisson distribution assumes the occurrence of one event does not affect the probability that another event will occur, so it is appropriate for modeling the numbers of cancers arising each year after randomization. The cumulative number of cancers in each year after randomization follows a Poisson distribution because the sum of independent Poisson random variables is a Poisson random variable. Given the n1 cumulative cancers in the screened group, we assume the number nS who are diagnosed with cancer during the screening period follows a binomial distribution, as specified by nS ∼ binomial(n1, π). Under these assumptions, E(n0) = μ0, Var(n0) = μ0, E(n1) = μ1, Var(n1) = μ1, E(nS|n1) = n1 π, and Var(nS|n1) = π (1–π) n1. Applying the law of total covariance,
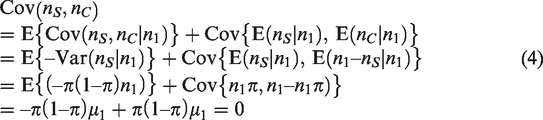
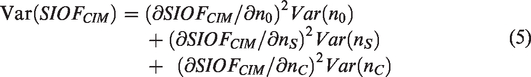
Because the counts from each randomization group are independent, Cov(nS, n0) = Cov(nC, n0) = 0. Based on the delta method with the covariances equal to 0, the variance of SIOFCIM is
Applying the law of total variance,
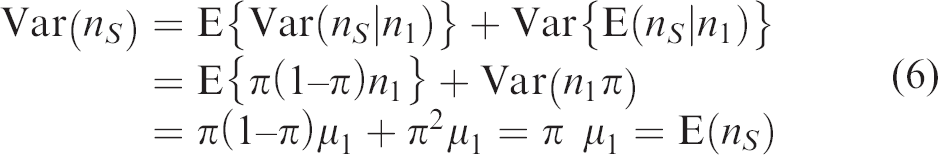
Equation (6) suggest estimating Var(nS) by nS. A similar equation suggests estimating Var(nC) by nC. For the Poisson distribution, the usual estimate of Var(n0) is n0. Substituting these variance estimates into equation (5), treating r as known (due to the large sample size), and simplifying yields the estimated variance of SIOF
CIM
,
If r = 1 the variance in equation (7) reduces to


The 95% BPCI is SIOFCIM ± 1.96 Var(SIOFCIM)½.
Adjusting for refusers
Another factor that affects variability in the overdiagnosis estimate, as well as the magnitude of the estimate itself, is noncompliance. An often-encountered form of noncompliance in cancer screening is refusers; i.e. individuals who are offered screening but do not receive screening. We adjust for refusers using the one-sided version of the method of latent class instrumental variables, 8 applied to estimating the fraction overdiagnosed. Consider two latent classes: (i) never-takers who would not receive screening regardless of randomization group and (ii) compliers who would receive screening only if randomized to screening. For a population (ignoring sampling variability), let
qcomplier1 = cumulative probability of screen-detected preclinical cancer or clinical cancer among compliers randomized to screening,
qcomplier0 = cumulative probability of screen-detected preclinical cancer or clinical cancer among compliers randomized to no screening,
qnever-taker = cumulative probability of screen-detected preclinical cancer or clinical cancer among never-takers,
π = probability of being a complier, which, by virtue of the randomization, is the same in both randomization groups.
For a population, the cumulative probabilities of screen-detected preclinical cancer or clinical cancer in the screened and control groups are, respectively


An assumption in equations (9) and (10) is that qnever-taker does not vary by randomization group, which almost certainly holds because refusing screening implies that never-takers in both groups have the identical experience of no screening, and it is unlikely that there would be other cancer treatments (e.g. tamoxifen) preferentially received in one randomization group. Let SIOFCIM(pop) denote the estimated SIOF if the estimation formula was applied to the general population, which includes both compliers and never-takers. Let SIOFCIM*(pop) denote the estimated SIOF if the estimation formula was applied to a population of compliers. Based on equations (9) and (10)

Let SIOFCIM* denote the estimated SIOF among compliers in the randomized trial. Let πest denote the fraction randomized to screening who receive screening. Ignoring the sampling variability in πest, which is small due to the large numbers involved, equation (11) implies


Use of SIOFCIM* preserves the advantage of randomization and thereby avoids the bias of comparing estimated SIOF in refusers with estimated SIOF among person receiving screening. We assume SIOFCIM*, which strictly applies only to compliers, generalizes to all participants. This is a similar level of generalizability as going from results of a randomized trial to the general population. The 95% BPCI adjusted for refusers is SIOFCIM* ± 1.96 Var(SIOFCIM*)½. The adjustment for refusers increases the width of the confidence interval beyond the increased width due to the use of BPCI instead of BCI. See Appendix 1 for estimates and estimated variances for SOF and POF.
Wider BPCIs with longer follow-up
The widening of the BPCI with longer follow-up can be seen by inspecting the variance in equation (8). A longer follow-up time increases n0 and nC while nS remains constant. The magnitudes of the increases in n0 and nC are similar because both involve clinical cancers arising in the follow-up period, which occurs in approximately equal numbers in each randomization group. Therefore, with longer follow-up, the main change in the variance in equation (8) is an increase in n0 + nC in the numerator, which increases its magnitude. As shown in Appendix 1, BPCIs for SOF and confidence intervals for estimated POF also widen with longer follow-up.
Results
Reanalysis of breast cancer stop-screen trials
Using the BPCI with adjustment for refusers (where applicable), we reanalyzed the breast cancer stop-screen trials analyzed by the UK Panel. For these trials, the number randomized to the screening program approximately equaled the number randomized to the control group. Following the UK Panel, we discuss estimation of SIOF for all breast cancers (invasive and in situ).
The Canadian National Breast Screening Study-1
The Canadian National Breast Screening Study-2 (Canada 2 trial) randomized approximately 40,000 women aged 50–59 to four or five annual rounds of mammography and physical examination versus annual physical examinations. 17 The UK Panel analyzed the following data from Miller et al. 17 involving follow-up times of 11 to 16 years. Based on the abstract in Miller et al., 17 there were n0 = 610 + 16 = 626 breast cancers in the control group and n1 = 622 + 71 = 693 breast cancers in the screened group, yielding an excess of 67 breast cancers in the screened versus control groups. Combining the numbers of invasive cancers in Table 2 of Miller et al. 17 with their reported 71 in situ cancers yielded nS = 118 + 149 + 14 + 36 + 32 + 71 = 420 breast cancers (screen-detected preclinical cancers and interval cancers) diagnosed during the screening period.
The Malmo study randomized approximately 25,000 women aged 50–59 to an invitation for at least five rounds of mammography in intervals of 18 to 24 months versus no screening. 18 The UK Panel analyzed the following data from Zackrisson et al. 19 involving follow-up after the last screen to 15 years and an age range of 50–59. Based on Table 2 in Zackrisson et al., 19 there were n0 = 324 + 374 = 698 breast cancers in the control group and n1 = 438 + 342 = 780 breast cancers in the screened group, yielding an excess of 82 breast cancers in the screened versus control groups. Based on Table 2 in Zackrisson et al., 19 there were nS = 438 breast cancers (screen-detected preclinical cancers and interval cancers) diagnosed during the screening period (which they called “Period 1”). A weighted average of data for ages 55–59, 60–64, and 65–69 (Table 1 of Zackrisson et al. 20 ) indicates that 71% of invited women aged 55–69 attended the first screen, so πest = 0.71.
Substituting the values for n0, n1, and nS from these trials into equations (8) to (11) yielded estimates of SIOF adjusted for refusers (if applicable) and with corrected 95% confidence intervals. For the Canada 1 trial, the estimated SIOF was 0.23. The UK Panel reported a 95% BCI of (0.18, 0.27) while the 95% BPCI was (0.04, 0.41). For the Canada 2 trial, the estimated SIOF was 0.16. The UK Panel reported a 95% BCI of (0.12, 0.19) while 95% BPCI was (−0.01, 0.32). For the Malmo study and no correction for refusers, the estimated SIOF was 0.19. The UK Panel reported a 95% BCI of (0.21, 0.32). Adjusting for refusers using the method of latent class instrumental variables, the estimated SIOF was 0.26 with a 95% BPCI of (0.03, 0.50). Figure 1 shows a graphical display of these results.
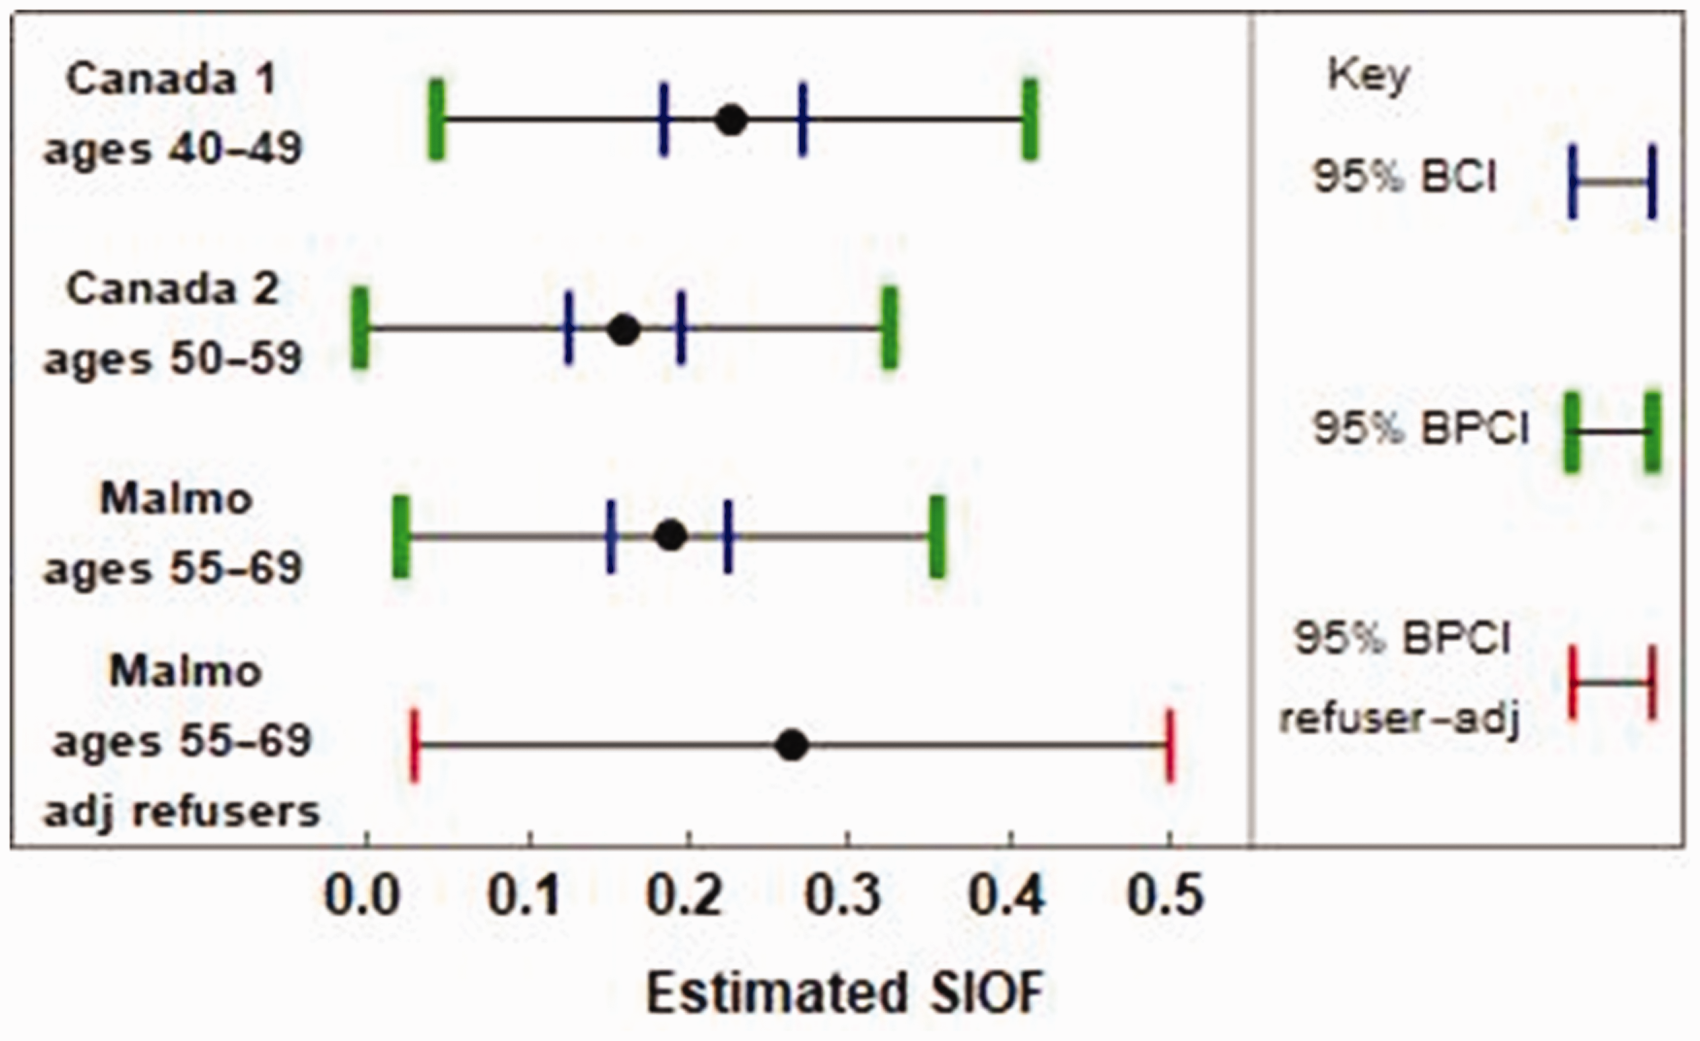
Estimated SIOF for all breast cancers in the Canada 1, Canada 2, and Malmo trials. The blue vertical lines indicate the 95% BCI reported by the UK Panel, which is based on an incorrect application of the binomial variance. The green vertical lines indicate the correct 95% binomial Poisson confidence interval (BPCI). The red vertical lines indicate the correct 95% binomial Poisson confidence interval with an adjustment for refusers via latent class instrumental variables.
Reanalysis of two breast cancer stop screen trials with long follow-up
For the Canada 1 and Canada 2 stop-screens trial, data were available on cumulative numbers of breast cancers at various years after the last screen. 21 Participants received either four or five annual interventions prior to follow-up. Based on Table 2A in Baines et al., 21 for Canada 1, n0 = {234, 271, 318, 373, 432, 487, 828, 1322, 1633} and n1 = {326, 371, 424, 480, 533, 590, 958, 1432, 1771} for follow-up year after the last screen of {0, 1, 2, 3, 4, 5, 10, 15, 20}, with nS = 326. Based on Table 2B in Baines et al., 21 for Canada 2, n0 = {262, 304, 349, 406, 475, 536, 898, 1293, 1518} and n1 = {377, 424, 454, 499, 557, 615, 942, 1338, 1568} for follow-up year after the last screen of {0, 1, 2, 3, 4, 5, 10, 15, 20}, with nS = 377. (The counts based on time since last screen do not match the counts based on the ideal metric of time since randomization discussed in Miller et al.16,17 In particular, the counts for nS differ with these metrics because the last screen was screen 4 in some participants and screen 5 in other participants.) Figure 2 shows a graphical display of these results. To better illustrate the variability of the estimated SIOF over time, Figure 2(b) and (d) shows 100 estimated SIOF curves arising from counts randomly generated under a Poisson distribution, with some of the most extreme curves highlighted.
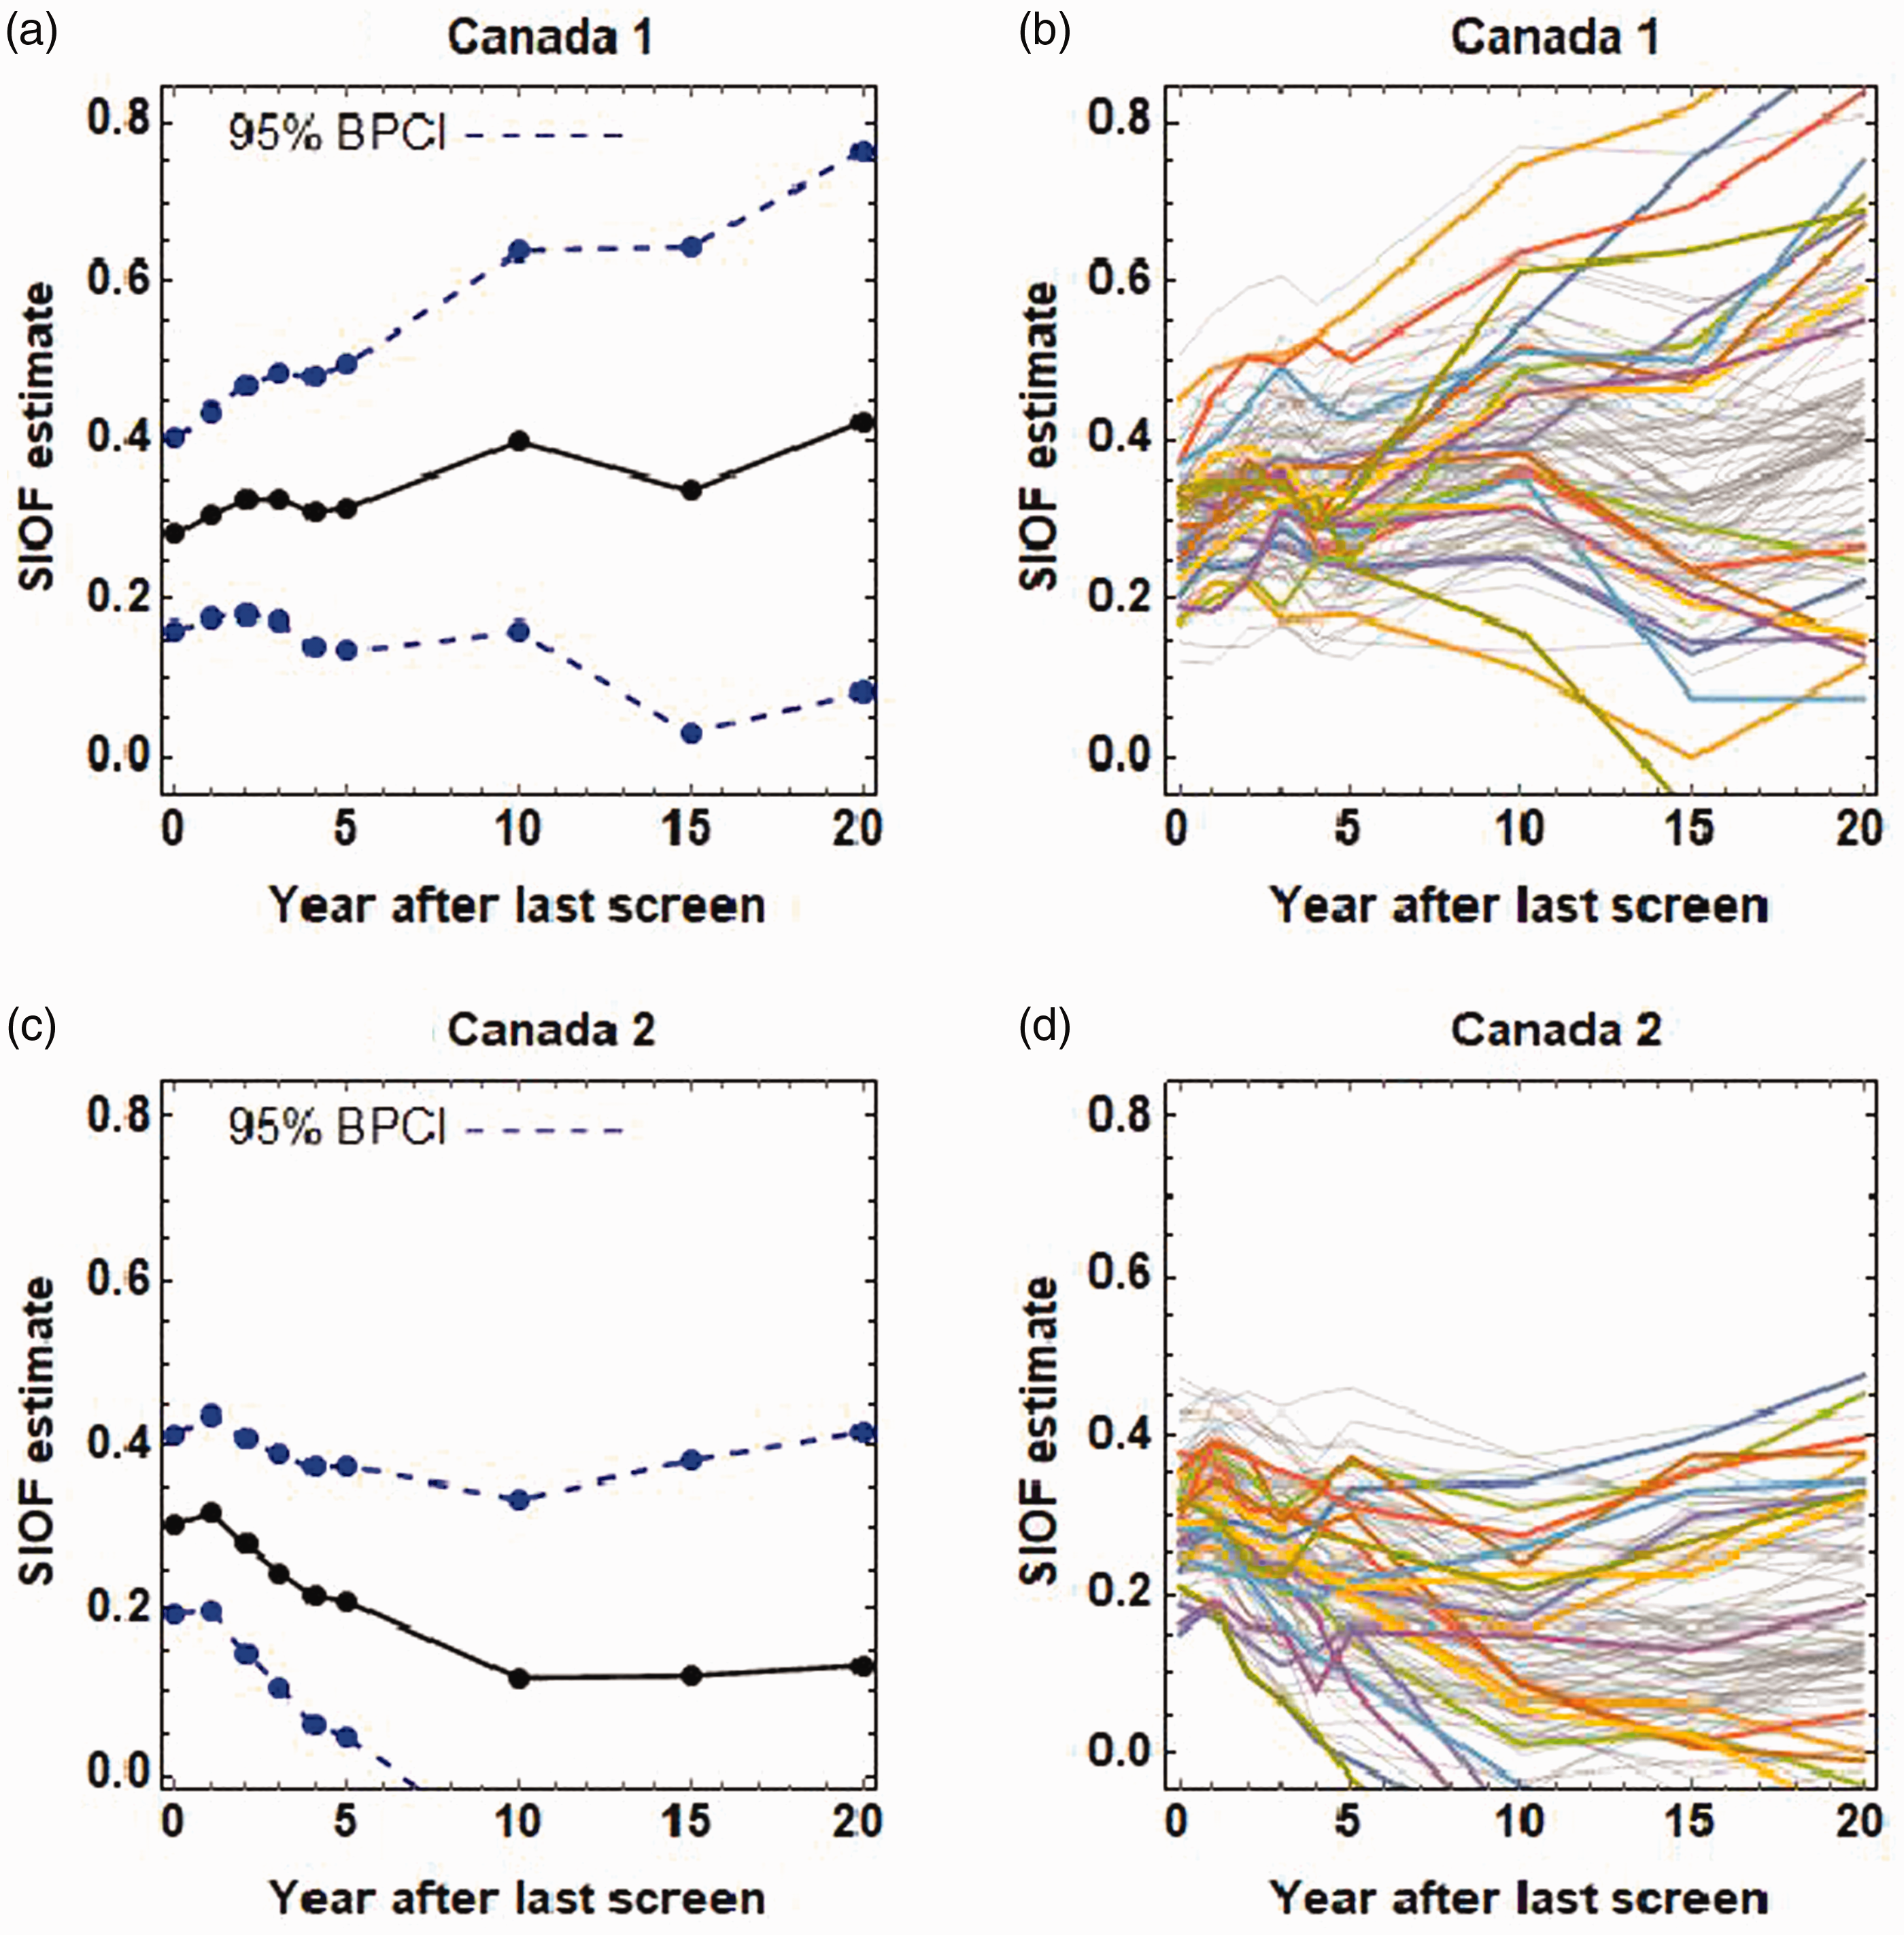
SIOF estimates from stop-screen trials: (a) Canada 1 with 95% BPCIs, (b) Canada 1 with randomly generated curves based on observed data; colored curves show some of the extreme realizations, (c) Canada 2 with 95% BPCIs, and (d) Canada 2 with randomly generated curves based on observed data; colored curves show some of the extreme realizations.
Reanalysis of lung cancer stop-screen trials
In applications to stop-screen trials for lung cancer screening, the BPCIs for the estimated SOF agreed with the bootstrap confidence intervals. For the estimated SOF of 0.185 in a stop-screen trial of low-dose computed tomography screening for lung cancer, 22 the 95% BPCI was (0.055, 0.314) and the 95% bootstrap confidence interval was (0.054, 0.306). For the estimated SOF of 0.197 in a stop-screen trial with volume CT screening for lung cancer, 23 the 95% BPCI was (–0.035, 0.429) and the 95% bootstrap CI was (–0.052, 0.416). These results increase confidence in the appropriateness of the BPCI.
Discussion
Despite its limitations, the CIM to estimate the fraction overdiagnosed in a stop-screen trial is the most reliable method for estimating the fraction overdiagnosed. Other methods of estimation, involving data from other types of trials or with population data or with mathematical modeling, require more assumptions. 24 If data are available on the number of screen detections, investigators should estimate SOF instead of SIOF because SOF is more relevant to patients. POF is useful for weighing benefits and harms. Benefits involve possible reduction in breast cancer mortality. Harms include the cumulative numbers of false positives25,26 (a positive screen followed by a negative work-up) and overdiagnosis.
As follow-up time after the last screen increases, the bias of the estimated SIOF, SOF, or POF (all based on the CIM) decreases. 4 To understand this decrease in bias with longer follow-up consider the following thought experiment involving bias of estimated SIOF. Suppose you went back in time and assigned all persons in the screened group to a counterfactual control group who did not receive screening. Assume there is no overdiagnosis. Therefore, any difference between the cumulative numbers of cancers in the screened group and the cumulative number of cancers in the counterfactual control group (at a given time) yields a value of SIOF that is biased. Screening detects a cancer in the screened group that would have surfaced later in the counterfactual control group. Therefore, at the time of the last screen, the cumulative number of cancers in the screened group is larger than cumulative number of cancers in the hypothetical control group, which can only be bias in the SIOF estimate since we have assumed no overdiagnosis. As follow-up time increases, the bias in SIOF decreases because the cumulative number of cancers in the counterfactual control group is catching up to the cumulative number of cancers in the screened group (arising from the diagnosis of cancers in the counterfactual control group that were previously detected on screening in the screened group). Our key contribution is showing that, while bias decreases, confidence intervals for estimated SIOF, SOF, and POF widen as follow-up time increases—a bias-variance tradeoff. If bias levels off starting at some time since randomization (indicated by constant estimated SIOF, SOF, or POF), we suggest reporting the estimate and estimated variance at the start of this time range (when the estimated variance should be smallest).
The key mathematical result underpinning the correct computation of the estimated variance is that random variables generated from a binomial distribution with counts that are a Poisson random variable are independent Poisson random variables. When one considers that the sum of two Poisson random variables is a Poisson random variable, this result is intuitive, as conditioning a binomial distribution on a Poisson random variable provides no information for constraining the resulting random variables.
The difference in shape of the estimated SIOF curves for Canada 1 and Canada 2 in Figure 2 is striking. If there is no overdiagnosis or constant overdiagnosis rates over follow-up time, narrow confidence intervals, correct implementation of randomization, and no screening in the follow-up period, the estimated SIOF should decrease with follow-up time, as with the estimated SIOF curve for Canada 2. Possible explanations for the increasing estimated SIOF curve for Canada 1 are random variability (as some randomly generated estimate SIOF curves decrease with follow-up time), overdiagnosis rates that increase with age, imperfect randomization, and screening in the follow-up period.
There are concerns of bias in estimating the fraction overdiagnosed in the Canada and Malmo trials due to screening during the follow-up period. 27 Screening during the follow-up period among controls would yield an estimated SIOF that would be smaller than the estimated SIOF under the required scenario of no screening during the follow-up period (because of overdiagnosis in the control group during follow-up). Screening during the follow-up period among the screened group would yield an estimated SIOF that would be larger than the estimated SIOF under the required scenario of no screening during the follow-up period (because of overdiagnosis in the screened group during follow-up). The overall effect of screening during follow-up would depend on how much screening occurred in the control group and how much occurred in the screened group during follow-up. For the Malmo trial, Njor et al. 27 provided strong evidence of screening after the end of follow-up in the group invited for screening. For the Canadian trials, Njor et al. 27 cited a report that screening was implemented after the trial stopped in provinces from which the trial population was recruited. If this post-trial screening occurred preferentially in the screened group, there would be upward bias in the estimated fraction overdiagnosed. Following these arguments, there is a strong risk of upward bias in the estimated fraction overdiagnosed in both the Canada and Malmo trials.
The two-sided method of latent class instrumental variables would adjust for both refusers in the screened group and participants in the control group who immediately start screening after randomization. 8 The method applies only to immediate switching of treatments after randomization. Adjusting for delayed switching of treatments after randomization (e.g. participants who receive some screens and then stop receiving screens) requires much more restrictive assumptions, which may not hold. 8
In summary, the reported 95% BCIs for SIOF in the Canada 1, Canada 2, and Malmo breast cancer stop-screen trials are incorrect due to misuse of the binomial variance. The correct 95% confidence intervals are BPCIs with adjustment for refusers in the Malmo trial. They are much wider than the 95% BCIs. In other words, there is much more uncertainty in the amount of overdiagnosis in breast cancer screening than previously reported. We recommend that investigators quantify overdiagnosis in stop-screen trials by estimating SIOF or SOF and computing 95% BPCIs with adjustment for refusers via the method of latent class instrumental variables.
Supplemental Material
sj-jpg-1-msc-10.1177_0969141320950784 - Supplemental material for Breast cancer overdiagnosis in stop-screen trials: More uncertainty than previously reported
Supplemental material, sj-jpg-1-msc-10.1177_0969141320950784 for Breast cancer overdiagnosis in stop-screen trials: More uncertainty than previously reported by Stuart G Baker and Philip C Prorok in Journal of Medical Screening
Footnotes
Declaration of conflicting interests
The author(s) declared no potential conflicts of interest with respect to the research, authorship, and/or publication of this article.
Funding
The author(s) disclosed receipt of the following financial support for the research, authorship, and/or publication of this article: This work was supported by the National Cancer Institute.
Appendix 1
References
Supplementary Material
Please find the following supplemental material available below.
For Open Access articles published under a Creative Commons License, all supplemental material carries the same license as the article it is associated with.
For non-Open Access articles published, all supplemental material carries a non-exclusive license, and permission requests for re-use of supplemental material or any part of supplemental material shall be sent directly to the copyright owner as specified in the copyright notice associated with the article.