
Abstract
Objectives
Overdiagnosis is regarded as a harm of screening. We aimed to develop a non-homogeneous multi-state model to consider the age-specific transition rates for estimation of overdiagnosis, to validate the model by a simulation study where the true frequency of overdiagnosis can be calculated, and to compare our estimate with the cumulative incidence method.
Methods
We constructed a four-state model to describe the natural history of breast cancer. The latent disease progression and the observed states for each individual were simulated in a trial with biennial screening of women aged 51–69 and a control group of the same size without screening. We performed 100 repetitions of the simulation with one million women to evaluate the performance of estimates. A sensitivity analysis with reduced number of controls was performed to imitate the data from the service screening programme.
Results
Based on the 100 repetitions, the mean value of the true frequency of overdiagnosis was 12.5% and the average estimates by the cumulative incidence method and the multi-state model were 12.9% (interquartile range: 2.46%) and 13.4% (interquartile range: 2.16%), respectively. The multi-state model had a greater bias of overdiagnosis than the cumulative incidence method, but the variation in the estimates was smaller. When the number of unscreened group was reduced, the variation of multi-state model estimates increased.
Conclusions
The multi-state model produces a proper estimate of overdiagnosis and the results are comparable with the cumulative incidence method. The multi-state model can be used in the estimation of overdiagnosis, and might be useful for the ongoing service screening programmes.
Introduction
The benefits of breast cancer (BC) screening by mammography have been demonstrated by randomized controlled trials (RCTs). 1 However, there is a concern about the harms of screening due to overdiagnosis, which occurs when a BC is detected through screening that would not have presented clinically in the woman’s lifetime. Because it is currently impossible to determine whether a diagnosed asymptomatic BC will become clinically apparent in the future, the measurement of overdiagnosis is not straightforward. 2
The preferable method to estimate overdiagnosis is to compare the cumulative incidence of BC between a screened and an unscreened group in an RCT with stop-screen design. 3 Follow-up of the study population should continue after screening stops, to compensate for cases diagnosed earlier in the screened group. This is the cumulative incidence method (CIM), or the excess incidence approach.4,5 The United Kingdom BC screening panel applied CIM to three RCTs and estimated the frequency of overdiagnosis at 11% in terms of a population perspective (i.e. percentage of BCs diagnosed during screening and follow-up periods in women invited to screening that were overdiagnosed). 1
A recent review of studies of overdiagnosis in the service screening programmes showed a huge variation in the estimates (<1–54%). 6 The variation may be attributed to the differences in estimation methods, adjustment for lead time (the time by which screening advances the diagnosis), and choice of control group.5,6 An inappropriate control group with a risk that cannot represent the risk in the screened group might introduce a bias, especially in the CIM. 7 To avoid this bias, multi-state models (MSM), where the information from the control group is not necessary for estimation, could be used.
Several MSMs have been developed to quantify overdiagnosis by estimating the natural history of BC.8–11 Duffy and colleagues constructed a four-state model to estimate the underlying incidence of progressive and non-progressive cases by using data from the first three screening rounds of the Swedish Two-county Trial and the Gothenburg Trial. 8 Olsen and colleagues applied the same method to the Copenhagen Mammography Screening Program. 9 Yen et al. extended the four-state model to a six-state model, to take carcinoma in situ into account. 10 Gunsoy and colleagues also used a six-state model to estimate the natural progression of BC, and further applied a ten-state model to quantify the overdiagnosis in women aged 40 to 49 in the UK. 11 All these models were based on the assumption that the incidence rate was constant over age. The accuracy of estimates from the MSMs remains unknown, as the true incidence rate changes over age. 12 Furthermore, little attention has been paid to the evaluation of overdiagnosis by different methods using the same dataset.13,14
There were three major aims in this study: (1) to develop a non-homogeneous MSM, where the transition rates depend on age, for estimation of overdiagnosis from the detection of non-progressive cases; (2) to validate the estimate using a simulation study, where the true frequency of overdiagnosis can be calculated; and (3) to compare our estimate with the estimate using CIM, which is regarded as a paradigm in the stop-screen design, given an adequate follow-up. 6
Methods
Model structure and study design
To describe the natural history of primary invasive BC, we constructed a four-state model: free of BC (State 1), progressive preclinical screen-detectable phase (PCDP) (State 2), clinical phase (CP) (State 3), and non-progressive PCDP (State 4). The natural progression of the disease is an invisible latent process, and should not be confused with the states we observe. The observable information, collected when women participated in a specific round of screening or were clinically diagnosed during the interval, was categorized into three observed states, including negative mammographic finding (NF, Observed State 1), screen-detected case (SD, Observed State 2), and clinically detected case (CD, Observed State 3).
Figure 1 illustrates the possible latent state transitions denoted by arrows and the probability (1, S, and 1-S) of being detected in the observed states, where S denotes the test sensitivity, which is defined as the probability to detect the cancer while it is in the PCDP state. Here we assumed that S is constant over time and the same for progressive (State 2) and non-progressive PCDP (State 4).
The natural history and observed states of breast cancer. The invisible natural progression of breast cancer was indicated by a dashed line and the observed state was indicated by a solid line. BC: breast cancer; PCDP: preclinical screen-detectable phase; CP: clinical phase; S: sensitivity; 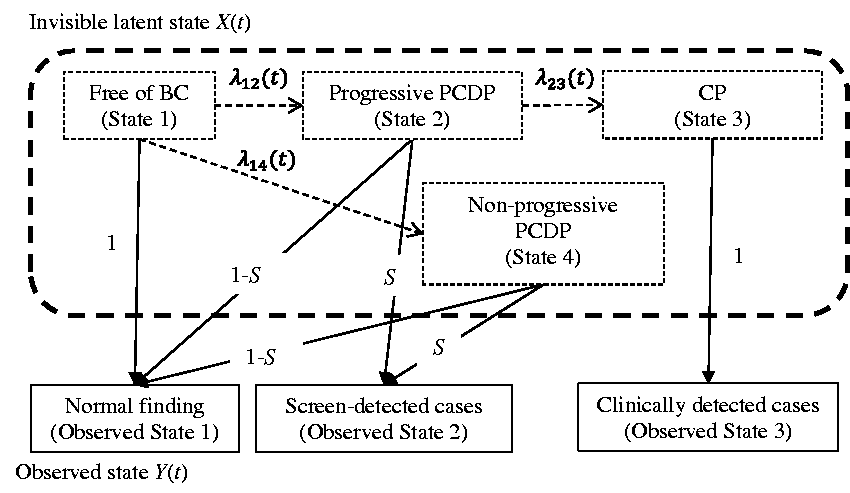
Figure 2 illustrates the study design. First, we simulated the natural history of BC for the population based on the above model and a certain screening scenario to obtain the data. Second, we estimated the overdiagnosis by different methods. Third, a randomly selected sample was used for illustration. Fourth, we compared the results of true value and estimates of overdiagnosis from 100 replicated samples.
Flow chart illustrating the study design. BC: breast cancer; RCT: randomised controlled trial; CIM: cumulative incidence method; MSM: multi-state model.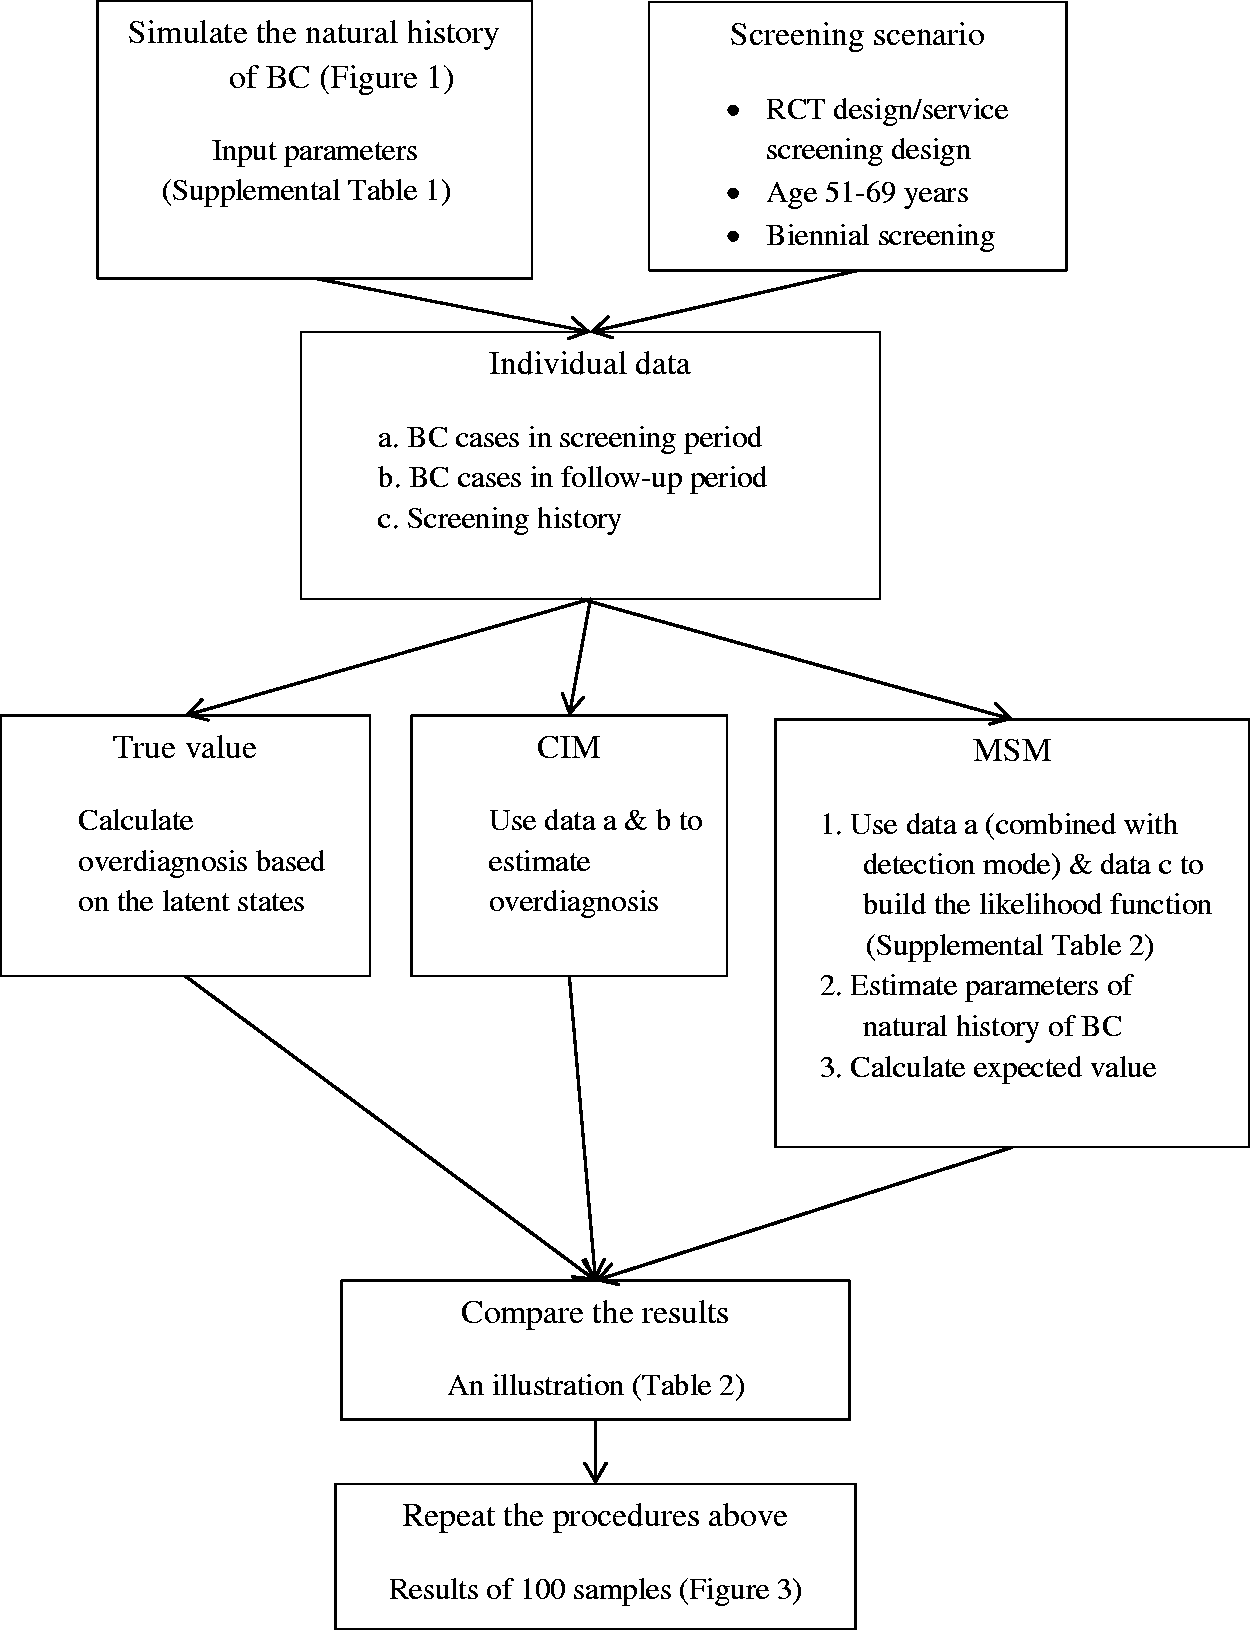
Simulation and parameter determination
The micro-simulation model was used to simulate the natural history of BC.
15
Input parameters to the simulation included the transition rates from free of BC to progressive PCDP
We created an RCT with biennial screening from ages 51–69 in one million women. 18 Ratio of intervention to control group was 1:1. Ten scheduled screenings with a 100% participation rate were implemented. After the end of the screening programme, women were followed to age 85. To imitate data from a service screening programme, a sensitivity analysis was performed for the MSM by using only a certain proportion of randomly selected controls to estimate overdiagnosis using the same model. These controls represent never-attenders who were invited but never participated in the screening programme.
Estimation approaches
True value of overdiagnosis. The true value can be calculated because the latent transitions between each state for each individual are known by simulation. Specifically, a screen-detected cancer that is an overdiagnosed case or an early-detected case is determined by its latent state, that is, staying in non-progressive (State 4) or progressive PCDP phase (State 2). As we assumed 0% mortality, only non-progressive cases will be overdiagnosed. The estimate of overdiagnosis was defined as the fraction of all SD cancers that were overdiagnosed, i.e. the numerator is the number of non-progressive cancers detected by screening, and the denominator is the number of SD cancers in the screened group.
Cumulative incidence method (CIM). We followed women to age 85 to adjust for lead time (compensatory drop method). 19 This follow-up period complies with the minimal follow-up time (5–10 years) suggested by the United Kingdom BC screening panel. 1 The number of excess BCs was calculated as the difference in the number of BCs between the screened group and the control group, from the start of the screening period through the end of follow-up period. The frequency of overdiagnosis estimated by the CIM was the number of excess cases divided by the number of SD cancers in the screened group. 1
Multi-state model (MSM). Several assumptions were used to simplify the estimation. First, the time was partitioned into three intervals to represent the age groups 0–49, 50–59, and 60–69, and was modeled by the piecewise-constant transition rate.15,20 Second, as the women’s disease states before start of screening were not available in the screening programme database, the BC incidences in the 0–49 age group (Supplemental Table 1) were used as fixed values in the estimation to represent the transition rates from State 1 to State 2.
12
Third, the transition rate from State 1 to State 4 was re-parameterised to a ratio r and the transition rate from State 1 to State 2
The explicit derivation of the individual likelihood is illustrated in the Supplemental material (Supplemental Table 2 and section B).
21
The overall likelihood function was the product over all individuals’ likelihood. The quasi-Newton algorithm was used to obtain the maximum likelihood estimates from the log-likelihood function.
22
Approximated standard errors of the parameter estimates were obtained from the inverse of the matrix of second derivatives (Hessian Matrix) of the maximized log-likelihood function. The expected number of detected non-progressive BCs at the kth screening round can be calculated as follows

where
Comparison between true value and estimates from the CIM and the MSM
Number of breast cancer diagnosed by detection mode and the estimation results of overdiagnosis in one randomly-selected simulation sample.
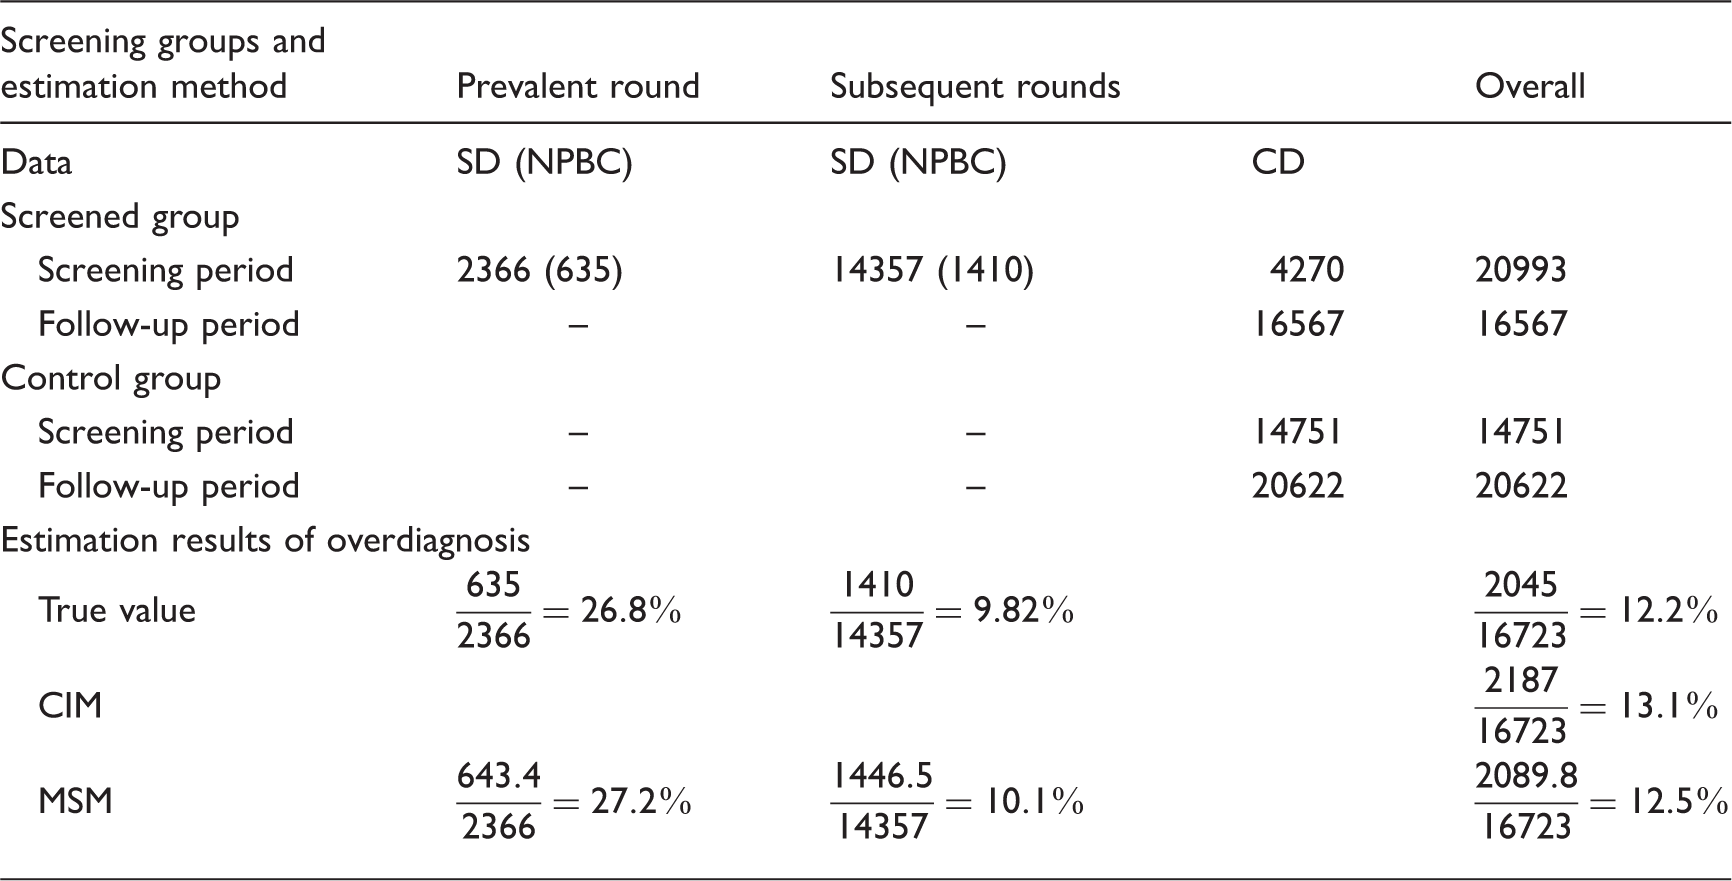
SD: screen-detected cases; NPBC: non-progressive breast cancer; CD: clinically detected cases; CIM: cumulative incidence method, MSM: multi-state model.
Estimates of parameters in the multi-state model in one specific sample and 100 replicates.
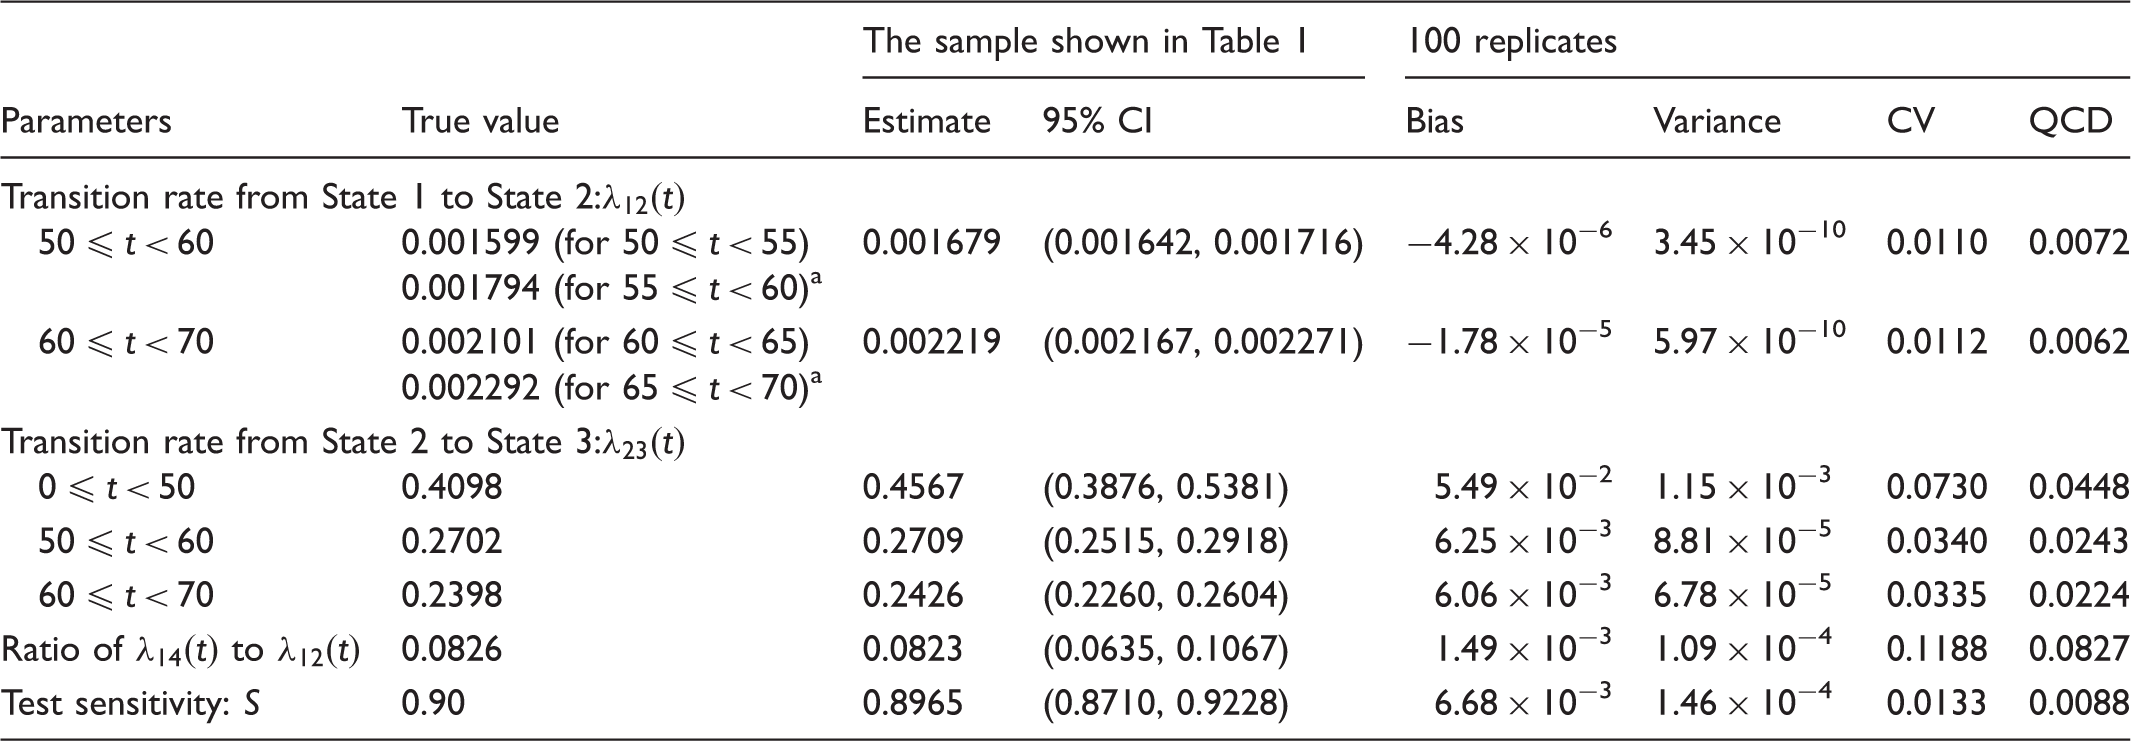
CI: confidence interval; CV: coefficient of variation; QCD: quartile coefficient of dispersion.
The average of the two transition rates is considered as a true parameter for the 10-year period when evaluating the estimators.
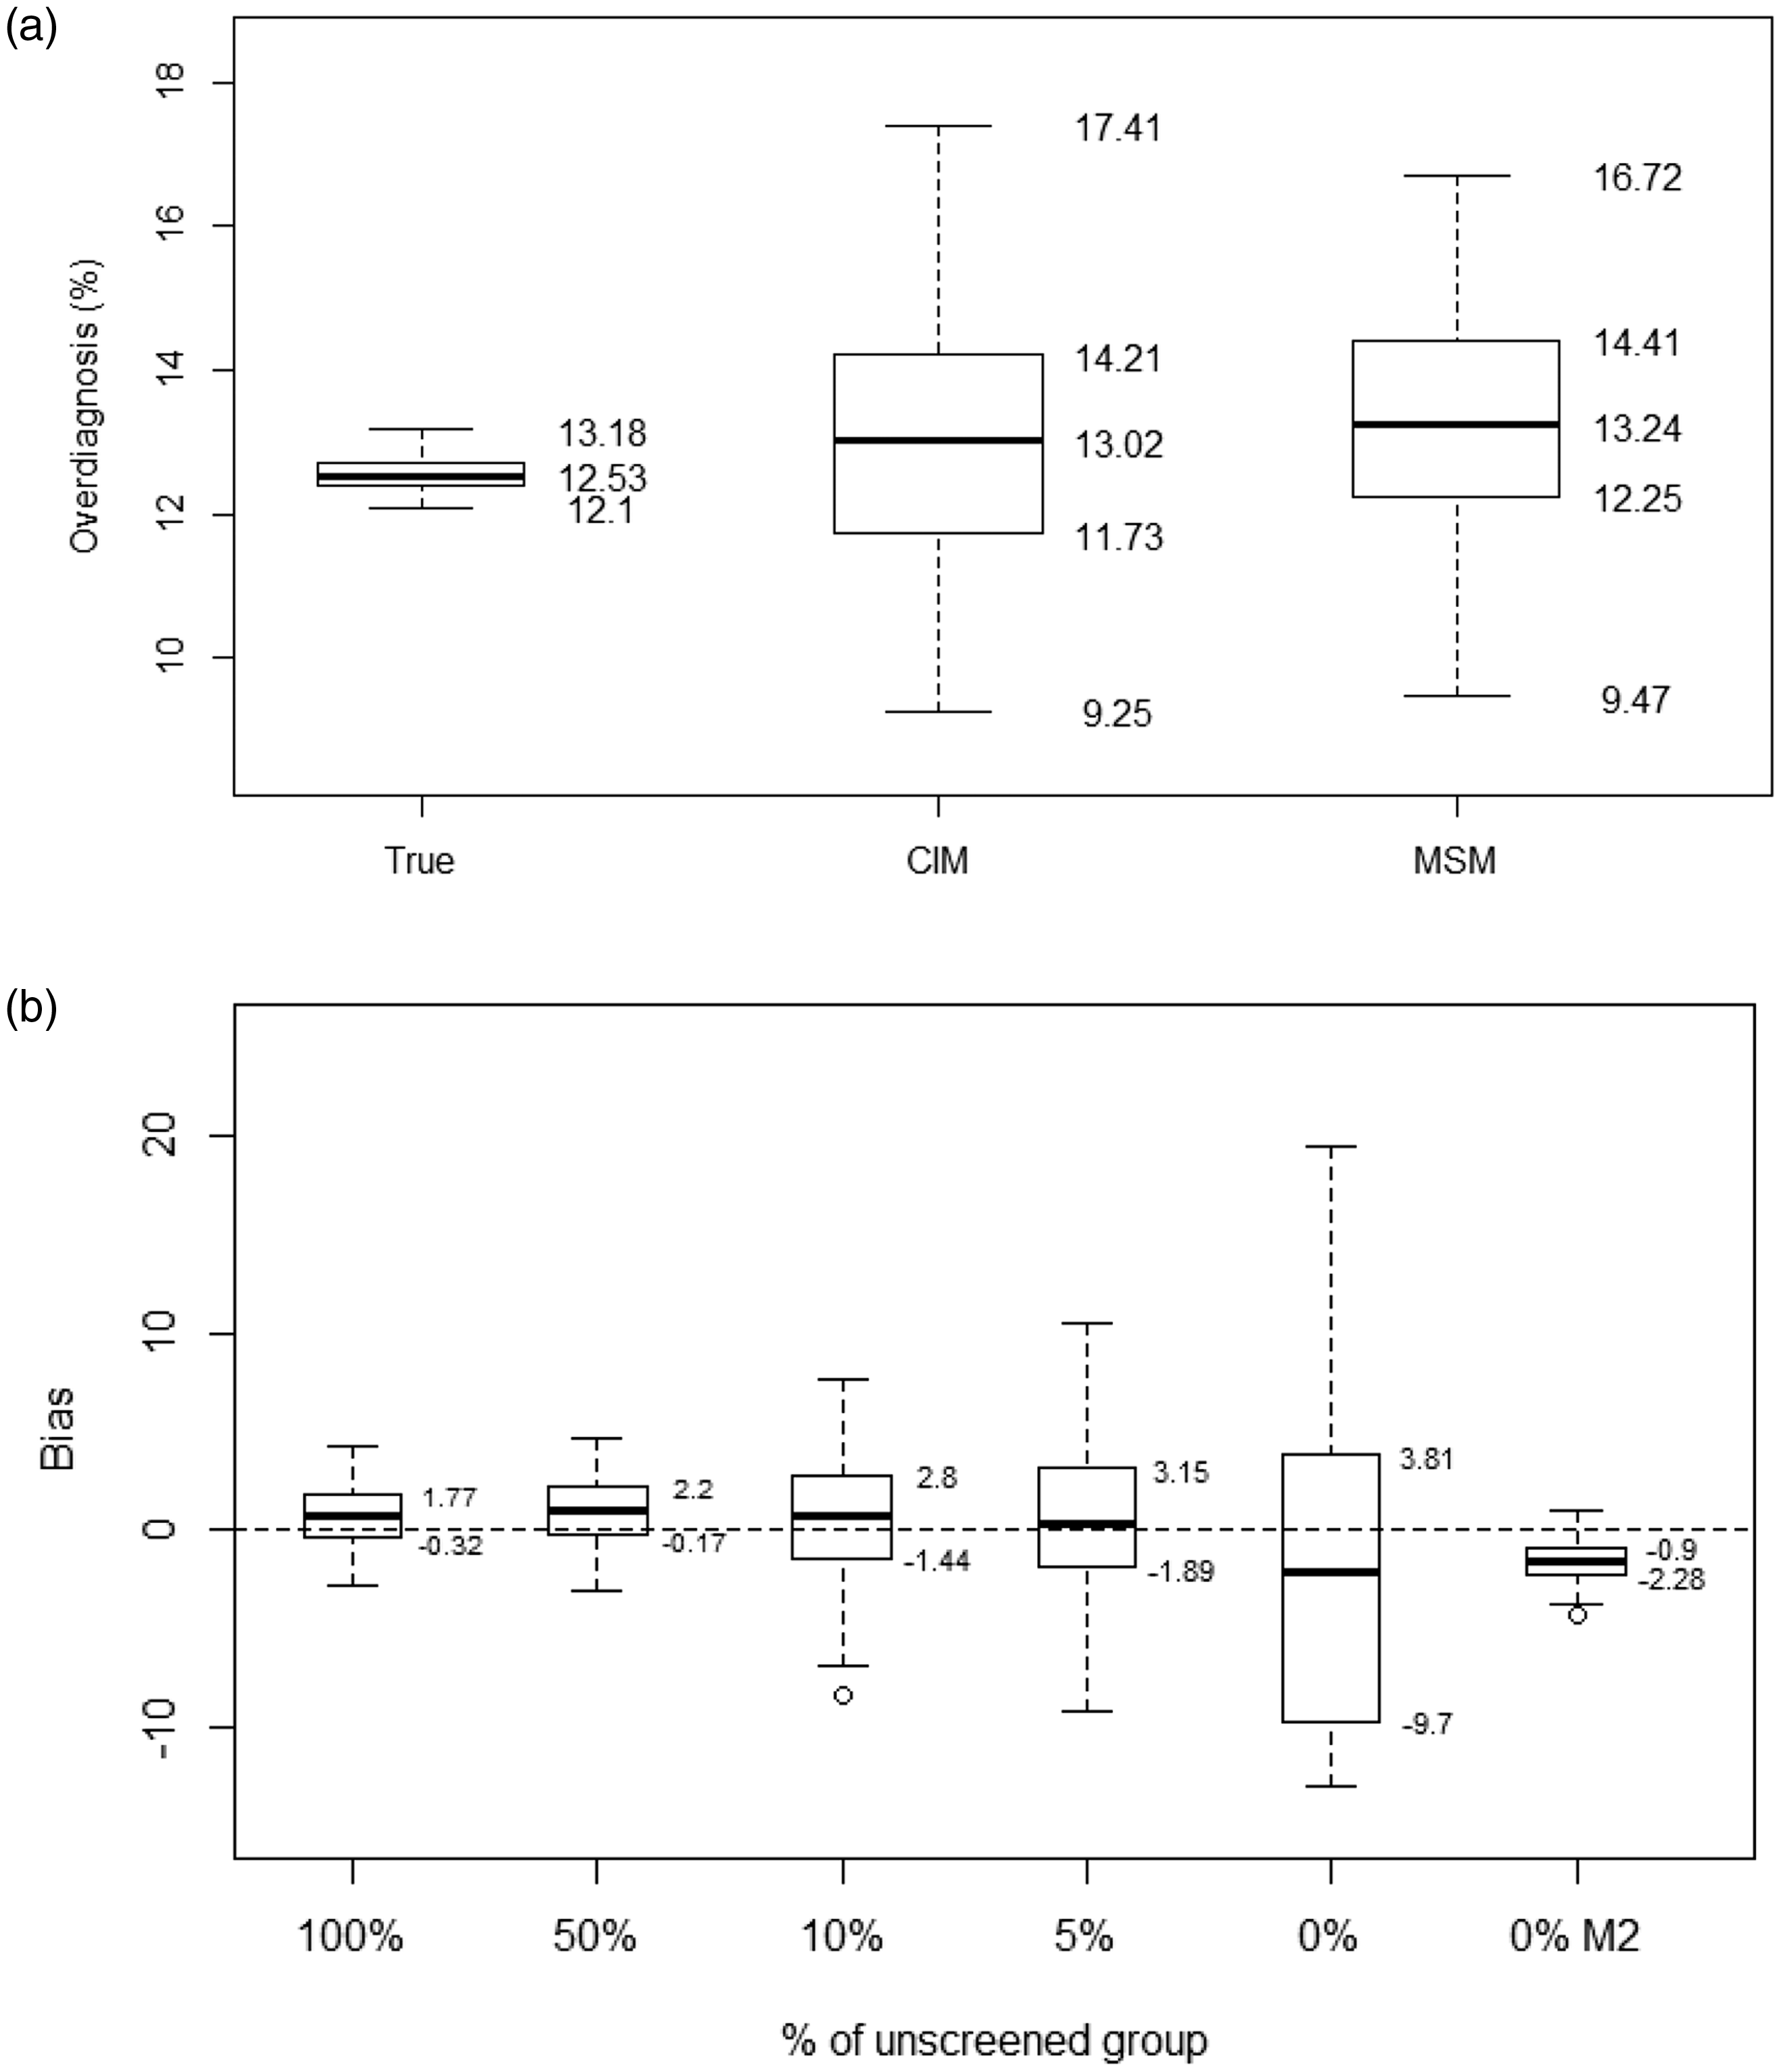
Boxplot of the frequency of overdiagnosis in the randomised control trial design and results of the sensitivity analysis. (a) Randomised control trial design. True values of overdiagnosis, and the estimates of cumulative incidence method (CIM) and multi-state model (MSM) from 100 replicates. (b) Sensitivity analysis by reducing the number of controls in MSM. Bias: the difference between the estimates and the true values of overdiagnosis (%); M2: The true value (0.4098) was used for the transition rate from State 2 to State 3 for women below age 50.
Results
The results from one randomly selected simulation sample are shown in Table 1. Of 37,560 women diagnosed with BC in the screened group, 20,993 (55.9%) were diagnosed during the screening period, and 16,567 (44.1%) during the follow-up period. Out of 2366 and 14,357 prevalent and subsequent SD cases, 635 and 1410, respectively, were non-progressive cases. This resulted in a true frequency of overdiagnosis at 12.2% (26.8% in prevalent and 9.82% in subsequent rounds of screening). In the control group, 14,751 (41.7%) and 20,622 (58.3%) women were diagnosed with BC during the screening and follow-up periods respectively. There were 2187 excess BCs in the screening group, resulting in a frequency of overdiagnosis at 13.1% according to the CIM. The MSM estimated the expected numbers of detected non-progressive cancers in the prevalent and subsequent screening rounds at 643 and 1447, respectively, and the frequency of overdiagnosis at 12.5% (27.2% in prevalent and 10.1% in subsequent rounds of screening). The maximum likelihood estimates for the MSM were close to the true parameters (Table 2). Our developed model fitted the data well (x2(13) = 9.56, p = 0.72).
The estimates of parameters from 100 repetitions are shown in Table 2. The range of the biases was −4.3 × 10⁻⁶ to 5.5 × 10⁻². The ranges of variance, coefficient of variation, and quartile coefficient of dispersion were from 6.0 × 10⁻¹⁰ to 1.2 × 10⁻³, from 0.011 to 0.12, and from 0.0062 to 0.083, respectively. This indicates that our MSM performs well.
The frequencies of overdiagnosis based on 100 repetitions are shown in Figure 3. The mean value of the true frequency of overdiagnosis was 12.5%, and the average estimates by the CIM and MSM were 12.9% and 13.4%, respectively. The interquartile range (Q3-Q1) for the CIM and MSM was 2.46% and 2.16%, respectively (Figure 3(a)). The mean value (standard deviation) of the differences between the true overdiagnosis and the estimates of the CIM and MSM was 0.38% (1.6) and 0.81% (1.5), respectively. The MSM showed a greater bias than the CIM, however the variation of estimates was smaller.
The variation of estimates of overdiagnosis using MSM increased with the decreasing number in the unscreened group. The average differences between estimates and true values, (i.e. the bias) were 0.97, 0.67, 0.41, and −2.02 using 50%, 10%, 5%, and 0% of the unscreened group. The corresponding interquartile ranges are 2.37, 4.24, 5.03, and 13.51, respectively (Figure 3(b)).
Discussion
We developed a non-homogeneous MSM to estimate the frequency of overdiagnosis. The accuracy of this model was validated in an RCT design by the simulation in which the true value of overdiagnosis could be calculated. The estimates of overdiagnosis were comparable with the CIM. Based on the simulation of 100 samples with one million women in each, the mean estimates of overdiagnosis in the MSM (13.4%) and CIM (12.9%) were close to the true frequency of overdiagnosis (12.5%). In comparison with the CIM, the MSM had a greater bias, but the variation of estimates was smaller. However, there is a substantial difference between these two methods. In the CIM, the excess number of BCs in the screened group compared with the unscreened group provides a measure of overdiagnosis. Consequently, the frequency of overdiagnosis depends on the number of BCs in the control group and the length of the follow-up period. In contrast, in the MSM overdiagnosis was estimated by the expected number of detected non-progressive BCs, where the screening histories and observed states from the screened group played the most important role for the estimation.
Etzioni and Gulati emphasized the situation of polarized opinions on the use of CIM and MSM for the estimation of overdiagnosis. 23 The CIM is transparent, easy to understand, and provides a direct estimate of overdiagnosis. It might be less exposed to biases when the true natural history is not known, as a long follow-up period is used to adjust for lead time. However, it relies on a control group with similar background incidence as the screened group in the absence of screening. This is possible in RCTs with a certain design, but difficult or impossible to obtain in countries with service screening programmes that have been ongoing for decades. On the other hand, the MSM uses individual screening data to estimate the overdiagnosis, via estimating the natural history of BC while the information from the follow-up period was not used.8,23 Therefore, a control group might not be necessary, but the method is more complicated and can be sensitive to model assumptions such as Markov property (the future state only depends on the present state not the previous one), constant transition rates, and constant sensitivity. We used the simulation approach to demonstrate that both methods can provide appropriate estimates of overdiagnosis in an RCT optimally designed for CIM.
Limited observed information results in difficulties in the estimation of overdiagnosis by MSM. First, the target population of screening programmes is asymptomatic women, which results in a truncated sample. The women who had progressed to clinical phase before the age of starting screening were not included in our dataset. Therefore, the transition rates in women aged under 50 are intractable unless we assumed constant transition rates. Furthermore, a conditional likelihood function should be used to adjust the selection bias from the left-truncated sample. Second, the data are incomplete. Age at onset of PCDP is not known exactly, but is within an interval (interval-censored). Age at onset of CP only can be observed exactly in the clinically detected cancers, but not in the screen-detected or free of BC cases, where the observation is right-censored. In addition, the detection of cancer in the PCDP state is subject to measurement error. Consequently, the MSM might be unidentifiable. Assumptions such as progressive disease progression, the Markov property, and constant transition rates are usually used. We developed a non-homogeneous MSM to take age-dependent incidence rates and sojourn times into account. In addition, the test sensitivity was included in the model and estimated simultaneously. With regard to the estimates of parameters, our MSM performed well in the simulated samples, and showed minor bias (range: −4.3 × 10⁻⁶ to 5.5 × 10⁻²) and variance (range: 6.0 ×10⁻¹⁰ to 1.2 × 10⁻³) in a trial design. As expected, the estimates of the transition rate from State 2 to State 3 before age 50 had the greatest bias, because of lack of screening information as screening began at age 51. Compared with the trial design with 1:1 allocation ratio, the variation of estimates using the MSM became larger with reduced number of controls, i.e. when approaching a service screening design, especially when there was 0% unscreened group. One explanation is the smaller sample size. Another is the instability of the model, which might be due to over-parametrisation, or limited observed data. In our simulation, we assumed that all women participated in the screening at the same time (exactly two-year intervals), except for the clinically detected cases. When we constrained the transition rate from State 2 to State 3 before age 50 to be a fixed value at 0.4098 (true value), the model was stabilized again (0% M2 in Figure 3(b)). The range of overdiagnosis was from 8.33% to 13.53% and the interquartile range of biases was 3.18% (vs. 13.51% in the unconstrained model). It should be noted that a small number of the unscreened group can be obtained from never-attenders in the service screening, which thus provides additional information to improve the identifiability of the model, especially if the self-selection bias is moderate.
There are some limitations in our study. First, the MSM needs age-specific data on the transition rates from free of BC to progressive PCDP below the lower age limit for screening. A reasonable approximation is the incidence rates of BC from cancer register data, but that might cause bias if the rates used do not represent the background incidence below screening age in the screened population. Second, we assumed the sensitivity to be constant over time, and a false negative case was assumed to be detected in the next screening round. Third, we assumed 100% participation rate and 0% mortality in the simulation. Overdiagnosis will increase when taking the patients who had progressive cancer and died of other causes before it became symptomatic into account.
One advantage with the MSM is that it can be used to estimate the overdiagnosis in RCTs when the control group was screened in the end of the trial, i.e. the split-screen design, or the control group was offered the screening at a later time, i.e. the delayed screen design. 3 Second, the frequency of overdiagnosis in the prevalent and subsequent rounds of screening can be estimated separately. Third, the MSM can be generalized to evaluate the overdiagnosis in the service screening programme. An unscreened control group, which is necessary and has to be carefully chosen or extrapolated in the CIM, is not required for the MSM. Instead, informative data with diverse observation times or different transition types of observed states or constraints from external information are required to identify the model. The MSM can also be generalized to study the overdiagnosis from the different types of BCs by incorporating the new states, i.e. death, and carcinoma in situ, which is not covered in our study.10,11,24 Furthermore, the heterogeneity due to cohort effects, age effects (e.g. the age dependence of incidences and sojourn times), and period effects (e.g. increasing incidence, improvement of screening programmes, etc.) can also be quantified under the support of data. However, it should be noted that more information, constraints, or assumptions are required to successfully identify the model. 23 Further studies are needed to fully understand the strengths and limitations of the MSMs.
Conclusion
In summary, non-homogeneous MSMs can be used in the estimation of the frequency of overdiagnosis. The estimates in our model were comparable with the estimates generated by the current standard estimation method – the CIM. The MSM might be useful for estimation of overdiagnosis in the ongoing service screening programmes. More research is needed to better understand the applications of MSM.
Footnotes
Acknowledgements
The simulations were performed using resources provided by the Swedish National Infrastructure for Computing (SNIC) at High Performance Computing Center North (HPC2N). The authors would also like to thank Dr Xijia Liu from department of mathematics and mathematical statistics, Umeå University for technical support on programming.
Declaration of conflicting interests
The author(s) declared no potential conflicts of interest with respect to the research, authorship, and/or publication of this article.
Funding
The author(s) disclosed receipt of the following financial support for the research, authorship, and/or publication of this article: This work was supported by the Swedish Research Council, the Cancer research fund in North Sweden and ALF grants in Västerbotten.
References
Supplementary Material
Please find the following supplemental material available below.
For Open Access articles published under a Creative Commons License, all supplemental material carries the same license as the article it is associated with.
For non-Open Access articles published, all supplemental material carries a non-exclusive license, and permission requests for re-use of supplemental material or any part of supplemental material shall be sent directly to the copyright owner as specified in the copyright notice associated with the article.