
Abstract
Objective
Fluctuations in the incidence of breast cancer in Norway in the last three decades are partly explained by the use of hormone replacement therapy and mammography screening, but overdiagnosis has also been suggested as a cause. We assessed the trends in breast cancer incidence and overdiagnosis in Norway.
Methods
We calibrated our microsimulation model to Norwegian Cancer Registration data. The model takes into account the use of mammography (both within and outside the Norwegian Breast Cancer Screening Programme) and of hormone replacement therapy. We obtained a proper fit of breast cancer incidence in recent years, when assuming an increase in the background risk for breast cancer, and estimated overdiagnosis.
Results
We estimated a 2% overdiagnosis rate as a fraction of all cancers diagnosed in women aged 50–100, and a 3% overdiagnosis rate as a fraction of all cancers diagnosed in women aged 50–70 (i.e. screening age). If all of the increased incidence would be the result of the detection of slow growing tumours, these estimates were 7% and 11%, respectively.
Conclusion
Besides mammography and hormone replacement therapy use, additional risk factors contributed to the sudden increase in breast cancer incidence in Norway. Overdiagnosis estimates due to screening were within the range of international plausible estimates.
Introduction
Breast cancer incidence among women aged 50–69 rose sharply in Norway, from 193 per 100,000 women in 1995, to 262 per 100,000 women in 1997. 1 The Norwegian Breast Cancer Screening Programme (NBCSP) was introduced between 1996 and 2005, 2 but this rapid increase in incidence started in 1995, before the NBSCP began. Two possible causes for this increase have been described before: many women were already screened outside the NBCSP, in the period 1983–1996, 3 and in those days, many women used hormone replacement therapy (HRT),4–7 which is associated with an increased breast cancer risk.8,9 Recent studies found that the use of mammography and HRT alone is not enough to explain the steep increase in breast cancer incidence.10,11
Mammography screening leads to earlier diagnoses, so breast cancer incidence in the screening age increases temporarily, but incidence after the screening age will decrease. Also, screening will lead to diagnoses of breast cancer in women who would never have been diagnosed in the absence of screening, 12 “overdiagnosis”. As it is not known which women are overdiagnosed, all women with diagnosed breast cancer are treated, so overdiagnosis is directly related to overtreatment. Overdiagnosis is a major harm of screening, and the main topic of controversy regarding mass mammography screening.10,13–19 Estimated overdiagnosis rates in Norway range from 10% to 50%,14,15,17 a variation mainly attributable to different methods 20 and definitions 12 used to estimate overdiagnosis. We use the definitions the UK Independent Review Panel deemed most useful, to allow for maximal comparability. 21
To assess the trends in breast cancer incidence and overdiagnosis in Norway, we first evaluated trends in the overall breast cancer incidence rate, and ductal carcinoma in situ (DCIS) incidence rate, obtained from the Norwegian Cancer Registry, with joinpoint analysis. 22 We calibrated our MIcro-simulation SCreening ANalysis (MISCAN) model to the Norwegian data, and then used the model to evaluate the NBCSP and HRT, and estimate the amount of overdiagnosis.
Methods
Joinpoint analysis
We evaluated trends in invasive breast cancer incidence rate for women aged 50–70 from 1970 to 2009, DCIS incidence rate for women aged 50–70 from 1993 to 2009, mammography use from 1995 to 2005, and HRT use from 1986 to 2008. We performed a joinpoint analysis, using the tool provided on the Surveillance research website of the National Cancer Institute.23,24 Incidence data were provided by the Cancer Registry of Norway. Figures for mammography use were taken from Lynge et al. 3 Data on HRT use were extracted from the Norwegian Prescription Database. 25
The MISCAN model
The MISCAN micro-simulation model is a semi-Markov model using Monte Carlo simulation to simulate individual life histories, and assess the consequences of introducing a screening programme. It simulates a large number of individual life histories, which together form a population. Year of birth, cause of death (breast cancer death or death from other causes), and time of death are included in the life history. Some individuals have an onset of breast cancer and develop a pre-clinical DCIS. After the onset of disease, the pre-clinical DCIS may regress back to normal, progress to consecutive stages of pre-clinical invasive cancer, or become clinically detected.
26
The natural history of breast cancer in the model is shown in Figure 1. Age-dependent dwell times represent the average amount of time between transitions from one stage to the next. In each stage, there is an age-dependent probability that the cancer will be clinically detected. Once the disease is detected, an age- and stage-dependent survival is assigned. The model determines the cause of death by taking the first of the two options from the life history: death from breast cancer or death from other causes. Screening is superimposed on the life histories, and changes the course of the life histories by changing the time of diagnosis and the time and cause of death. The model generates two life histories for each individual, one with and one without screening. Originally, the model was calibrated to the Dutch situation.12,26 Survival after clinical diagnoses and the improvement of prognosis after detection by screening were modelled using several international sources.27,28
Graphic presentation of the transitions in the MISCAN model. DCIS: ductal carcinoma in situ; T1A: invasive breast cancer with a diameter of 1–5 mm; T1B: invasive breast cancer with a diameter of 6–10 mm; T1c: invasive breast cancer with a diameter of 11–20 mm; T2+: invasive breast cancer with a diameter greater than 21 mm. Every woman has a probability of having an onset of breast cancer. This may be a DCIS or a T1A tumour. From DCIS she may regress back to not having breast cancer, be clinically or screen-detected, or progress to T1A. The possibility of regression exists only in the DCIS state.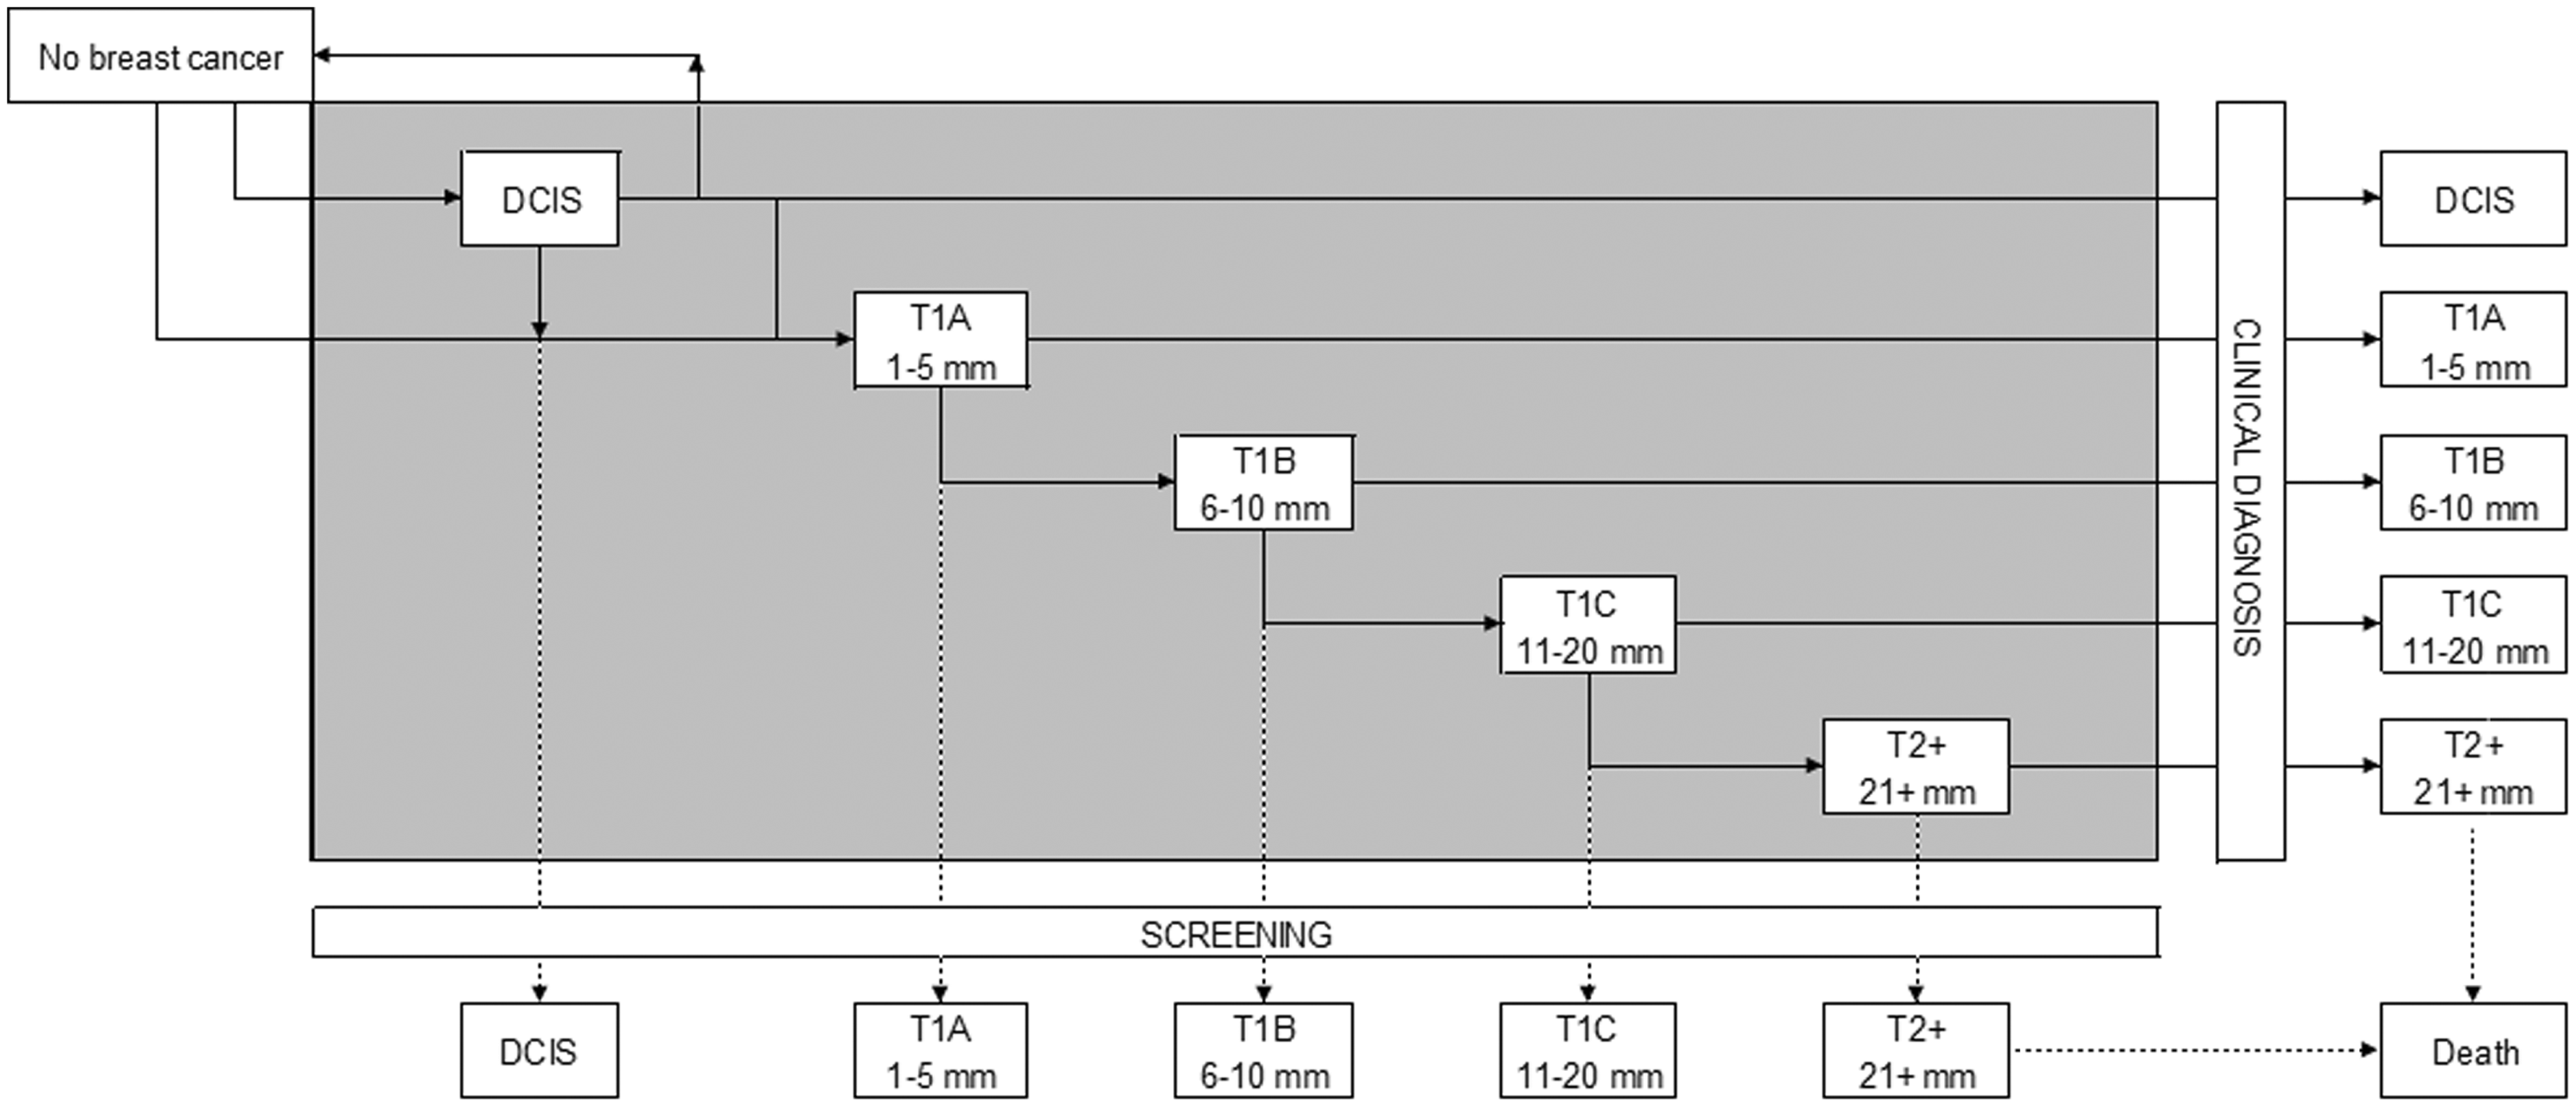
Model adjustments to the Norwegian situation
Relative risk factors used to model increased risk for breast cancer for the whole female population as a result of hormone replacement therapy (HRT).
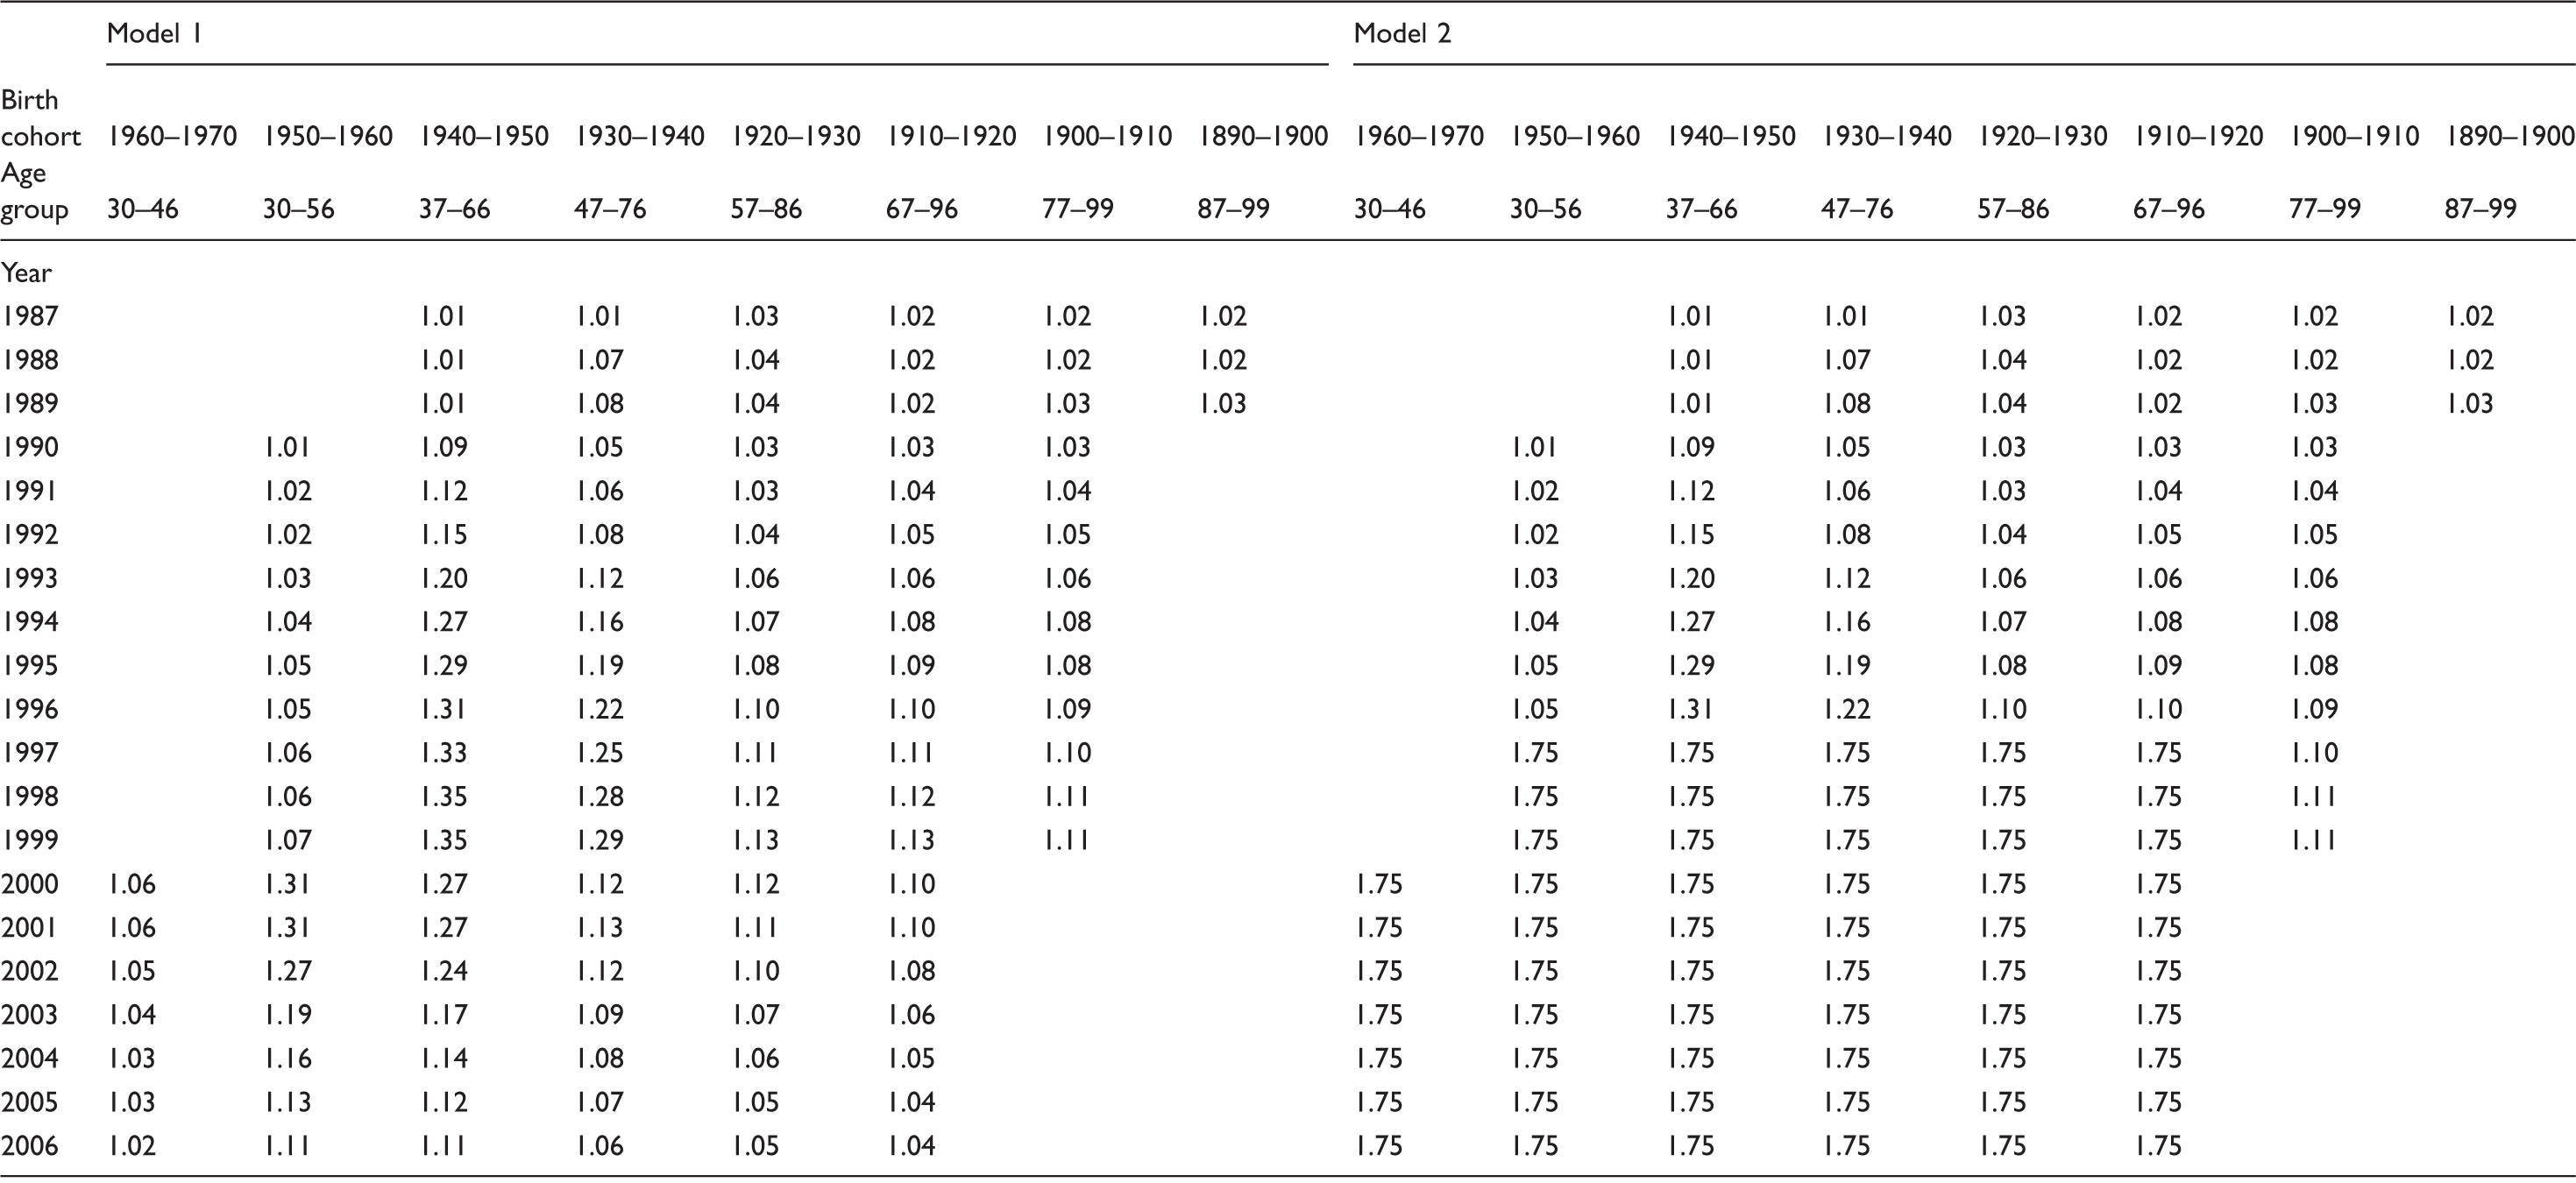
Note: In model 2, an additional relative risk was added to increase the incidence in later years. Relative risks in Model 3 are the same as in Model 1.
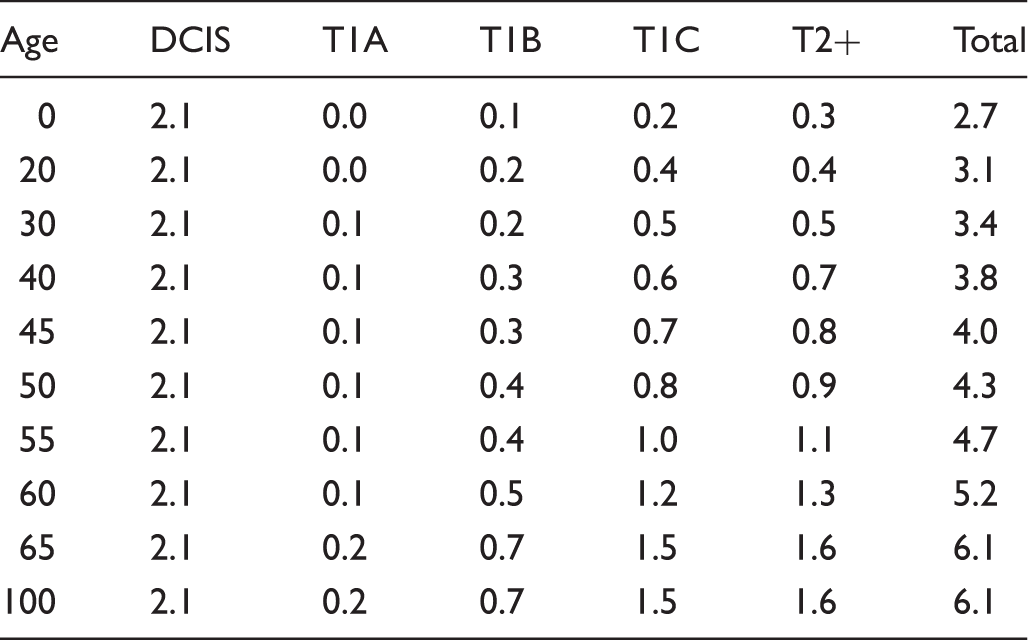
Dwell time in years by patient age and preclinical disease stage in model 2.
Output measures
Our analysis was performed on runs that simulated a population of 10 million women for all three models. Rates were calculated per 100,000 women years. We calculated breast cancer incidence with screening, and breast cancer incidence without screening, per 5 year age group for the years 1970–2008.
Calculating overdiagnosis
In accordance with the UK Independent Review Panel, we defined two measures of overdiagnosis: overdiagnosis from a population perspective and overdiagnosis from an individual perspective.
Overdiagnosis from a population perspective = (excess–deficit)/all diagnoses in women exposed to screening aged 50–100. Overdiagnosis from an individual perspective = (excess–deficit)/all diagnoses in women exposed to screening aged 50–70. A population, which is exposed to screening, initially has a higher breast cancer incidence compared with a population not exposed to screening (due to earlier diagnoses). These extra diagnoses are called the excess. After the upper age limit of screening is reached, the exposed population initially has a lower breast cancer incidence (breast cancers that were detected in the screening ages do not occur after screening). The difference between the amount of diagnoses in the entire population (aged 0–100) exposed to screening and the number of diagnoses in the entire population (aged 0–100) not exposed to screening is the deficit. The total number of overdiagnosed cancers in a population is the difference between excess and deficit.
Results
Joinpoint analysis
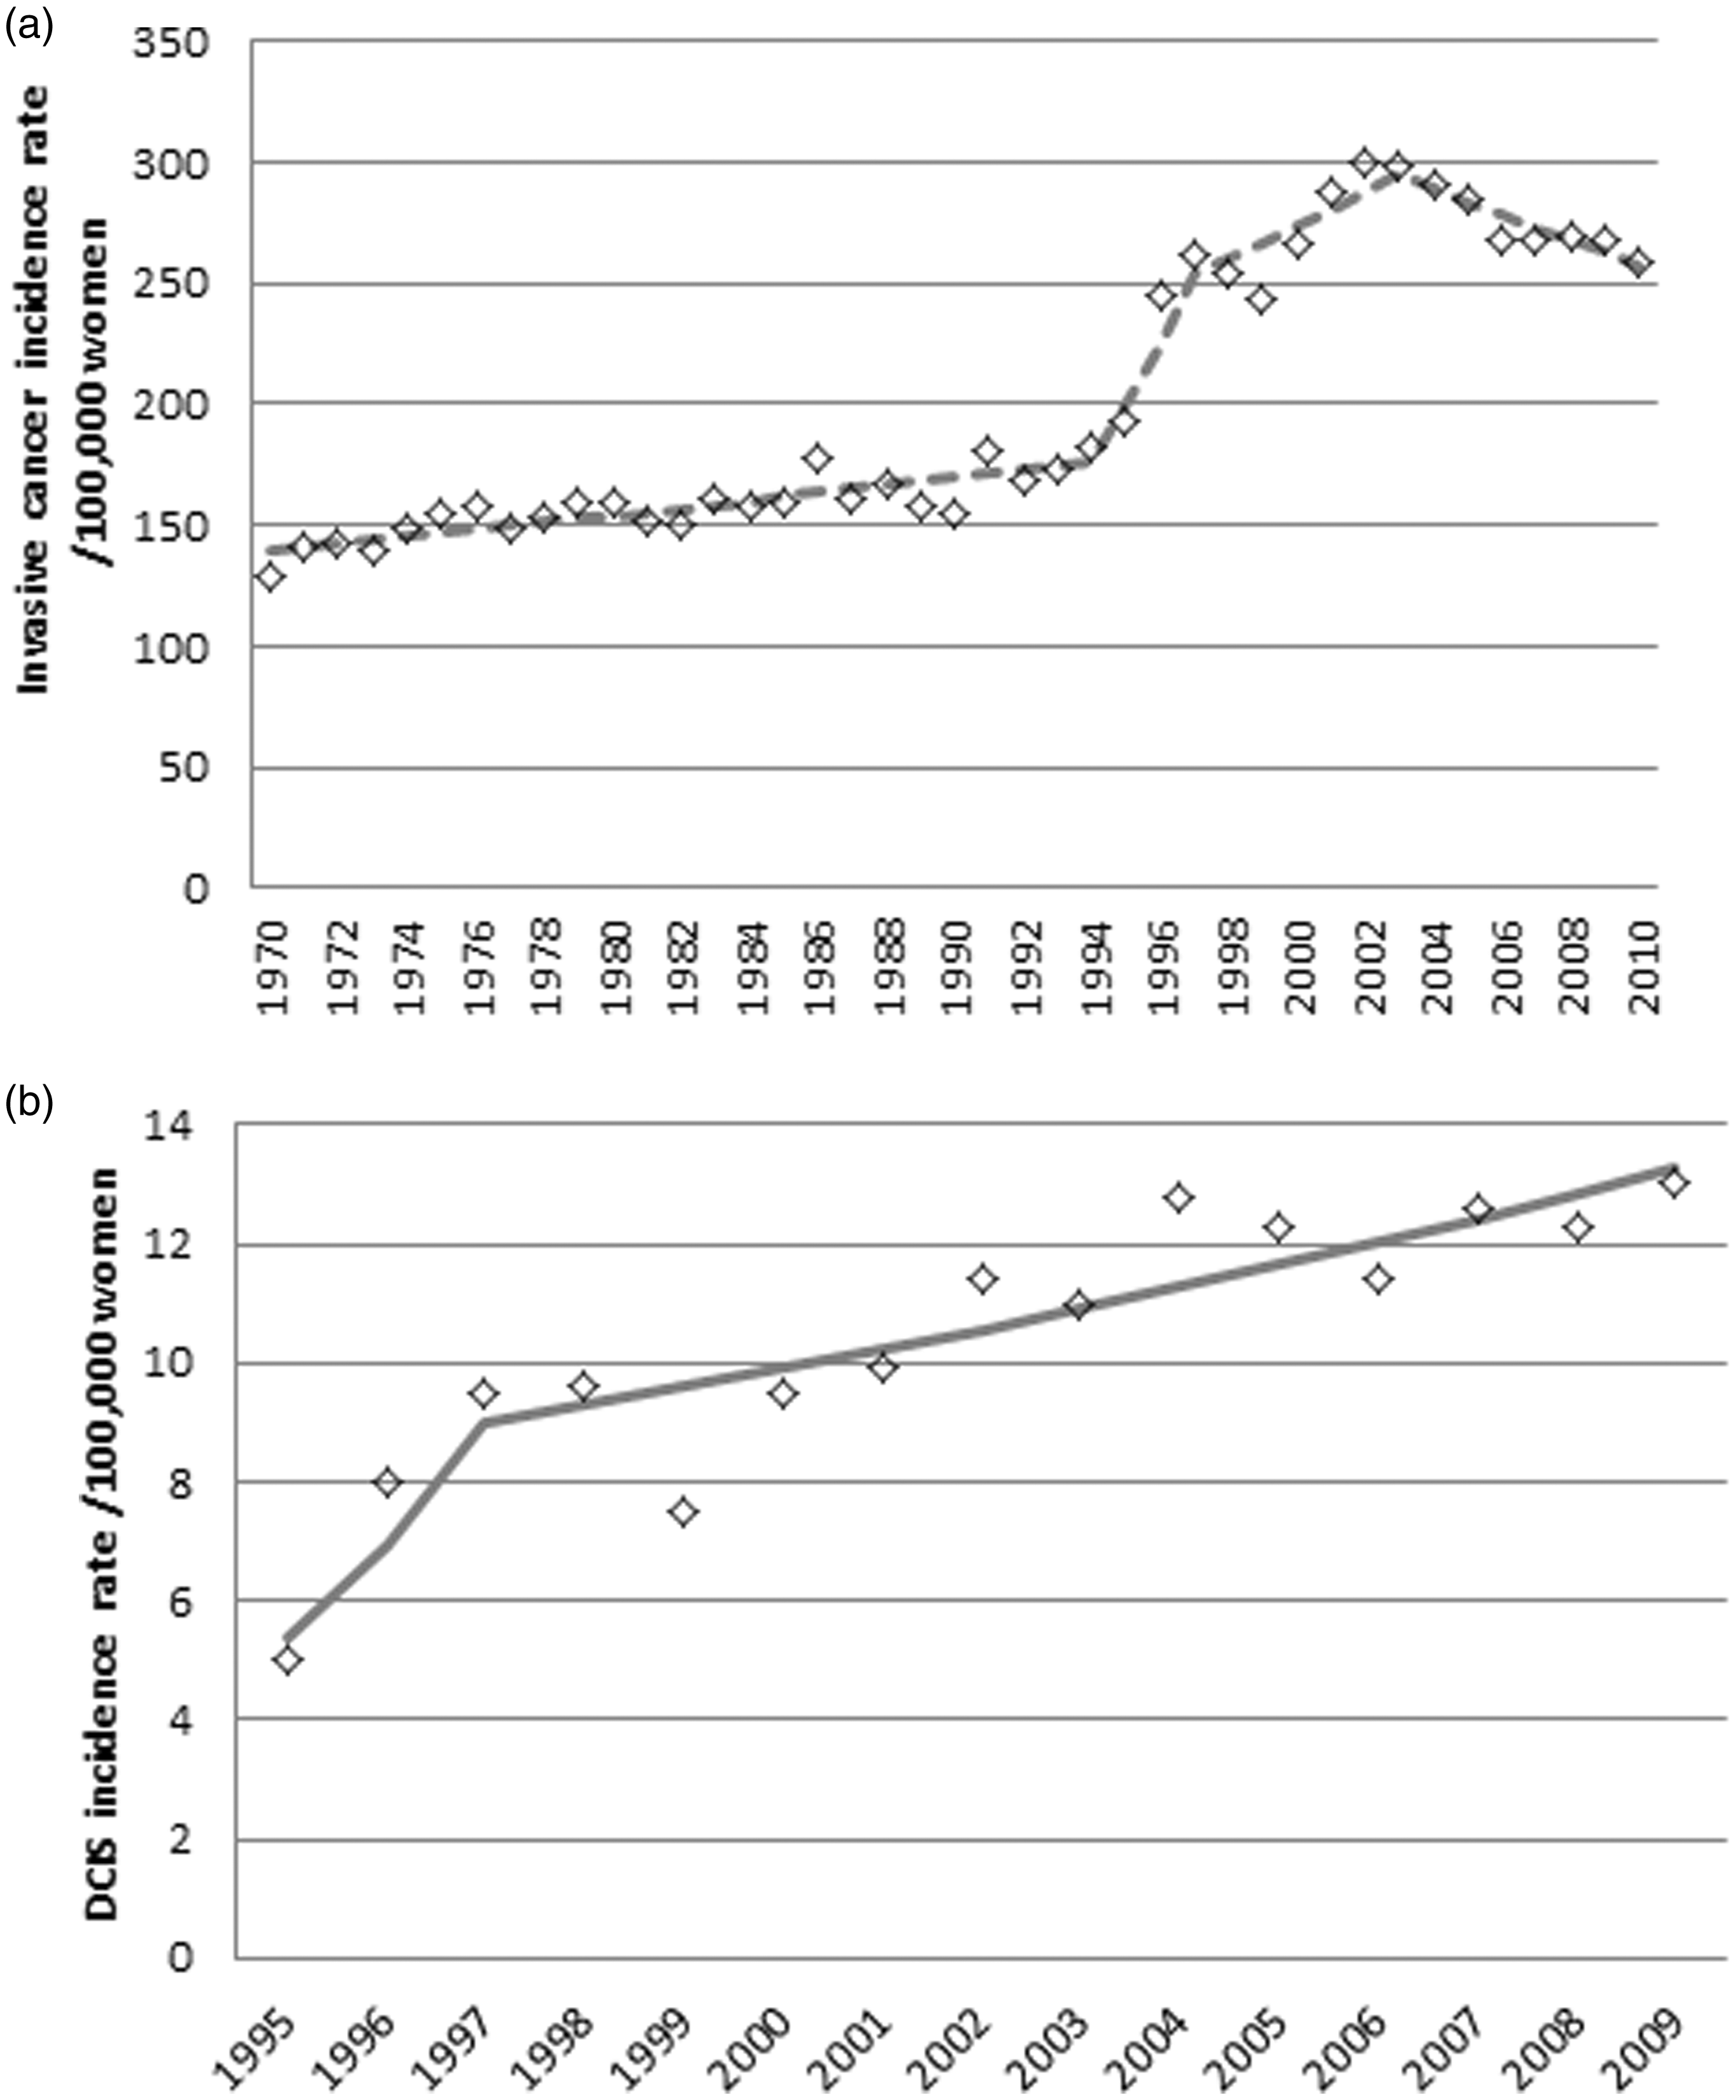
Mammography use in Norway increased steeply from 1983 to 2002, and although subtle, significant changes in annual percentage change were seen in 1985 and 1991. The use of mammography reached a climax in 2002, after which it gradually declined (Figure 2(a)). HRT use was increasing steadily between 1990 and 1994, after which the increase became less steep. In 2000, a turning point can be seen, after which the use of HRT rapidly declined (Figure 2(b)). Invasive breast cancer was steadily increasing by 1% per year, from 1970 to 1995. From 1995 to 1997, there was a much steeper increase of 13% per year, and after 1997 the increase attenuated to 2.5% per year. The maximum incidence was reached in 2003, after which incidence has been declining, with 1.9% per year (Figure 3(a)). DCIS was increasing rapidly from 1995 to 1997 with 29.5% per year, after which the increase attenuated to 3.3% per year (Figure 3(b)).
(a) Mammography use (both in the NBCSP and opportunistic screening) per 100,000 women of all ages. (b) HRT use in defined daily doses (DDD) per 1000 women of all ages. (a) Breast cancer incidence rate (invasive cancers only) per 100,000 women aged 50–70. (b) DCIS incidence rate per 100,000 women aged 50–70.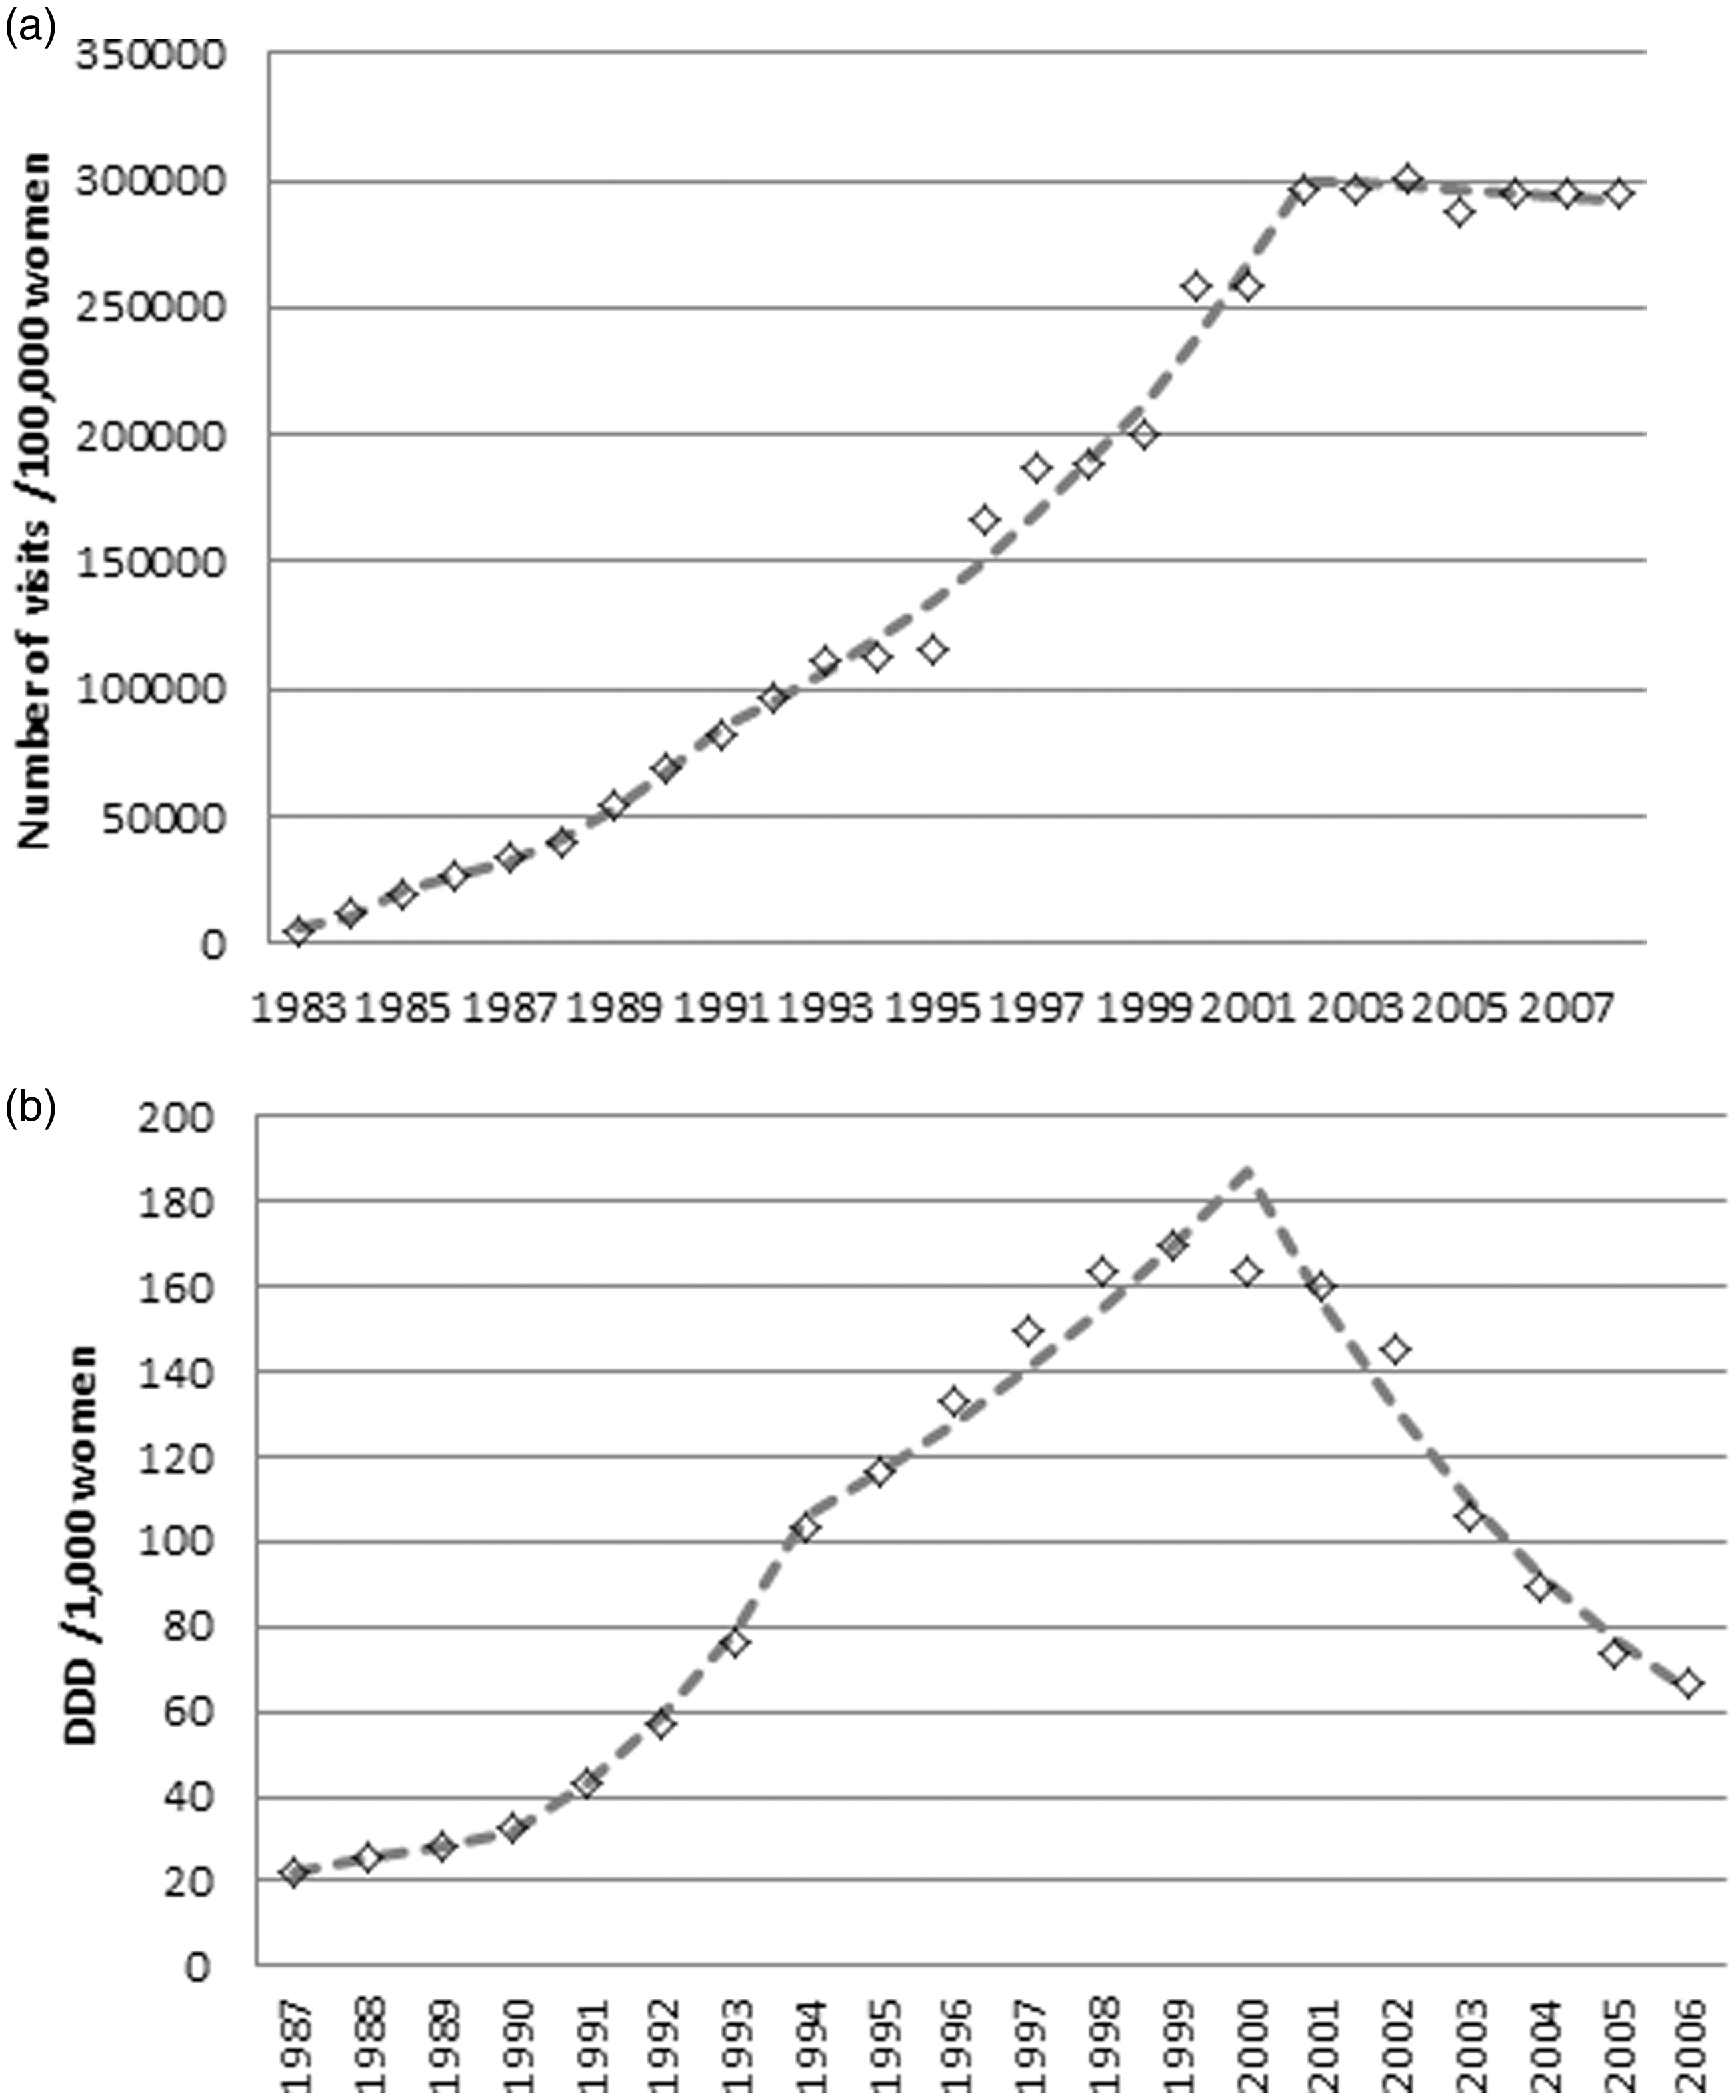
Model output
When assuming an increased background risk, the model adequately reproduced the observed breast cancer incidence data. If a stable background risk is assumed, the model underestimates breast cancer incidence in Norway in 1997–2009. If we assume a long dwell time for DCIS, incidence rates peak at first introduction of mammography, but after that, incidence rates drop rapidly, and incidence is underestimated in 1997–2009 (Figure 4). When comparing the output for the situations with and without screening, we found an estimated overdiagnosis rate of 2% for 2014–2023 for all invited women aged 50–100 (population estimate) in our best model. For all invited women aged 50–70 (individual estimate) in 2014–2023, this rate was 3%. The model with long dwell times estimates the highest level of overdiagnosis, because it assumes a large pool of dormant tumours to be detected by screening, which would never have led to breast cancer death or invasive disease in the absence of screening. In this model, the estimated overdiagnosis rate for 2014–2023 for all invited women aged 50–100 (population estimate) was 7%. For all invited women aged 50–70 (individual estimate) in 2014–2023, this rate was 11%. Overdiagnosis estimates per model are given in Table 3. Overdiagnosis estimates decrease with a longer follow-up because this allows for the full deficit in the years after screening to manifest.
Breast cancer incidence rate per 100,000 women aged 50–75. The calibrated model to Norwegian demographics, mammography use and HRT use, with increased background risk; model calibrated to Norwegian demographics, mammography use and HRT use, without increased background risk; calibrated model to Norwegian demographics, mammography use and HRT use, without increased background risk, but with very long dwell times for DCIS. Outcomes per model based on a simulated population of 10,000,000 women. Note: Excess–deficit is the difference of all breast cancer diagnoses (invasive and DCIS) for all ages with screening minus all breast cancer diagnoses (invasive and DCIS) for all ages without screening (diagnoses with screening in ages 50–100 and 50–70). The overdiagnosis estimates follow by dividing excess-deficit by the second and third columns.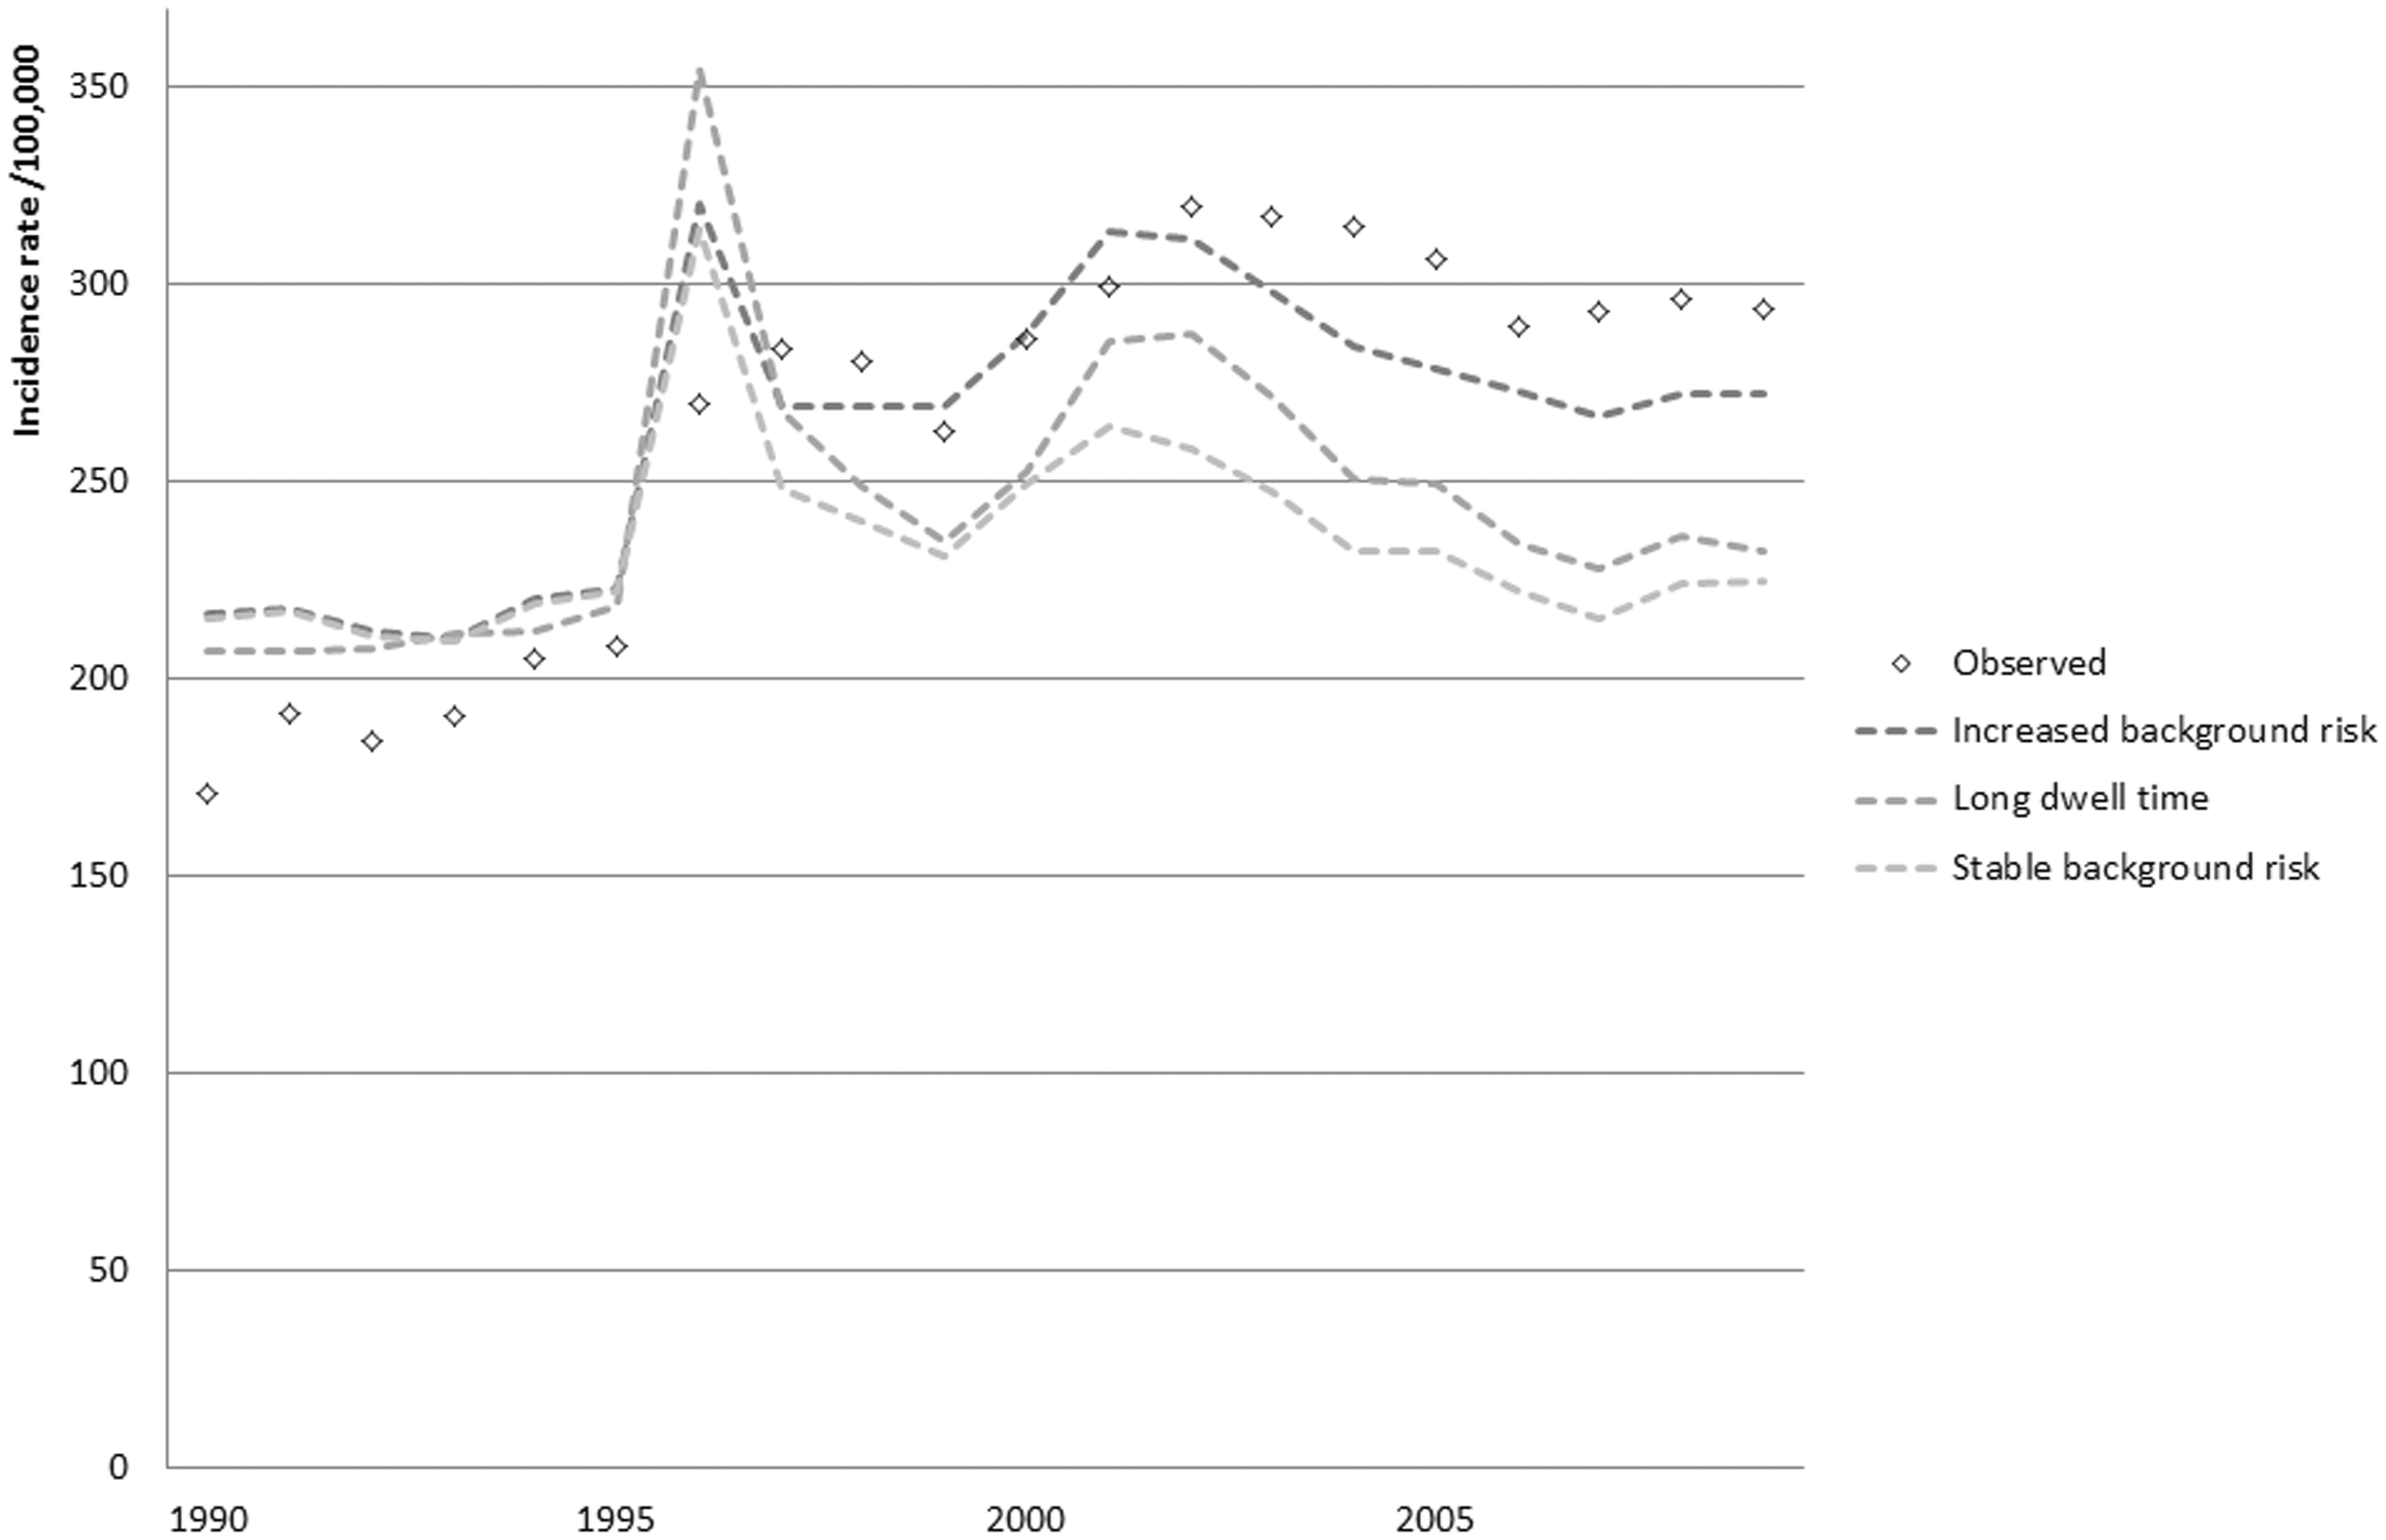

Discussion
Our study confirms that the steep increase in breast cancer incidence cannot be explained by the use of mammography and HRT alone. We explained the additional increase with a relative risk of 1.75 for women aged 87 and younger in 1997–2006. The increase in breast cancer incidence in 1994 occurred three years after the introduction of mammography, and was therefore probably the cumulative result of increased HRT use and increasing mammography use. The relative decline in 1997 coincided with a relative decline of DCIS. As this is a condition strongly associated with mammography, it seems likely that this change is the result of the fact that by then many women have had a prevalence screening; the increase in incidence as a result of detection of prevalent tumours was decreasing. The rapid decrease in 2003 coincided with the stabilization of mammography use, and followed three years after the rapid decrease in the use of HRT, so was most likely a combined result of these factors.
To fit our model to the data, we increased the background risk, similar to the cohort effect used by Weedon-Fekjaer et al. 11 This is also in line with the findings of Duffy et al., 10 who found that not all increase in incidence could be explained by extrapolating an age-specific period effect model or an age-adjusted common period effect based on data prior to the introduction to screening, to the years after the introduction of screening, and that this excess incidence could not be attributed to screening alone. The problem with calibrating the relative risk to the empirical incidence is that it excludes the possibility that all of this increase could be due to overdiagnosis. Therefore, we included the analysis with the model with long dwell times, which aims to attribute the excess incidence to overdiagnosis. This model, however, does not fit the data as well, and the relative risk is externally validated by the findings of Weedon-Fekjaer et al., 11 who found a similar cohort effect: an increase in risk from 0.74 to 1.25, a factor 1.7, which correlates well to our RR of 1.75.
A possible explanation for the unaccounted increase in incidence may be that Norwegian women have a larger additional risk of breast cancer due to HRT use. This could be the result of differences in doses, combinations of hormones in preparations, and duration of use.8,11 We used a relative risk of 2.2, which is among the highest in literature, and still could not fully explain the increase in incidence. Miscellaneous factors may be responsible. A possible association has been suggested between breast cancer and age at menarche, age at first birth, physical activity, alcohol intake, and general change in life style factors. Number of children may play a role; however, fertility rates in Norway have been stable, and the rate of childlessness at the age of 45 is relatively low. 30 Refraining from breast feeding has also been suggested; however, lactation is very common in Norway. 31 Tall women may also be at greater risk, and Norwegians are among the tallest people in the world. 32
It would be interesting to look at the histopathological characteristics of breast cancers detected by screening, vs. breast cancers detected outside the screening programme. A previous study showed a more favourable stage-distribution among participants in the NBCSP. This indicates early detection on one hand, but may also be the result of the detection of slow growing tumours with low malignant potential. 33
If we do not assume an increased background risk, our model is comparable with the study of Falk et al., 14 who showed that the estimated incidence rate ratio due to screening is approximately 1.86 for prevalence mammography (women attending screening have an incidence rate of 1.86 times that of women who do not attend screening). The incidence rate ratio was 1.46–1.69 for incidence mammography and 0.60–0.92 for women aged 70–80 (after the end of screening has been reached). We compared the impact of HRT and mammography, based on literature, to the background incidence, which is an extrapolation of trends from 1970–1990. The overdiagnosis estimate from this model was low for the period 2014–2023. The estimates in the early 2000s corresponded to the estimate made by Falk et al. (11–21%, results not shown).
When we attributed all excess increase in incidence to the detection of prevalent, slow growing tumours (assuming no regression of invasive disease), this provided a poorer fit to the incidence data, but it also provided the highest estimate of overdiagnosis rate. The results from the Research Council of Norway indicated their overdiagnosis estimates to be within this range. 34
Our overdiagnosis estimates in the early 2000s were in line with earlier estimates published for the same time periods,14,17 which were between 10% and 25%. Our overdiagnosis estimates for later years were much lower, and emphasized the need for sufficient follow-up before calculating overdiagnosis, to allow the complete occurrence of the deficit. 12
Conclusion
The increase in breast cancer incidence in Norway cannot be fully explained by mammography screening and HRT use. We calculated models to estimate the impact of an increased back ground incidence and a large impact of screening. We estimate overdiagnosis rates at 2–3%, with a maximum estimation of 7–11% for the period 2014–2023. It will be important to observe what will happen to breast cancer incidence in the upcoming years, as we move further from the massive use of HRT, and have a prolonged steady-state screening programme in place.
Footnotes
Declaration of conflicting interests
The author(s) declared no potential conflicts of interest with respect to the research, authorship, and/or publication of this article.
Funding
The author(s) received no financial support for the research, authorship, and/or publication of this article.