
Abstract
Introduction
To assess the association between perceived susceptibility of developing cancer and being screened via sigmoidoscopy/colonoscopy and prostate-specific antigen, respectively.
Methods
Participants aged 35–69, who resided in Alberta, Canada, were enrolled into the study between 2000 and 2008. We used general linear mixed models, adjusted for age, marital status, work status, education, family history and place of residence, to explore the association.
Results
Perceived susceptibility of developing cancer was associated with both screening tests at baseline and a maximum of 14-year follow-up: (i) colorectal cancer screening – adjusted odds ratios were 1.97 (95% CI = 1.52–2.55) per one-unit increase in participants' personal belief in susceptibility to cancer, and 1.03 (95% CI = 1.00–1.04) per one-percent increase in participants’ estimate of their own chance of developing cancer; (ii) prostate cancer screening – adjusted odds ratios were 1.36 times greater (95% CI = 1.07–1.72), and 1.02 times higher (95% CI = 1.01–1.03), for each respective perceived susceptibility measure.
Conclusion
Health promotion can focus on targeting and heightening personal perceived susceptibility of developing cancer in jurisdictions with low screening rates for colorectal or prostate cancer.
Introduction
Colorectal cancer is the third most commonly diagnosed cancer and fourth leading cause of cancer death in the world. By the end of 2030, the prevalence of colorectal cancer is expected to increase globally by 60%. 1 Estimates for 2018 suggested that there would be 1.8 million new cases of colorectal cancer diagnosis during that year, of which some 881,000 were expected to die. Comparatively, prostate cancer is the second most common cancer in men worldwide, and the fifth leading cause of cancer death in men. 2 , 3 Estimates indicated that there would be approximately 1.3 million new cases worldwide in 2018, while 359,000 men would be expected to die from the disease. 2 About one out of every nine American men will be diagnosed with prostate cancer in their lifetime. 4
Although the statistics mentioned in the previous paragraph depict a high prevalence of colorectal and prostate cancer worldwide, the preventive and systematic application of screening for cancer, such as a colonoscopy or sigmoidoscopy for colorectal cancer, or prostate-specific antigen (PSA) test for prostate cancer, can reduce mortality in individuals who participate in regular screenings. 5 , 6 Current recommendations from the US Preventive Services Task Force (USPSTF) suggest that for men aged 55–69, the decision to screen for prostate cancer should be an individual one, but clinicians should discuss the harms and benefits of screening or not screening via PSA with their patients. 7 USPSTF recommends screening for colorectal cancer in adults aged 50–75 with a guaic-based fecal occult blood test yearly (gFOBT), or a fecal immunochemical test yearly (FIT), or a flexible sigmoidoscopy every 5 years or a colonoscopy every 10 years. 8 However, despite the existence of well-established screening guidelines and the widely communicated benefits of screening, screening remains underutilized in many jurisdictions. 9
The Health Belief Model (HBM) is a cognitive model that comprises several core constructs, which are often examined additively to assess the likelihood of an individual performing a given behaviour.10–12 Further, the HBM suggests one’s personal beliefs regarding a disease will influence health behaviours such as screening.10–15 More specifically, the screening behaviour is predicated on two beliefs: (1) the motivation to act is based on the individual’s belief that screening for cancer will help reduce the chance of actually getting the disease; and (2) the benefits from screening, specifically in terms of risk reduction, outweigh the costs of actually getting screened for cancer. 16 , 17 Therefore, people who suppose they are likely to develop cancer may be more apt to get screened for the disease in comparison to people who feel their chances of developing cancer are low, assuming that they believe screening would be beneficial in the first place. 18 Another component of the HBM is ‘cues to action’, or external prompts leading to the initiation of some behaviour. 11 Without such prompts, the behaviour may not occur. For example, high-risk individuals may be prompted to seek screening for prostate cancer by their clinicians; in the absence of such prompting, they may not get screened.
Perceived susceptibility (PS) has been identified as one of the model’s most consistent predictors of behaviour. 10 , 11 PS has been empirically useful in its ability to predict health behaviour, specifically through personal use of preventive health services, including cancer screening.12,14,15 A recent cross-sectional analysis found that women aged between 35 and 70 who had a higher PS of developing cancer were more likely to have had mammography screening compared to women with a lower PS. 19
Although there are other cognitive models that measure PS, such as the Protection Motivation Theory, the data available for us to analyse in this study, specifically the nature of the questions asked addressing PS, fit into the theoretical framework of the HBM. 10 , 11 For example, Protection Motivation Theory often describes PS as perceived vulnerability, and posits that it is modified by an individual’s fear of acquiring a certain health threat (e.g. cancer). 11 However, as Alberta’s Tomorrow Project (ATP) does not measure fear of developing cancer, we would not be able to adjust for this intervening factor and would not be able to properly assess the relationship between PS of developing cancer to cancer screening behaviour.
Behavioural motivators of change in human activities serve as the basis for many health prevention and promotion policies. 20 Therefore, public health practitioners may be able to increase screening rates for colorectal and prostate cancer by focusing on an individual’s PS to cancer. Despite increased screening rates for both cancers in recent years, gaps in rates exist across jurisdictions, socio-economic groups and age groups.21–23 Policies to help address these gaps could include encouraging physicians to take time during medical check-ups and stimulate an individual’s PS by discussing personalized risks for colorectal or prostate cancer.
As a prelude to PS-based policies to encourage screening uptake, we assessed the association between PS of developing cancer and (i) incident sigmoidoscopy/colonoscopy screening in men and women, and (ii) incident PSA screening in men. Evidence-based studies provide information on the potential utility of behaviourally based policy interventions. Indeed, public health practitioners have encountered criticism for ignoring evidence on behaviour change, 24 thereby underscoring the foundational importance of our work for policy development.
Methods
Setting and participants
Our study used data from ATP, a population-based cohort study whose participants were enrolled between 2000 and 2008. ATP’s purpose was to examine the etiology of cancer and other chronic diseases. 25 , 26 Eligibility criteria included males and females aged 35–69 who resided in the Canadian province of Alberta for one or more years, had no personal history of cancer (except possibly non-melanoma skin cancer) and could answer study questionnaires in English. The inclusion of a wider range of ages that extended beyond the screening guidelines for non-high-risk individuals 7 , 8 allowed us to conduct longitudinal analyses on people who may have been young at the time of enrolment into ATP, but who approached or passed into screening age at later follow-ups. Recruitment involved a two-stage random sampling design to select households first and an eligible adult from each household second. All participants completed a Health and Lifestyle Questionnaire (HLQ) at baseline. They also completed follow-up surveys in three waves: (1) Survey 2004 between 2000 and 2003; (2) Survey 2008 between 2000 and 2007 and (3) Update: Health and Lifestyle Questionnaire (UHLQ) or Core Questionnaire between 2009 and 2015 (Figure 1). All surveys were sent to participants by mail. See Robson et al. 25 for more details about ATP’s design and conduct.
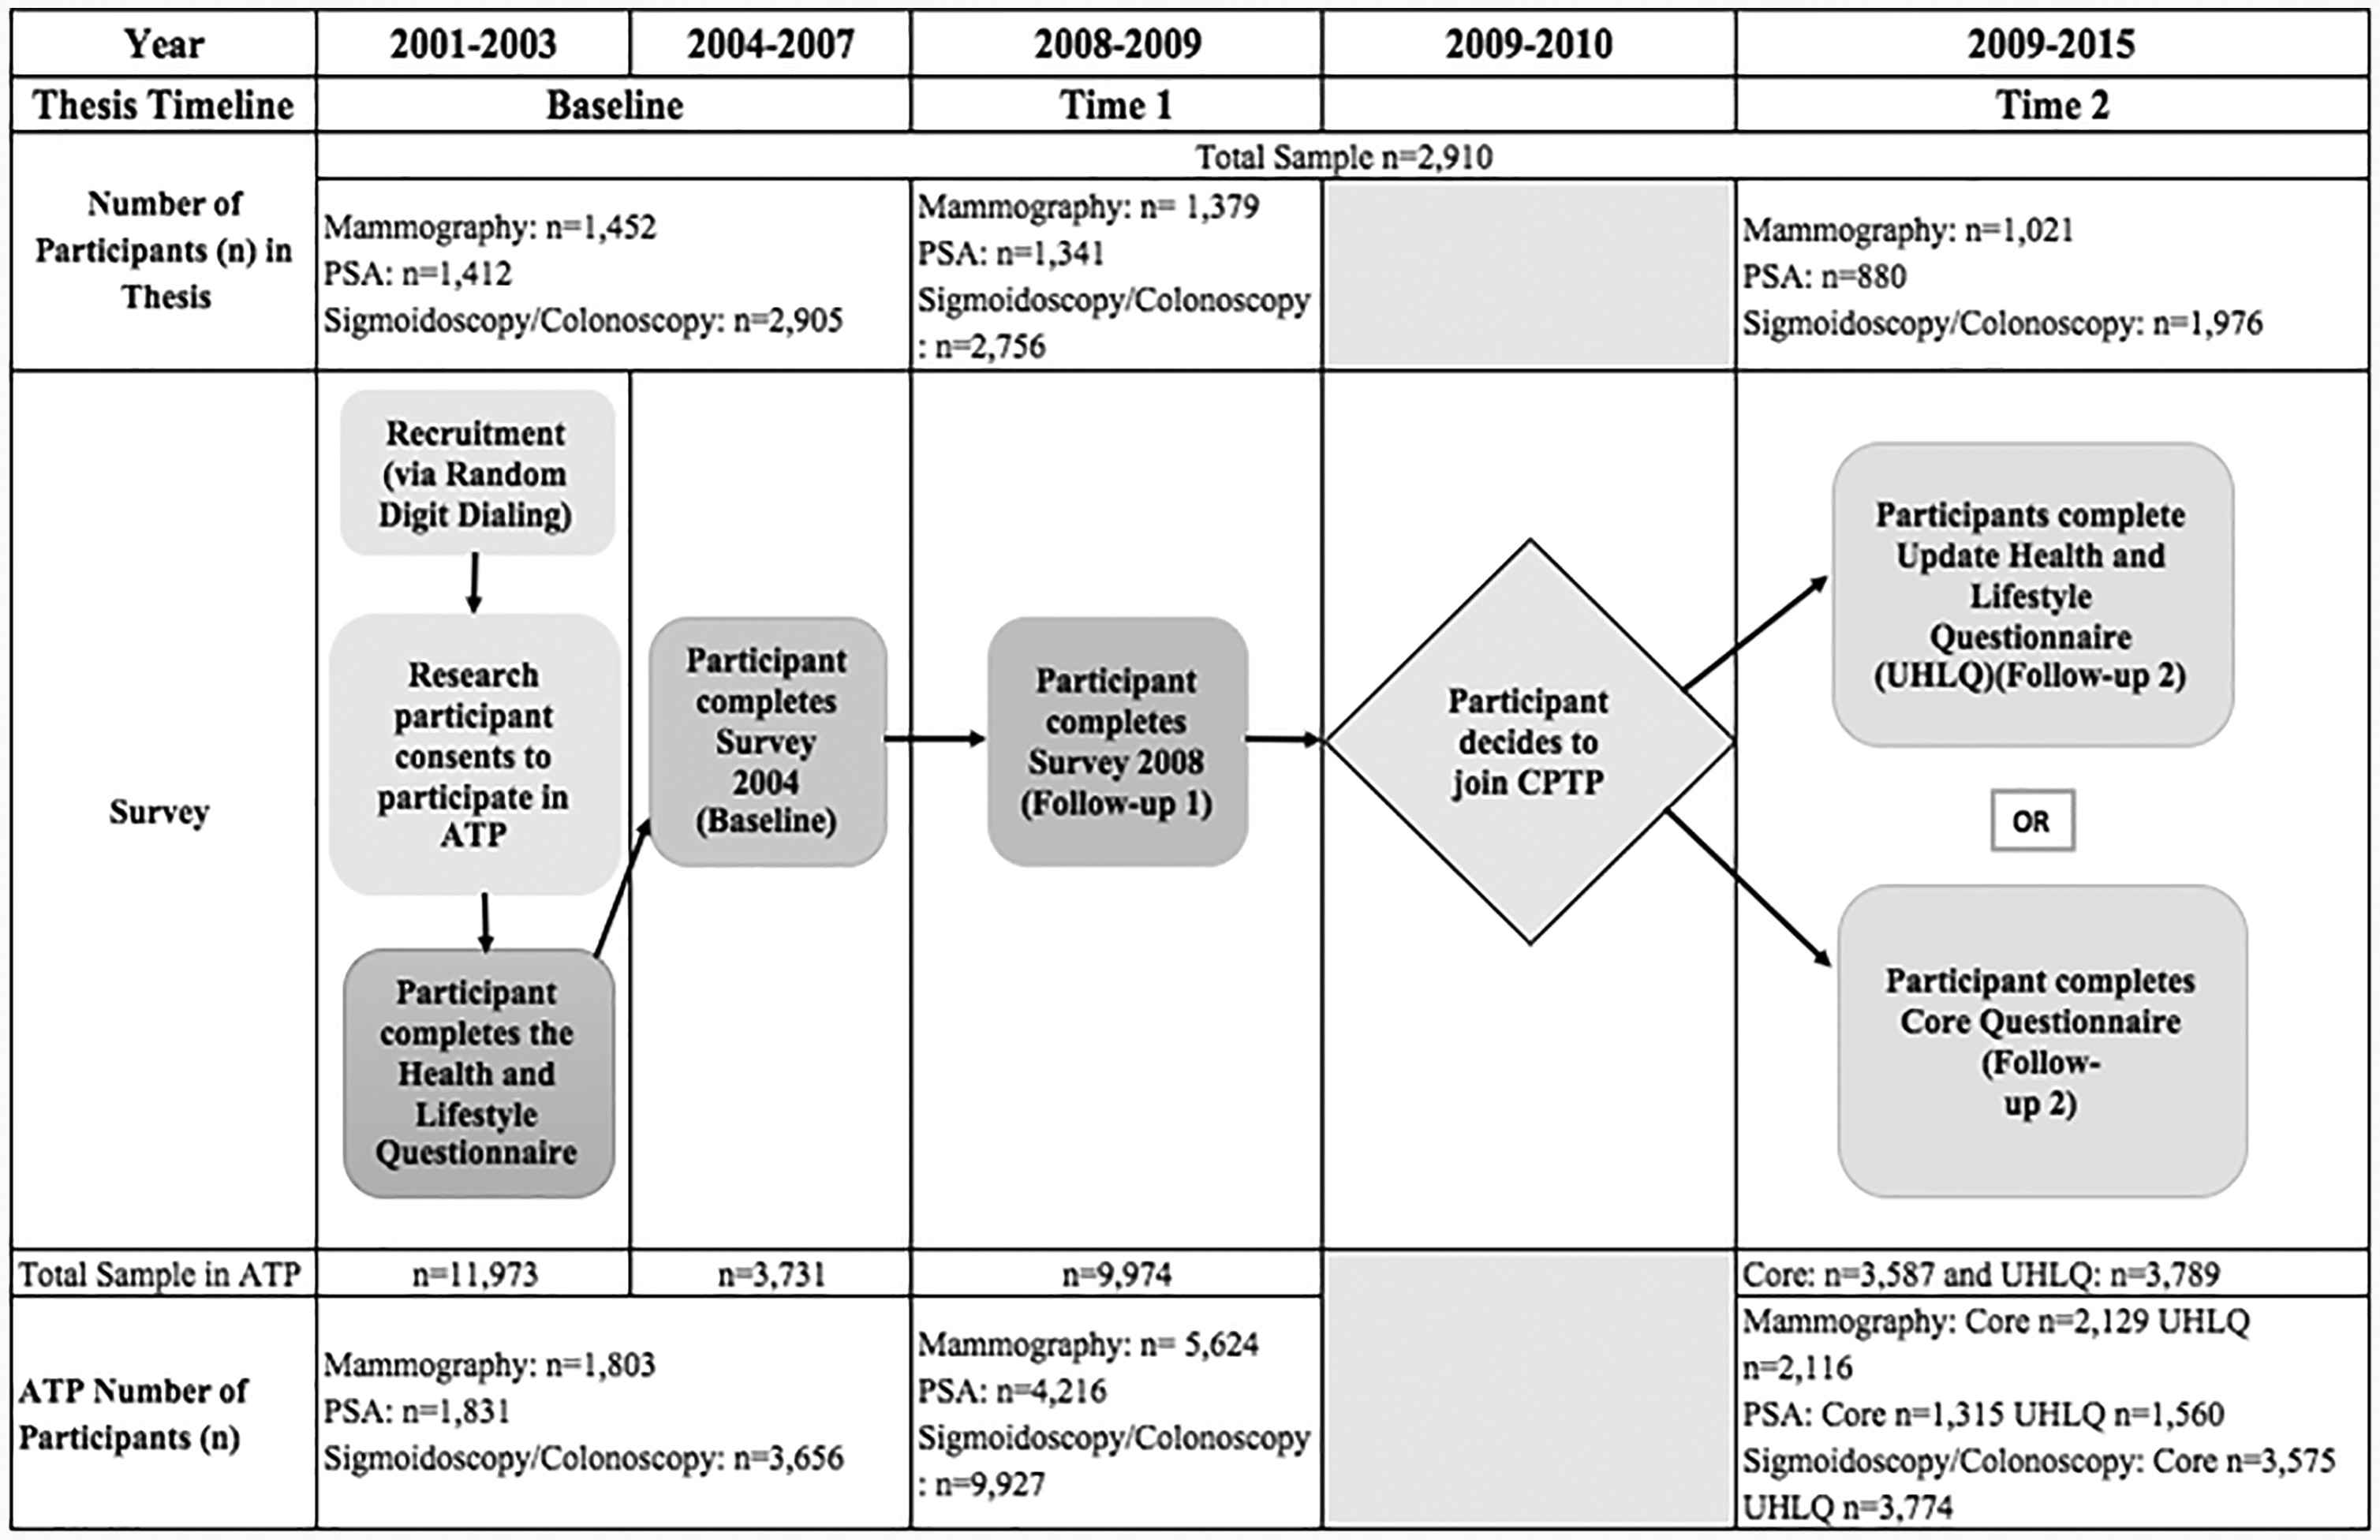
Summary timeline of Alberta’s Tomorrow Project survey distribution. PSA, prostate specific antigen; ATP, Alberta Tomorrow Project; CPTP, Canadian Partnership for Tomorrow Project, UHLQ, Update: Health and Lifestyle Questionnaire.
PS was measured with three questions in Survey 2004: (1) one’s personal opinion about lifetime risk of developing cancer, compared to other people, answered on a five-point Likert scale ranging from 1 (‘much less risk’) to 5 (‘much higher risk’; ‘relative personal risk’); (2) one’s estimate of the percentage of people in their age group who will be diagnosed with cancer during their lifetime (‘other people’s risk’); and (3) one’s estimate of their own lifetime percentage chance of being diagnosed with cancer (‘absolute personal risk’).
Since the PS questions only appeared in Survey 2004, we merged participants’ responses to the HLQ and Survey 2004 into a combined baseline dataset. Our analyses therefore encompassed a maximum of two follow-ups (Survey 2008 and UHLQ/Core). Our analytical sample included ATP participants who provided data on at least one follow-up timepoint and who answered at least one of the three PS questions (Figure 2). Men and women were included in the colorectal screening analyses; only men were included in the prostate screening analyses.
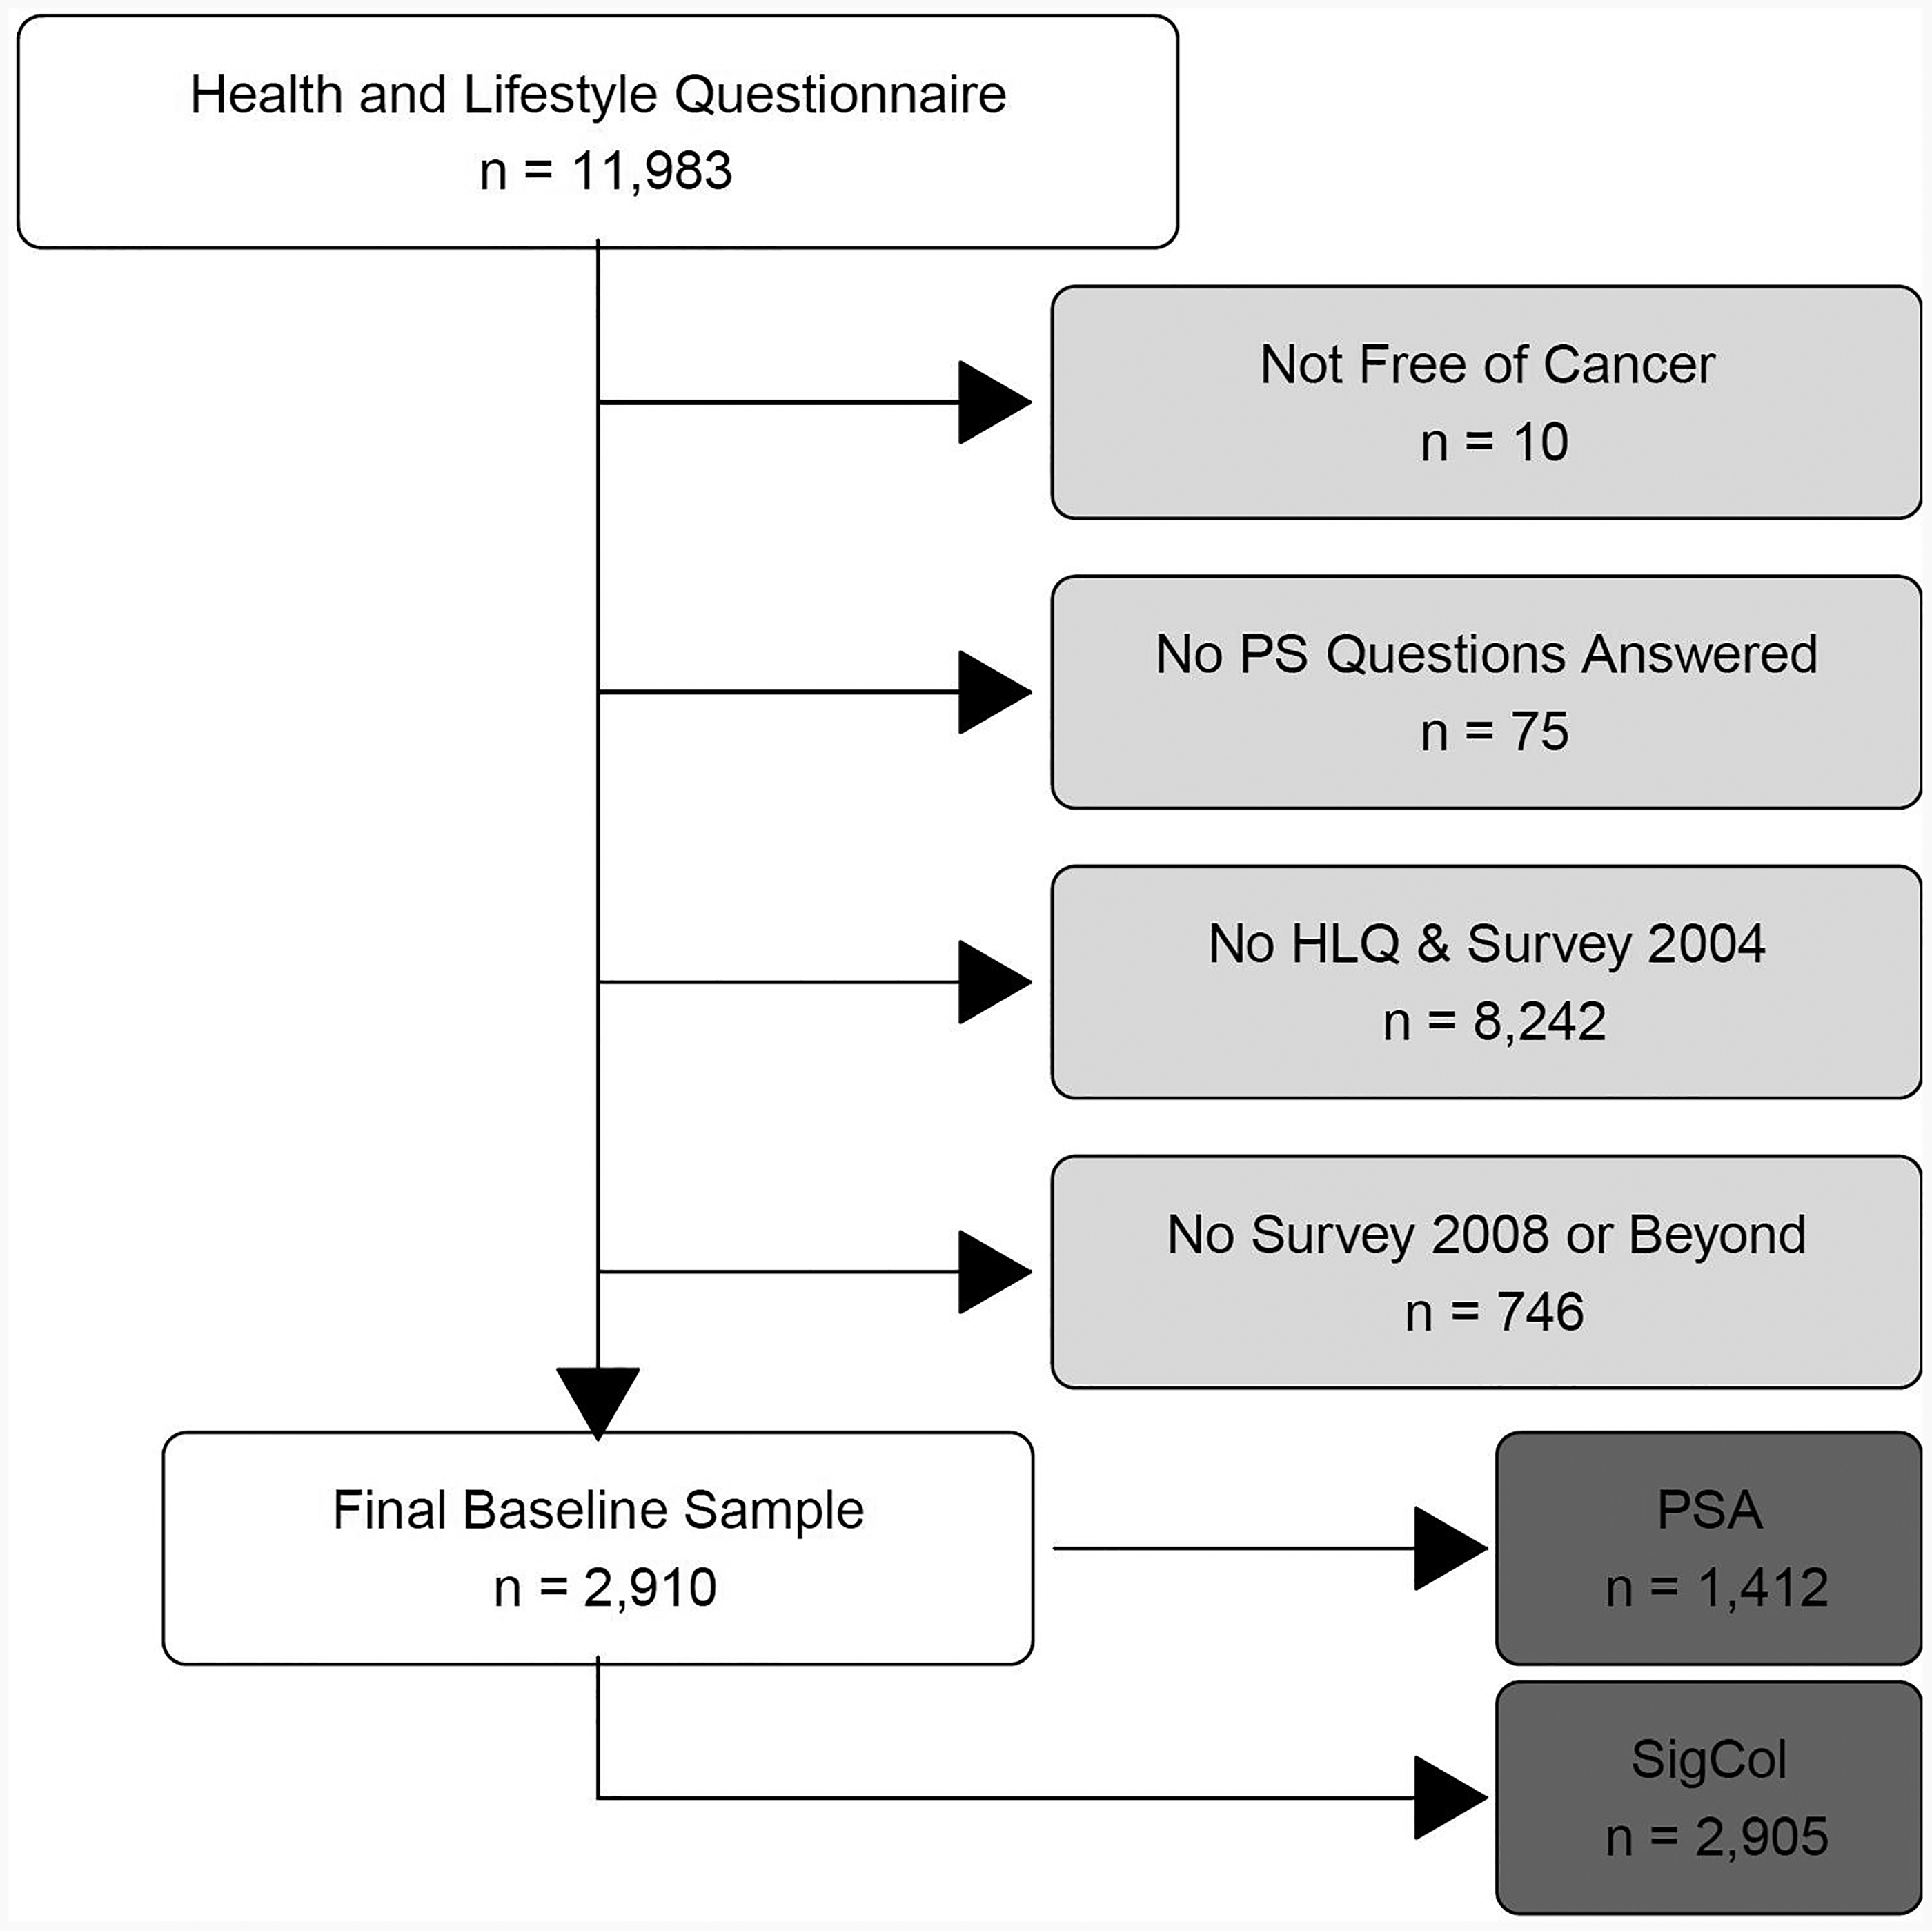
Derivation of study sample. PSA, prostate specific antigen; SigCol, sigmoidoscopy/colonoscopy.
Screening behaviour
We used self-report questions from HLQ and Survey 2004 to assess screening behaviour for colorectal and prostate cancer screening at the combined baseline. ATP adapted these questions from the 2000/01 Canadian Community Health Survey (CCHS) 27 and the California Health Interview Survey 2001. 28 The HLQ asked participants ‘Have you ever had a sigmoidoscopy or colonoscopy exam?’, followed by a brief description of the procedure. Participants answered yes, no or don’t know. The HLQ’s prostate cancer screening question followed the same format, asking participants ‘Have you ever had a PSA blood test?’, followed by a brief description of the procedure.
Survey 2004 asked participants whether they had undergone a colonoscopy since joining the study, and participants could answer yes, no or don’t know. A separate question asked about sigmoidoscopy. We merged responses to both questions by classifying participants as a ‘yes’ if they answered ‘yes’ to either the sigmoidoscopy or colonoscopy question in Survey 2004, or ‘no’ if they answered ‘no’ to both individual questions. The PSA question in Survey 2004 was unchanged from the HLQ.
The responses to the screening questions from the HLQ and Survey 2004 were combined to serve as baseline data (‘ever screened’). For colorectal and prostate screening separately, a ‘yes’ response to the HLQ or Survey 2004 question, or a ‘yes’ response to both questions, produced a ‘yes’ response to the derived ‘ever screened’ question. A ‘no’ response to both questions produced a ‘no’ response to the derived question. Likewise, a ‘don’t know’ response to both questions led to a ‘don’t know’ response to the derived question. ‘Don’t know’ responses were treated as missing values in regression analyses.
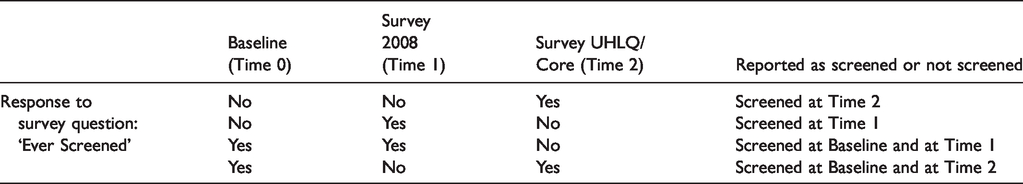
The questions about colorectal and prostate cancer screening in the follow-up surveys asked whether participants were ‘ever screened’, not whether participants were screened since the last survey. To address this issue, we developed an algorithm, shown in Table 1, to assess screening behaviour over time.
Algorithm for screening behaviour over time.
Data analysis
The baseline data were summarized descriptively using medians and interquartile ranges (IQRs) for continuous variables and frequencies for categorical variables. We used the Mann–Whitney U-test or the chi-square test to explore differences between participants in the screened versus not screened groups.
To further investigate the association between PS and both colorectal and prostate cancer screening behaviour, we built six separate general linear mixed regression models. Each model regressed screening behaviour (dichotomous response: ‘screened yes’ or ‘screened no’) for colorectal or prostate cancer on one PS variable, while controlling for a set of sociodemographic covariates obtained from a literature search: age, marital status, education, work status, family history of cancer and place of residence (rural versus urban). 12 ,29–36 We included time as a three-level categorical variable in each regression model: baseline (reference category), Time 1 (T1: first follow-up, completion of Survey 2008) and Time 2 (T2: second follow-up, completion of UHLQ or Core).
We chose generalized linear mixed models to account for inter- and intra-specific variation between and within subjects, as screening behaviour was measured at baseline and at one or two follow-up times for each participant. The models included random subject intercepts to account for each participant’s screening behaviour over time.
All statistical tests were two-sided and the significance level was set at α = 0.05. We used SAS v9.4 (The SAS Institute, Cary, NC) to conduct the statistical analyses.
Ethics and reporting
This study received ethics clearance from the University of Waterloo’s Office of Research Ethics (file # 21726). The study was reported in accordance with the Strengthening the Reporting of Observational Studies in Epidemiology (STROBE) statement (checklist available from authors upon request). 37
Results
Study population
A total of 11,983 ATP participants met the eligibility criteria for our study, as described in the Methods section. From these participants, we excluded persons who did not report being free of cancer at baseline (other than non-melanoma skin cancer; n = 10), who did not complete at least one of the three PS questions (n = 75), who did not answer both the HLQ and Survey 2004 questionnaires (n = 8242), and who did not answer at least Survey 2008 (n = 746). With this in mind, 2910 participants (49.97% males and 50.03% females) between the ages of 35 and 70 comprised the final study sample (see Figure 2). For the most part, we did not find substantive differences in demographic characteristics between the participants who were included in the final sample and those who were excluded (Appendix A, see Supplemental material). Exceptions were age and family history of cancer, with the median age of included participants being 45 years and excluded participants being 48 years; 46% of included participants reported a family history of cancer compared to 52% of excluded participants.
Of the 2910 included participants, a total of 2905 (99.8%) males and females completed the colorectal cancer screening question and 1412 (97.1%) males completed the prostate cancer screening question. Descriptive statistics are shown in Tables 2 and 3.
Descriptive statistics for sigmoidoscopy/colonoscopy screening behaviour at baseline (males and females).
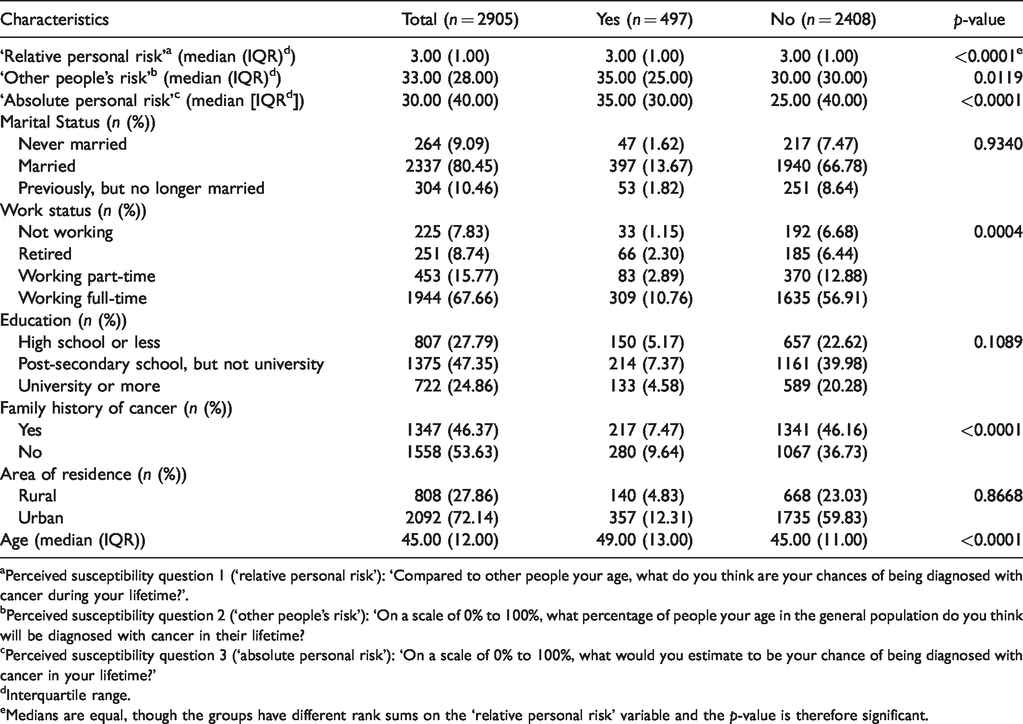
aPerceived susceptibility question 1 (‘relative personal risk’): ‘Compared to other people your age, what do you think are your chances of being diagnosed with cancer during your lifetime?’.
bPerceived susceptibility question 2 (‘other people’s risk’): ‘On a scale of 0% to 100%, what percentage of people your age in the general population do you think will be diagnosed with cancer in their lifetime?
cPerceived susceptibility question 3 (‘absolute personal risk’): ‘On a scale of 0% to 100%, what would you estimate to be your chance of being diagnosed with cancer in your lifetime?’
dInterquartile range.
eMedians are equal, though the groups have different rank sums on the ‘relative personal risk’ variable and the p-value is therefore significant.
Descriptive statistics for prostate-specific antigen screening behavior at baseline (males only).
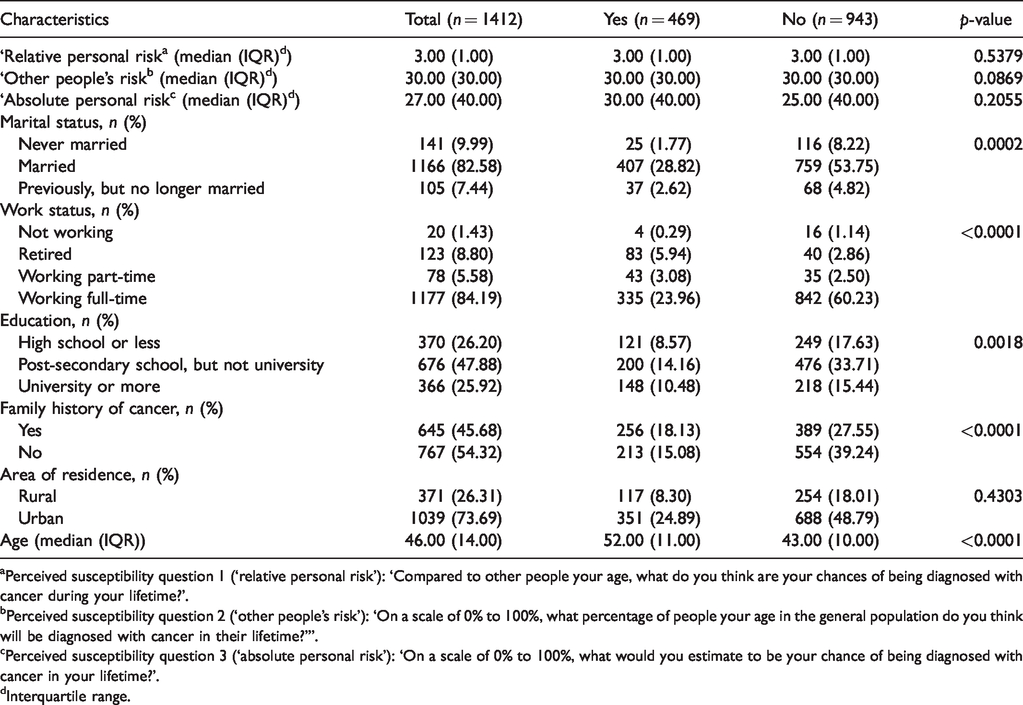
aPerceived susceptibility question 1 (‘relative personal risk’): ‘Compared to other people your age, what do you think are your chances of being diagnosed with cancer during your lifetime?’.
bPerceived susceptibility question 2 (‘other people’s risk’): ‘On a scale of 0% to 100%, what percentage of people your age in the general population do you think will be diagnosed with cancer in their lifetime?’”.
cPerceived susceptibility question 3 (‘absolute personal risk’): ‘On a scale of 0% to 100%, what would you estimate to be your chance of being diagnosed with cancer in your lifetime?’.
dInterquartile range.
Descriptive statistics
Table 2 reports baseline colorectal cancer screening behaviour for both males and females. When assessing ‘relative personal risk’, the median (IQR) PS level on the five-point Likert scale was mid-range (3.00 [1.00]) across both groups (screened and not screened for colorectal cancer). For ‘other people’s risk’, though, individuals who were screened for colorectal cancer reported a higher median percentage (35.00 [25.00]) compared to those who were not screened (30.00 [30.00]). The ‘absolute personal risk’ results were similar to ‘other people’s risk’, with a higher median percentage reported in the screened (35.00 [30.00]) versus not screened group (25.00 [40.00]). These differences were statistically significant for ‘other people’s risk’ (p = 0.0119) and ‘absolute personal risk’ (p < 0.0001).
As shown in Table 3, men who underwent prostate cancer screening reported a higher median ‘absolute personal risk’ percentage (30.00 [40.00]) at baseline than the men who were not screened (25.00 [40.00]); however, this difference was not statistically significant (p = 0.2055). For ‘relative personal risk’ and ‘other people’s risk’, baseline medians and IQRs did not differ between those who were and were not screened.
Screening behaviour over time
A minority of participants (17%) reported colorectal cancer screening at baseline (Figure 3). The percentage of participants who reported colorectal cancer screening at Times 1 and 2 increased to 25% and 36%, respectively, but still remained below the majority. For prostate cancer screening, self-reported screening percentages also increased over time, from 33% at baseline to 51% at Time 1 and 72% at Time 2 (Figure 3).
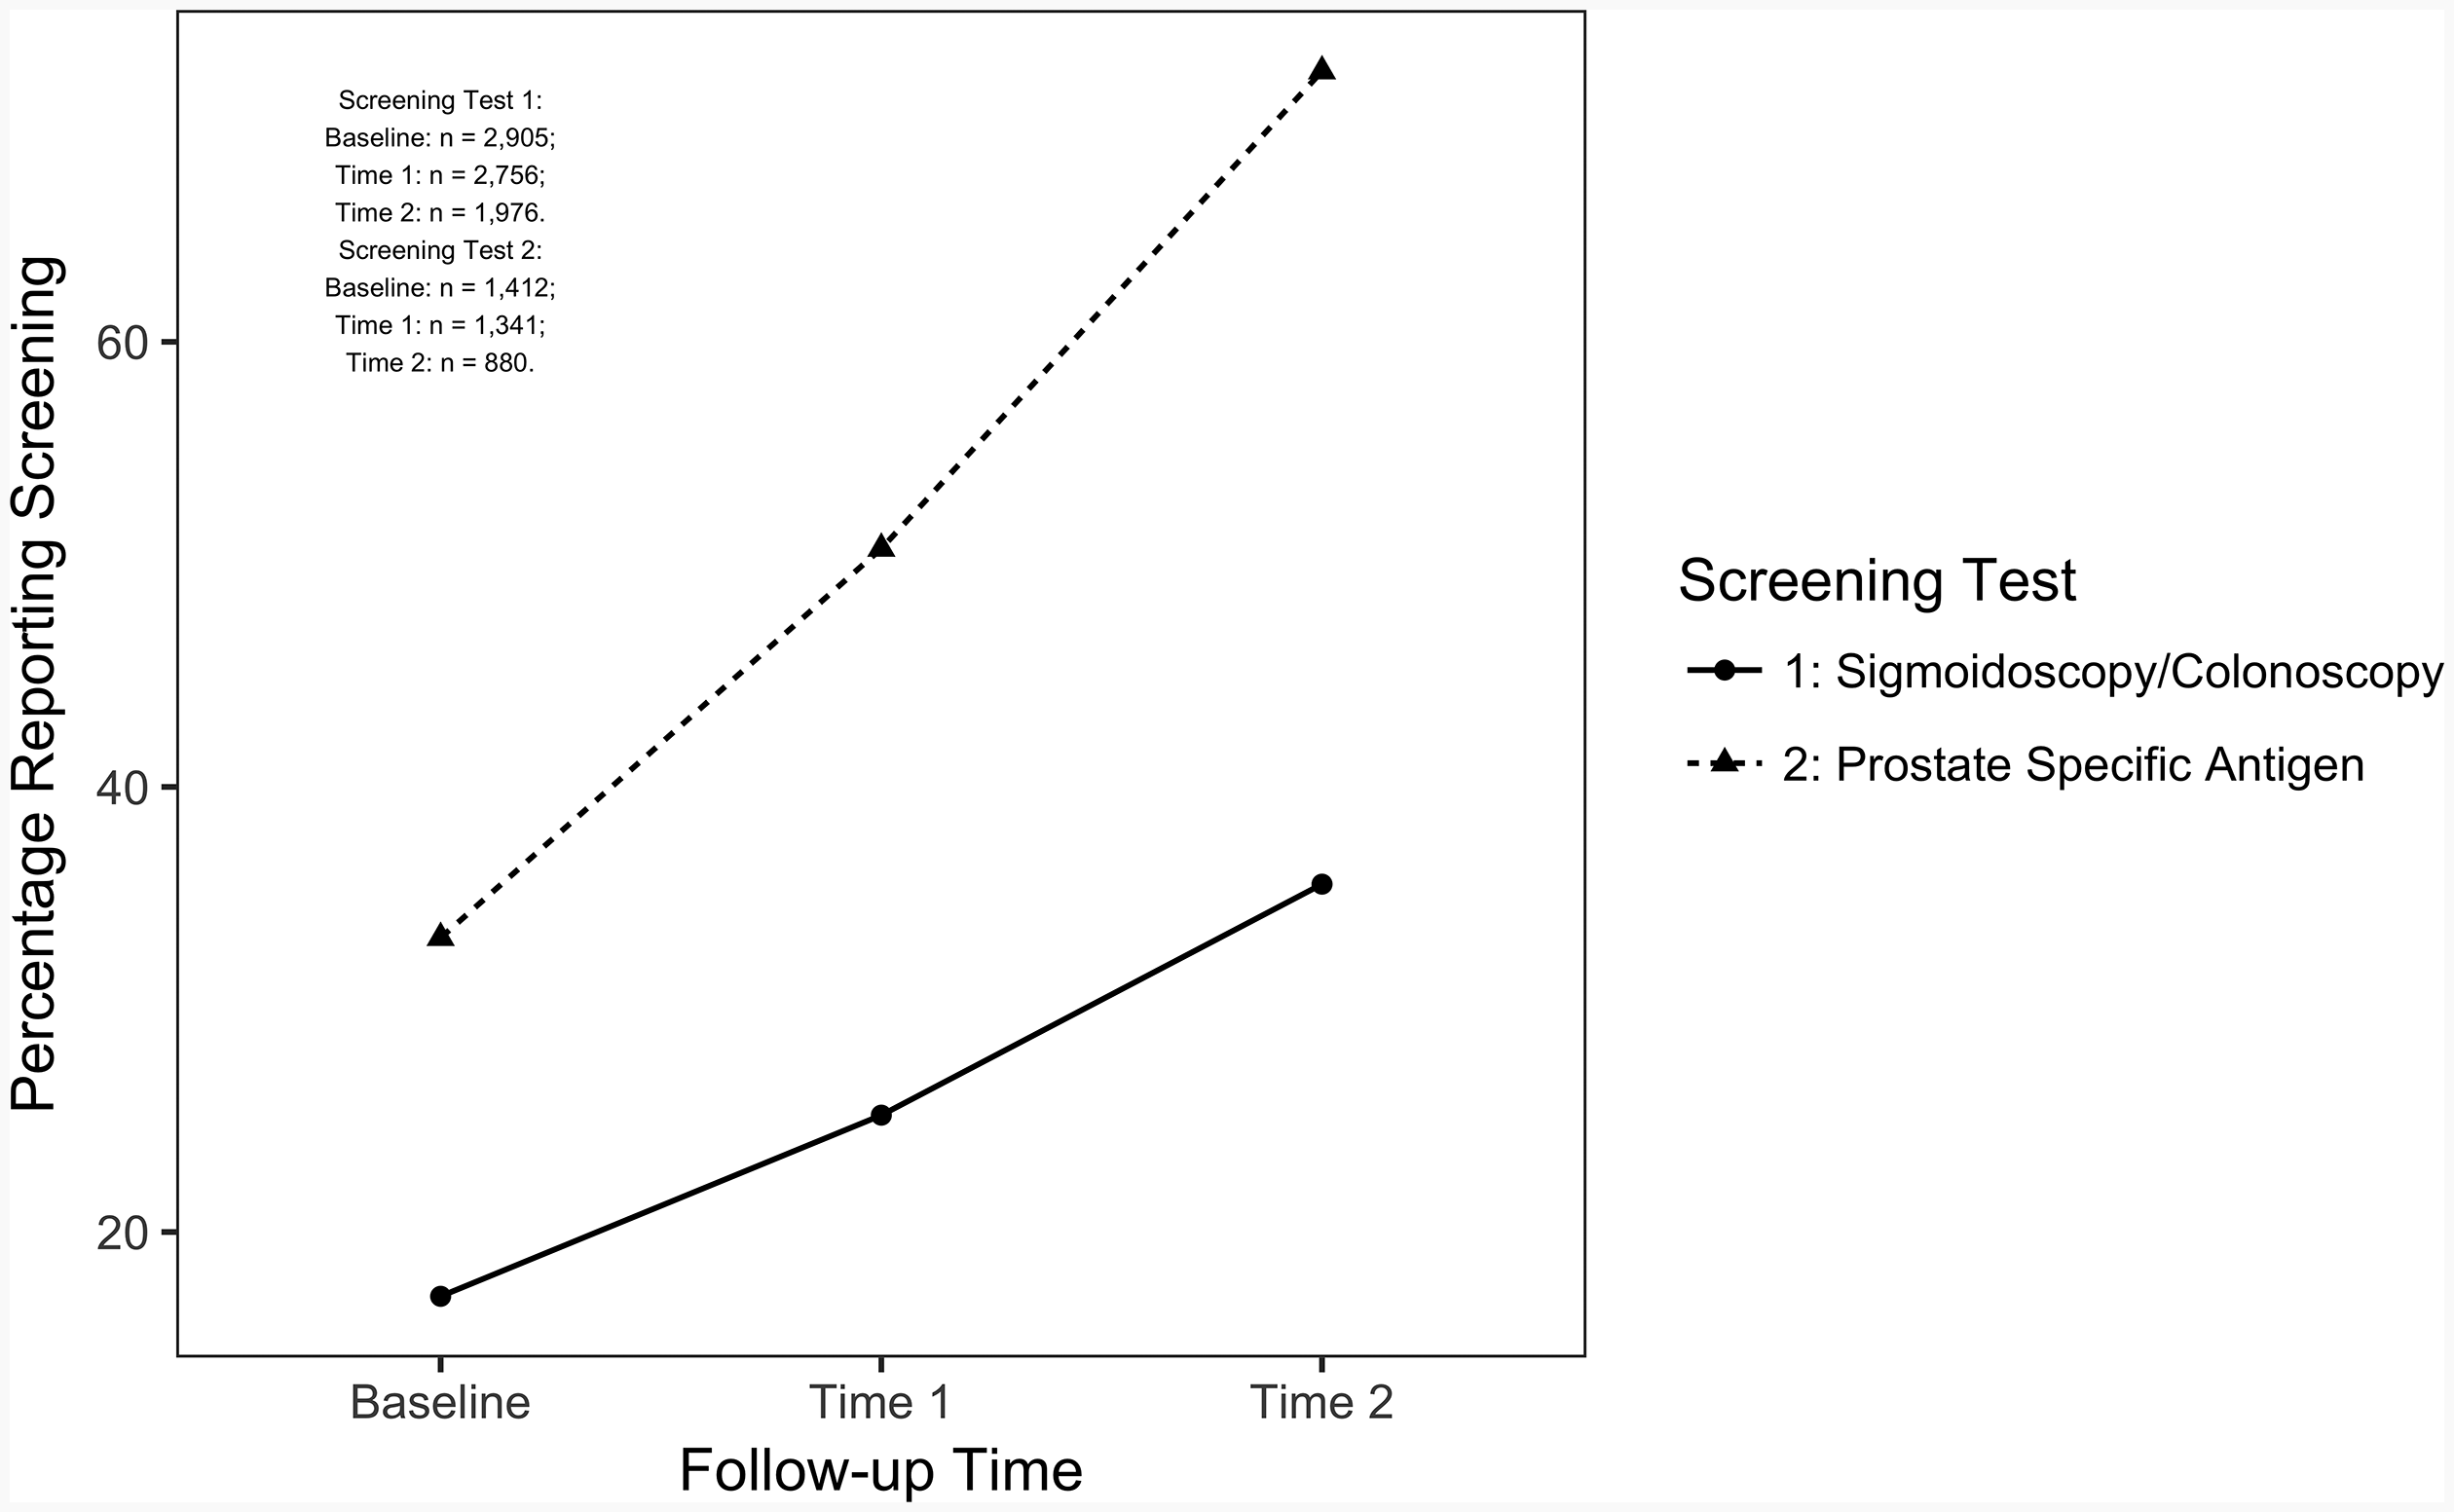
Percentage of participants reporting screening for sigmoidoscopy/colonoscopy or prostate-specific antigen.
Regression models
Table 4 shows positive associations between ‘relative personal risk’ and colorectal cancer screening behaviour (adjusted odds ratio (aOR) = 1.97; 95% confidence interval (CI) = 1.52–2.55), and between ‘absolute personal risk’ and colorectal cancer screening (aOR = 1.03; 95% CI = 1.02–1.04). Conversely, no association existed between ‘other people’s risk’ and colorectal cancer screening behaviour (aOR = 1.01; 95% CI = 1.00–1.02).
Association between perceived susceptibility and sigmoidoscopy/colonoscopy screening behaviour over time (Models 1–3).

Note: Ref: reference group; Bolded values are significant at a 5% level of significance.
aPerceived susceptibility question 1 (‘relative personal risk’): Compared to other people your age, what do you think are your chances of being diagnosed with cancer during your lifetime?
bPerceived susceptibility question 2 (‘other people’s risk’): On a scale of 0% to 100%, what percentage of people your age in the general population do you think will be diagnosed with cancer in their lifetime?’.
cPerceived susceptibility question 3 (‘absolute personal risk’): ‘On a scale of 0% to 100%, what would you estimate to be your chance of being diagnosed with cancer in your lifetime?’.
The aOR of 1.97 for ‘relative personal risk’ suggests the odds of colorectal cancer screening were 97% higher for each one-unit increase in the Likert scale, while controlling for all covariates. Therefore, a participant whose personal PS of developing cancer was four out of five on the scale, compared to another participant whose score was two out of five, would have a 3.88 higher odds (aOR = 3.88) of being screened for colorectal cancer.
The aOR of 1.03 for the ‘absolute personal risk’ variable suggests a 3% increased odds of screening for each one-unit increase in ‘absolute people’s risk’, while controlling for all covariates. Hence, if an individual’s PS to cancer was 10% higher than the next individual’s PS on the 0%–100% scale (a 10-unit increase), then their corresponding odds of being screened for colorectal cancer would be 34% higher (aOR = 1.34). If the difference in PS was 40% (40-unit increase), then the odds of being screened for colorectal cancer would be 3.26 times higher (aOR = 3.26).
Table 5 shows similar results for prostate cancer screening behaviour. ‘Relative personal risk’ (aOR = 1.36; 95% CI = 1.07–1.72) and ‘absolute personal risk’ (aOR = 1.02; 95% CI = 1.01–1.03) were both positively associated with prostate cancer screening, while ‘other people’s risk’ was not (aOR = 1.00; 95% CI = 0.99–1.01). To interpret these aORs for prostate cancer screening, refer to the above examples relating to colorectal cancer screening.
Association between perceived susceptibility and prostate-specific antigen screening behaviour over time (Models 4–6).
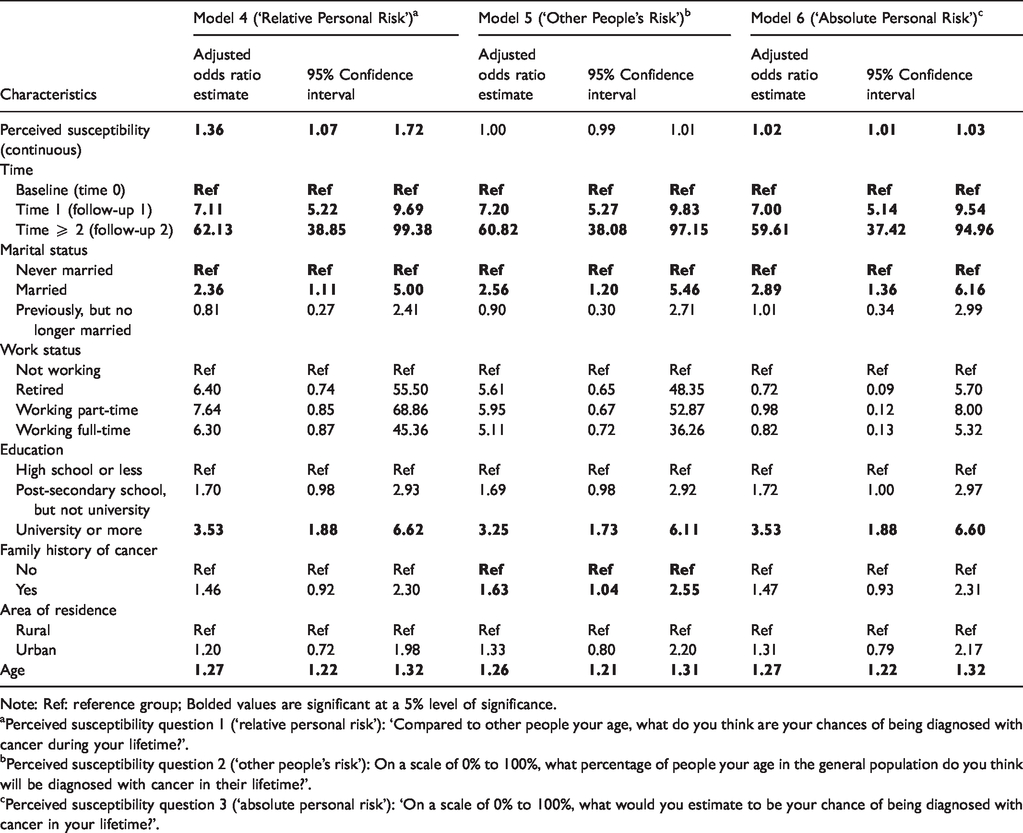
Note: Ref: reference group; Bolded values are significant at a 5% level of significance.
aPerceived susceptibility question 1 (‘relative personal risk’): ‘Compared to other people your age, what do you think are your chances of being diagnosed with cancer during your lifetime?’.
bPerceived susceptibility question 2 (‘other people’s risk’): On a scale of 0% to 100%, what percentage of people your age in the general population do you think will be diagnosed with cancer in their lifetime?’.
cPerceived susceptibility question 3 (‘absolute personal risk’): ‘On a scale of 0% to 100%, what would you estimate to be your chance of being diagnosed with cancer in your lifetime?’.
Discussion
Sigmoidoscopy/colonoscopy screening
Our finding of a positive association between PS and colorectal cancer screening behaviour was consistent with literature from the US and Spain. 12 , 13 , 38 A study conducted in Spain enrolled participants aged 40 or older (with a mean age of 53), whose first-degree relatives were diagnosed with colorectal cancer, and found a statistically significant positive association for PS of developing colorectal cancer to having ever received a colorectal cancer screening test (unadjusted odds ratio (uOR) = 2.77, 95% CI = 1.25–6.13). 12 Given participants’ closeness to persons with cancer, the results could have overestimated the strength of the association between PS and colorectal cancer screening. The other two published studies 13 , 38 were cross-sectional and included individuals aged 50–75. Findings from these studies revealed that PS was a predictor of colorectal cancer screening: (aOR = 3.72; 95% CI = 1.27–10.88) 38 and (aOR = 3.08; 95% CI 1.49–6.37). 13 However, the cross-sectional nature of these studies prevented an assessment of the temporality of the association between PS and screening. Indeed, one may imagine a scenario where an individual has no a priori thoughts about cancer yet undergoes a screening test based on a doctor’s recommendation and emerges from the experience with a heightened PS.
Despite evidence suggesting colorectal cancer screening can reduce colorectal cancer incidence and mortality rates in the range of 40%–60%, 39 screening rates were low in our study. Screening rates have also been shown to be low in the US, with 63% of eligible Americans screened in 2015. 40 These data demonstrate that highlighting PS through health promotion strategies could be a useful means of generating higher screening rates.
PSA screening
Our study findings showed that personal PS was associated with prostate cancer screening behaviour for men over time. This result was consistent with the only other study published in the area, by Sweetman et al., 35 which included participants aged between 45 and 69 who resided in the United Kingdom. Sweetman et al. 35 completed univariate analysis using a chi-square test to assess the relationship between participants’ PS of developing prostate cancer to prostate cancer screening behaviour and found a statistically significant positive association (p = 0.001). However, the investigators enrolled a highly select sample (participants (n = 128) who were first-degree relatives (FDR) of prostate cancer patients diagnosed at age 65 or less) and did not adjust for important potential confounders, such as age, education and marital status. 35
The lack of literature on PS and prostate cancer screening behaviour underscores a need for further research in the area. Our research findings provide some initial and important insights into using men’s personal PS of developing cancer to encourage prostate cancer screening. Although prostate cancer screening rates are high in many jurisdictions, not everyone avails themselves of the test, despite 100% three-year survival rates when diagnosis is made in the early stages of the disease (stages I to III). 41 As such, our study shows that providing support to an individual to understand their own level of risk should be a key part of the shared decision-making process for screening uptake.
Prostate cancer screening guidelines in the United States currently do not recommend PSA tests for men aged 70 or older, though for men aged 55–69, the recommendation is for doctors and patients to discuss the risks and benefits of the test, with patients making the final decision on whether to get screened. 7 Given the recommendation for doctor–patient discussions, physicians can initiate a topic of conversation around patients’ personal PS of developing cancer.
Public health implications
Our findings entail important policy implications. Although a wide variety of screening awareness campaigns (i.e. television ads) exist, results from this study suggest further targeted messaging through more personal means would be useful. 42 For example, doctors who highlight their individual patients’ personal risks of developing colon cancer, as well as the reductions in mortality rates for individuals who get screened, could be more influential in promoting screening than generic advertisements targeting the population writ large. Specifically, messages stressing personal risks of developing cancer, based on factors that are relevant to the individual (e.g., family history, age), could be important when highlighting PS.
Strengths and limitations
The use of population-level ATP data enabled us to explore the association between PS of developing cancer at baseline and screening behaviour over time, thereby limiting selection bias and preserving temporality. Furthermore, multiple screening tests in the same population were evaluated, which made it possible to study whether PS had similar or differential effects on more than one test. To account for the lack of consensus in defining and measuring PS, multiple measures of PS were used in the analysis.
Since only Survey 2004 included questions about PS, we could not assess changes in PS over time. The questions also assessed PS of developing cancer in general and we could not specifically examine PS to developing colorectal or prostate cancer. Also, the screening questions in all surveys after Survey 2004 asked participants if they were ‘ever screened’, rather than if they were screened since the last survey. We developed an algorithm to identify participants who had been screened since the last survey; however, some participants may have been misclassified as being screened at follow-up if they reported being ever screened at baseline and again at follow-up. Specifically, the proportion of individuals who were screened at follow-up could have been inflated as we could not identify incident screening. The inclusion of younger persons in our sample at baseline (persons aged between 35 and 50), who were less likely to be screened given existing guidelines, could have influenced our reported screening percentages and may also have partially explained the observed increases in screening percentages over time. The HBM is just one model to explain health behaviour, and additional factors that could have influenced this behaviour are not covered by the model. For example, HBM does not address an individual’s fear of developing cancer. Lastly, individuals could have been prompted to take action and get screened because of the screening questions in the ATP surveys.
Conclusion
Our study found that personal PS of developing cancer is associated with screening for colorectal cancer and for prostate cancer. Future studies can explore the role of other personal perception factors (e.g. perceived barriers to screening) to broaden the understanding of the components needed to influence screening behaviour.
Supplemental Material
sj-pdf-1-msc-10.1177_0969141320941900 - Supplemental material for Perceived susceptibility to developing cancer and screening for colorectal and prostate cancer: A longitudinal analysis of Alberta’s Tomorrow Project
Supplemental material, sj-pdf-1-msc-10.1177_0969141320941900 for Perceived susceptibility to developing cancer and screening for colorectal and prostate cancer: A longitudinal analysis of Alberta’s Tomorrow Project by Meghan Gilfoyle, Ashok Chaurasia, John Garcia and Mark Oremus in Journal of Medical Screening
Footnotes
Authors’ contribution
MG and MO conceptualized and designed the study. MG, AC, JG and MO acquired, analysed or interpreted the data. MG drafted the manuscript and AC, JG and MO revised the manuscript for important intellectual content.
Acknowledgements
Alberta’s Tomorrow Project is only possible due to the commitment of its research participants, its staff and its funders: Alberta Health and the Alberta Cancer Prevention Legacy Fund, Alberta Cancer Foundation, Canadian Partnership Against Cancer and substantial in kind funding from Alberta Health Services. The views expressed herein represent the views of the authors and not of Alberta’s Tomorrow Project or any of its funders.
Declaration of conflicting interests
The author(s) declared no potential conflicts of interest with respect to the research, authorship, and/or publication of this article.
Funding
The author(s) received no financial support for the research, authorship, and/or publication of this article.
Supplemental material
Supplemental material for this article is available online.
References
Supplementary Material
Please find the following supplemental material available below.
For Open Access articles published under a Creative Commons License, all supplemental material carries the same license as the article it is associated with.
For non-Open Access articles published, all supplemental material carries a non-exclusive license, and permission requests for re-use of supplemental material or any part of supplemental material shall be sent directly to the copyright owner as specified in the copyright notice associated with the article.