
Abstract
Objective
To explore the factors associated with attendance and attendance pattern in BreastScreen Norway.
Methods
We evaluated the number of invitations (n = 1,253,995) and attendances, 2015–2019, stratified by age, invitation method, screening unit and time of appointment. Attendance pattern was analysed for women invited 10 times (n = 47,979), 1996–2019. The association of education level, body mass index, physical activity and smoking status with attendance was analysed for a sub-sample of women (n = 37,930). Descriptive statistics were used to analyse attendance, and negative binomial regression was used to analyse the association between the total number of attendances and education level and lifestyle factors.
Results
The attendance rate was 76.0%, 2015–2019. The rate was 78.0% for women aged >64 and 73.9% for those <55 . We found a rate of 82.0% for women who received a digital invitation, while it was 73.7% for those invited by post. The rate was 78.1% for invitations in the late afternoon, 3–6 p.m., while later appointments reached a rate of 73.7%. Half of the women invited 10 times attended all times. The predicted total number of attendances was 9 out of 10 for the factors investigated.
Conclusion
The highest attendance rates were shown for women aged >64, those who received digital invitations and those having appointments in late afternoon. The differences in predicted number of attendances between the investigated factors were minor. Overall, BreastScreen Norway has a high attendance rate. However, efforts aimed at increasing the attendance in specific groups should be considered.
Introduction
Organized, population-based mammographic screening aims to reduce breast cancer mortality.1,2 A high attendance rate is crucial to reach an acceptable effectiveness of the screening program.1,2 Furthermore, such programs are only cost effective if the majority of the invited women attend.2,3 Low attendance rates limit the effect of the screening program with respect to the aim of reducing mortality from breast cancer and might also cause uncertainty among invited women about the benefit of participation. 4
About 75% of invitations sent to women in the target group for BreastScreen Norway, women aged 50–69 , have resulted in attendance. 5 This is in line with attendance rates in other European countries with comparable organization and target group. 6 However, the overall rate of women screened for breast cancer may be higher as some women rather attend screening at private clinics despite being offered participation in the organized screening program. 4
Several factors have been shown to affect screening attendance, including smoking and alcohol habits, level of physical activity, self-rated health and factors related to the screening examination such as prior false-positive screening results, experience of pain during mammography and stress associated with participation.6–12 The reported effect of education level, income and type of employment is contradictive.13,14 Use of mobile screening units may be associated with both higher and lower attendance,15,16 while fixed time and place for examination, appointment reminders and second time appointments have been shown to increase attendance rates.5,7
Screening attendance pattern implies a type or a certain algorithm of choices associated with either regular or non-regular participation in a screening program. 17 The non-regular attendee can include several subtypes, such as early or late drop outs, attending at every second, third or fourth invitation, or attending only once. Some of these patterns have previously been described in BreastScreen Norway. 17 Previous studies have shown varying attendance in BreastScreen Norway by county, invitation month and immigrant status.5,17–19 Furthermore, factors associated with compression force and pressure at prevalent (first) screening were shown to influence attendance in the consecutive screening round. 20 However, associations of administrative, sociodemographic and lifestyle factors with attendance in BreastScreen Norway, and in other screening programs, are sparse. We wanted to take advantage of the data collected as a part of BreastScreen Norway and explore the association between attendance and attendance pattern, and administrative, sociodemographic and lifestyle factors.
Materials and methods
The data protection official at the Cancer Registry of Norway approved the study (2019/23326). The Cancer Registry Regulation waived the requirement to obtain written informed consent for use of screening data for quality assurance and research. 21 We received pseudonymized data about screening invitations and attendances, and administrative, sociodemographic and lifestyle factors, from the data delivery unit at the Cancer Registry of Norway.
BreastScreen Norway is an organized, population-based screening program, targeting women aged 50–69 and administered by the Cancer Registry of Norway. 5 The program started in four counties in 1996, expanded gradually, and became nationwide in 2005. The program offers women two-view mammography biennially, and thus one screening round corresponds to two years. At the start of each screening round, women in birth cohorts corresponding to the 50–69 age group are identified using the National Population Registry and invited during the next two years. Due to the staggered roll-out of the screening program, age at first invitation varies in the 16 counties included in the study. However, all women receive 10 invitations to screening.
The women receive a postal or digital invitation from BreastScreen Norway. Women who are registered with a digital mailbox in a national system receive a digital invitation automatically. The number of women receiving a digital invitation has increased with time and in line with national campaigns encouraging the population in general to establish a digital mailbox. The invitation letter, independent of format, states time and place for examination, in addition to other practicalities. A leaflet describing the program, the opportunities to opt out of the program, and information about pros and cons of mammographic screening is attached to the letter. 22 If the invitee does not attend at the scheduled time, she will receive a reminder 5–16 weeks later, asking her to call the breast centre to schedule another appointment. This is valid for up to four months from receipt of the reminder. The fee payable by the attendee is 250 NOK (25 Euro) for each screening examination. Travel expenses to the screening unit must also be covered by the individual. The screening examinations are performed at stationary (n = 23) or mobile units (n = 4). The program is described in more detail elsewhere. 5
Study sample
We obtained data on 4,921,031 screening invitations from 998,967 women, invited and screened between 1 January 1996 and 30 June 2019 (Figure 1). The study population was divided into three study samples. Study sample 1 included all invitations sent during the period from January 2015 to 30 June 2019 (n = 1,253,995 invitations and 648,059 women). This time period was chosen to include the most recent period and to include digital invitations, which have been available since 2015. To evaluate attendance pattern, we included women invited to 10 consecutive screening rounds in study sample 2 (n = 47,979 women). In this study, attendance pattern was analysed as the number of attendances, first attendance and first non-attendance. Study sample 3 was a sub-sample of sample 2 and included women who received 10 screening invitations and responded to the questionnaire about sociodemographic and lifestyle factors, distributed as part of BreastScreen Norway, during the period 2006 to 2016 (n = 37,930 women). The questionnaire is further described elsewhere. 23 The screening invitations were the unit of analysis for study sample 1, while women were the unit for analysis for study samples 2 and 3.
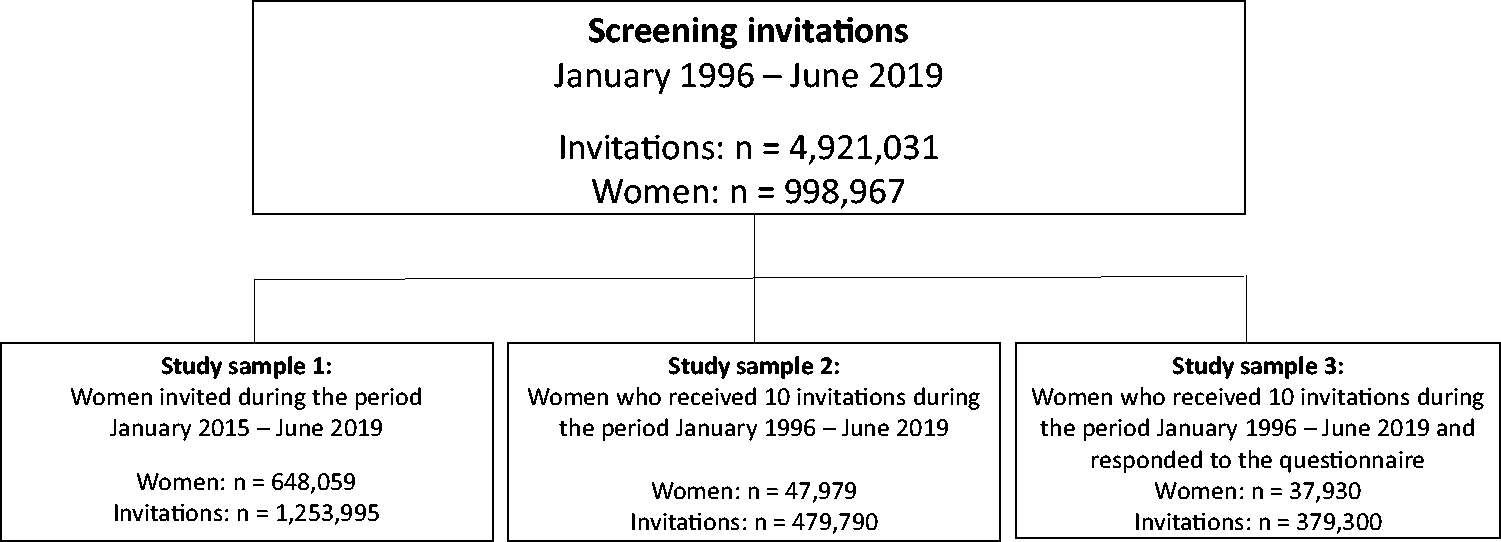
Division of study population into three study samples.
Variables of interest
Administrative factors included screening unit (stationary versus mobile), invitation method (postal versus digital) and time of screening appointment. Sociodemographic factors covered age and education level, while lifestyle factors included body mass index (BMI), physical activity (PA) and smoking status.
We obtained data on women’s age at invitation (grouped into 50–54, 55–59, 60–64 and 65–69 years), type of invitation (ordinary or reminder), invitation method (postal or digital), type of screening unit (stationary or mobile) and time of screening invitation (morning, 6 a.m.–12 p.m.; early afternoon, 12–3 p.m.; late afternoon, 3–6 p.m.; evening, 6–9 p.m.) from the Cancer Registry database. All screening units offered screening in the morning, afternoon and late afternoon, while only six of 30 units offered screening in the late evening.
Information on education level (no/primary school; secondary school; college/university <5 years and college/university >4 years), BMI (weight (kg) divided by squared height (m2), grouped into: underweight <18.5 kg/m2; normal 18.5–24.9 kg/m2; overweight 25–29.9 kg/m2 and obese >29.9 kg/m2), PA (<2 h a week; 2–3 h a week, >3 h a week), and smoking status (ever (currently/previously) or never) was obtained from a questionnaire the women responded to during the period from 2006 to 2016. 23
Statistical analyses
We present frequencies and percentages of women invited and attendees by type of invitation, screening unit, invitation method, age group and time of screening appointment. Attendance rate (%) for each level of these variables is reported. Attendance patterns were descriptively analysed using bar graphs. Frequencies and percentages for each level of education, BMI, PA and smoking status are presented, in addition to the median and interquartile range (IRQ), as total number of attendances among 10 consecutive invitations. Uni- and multivariable negative binomial regression was used to analyse the association of total number of screening attendances and education level (grouped), BMI (grouped), PA (grouped) and smoking status (ever/never). All covariates were included in the multivariable model. Results are presented as incidence rate ratios (IRR) with 95% confidence intervals (CI) and predicted number of total attendances and 95% CI in each group for each covariate. Association of education level, BMI, PA and smoking with the odds of attending following 10 invitations was analysed with uni- and multivariable logistic regression and is shown in the online Appendix. Results were presented as odds ratio (OR) with 95% CI and predicted probability of attending after all 10 invitations with 95% CI. Predicted probabilities were calculated from the multivariable models. STATA® software, Version 16.0 (StataMP, StataCorp, TX, USA) was used in the analyses and visualization of the data.
Results
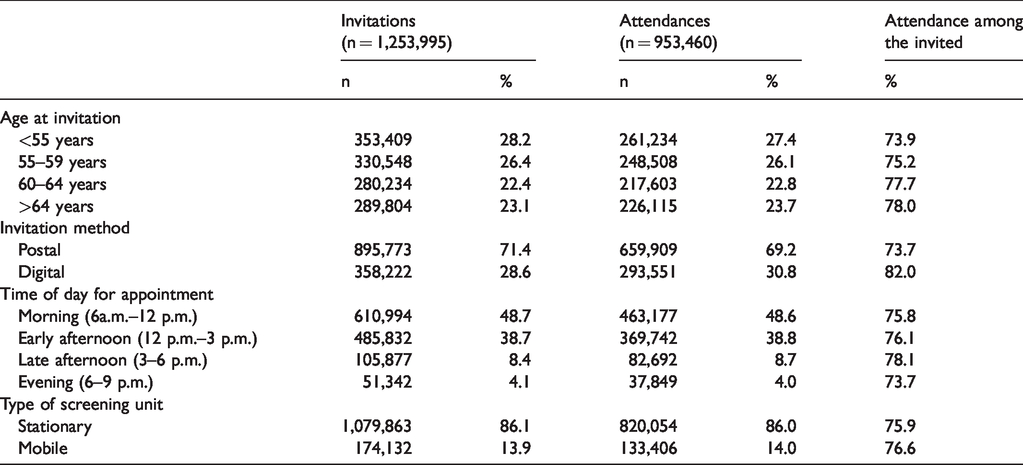
A total of 1,253,995 invitations were sent to women in the target group between January 2015 and June 2019, of which 890,038 (71.0%) resulted in attendance. A reminder was sent to those who did not attend, resulting in 63,422 additional attendances, and a total attendance rate of 76.0% (953,460/1,253,995).
The attendance rate was highest for women aged >64 (78.0%) compared to the younger age groups. The proportion of invitations sent digitally was 28.6% during study period 1, 2015 to 2019. A higher attendance rate was observed among women who received digital (82.0%) versus postal invitations (73.7%) (Table 1). Mean age for women who received a digital invitation was 58.3 (SD = 5.8), while it was 59.3 (SD = 5.9) for those who received a postal invitation. The proportion of women who received a digital invitation increased from 0.8% in 2015 to 46.0% in 2019. The attendance rate was 76.6% for mobile units and 75.9% for stationary units. The attendance rate varied by time of day: 75.8% in the morning, 76.1% early afternoon, 78.1% late afternoon and 73.7% in the evening (Table 1).
Number (n) and percentages (%) of invitations and attendances and attendance rate, by age at invitation, invitation method, time of day for appointment and type of screening unit, for women targeted by BreastScreen Norway, 2015–2019.
Since the start of BreastScreen Norway up to June 2019, 47,979 women had received 10 invitations (Figure 1). A total of 2964 (6.2%) women never attended, 1229 (2.6%) attended once, 45,015 (93.8%) attended at least once, while 25,088 (52.3%) attended all 10 invitations (Figure 2). Of the women who attended at least once, 39,336 (87.4%) attended on first invitation and 3072 (6.8%) attended for the first time on the second invitation (Figure 3). First attendance on the last invitation was observed among 113 (0.3%) women.
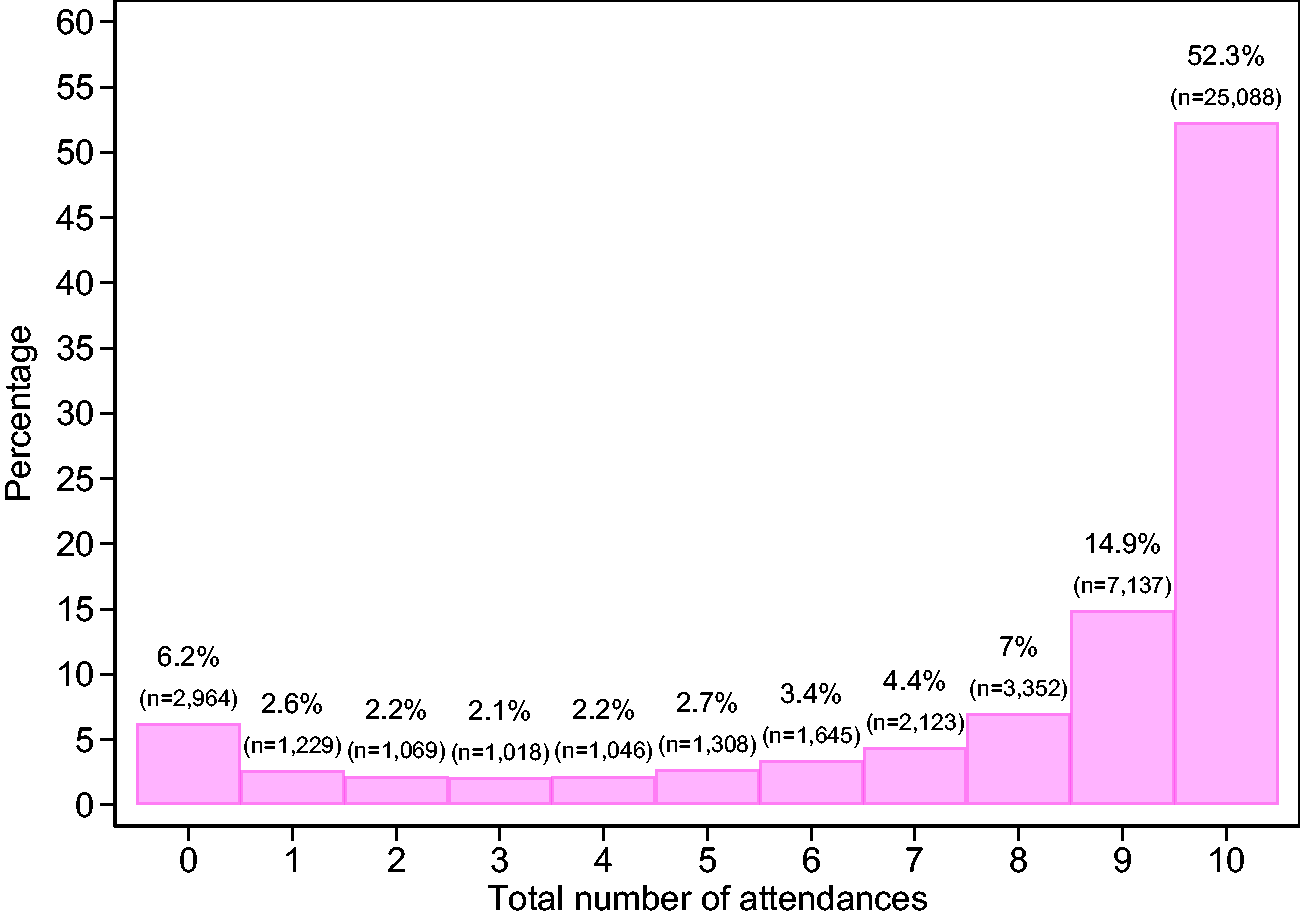
Percentage breakdown according to number of attendances (0–10) for women who received 10 invitations to BreastScreen Norway, 1996–2019.
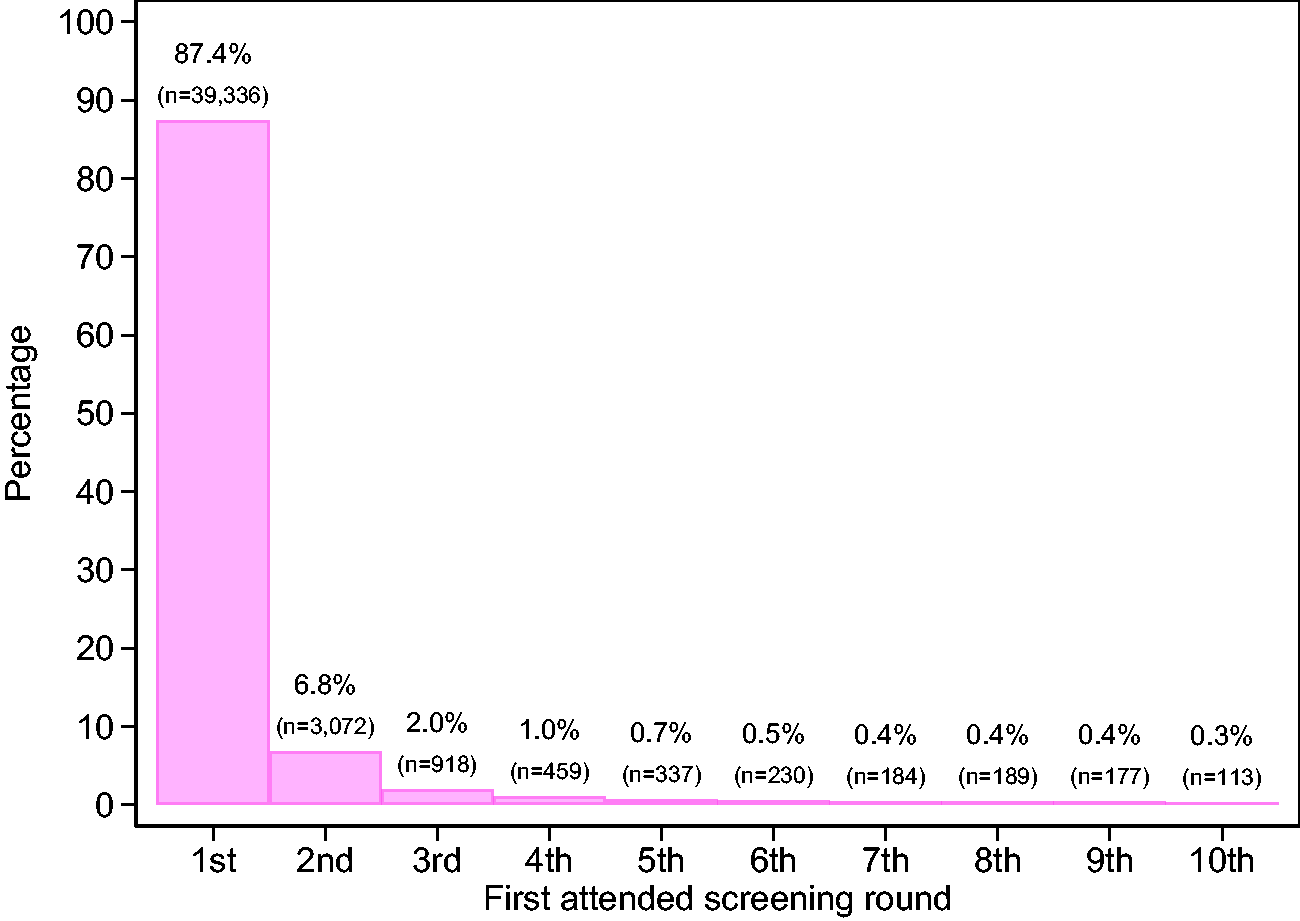
Percentage breakdown according to first attended screening round (1st–10th) for women who attended following at least one of the 10 invitations, 1996–2019.
Among the women who attended on first screening invitation, 14,248 (36.2%) did not attend on all 10 invitations. A total of 3480 (24.4%) of these woman had their first drop-out at the second invitation (Figure 4).
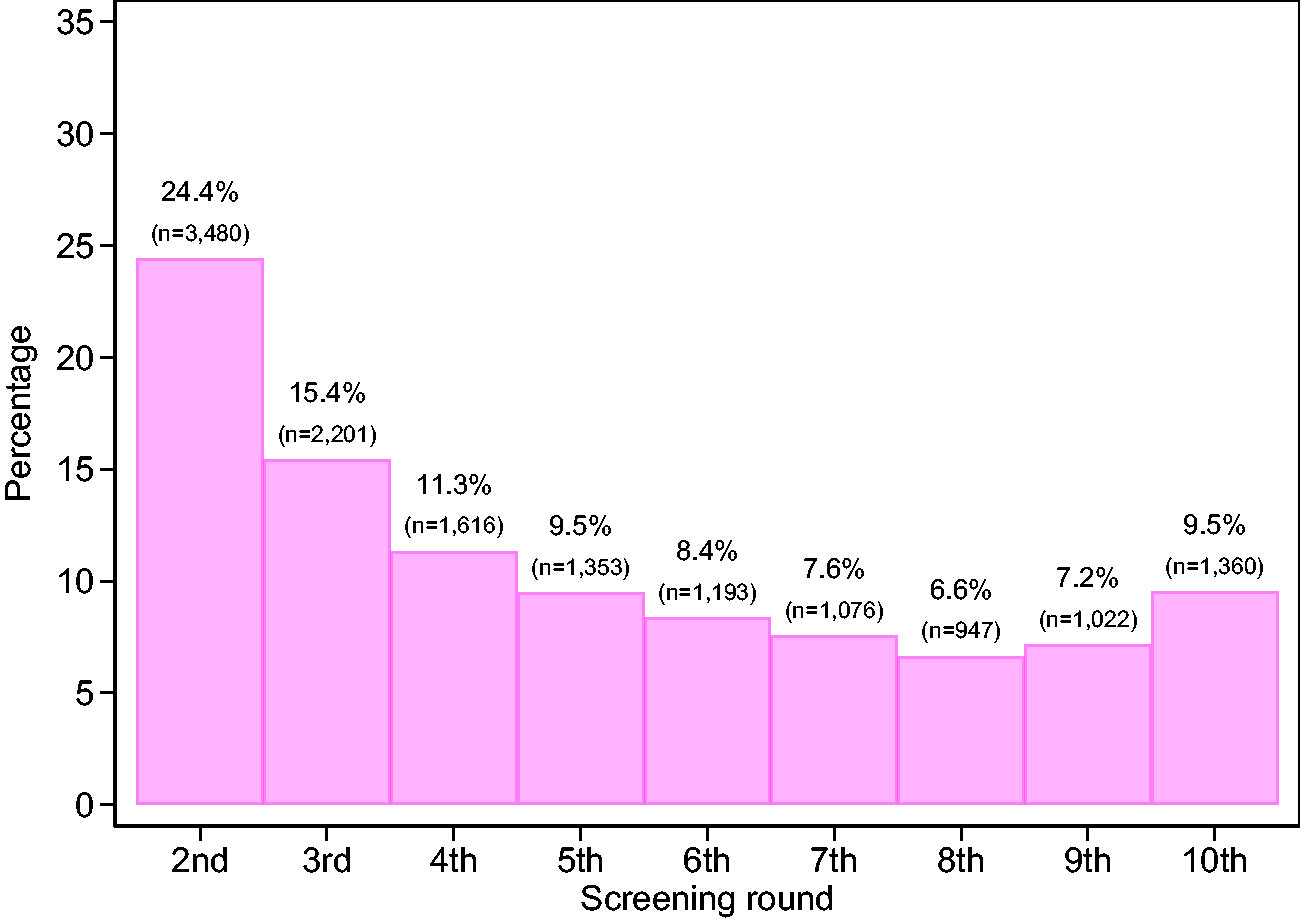
Percentages and frequencies of first drop out according to screening round (2nd–10th) among women who attended following the first screening invitation, 1996–2019.
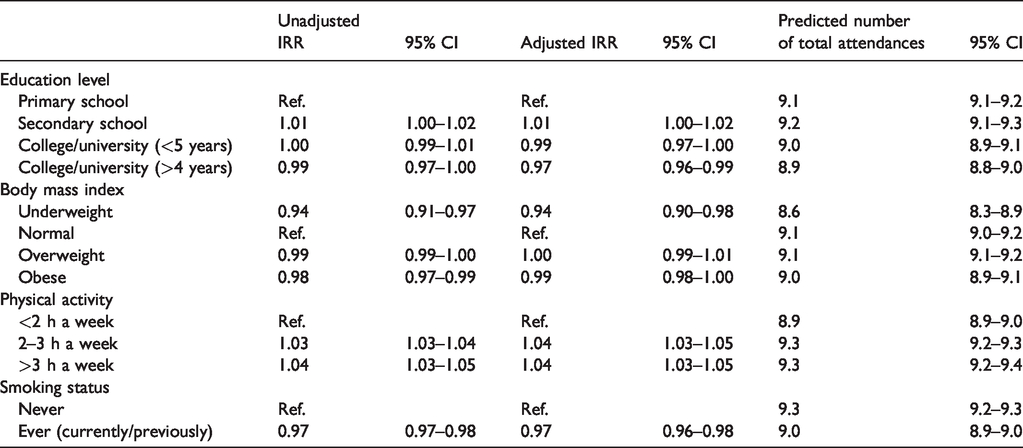
In the adjusted model for study sample 3, education level, BMI, PA and smoking status were associated with the total number of attendances (Table 2). Crude rates are shown in the online Appendix, Table A1. College/university education of >4 years was associated with a lower IRR of attendances (0.97; 95% CI 0.96–0.99) compared to no/primary school education. Further, underweight women had a lower IRR of attendances compared to women with normal BMI (0.94; 95% CI 0.90–0.98). PA for ≥2 h a week was associated with a higher IRR of attendances (1.04; 95% CI 1.03–1.05) compared to PA of <2 h a week. Ever smoking was associated with a lower IRR of attendance (0.97; 95% CI 0.96–0.98) compared to never. However, independent of educational level, BMI, PA and smoking status, predicted number of total attendances was 9 out of 10. These results were similar to the findings from a logistic regression model showing the influence of the same factors on the odds of attendance in response to the 10 consecutive invitations (online Appendix, Table A2). The predicted probability of attending all 10 screening rounds varied between 49% (for underweight women) to 68% (for those being physically active >3 h a week and for non-smokers).
Unadjusted and adjusted incidence rate ratios (IRR) and the predicted number of total attendances with 95% confidence interval (CI) for each level of education, body mass index, physical activity and smoking status, for women who have received 10 invitations in BreastScreen Norway, 1996–2019.
Discussion
In this study, the highest attendance rates were observed among women aged >64 (78.6%), those who received a digital invitation (82.0%) and those having their appointment in late afternoon (78.1%). About half of the women (52.3%) invited to BreastScreen Norway attended in response to all 10 invitations.
As far as we are aware, this is the first study showing that the use of digital invitations was associated with a higher attendance rate as compared to postal invitations, in an organized mammographic screening program. Characteristics of the women, including younger age, the ability to respond promptly, and flexibility for those receiving a digital invitation, might be of influence on the attendance rate. More studies are needed to understand women’s behaviours and preferences with regard to invitation methods, but our results might indicate digital invitations to be the preferred method in screening programs.
Sending a reminder increased the attendance rate by 5% in our study, which is in line with previous research into the effect of reminders on attendance for mammographic screening. 7 Our result of higher attendance in the age group >64 years is also consistent with results from previous studies.17,24 However, age has also been negatively associated with attendance in mammographic screening. 25 The possible impact of time of day for the screening invitation has never been explored in Norway or in other countries. In our study, women most frequently attended their screening appointments when scheduled in the late afternoon (3–6 p.m.), which typically corresponds to the time when people return from work.
Both higher and lower education levels have been reported to be negatively associated with screening attendance.12,24,26 Our results suggest that women with college/university education attend less frequently compared to women with a lower level of education. However, the differences are very small, and the statistical significance could mainly have been achieved due to the large sample size. The lower IRR of attendance among women with college/university education might imply that these women are still working and therefore less flexible to attend at the scheduled invitation time during the day, and may prefer using private mammography services at their convenience. According to the report Cancer in Norway 2018, women with college/university education have higher incidence rates of breast cancer compared to women with a lower level of education. 27 These results coupled with our findings might suggest that women with a college/university education are one of the groups that should be targeted for breast cancer screening.
High BMI has been shown to negatively influence mammographic screening attendance in prior studies.28,29 However, in our study, low BMI was a predictor for a lower IRR of attendance. These findings could be attributed to the experience of pain and discomfort during mammography due to breast compression, as women with smaller breasts experience higher compression pressure,30–32 and are assumed to have lower BMI compared to women with large breasts.10,33–35
Current or previous smoking status was associated with a lower IRR of attendance, which is in line with previous studies,12,26 implying that smoking could be a habit attributable to women less concerned about breast cancer prevention compared to non-smokers, who are possibly more aware of the positive sides of a healthy lifestyle. PA ≥2 h a week was associated with a higher IRR of attendance in the program. The association between screening attendance and PA, and the association of a low level or lack of PA with non-attendance have also been shown in previous studies.12,36,37 PA could be considered one more factor related to a generally healthier lifestyle and therefore attributable to women interested in maintaining good health as well as disease prevention, including breast cancer screening.
Despite the significant differences between the categories of various sociodemographic and lifestyle factors, there were no clear differences in the predicted number of total attendances, which was 9 out of 10 for education level, BMI, PA and smoking status. This might suggest that the results are solely applicable to the situation on the population-based level and could not be replicated in a small sample.
Our study has provided information on mammographic screening attendance associated with screening unit, invitation method, age, time of screening invitation, education level, BMI, PA and smoking status. However, we did not obtain information about several other factors of possible influence, including income, personal attitude, cultural beliefs, place of birth and residence, nationality, false-positive screening results and experience of pain during examination.11,12,36,38,39 Our BMI estimates were highly significant, but there is a possible limitation of sample size, as there were only 511 women in the underweight category (online Appendix, Table A2).
Conclusion
In the population-based mammographic screening program analysed, we found the highest attendance rates to be among women aged >64 , those who received digital invitations and those having appointments in the late afternoon. Education level, BMI, physical activity and smoking did show associations with screening attendance, but the differences between predicted total numbers of attendances for the investigated factors were minor. Our results might indicate digital invitations to be the future strategy for invitation to mammographic screening, and possibly also to other screening programs.
Supplemental Material
sj-pdf-1-msc-10.1177_0969141320932945 - Supplemental material for Factors associated with attendance and attendance patterns in a population-based mammographic screening program
Supplemental material, sj-pdf-1-msc-10.1177_0969141320932945 for Factors associated with attendance and attendance patterns in a population-based mammographic screening program by Marthe Larsen, Nataliia Moshina, Silje Sagstad and Solveig Hofvind in Journal of Medical Screening
Footnotes
Declaration of conflicting interests
The author(s) declared no potential conflicts of interest with respect to the research, authorship, and/or publication of this article.
Funding
The author(s) received no financial support for the research, authorship, and/or publication of this article.
Supplemental material
Supplemental material for this article is available online.
References
Supplementary Material
Please find the following supplemental material available below.
For Open Access articles published under a Creative Commons License, all supplemental material carries the same license as the article it is associated with.
For non-Open Access articles published, all supplemental material carries a non-exclusive license, and permission requests for re-use of supplemental material or any part of supplemental material shall be sent directly to the copyright owner as specified in the copyright notice associated with the article.