
Abstract
Objective
To assess faecal immunochemical test sensitivity for cancer in a very large population-based cohort followed up for six rounds with biennial faecal immunochemical test repetition.
Methods
This study is based on interval colorectal cancers diagnosed in a cohort of subjects aged 50–69 undergoing repeated faecal immunochemical test screening (six rounds) from 2002 to 2015. Test sensitivity was calculated using both the Proportional Interval Cancer Rate and the Interval Cancer Proportion method.
Results
Among 441,647 faecal immunochemical tests (123,347 individuals), 150 interval colorectal cancers were detected after a negative faecal immunochemical test. Interval colorectal cancer incidence rate was 1.87 per 10,000 person-years (95%CI: 1.60–2.20), and it was higher during the second interval year (rate ratio: 1.78; 95%CI: 1.28–2.47), for proximal locations (rate ratio: 3.00; 95%CI: 1.92–4.68), and among 60–71 year old subjects (rate ratio: 2.37; 95%CI: 1.61–3.50). The Proportional Interval Cancer Rate was 13.1%, with an overall faecal immunochemical test sensitivity of 86.9% (95%CI: 84.7–89.0). Sensitivity was lowest at the first round (81.5%; 95%CI: 75.6–86.2), and increased to 91.9% (95%CI: 83.9–96.5) for subsequent rounds. Applying the Interval Cancer Proportion method, sensitivity was 83.9% (95%CI: 81.3–86.2), and it was highest at the first round (89.0%; 95%CI: 85.7–91.6), ranging between 73% and 83.1% at subsequent rounds.
Conclusions
A faecal immunochemical test sensitivity for cancer higher than 80% resulted in a low incidence of interval colorectal cancers, representing an accurate estimate of one of the major limits of screening programmes. Due to intrinsic biases, the Proportional Interval Cancer Rate and the Interval Cancer Proportion methods generated different trends in faecal immunochemical test sensitivity by screening round.
Introduction
The ultimate goal of screening is to reduce disease-specific mortality. Various randomized controlled trials showed that colorectal cancer (CRC) screening programmes based on the faecal occult blood test reduced CRC-related mortality. 1 Organized screening programmes based on the faecal immunochemical test (FIT) have also been associated with CRC incidence and mortality prevention.2,3
The efficacy of FIT is still uncertain because its sensitivity for invasive cancer and advanced adenoma is suboptimal, as reported in several studies comparing the diagnostic accuracy of a single round of FIT with colonoscopy. A recent systematic review for the U.S. Preventive Services Task Force estimated a 22.2–40.3% FIT sensitivity for advanced neoplasia (invasive CRC or advanced adenoma). 4 On the other hand, the efficacy of FIT has been shown to depend on the cumulative sensitivity of repeated tests5–7 rather than a single test. We recently reported that the cumulative incidence of CRC and advanced adenoma after five rounds of biennial FIT was similar to that expected after a primary screening with colonoscopy. 8
The most comprehensive methods for estimating FIT sensitivity for CRC rely on the estimate of interval cancer (IC) incidence – i.e. invasive CRCs detected in patients after a negative test result and before they returned for further routine screening. In particular, the method for calculating the Proportional Interval Cancer Rate (PICR) compares the number of ICs observed with the number expected without screening. 9 Another commonly-used method involves calculating the Interval Cancer Proportion (ICP), i.e. the proportion of ICs out of the total number of cancers detected in a given screened population (ICs plus screen-detected (SD) cancers). Published data are mainly limited to FIT sensitivity at the first round of programmatic screening, while a few studies have reported the cumulative FIT sensitivity after multiple rounds without providing round-specific figures;10–17 the only exceptions are represented by a study based on annual rather than biennial FIT repetition, 18 and a small cohort study from the Netherlands. 19
The aim of the present study was to assess FIT sensitivity for cancer in a very large population-based cohort followed up for six rounds with biennial FIT repetition.
Methods
Setting
The protocol adopted for the screening programmes involved in this study and the cohort of individuals screened were described in a previous paper. 8 Briefly, these colorectal screening programmes are used in the Veneto Region (north-eastern Italy; population 4,915,000), where individuals aged 50–69 are invited to have a FIT every two years. The OC-Hemodia latex agglutination test developed with the OC-Sensor Micro instrument (Eiken, Tokyo, Japan) is used, with a cut-off for test positivity of 20 µg Hb/g faeces. Colonoscopy is recommended for individuals testing positive on the FIT, after which they are referred for surgery, post-colonoscopy surveillance or further rounds of FIT, depending on its outcome.
The Italian legislation identifies Cancer Registries as collectors of personal data for surveillance purposes without explicit individual consent. The approval of a research ethics committee was not required, since this study is a descriptive analysis of individual data without any direct or indirect intervention on patients (Decreto del Presidente del Consiglio dei Ministri, 3 March 2017, Identificazione dei sistemi di sorveglianza e dei registri di mortalità, di tumori e di altre patologie, 17A03142, GU Serie Generale n.109 del 12 May 2017 (Available at: www.gazzettaufficiale.it/eli/id/2017/05/12/17A03142/sg, last accessed 10 October 2018).
Population
We identified the cohort of individuals who had a FIT during the first round of five local screening programmes, starting in 2002–2004. The records of all their subsequent FITs, up until 31 December 2015, were obtained and numbered sequentially for each individual. In order to study the performance of the repeated rounds carried out with the expected frequency, we censored the subjects when they did not comply with any of the invitations after the first screening, and did not take into consideration any eventual subsequent test. The records included the date and result of each FIT, and any colonoscopies performed.
Identification of ICs
As the Veneto Tumour Registry did not cover all the study areas, the protocol described by the Italian Group for Colorectal Screening (GISCoR) 20 was followed to identify all relevant ICs. This protocol relies on the use of hospital discharge records (HDRs) and was used successfully in a previous study. 15 The codes considered to pinpoint HDRs potentially including a diagnosis of CRC are reported in the Appendix 1. 15
The database of regional and extra-regional HDRs concerning the period of interest (2002–2015) was linked with the database of the individuals screened with the FIT to obtain a list of all those individuals who had undergone screening and had been discharged from the hospital with a diagnosis of (or possibly correlated with) CRC within the two years following their FIT.
This list included SD cancers and a list of possible IC cases. Each case in the latter group was checked to confirm the diagnosis (by consulting the pathology databases or hospital charts) and establish the timing (date of diagnosis neither preceding nor later than two years after the date of screening for FIT-negative cases; or less than five years for FIT-positive and colonoscopy-negative cases). Only cases of invasive CRC were included in the study.
Statistical analyses
Person-years at risk were calculated from the date of the negative FIT results immediately preceding the HDR considered. Subjects screened up until 2013 were followed up for two years after each screening episode, while those screened in 2014 and 2015 contributed to the total person-years with the specific person-years of follow-up that they had accumulated by 31 December 2015. ICs detected after a negative colonoscopy or in subjects with a positive FIT result who had refused further assessment were not considered, following the recommended approach to estimate test sensitivity.20,21
IC incidence rates were computed as the number of ICs divided by the person-years at risk, per 10,000. IC incidence rate ratios were estimated by running a Poisson regression according to screening round, time since last FIT, age, gender, anatomical site and stage, which were entered as covariates.
We estimated FIT sensitivity with the PICR method, which compares ICs detected within a given period after a negative test result with the ICs expected in the absence of screening according to the formula

The EIC is calculated by applying the underlying incidence of the cancer in question (in the absence of screening) to the person-years at risk for the sample of screened individuals. We considered the incidence rates of CRC for the years 1999–2002 (the period immediately preceding the start of the screening activity) produced by the Veneto Tumour Registry, covering about 2,300,000 people (49% of the whole resident population of the region). Before screening was introduced, the crude incidence rates for CRC were 84.8 per 100,000 population for males and 65.0 for females, and they increased with age. 22 In the same area, no trend in CRC incidence rates had been reported in the period preceding the screening start. Furthermore, during the study period, no significant trend was observed in the class aged 40–49. Therefore, we are confident that only minimal, if any, trend in the risk of CRC has taken place during the study period in the target population. We calculated the five-year age- and gender-specific incidence rates and applied them to the person-years distribution of the FIT-negative individuals. We then estimated the sensitivity of the test overall and for each FIT round stratified by gender, age, time since last negative FIT result (in the first or second year of the interval between tests), anatomical site and Pathological Tumor-Node-Metastasis (pTNM) stage at diagnosis; 95% confidence intervals (CIs) were calculated by applying the Byar’s approximation for Standardized Mortality Ratios confidence intervals.20,23
Since incidence rates by anatomical site or stage at diagnosis were unavailable for the years 1999–2002, the site- and stage-specific EIC was calculated by applying the age- and gender-specific site and stage distribution of cases diagnosed before the screening programmes started (obtained from an archive of 6710 CRCs considered in an Italian multicentre study 24 ) to the overall incidence rates for 1999–2002.
Sensitivity estimates were also produced using the ICP method, computed as the complement to one of the proportion of ICs out of the total number of cancers detected in a given screened population (ICs plus SD cancers) for each FIT round. CIs for proportions were calculated using the score with continuity correction. 25 In order to compare the two sensitivity trends by screening round obtained with the PICR and ICP methods, we first performed a joinpoint regression through the Joinpoint system and then evaluated whether the two joinpoint regression functions were identical or parallel by running the pairwise comparison test. 26
The SAS, version 9.4 (SAS Institute, Cary, NC) was used for all the statistical analyses.
Results
Between 2002 and 2014, a cohort of 123,347 individuals (47.7% males; mean age 59.1 at first test) underwent 441,647 screening tests: 123,347 were first tests, and 318,300 were subsequent tests (Table 1). Detailed data on the study cohort have been published in a previous paper. 8
Main data and process indicators of the study cohort, overall and by screening round.
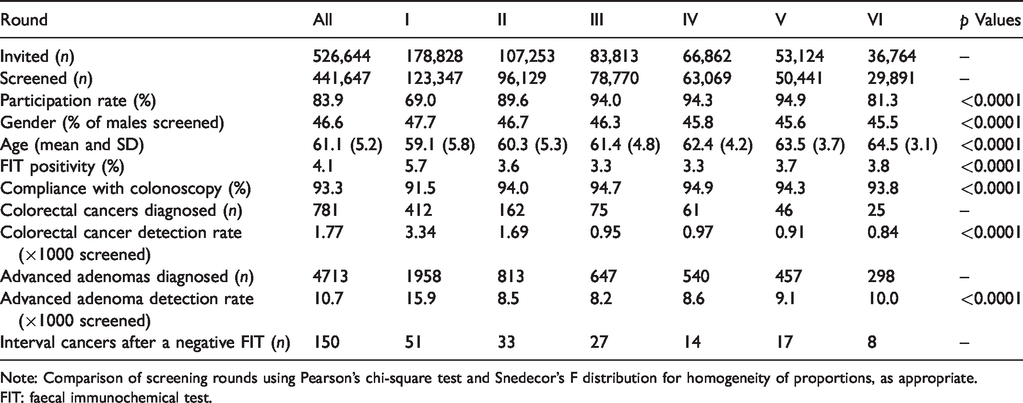
Note: Comparison of screening rounds using Pearson’s chi-square test and Snedecor’s F distribution for homogeneity of proportions, as appropriate.
FIT: faecal immunochemical test.
A total of 781 CRCs were detected at screening, with an overall detection rate of 1.77 per 1000 individuals screened. The pTNM stage of the SD-CRCs was I in 56%, II in 15.7% and III or IV in 19.2% of cases, respectively (the pTNM stage was not recorded for 9.1% cases).
Characteristics of ICs
Overall, 150 ICs were diagnosed within two years after a negative FIT result (Table 2). The IC was located in the proximal colon in 52% of cases, in the distal colon in 17.3% and in the rectum in 23.3%. Twenty-five percent of all ICs were diagnosed in stage I, 16.7% in stage II, 28% in stage III and 20.7% in stage IV.
Characteristics of interval cancers diagnosed after a negative FIT.
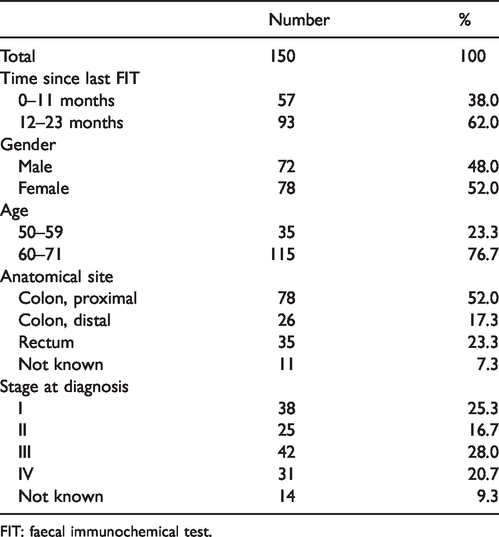
FIT: faecal immunochemical test.
IC incidence rates
Over five FIT screening rounds, the overall incidence rate of ICs detected within two years after a negative FIT result was 1.87 per 10,000 person-years (95%CI: 1.60–2.20) (Table 3). The incidence rate of IC after the first FIT was 2.23 per 10,000 and the adjusted rate ratios for all subsequent rounds were lower than that for the first. One IC was detected for every 2674 FIT-negative results (range in different rounds 1909–4238). The incidence rate was significantly higher during the second year of the interval, and among individuals aged 60–71; it was similar in the distal colon and rectum, and three-fold higher in the proximal colon, while no significant differences emerged according to gender and pTNM stages at diagnosis.
Crude incidence rates of interval cancer (× 10,000), with 95% confidence intervals (95%CI), and adjusted a rate ratios based on multivariable analysis.
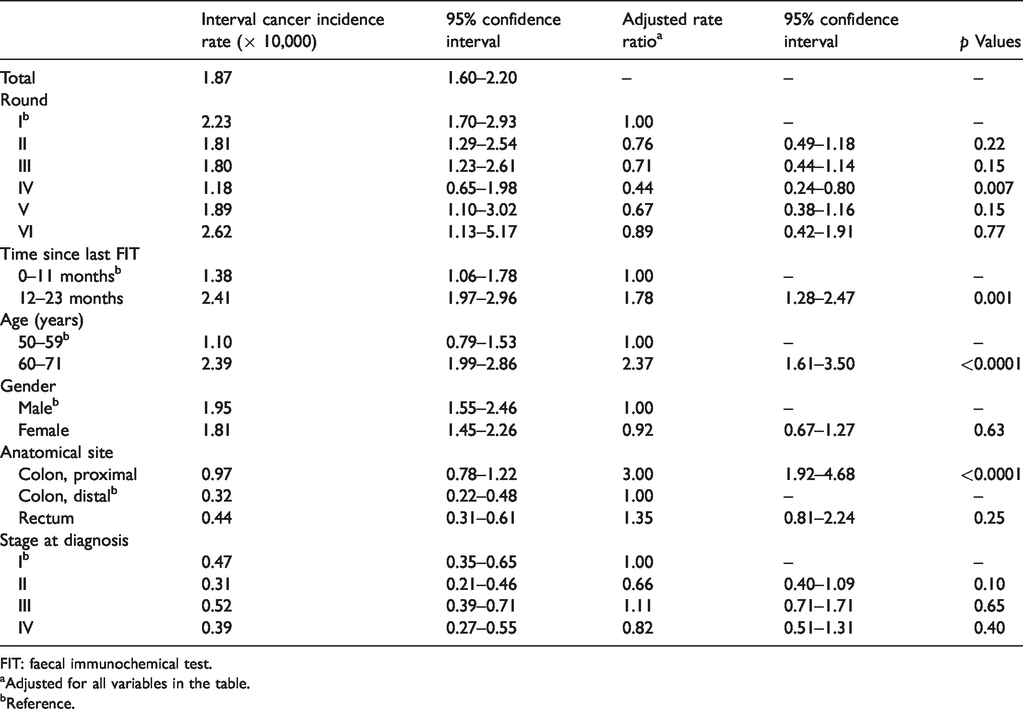
FIT: faecal immunochemical test.
aAdjusted for all variables in the table.
bReference.
Sensitivity estimates using the PICR method
FIT sensitivity was estimated on 414,503 person-years of follow-up in the first year of the interval between two consecutive tests, and on 385,511 in the second year (Table 3). There were 57 ICs (38%) identified in the first year, and 93 (62%) in the second. The corresponding number of expected cancers in the two years was 570 and 524, respectively, with a proportional incidence of 10% and 17.7% in the first and second years of the interval between tests, and a test sensitivity over the two-year interval of 86.3% (95%CI: 83.9–88.4).
For individuals taking their first screening test, FIT sensitivity was 81.5% (95%CI: 75.6–86.2), and it ranged from 84.6–92.1% in subsequent rounds (test for trend p = 0.021) (Figure 1).
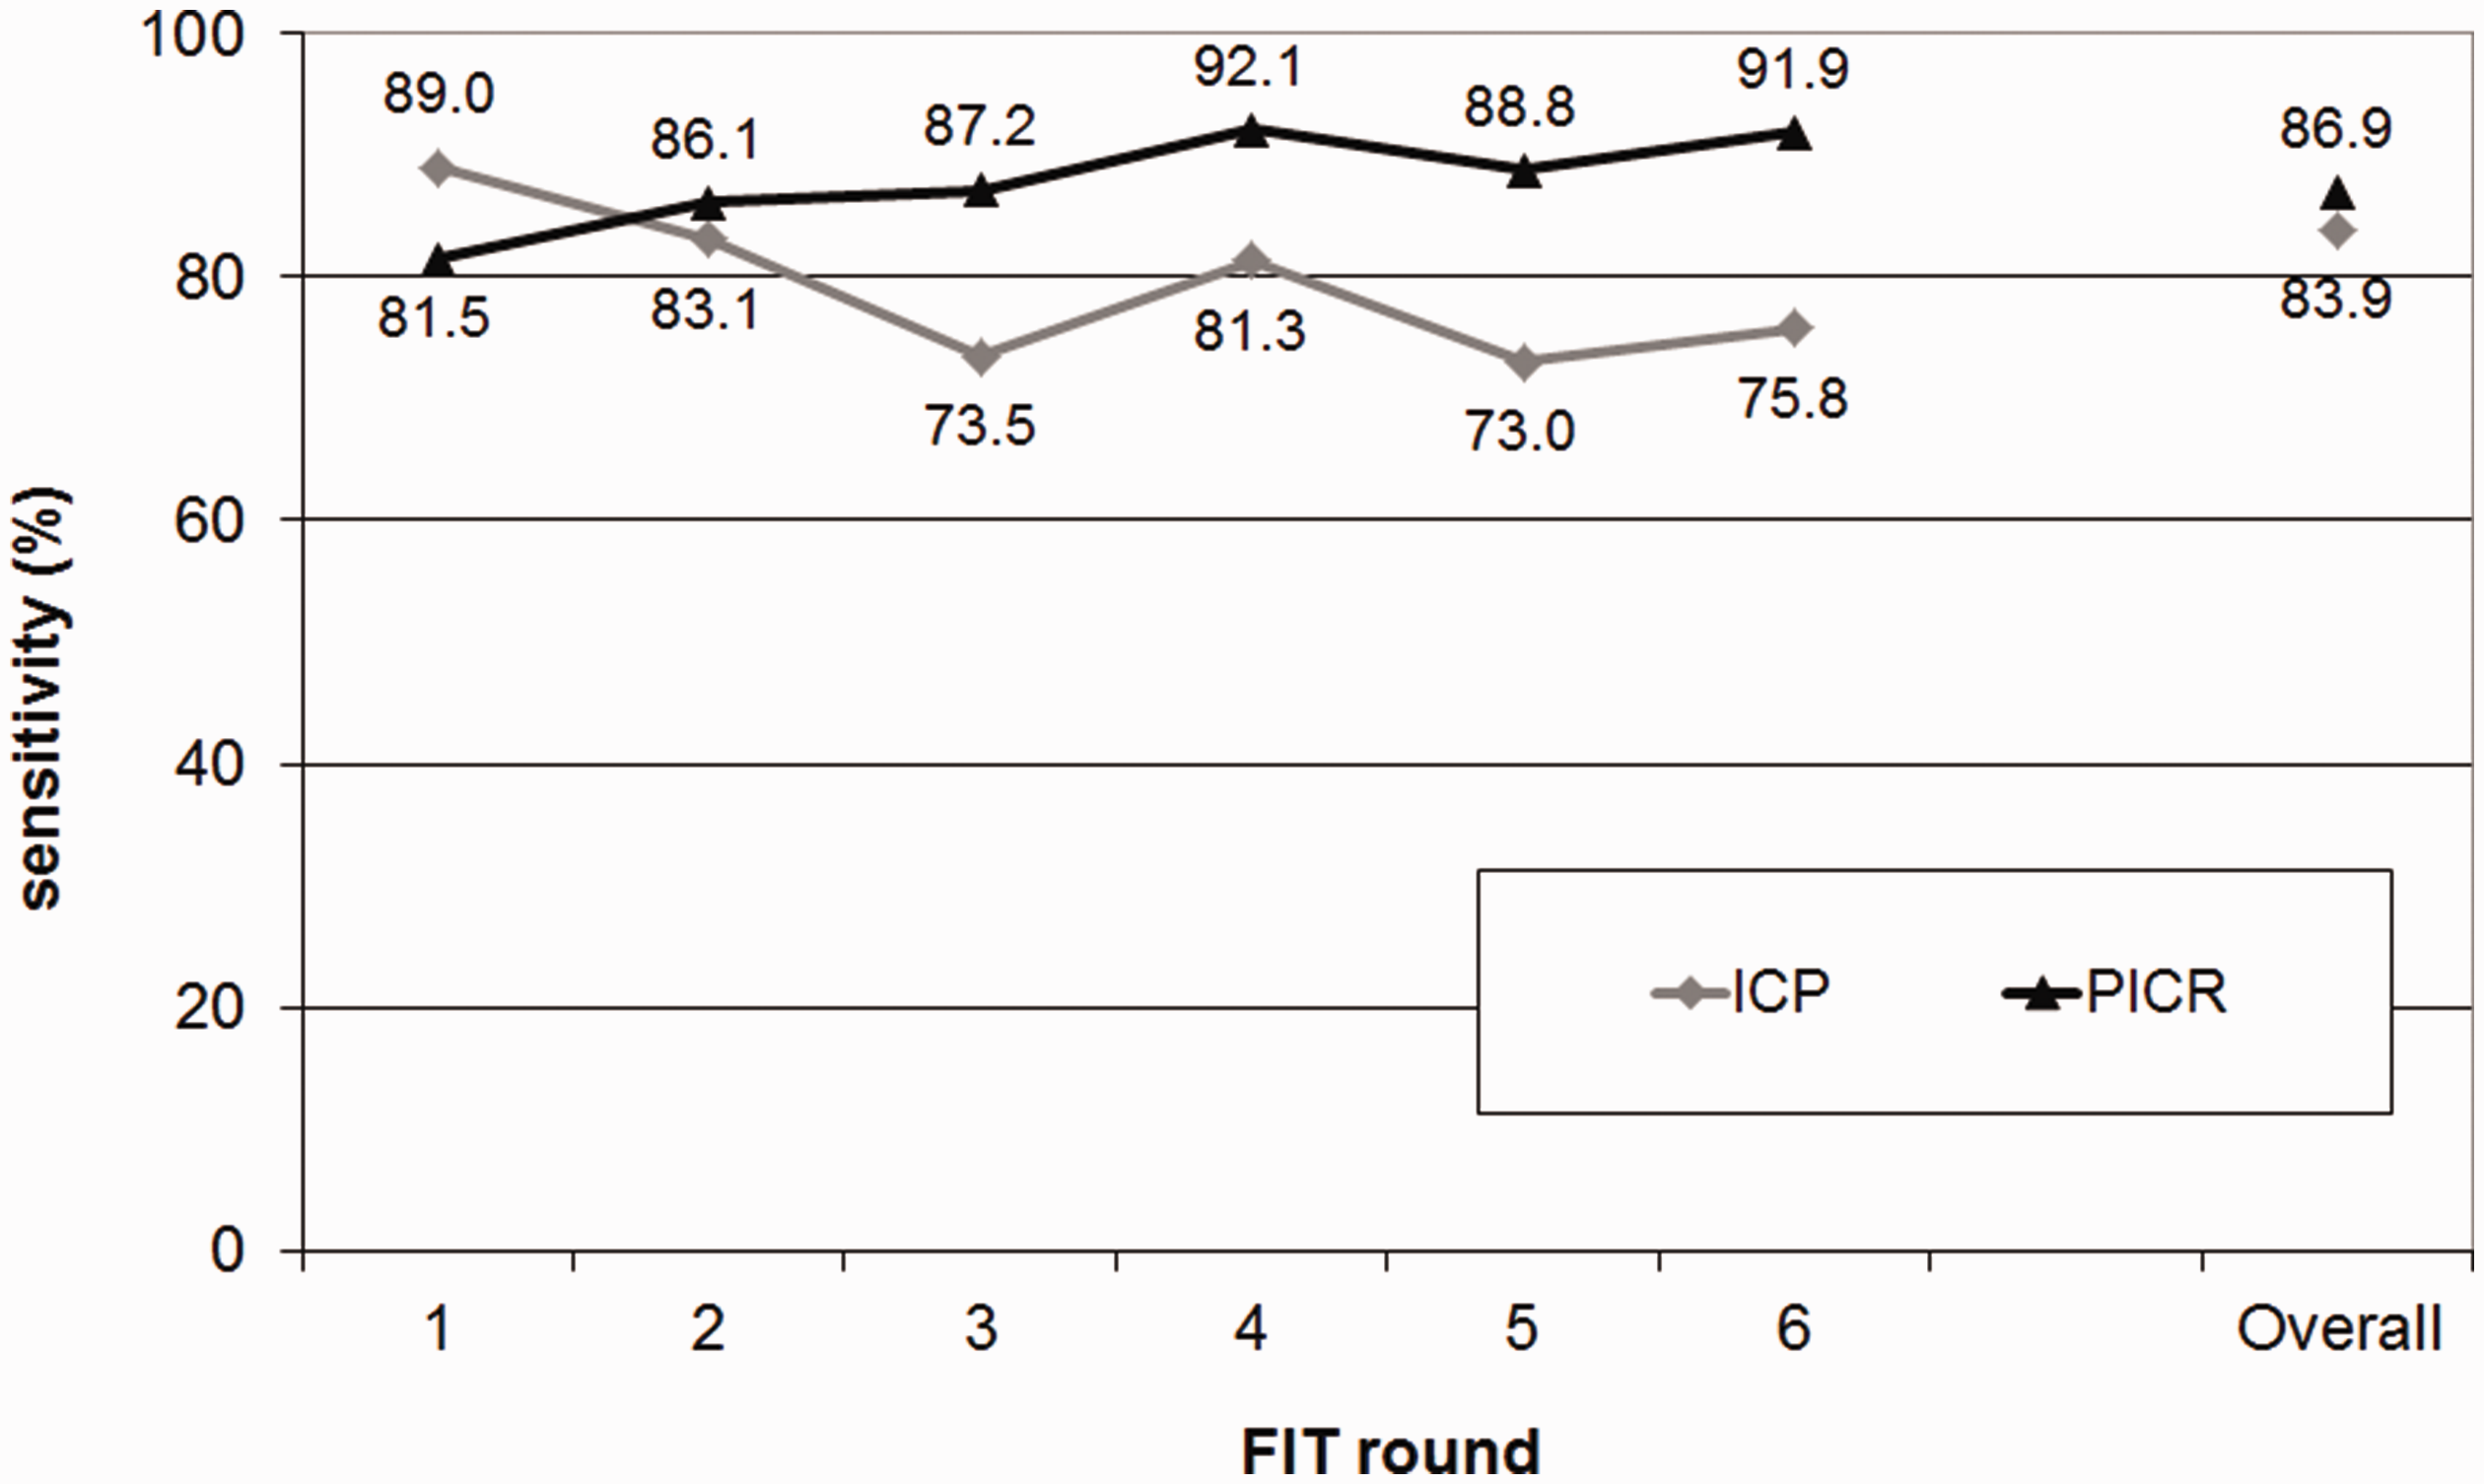
Sensitivity of screening (with 95% confidence intervals) by FIT round and overall, according to the Proportional Interval Cancer Rate (PICR) and the Interval Cancer Proportion (ICP) methods.
Overall, FIT sensitivity was significantly higher for males (89.1%; 95%CI: 86.3–91.5) compared to females (81.9%; 95%CI: 77.5–85.7), while no significant age-related differences in sensitivity were observed.
FIT sensitivity was highest for the distal colon (94.0%; 95%CI: 91.1–96.1), intermediate for the rectum (90.1%; 95%CI: 86.3–93.1) and significantly lower for the proximal colon (74.8%; 95%CI: 68.5–80.1).
As for pTNM stage at diagnosis, there was no significant trend in the test’s sensitivity by stage, the highest sensitivity coinciding with stage II (91.9% overall; 95%CI: 88.0–94.8) and the lowest with stage I (81.1%; 95%CI: 74.1–86.6).
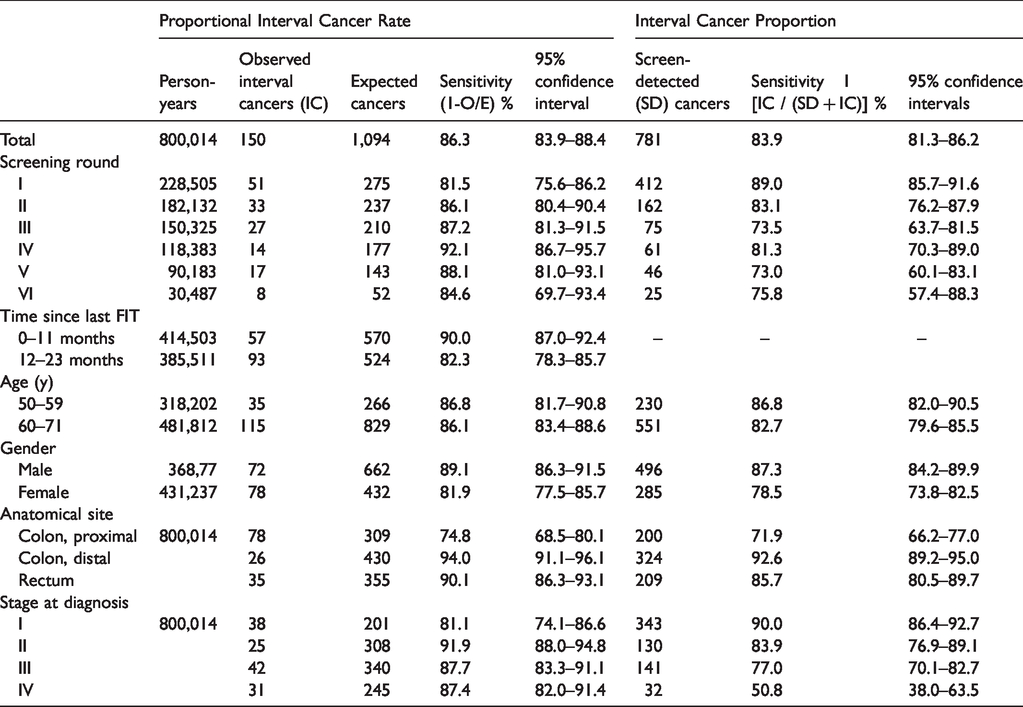
Table 4 provides supplementary information about the test’s sensitivity by sex, age, anatomical site and stage of the ICs at diagnosis, by screening round, as estimated with the PICR and ICP methods.
Estimates of test sensitivity (with 95% confidence intervals) according to the Proportional Interval Cancer Rate and the Interval Cancer Proportion methods, overall and by screening round, time since last FIT, age, gender, anatomical site and pTNM stage at diagnosis.
Sensitivity estimates according to the ICP method
Overall, 781 cancers were SD, and 150 ICs were diagnosed during the follow-up of FIT-negative individuals during the study period. The overall test sensitivity was therefore 83.9% (95%CI: 81.3–86.2) {1 – [150/(781 + 150)]} × 100 (Table 3).
Sensitivity was highest at the first round (89.0%; 95%CI: 85.7–91.6), while at subsequent rounds, it ranged from 73–83.1% (test for trend p <0.0001) (Figure 1).
Overall, FIT sensitivity was higher for males (87.3%; 95%CI: 84.2–89.9) than for females (78.5%; 95%CI: 73.8–82.5). It was slightly higher for people aged 50–59 (86.8%; 95%CI: 82.0–90.5) than for those aged 60–69 (82.7%; 95%CI: 79.6–85.5).
As concerns anatomical site, the ICP method confirmed a higher sensitivity of the FIT in detecting distal CRC (92.6%; 95%CI: 89.2–95.0) as compared with rectal (85.7%; 95%CI: 80.5–89.7) or proximal CRC (71.9%; 95%CI: 66.2–77.0).
In terms of pTNM stage at diagnosis, a significant trend was observed in the test’s sensitivity (p < 0.0001) that was 90.0% for stage I (95%CI: 86.4–92.7), 83.9% for stage II (95%CI: 76.9–89.1), 77.0% for stage III (95%CI: 70.1–82.7) and only 50.8% for stage IV (95%CI: 38.0–63.5).
According to the pairwise comparison test, the trend of FIT sensitivity by round obtained with the ICP method differed significantly from the one deriving from the PICR method (p = 0.04).
Discussion
In a very large population-based cohort of individuals repeatedly screened with FIT for CRC, the test sensitivity for invasive CRC was 86.3% according to the PICR method, corresponding to a long-term incidence of IC of 1.87 per 10,000 FIT-negative person-years. FIT was more sensitive in males and for lesions located in the distal colon and rectum, confirming previous reports of its worse performance in the proximal colon. In our study, this was reflected in a three-fold higher incidence rate of IC in the proximal colon than in the distal colon, which may also be related to right-side CRC shifting in older people. The worse performance of FIT in the proximal colon may be related with its well-known lower accuracy for proximal neoplasia,27–31 irrespective of the differences among various FIT brands, 32 and to the suboptimal FIT sensitivity for sessile serrated adenomas that have been associated with a greater risk of proximal CRC. 33 On the other hand, we found no significant difference in FIT sensitivity by age, despite the approximately two-fold higher incidence rate of IC in individuals aged ≥60. Sensitivity was lowest at the first round of FIT (81.5%) and improved significantly, exceeding 90% in subsequent rounds.
When we estimated FIT sensitivity with the ICP method, we generally obtained values 2–4% points lower than with the PICR. Unlike the PICR estimates, the ICP method also suggested a decline in FIT sensitivity from the first to the third or subsequent rounds. The two methods also generated divergent stage-specific sensitivity estimates, particularly for advanced-stage CRCs. However, sensitivity estimates by stage are prone to bias, as ICs are likely to be at a more advanced stage than when they were actually missed by FIT. Therefore, an IC at advanced stage could have been missed at stage I and II cancer. Such bias affects in particular the ICP method (and it likely explains the very low sensitivity reported for stage IV CRCs), which should not be used to produce stage-specific estimates, while the estimates deriving from the PICR method can be safely interpreted as the comparison between the observed and expected stage-specific incidence rates, but not in terms of FIT’s stage-specific sensitivity.
Since both sensitivity methods produce changing estimates at different FIT rounds, any comparison with previous sensitivity estimates based on a single or few FITs is limited. Notwithstanding, it is worth highlighting how our results are in line with studies that analysed programmes based on the same FIT positivity cut-off as ours: for example, a meta-analysis by Lee et al. reported a sensitivity of 89% (95%CI: 80–95%) at a cut-off value less than 20 µg/g. 34 Of note, Jensen et al. assessed FIT sensitivity through ICP over four rounds of annual screening and reported an overall sensitivity of 80.4%, higher in round 1 (84.5%) than in subsequent rounds (73.4–78.0%). 17
Our analysis of a cohort of repeatedly-screened individuals showed differences in the sensitivity estimated with the two methods due to relevant but different limitations. The PICR method is inadequate if the detection and removal of precancerous lesions reduces the CRC incidence rates in the screened population. The consequent reduction of ICs will prompt an underestimation of the proportional incidence of ICs at subsequent rounds, and hence an overestimation of the screening test sensitivity. The main biases of the ICP method are overdiagnosis and diagnostic anticipation. 9 Overdiagnosis in subjects aged < 70 seems to be fairly marginal, while diagnostic anticipation is likely to affect sensitivity estimates more severely. The excessive CRC detection rate at the first round prompts an overestimation of sensitivity, while the reduction in SD-CRCs at subsequent rounds will lower the ICP, which could be misinterpreted as a decline in sensitivity.
To avoid the limitations of the PICR and ICP methods, we shifted our attention from assessing the test sensitivity to the new concept of IC risk, defined as the absolute incidence rate of IC. This indicator overcomes the drawback of the PICR because it combines the test sensitivity and the reduction in CRC incidence among the screenees into a single parameter: the higher the test sensitivity and the reduction in CRC incidence, the lower the IC incidence rate. In addition, this approach does not depend on the number of SD-CRCs, so it also overcomes the limitation of the ICP methodology.
In our study, the risk of IC was 1.87 per 10,000 person-years, indicating that approximately 2700 negative FIT results were needed to detect one IC during the two-year interval between subsequent screening tests. The IC incidence rate may be useful when preparing material to support informed decision-making as it describes one of the main limits of screening, i.e. false-negative results. Figure 2 shows the major events that may be expected by 10,000 individuals who attend screening. 8
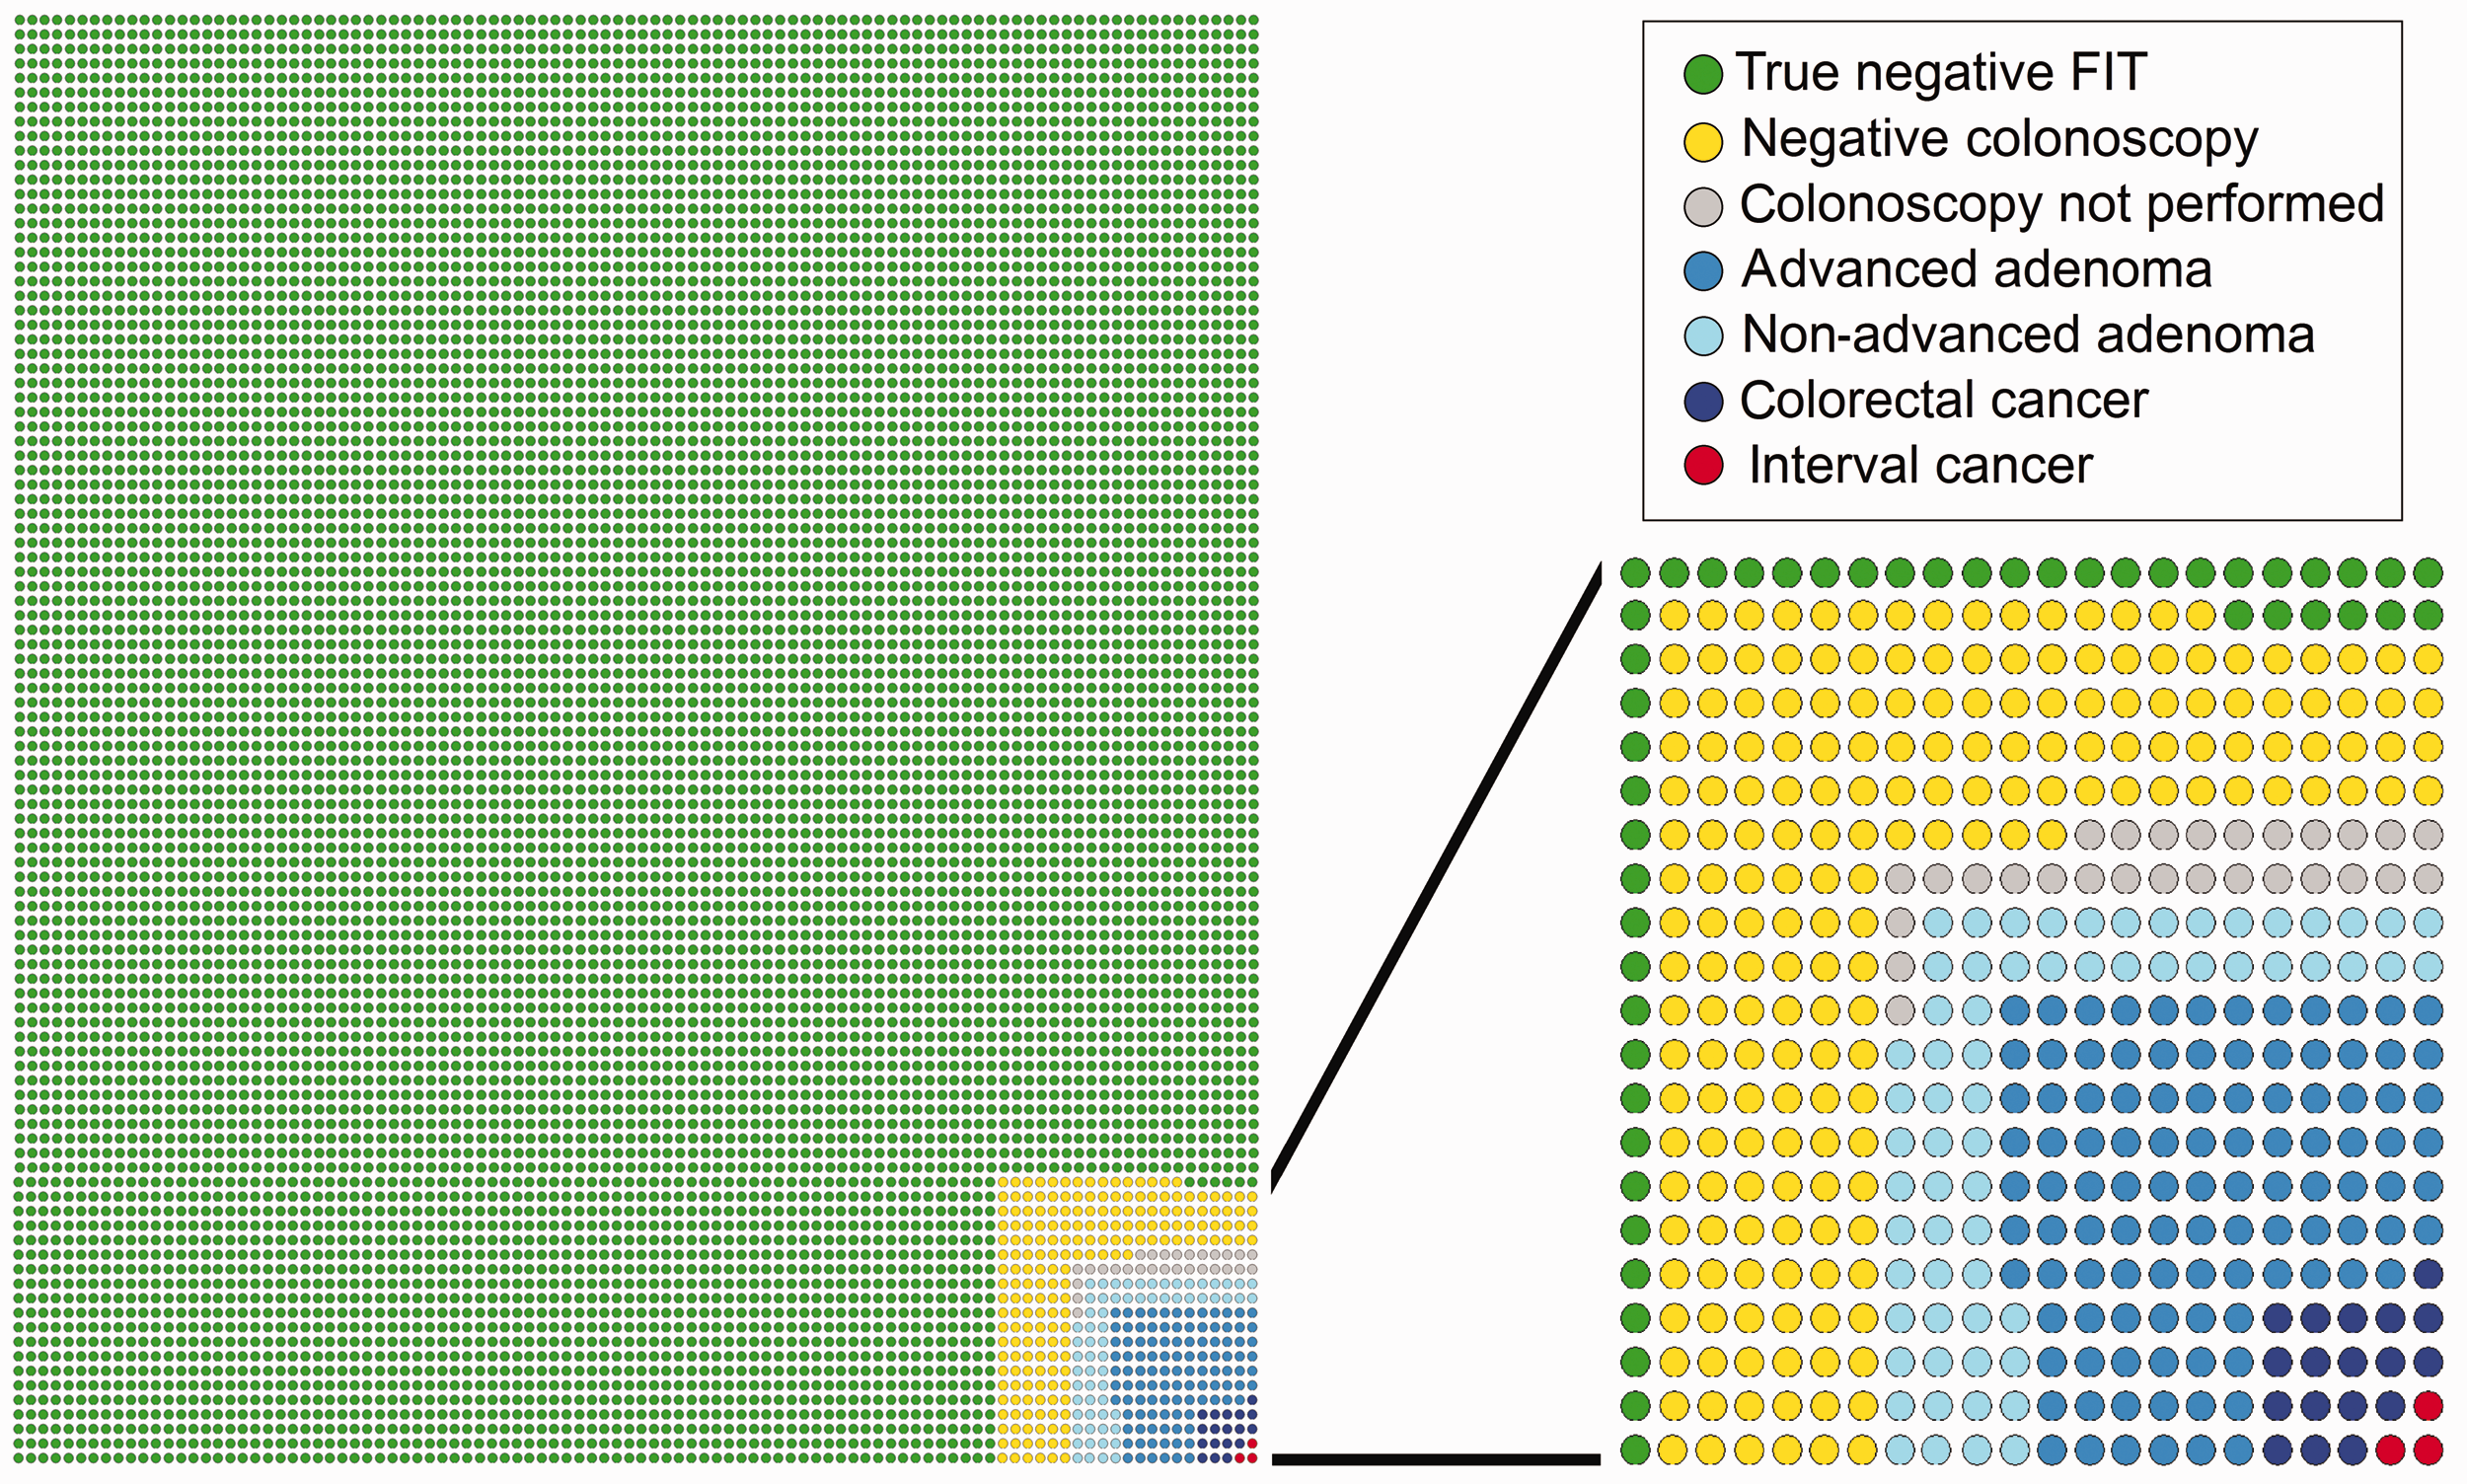
Observed number of events in 10,000 individuals screened, according to study results.
From a theoretical point of view, the sensitivity of a test for a disease is expected to be a fixed parameter. In fact, sensitivity is influenced by the so-called ‘spectrum of disease’. At screening, we estimate overall FIT sensitivity for CRC, but our estimates deal mainly with the sensitivity for bleeding CRCs, whose proportion decreases over the screening rounds. Therefore, overall sensitivity is expected to decrease at subsequent rounds, even if sensitivity for bleeding lesion may remain the same. This is the pattern that we observed according to the ICP method, which should probably be the first choice method for estimating the FIT sensitivity at later screens. Unfortunately, the ICP method overestimates sensitivity at the first round, where the PICR method should be used instead, since it is not (yet) affected by the decrease of CRC (and IC) rates determined by the removal of advanced adenomas. Extreme caution is needed in the use of the two traditional methods for estimating the FIT sensitivity to long-lasting screening programmes and ideally new estimation tools are required. A first answer may come from the use of IC incidence rate, which also provides important information to be communicated to the target population.
This study has several limitations. First, estimates derived with either method are approximating test sensitivity, as new incident cancers, developing after the screening test and surfacing clinically before the next screen may contribute to the observed incidence after a negative FIT and some missed cancers might still be asymptomatic by the time of the next screen. However, these cases likely represent a small proportion of cancers detected in the two-year interval adopted for FIT screening.
A second limitation concerns the HDR-based approach that we used, because it could implicate the loss of some ICs. Such an approach had been validated in a previous study, as it showed a sensitivity for CRCs of 98.6%. 15 A further limitation of methods estimating test sensitivity based on the incidence, or the proportion, of ICs is related to the uncertainty about the cancer sojourn time. As a consequence, the gap of sensitivity that we observed between the PICR and ICP methods could be even larger. 35 Finally, we censored all individuals when they did not comply with any invitations after the first screening. Therefore, the study results can only be applied to an ideal cohort of regular compliers; they cannot be used to describe the actual sensitiveness of the screening programme under study.
In conclusion, a very high FIT sensitivity for CRC emerged after six rounds in our study population, which resulted in a very low risk of IC.
Footnotes
Authors’ contribution
MZ and CH: study concept and design, interpretation of data and drafting of the manuscript. CS and AR: interpretation of data. GC: statistical analysis and interpretation of data. EN, AT and AM: acquisition of data. SR, EC and SZ: technical material support. MR: study supervision and interpretation of data. All authors: critical revision of the article for important intellectual content and final approval of the manuscript.
Declaration of conflicting interests
The author(s) declared no potential conflicts of interest with respect to the research, authorship, and/or publication of this article.
Funding
The author(s) received no financial support for the research, authorship, and/or publication of this article.
Appendix 1
Codes used to identify hospital admissions with a possible diagnosis of colorectal carcinoma.