
Abstract
Objective
To maximize benefits and reduce potential harms of organized cancer screening programs in Europe, monitoring, quality assurance, and evaluation of long-term impact are required. We aimed to identify the most important indicators to be collected and reported. The study was designed to establish a consensus within a European-level working group and suggest a manageable list of key indicators.
Methods
We conducted a Delphi study among policymakers, researchers, and program coordinators who were experts in breast, cervical, or colorectal cancer screening. Study participants evaluated the importance of screening indicators on a 5-point Likert scale.
Results
The top 10 indicators by study participants were interval cancer rate, detection rate, screening attendance, screening coverage, cancer incidence, cause-specific mortality, proportion of persons attending further assessment after a positive screen test result, proportion of persons attending a treatment after diagnosis, invitation coverage, and distribution of cancers by mode of detection. Performance indicators were generally considered more important than outcome indicators. Subgroup analyses by cancer types showed similar results, and only cervical cancer screening experts had slightly different preferences. Subgroup analyses by experts’ roles indicated that policymakers found different indicators important compared with researchers or program coordinators, probably because of their different point of view on screening.
Conclusion
The implication of our priority ranking is twofold: it serves as an initial guidance for countries that have not yet established a system to collect data, and as a checklist for those where data collection is already established, to assess the comprehensiveness of their system.
Keywords
The Council of the European Union (EU) recommended in 2003 that screening for breast, cervical, and colorectal cancer should take place only in a form of organized, population-based programs. It also specified the fundamental principles of early detection of cancer and presented a shared commitment by Member States to implement organized screening programs. 1 The 4th Edition of the European Code against Cancer states that organized screening programs are preferred to opportunistic screening, as these provide better conditions for quality assurance to achieve the greatest benefit with the least harm. 2 However, there is still a need for better monitoring, quality assurance, and evaluation of the long-term impact of organized cancer screening in Europe.3–5 Quality assurance and continuous evaluation are among the key principles of implementing screening programs, 6 and the programs’ effectiveness is highly dependent on these procedures. 7 A study conducted among European countries showed that these activities are carried out to different and nonstandardized extents, which make it difficult to compare long-term effects of screening programs. 8
There have been several attempts to provide guidance on collecting data for quality assurance and monitoring of screening programs. Indicators on quality and performance have already been defined by the European quality assurance guidelines for breast, cervical, and colorectal cancer.9–13 These provide an overview of the fundamental points and principles that supports quality assurance and identifies performance indicators to be collected. The 2017 second report on Cancer Screening in the EU aimed to provide the most up-to-date information on the implementation of Council recommendations, with over 80 experts from EU member states providing data on implementation status and performance indicators for breast, cervical, and colorectal cancer screening. 14 Similarly to the first report on Cancer Screening in the EU, 15 it also provided justification for initiatives, at European level and in the member states, to expand and improve implementation of population-based programs. It also revealed that the data collection for more complex performance indicators was limited in several countries, due to the lack of continuous and systematic evaluation in place. Several other EU initiatives also generated knowledge and evidence for measuring and evaluating the performance of screening programs, for example EUROCOURSE, 16 EUNICE, 17 and EUROSCREEN. 18
These previous initiatives recommend the collection of many indicators, including more complex indicators for monitoring quality and performance. However, some countries, with less tradition or experience in screening, and with fewer resources or without up-to-date registries, are unlikely to collect all indicators. This makes European-level comparison on the effect of different programs more challenging. A list of key indicators, relatively short and developed by a consensus among European experts, is needed. This study aimed to identify the most important indicators to collect for measuring the impact of organized screening programs. We also investigated the key indicators across different cancer types and took into account different roles of experts in the screening programs.
This study was conducted within the EU-TOPIA (Towards improved screening for breast, cervical and colorectal cancer in all of Europe) H2020 project, which aims to systematically evaluate and quantify the harms and benefits of screening programs for breast, cervical, and colorectal cancer in all European countries (http://eu-topia.org/about-eu-topia/about-eu-topia/). It also intends to build capacity for future self‐evaluation of screening programs in Europe, for which providing a list of key indicators is important.
Methods
We developed a set of key indicators to monitor the effects of screening programs in a Delphi study, with the involvement of screening experts from Europe who participated at the EU-TOPIA workshop about screening indicators in September 2017 in Budapest, Hungary (http://eu-topia.org/workshops/workshop-1-monitoring/). Participants were researchers, screening program coordinators, or policymakers related to breast, cervical, or colorectal cancer screening programs. Experts were asked to specify their role(s) in the screening program and the cancer site(s) of their expertise. All participants were allowed to select more than one role and more than one cancer site. The Delphi process was carried out according to the steps described in Jones and Hunter 19 and Hsu 20 with the adaptations detailed below.
The current study consisted of three consecutive rounds. Round 1 was a preparatory phase, in which a literature review was carried out to identify an extensive pool of indicators for evaluating organized cancer screening programs (EU-TOPIA Deliverable 2.2—Definition of indicators (http://eu-topia.org/downloads/)). In Delphi studies it is both an acceptable and a common modification to use a structured questionnaire, which is based on a literature review in Round 1. 20 Based on the review, 27 indicators that can be used to estimate the long-term effectiveness of cancer screening programs were defined for this study (Table 1). In Round 2, a 27-item online questionnaire was sent to EU-TOPIA workshop participants in advance. Participants were asked to individually evaluate the importance of each listed indicator on a 5-point Likert scale. The following values were attributed to the scale: strongly disagree: −2; disagree: −1; neutral: 0; agree: 1; strongly agree: 2. Round 2 was completed in August–September 2017. After the data collection, a summary of Round 2 was sent to participants, showing aggregated results for each indicator presented on a bar chart showing the frequency of each option on the scale. In Round 3, results of Round 2 were presented at the EU-TOPIA workshop and discussed by a roundtable panel, which gave all study participants in the audience an opportunity to refine their opinion before the final voting round. A mobile phone application was used for voting at the workshop. Participants were also asked whether they filled in the online survey in Round 2. It was therefore possible to analyze a subgroup of Round 3 answers among those who participated in both rounds.
Mean scores and consensus values for Round 2 and Round 3.
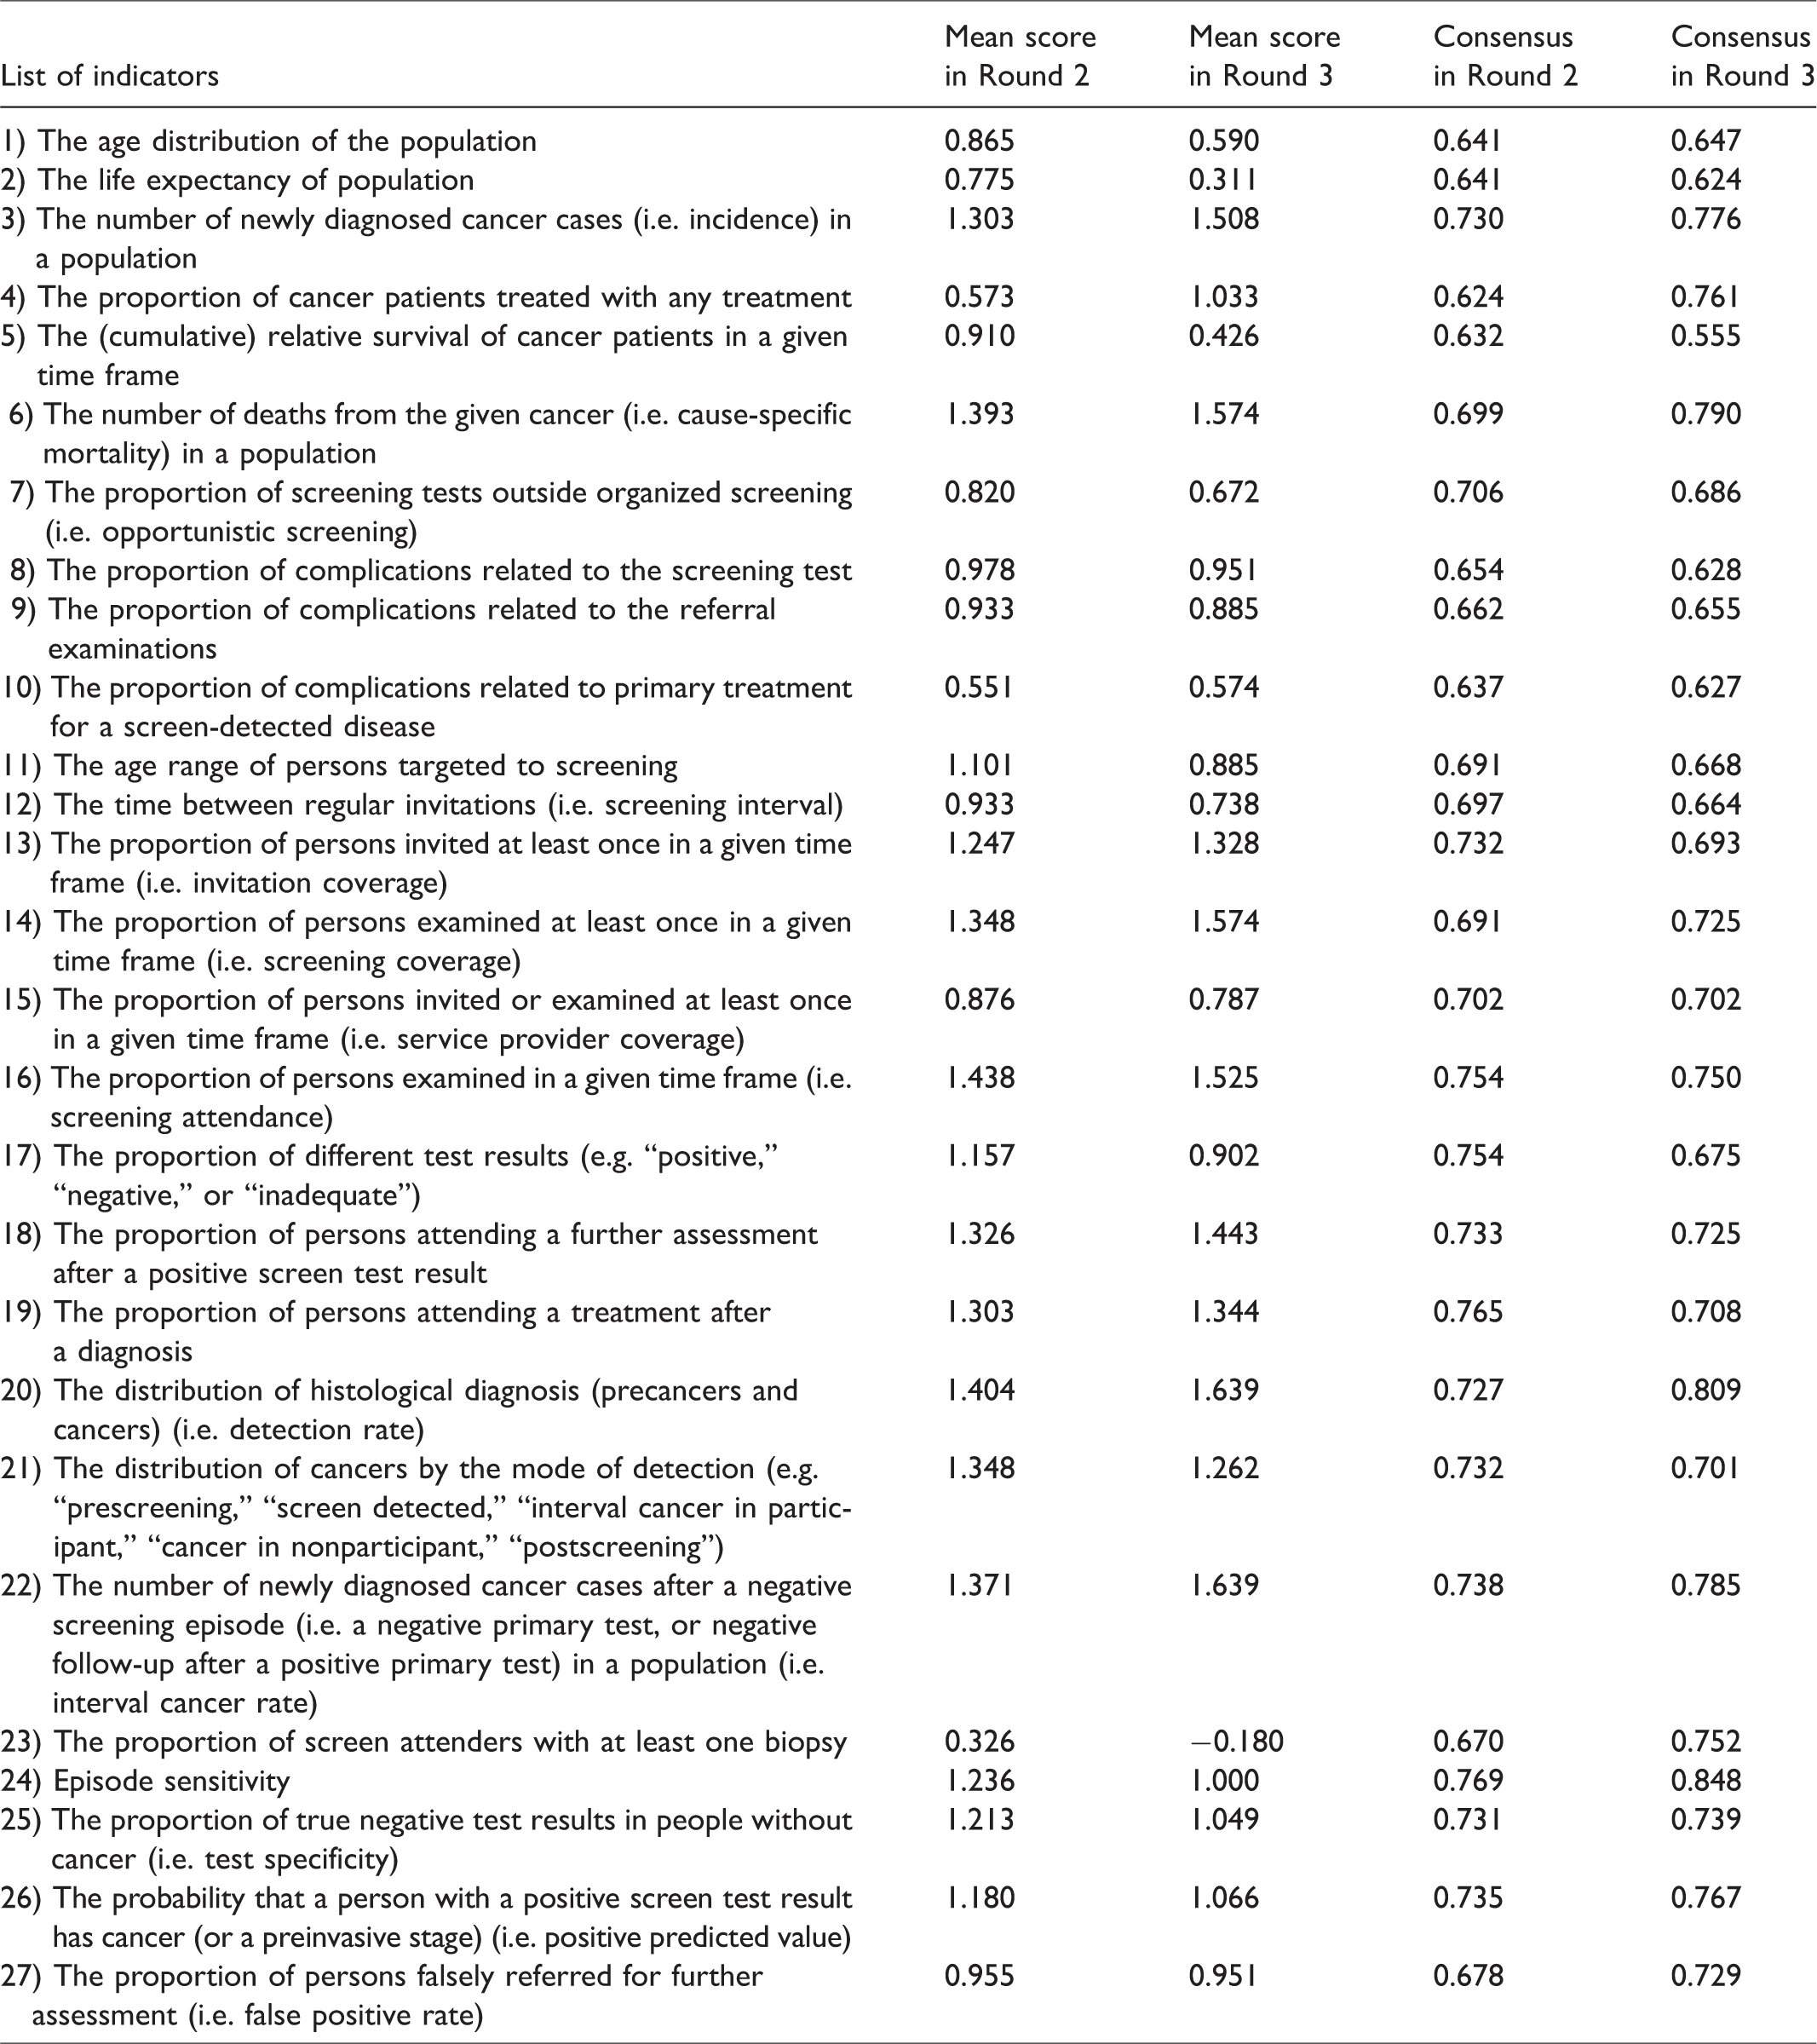
To develop the priority list, indicators were ranked according to the mean value of survey answers. Indicators that many participants strongly supported had high mean value, because of the abovementioned coding of answers. The symmetrical values on the scale ensured that “strongly disagree” had the same negative weight as “strongly agree” had positive weight. This also holds for the categories of “disagree” and “agree.” To characterize the level of consensus related to each indicator, a previously published consensus measurement was used.21,22 This measure is typically applied to the Likert scale to determine degrees of agreement among ordinal-ranked categories. The value of consensus ranged from 0 to 1, the latter meaning perfect consensus. If two indicators had the same mean value, then the one with larger consensus measure score was ranked higher on the list. In the current study, the top 10 indicators from the full list are considered as key indicators.
Results
In total, 143 and 73 respondents filled in the survey in Round 2 and Round 3, respectively. For the further analysis, only those who completed all questions were included (89 and 61 participants, respectively). Respondents represented 31 European countries. In Round 2, none of the listed indicators had a negative mean value, while in Round 3 one indicator had a mean value below 0, indicating the lowest importance (Table 1).
The top 10 indicators for Round 3 were identical to Round 2 (hereafter TOP10), with only the order of the indicators changed (Table 2). The TOP10 indicators were interval cancer rate, detection rate, screening attendance, screening coverage, cancer incidence, cause-specific mortality, proportion of persons attending a further assessment after positive screen test result, proportion of persons attending a treatment after diagnosis, invitation coverage, and distribution of cancers by mode of detection. Results also show that indicators measuring the performance of the screening programs (e.g. interval cancer rate, detection rate, screening attendance, or coverage) were graded higher than indicators measuring the outcomes of the programs (e.g. cause-specific mortality). In Round 2 there was a relatively minor difference between the indicators ranked 10 and 11 (mean scores 1.247 versus 1.236, respectively) but a larger difference was observed in Round 3 (mean scores 1.262 versus 1.066, respectively) (Table 1). The average consensus score considering all indicators also increased in Round 3 (0.711) compared with Round 2 (0.701).
Top 10 indicators in Round 2, overall Round 3, and Round 3 of those who filled both rounds (TOP10).
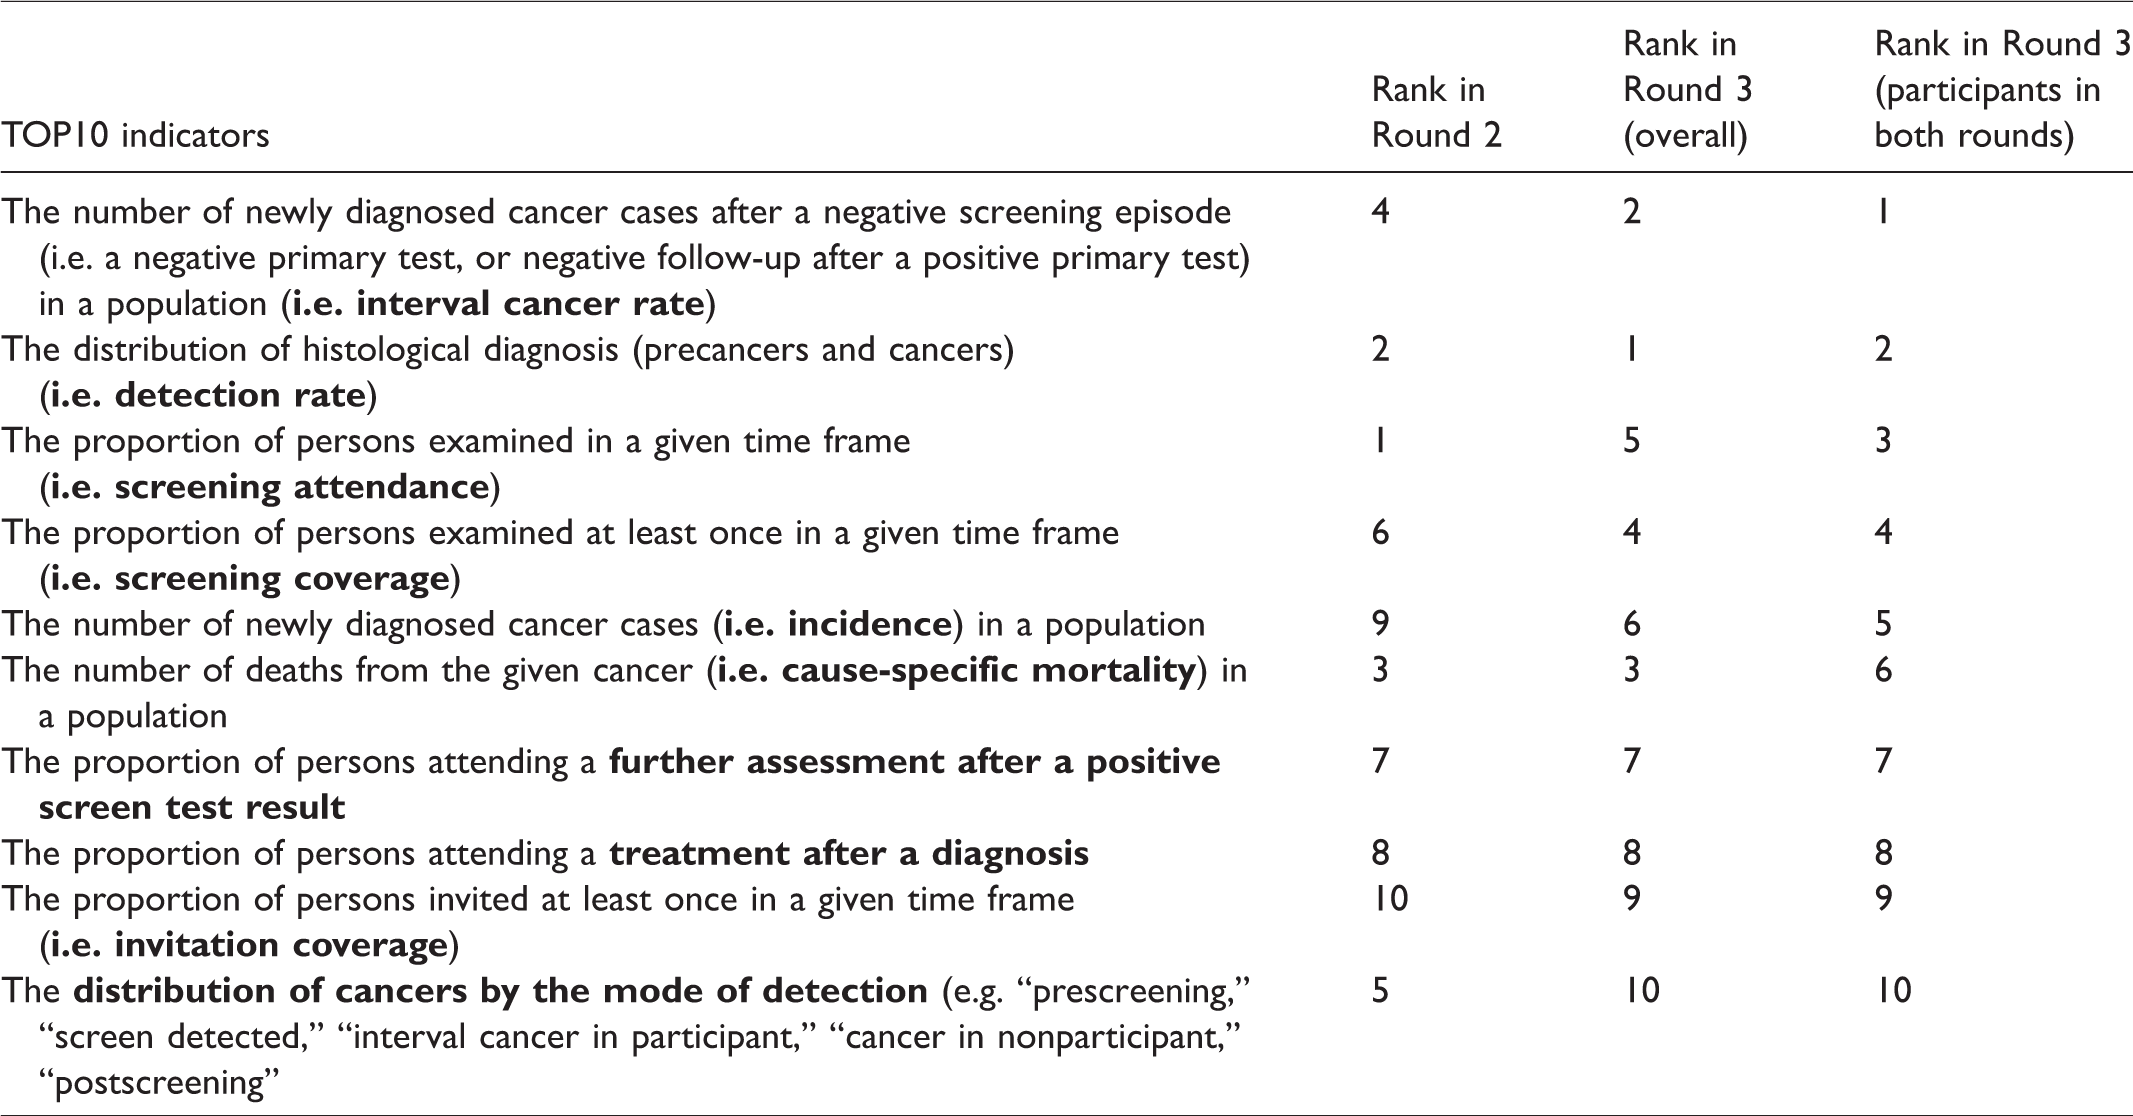
The first subgroup analysis was conducted among Round 3 participants who also filled in the Round 2 online survey (n = 49). The top 10 indicators in this subgroup were also identical to the TOP10, with only the order being different (Table 2). Similarly to the overall results of Round 3, we observed a relatively large difference between the indicators ranked 10 and 11 (mean scores 1.265 versus 1.061, respectively). The average consensus score considering all indicators was similar (0.710) to the overall result of Round 3 (0.711).
The second subgroup analysis was conducted according to the participants’ fields of expertise (42 breast, 29 cervical, and 33 colorectal cancer experts). The top 10 indicators were identical across breast and colorectal cancer experts, with only the order differing (Table 3). Their list was also identical to the TOP10. Cervical cancer experts included two indicators which were not included for breast and colorectal experts: complications related to the screening test and complications related to referral examinations. The two indicators replaced by these items were invitation coverage and compliance with treatment (marked in Table 3 with dashes).
Top 10 indicators by field of expertise.
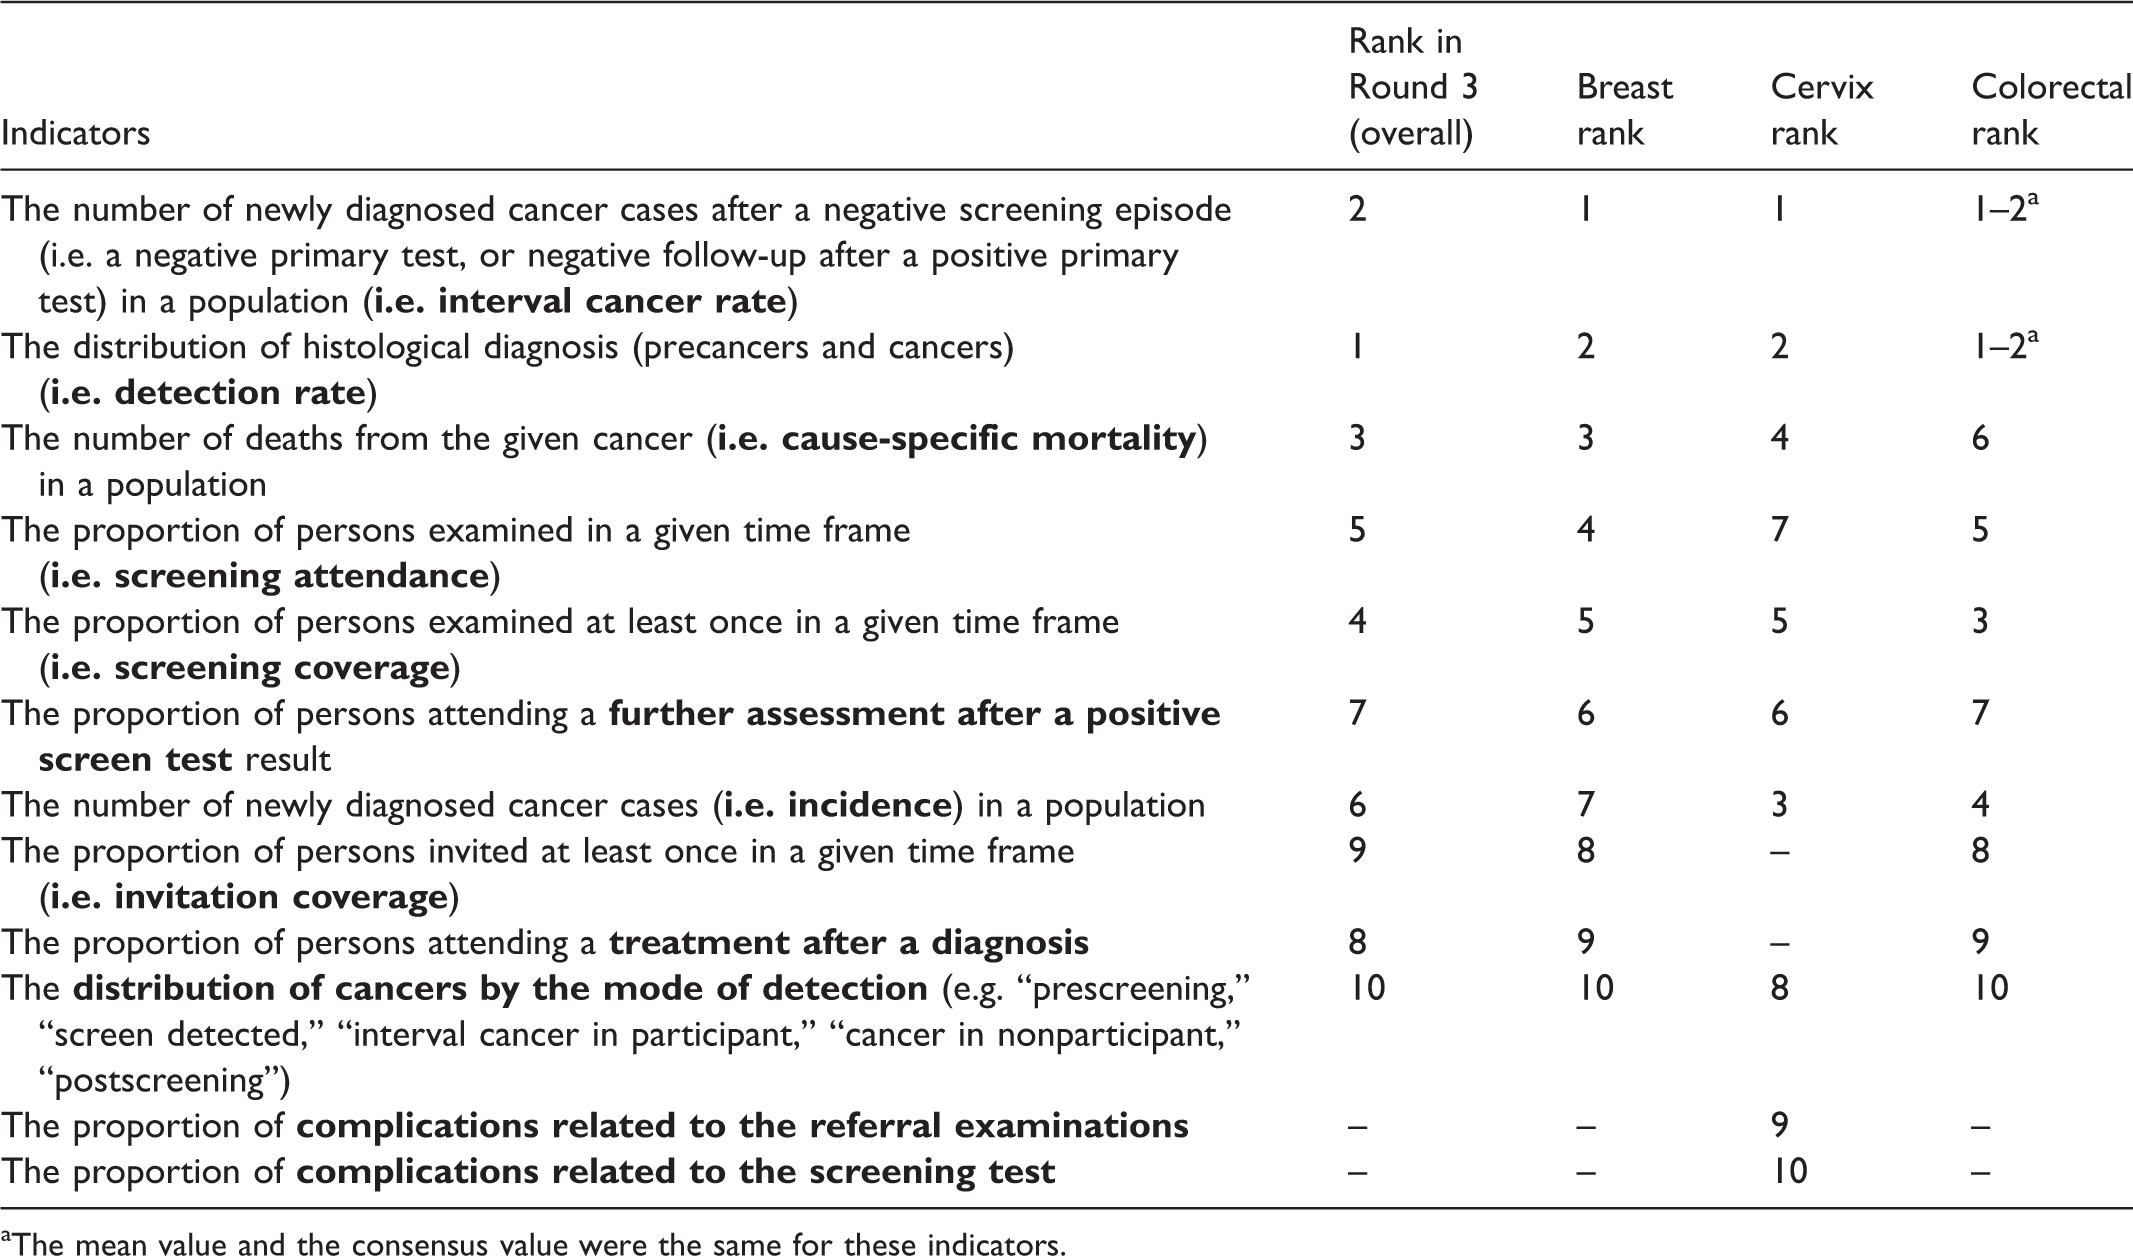
aThe mean value and the consensus value were the same for these indicators.
The third subgroup analysis was conducted according to the participants’ roles (36 researchers, 29 program coordinators, and 10 policymakers) in cancer screening programs. The top 10 indicators were identical for researchers and program coordinators, with only the order differing (Table 4). Their list was also identical to the TOP10. Policymakers included five indicators that were not included by researchers and program coordinators: proportion of persons falsely referred for further assessment, complications related to the screening test, complications related to referral examinations, proportion of cancer patients treated with any treatment, and probability that a person with a positive screen test result has cancer (Table 4).
Top 10 indicators by the role of participants in screening programs.
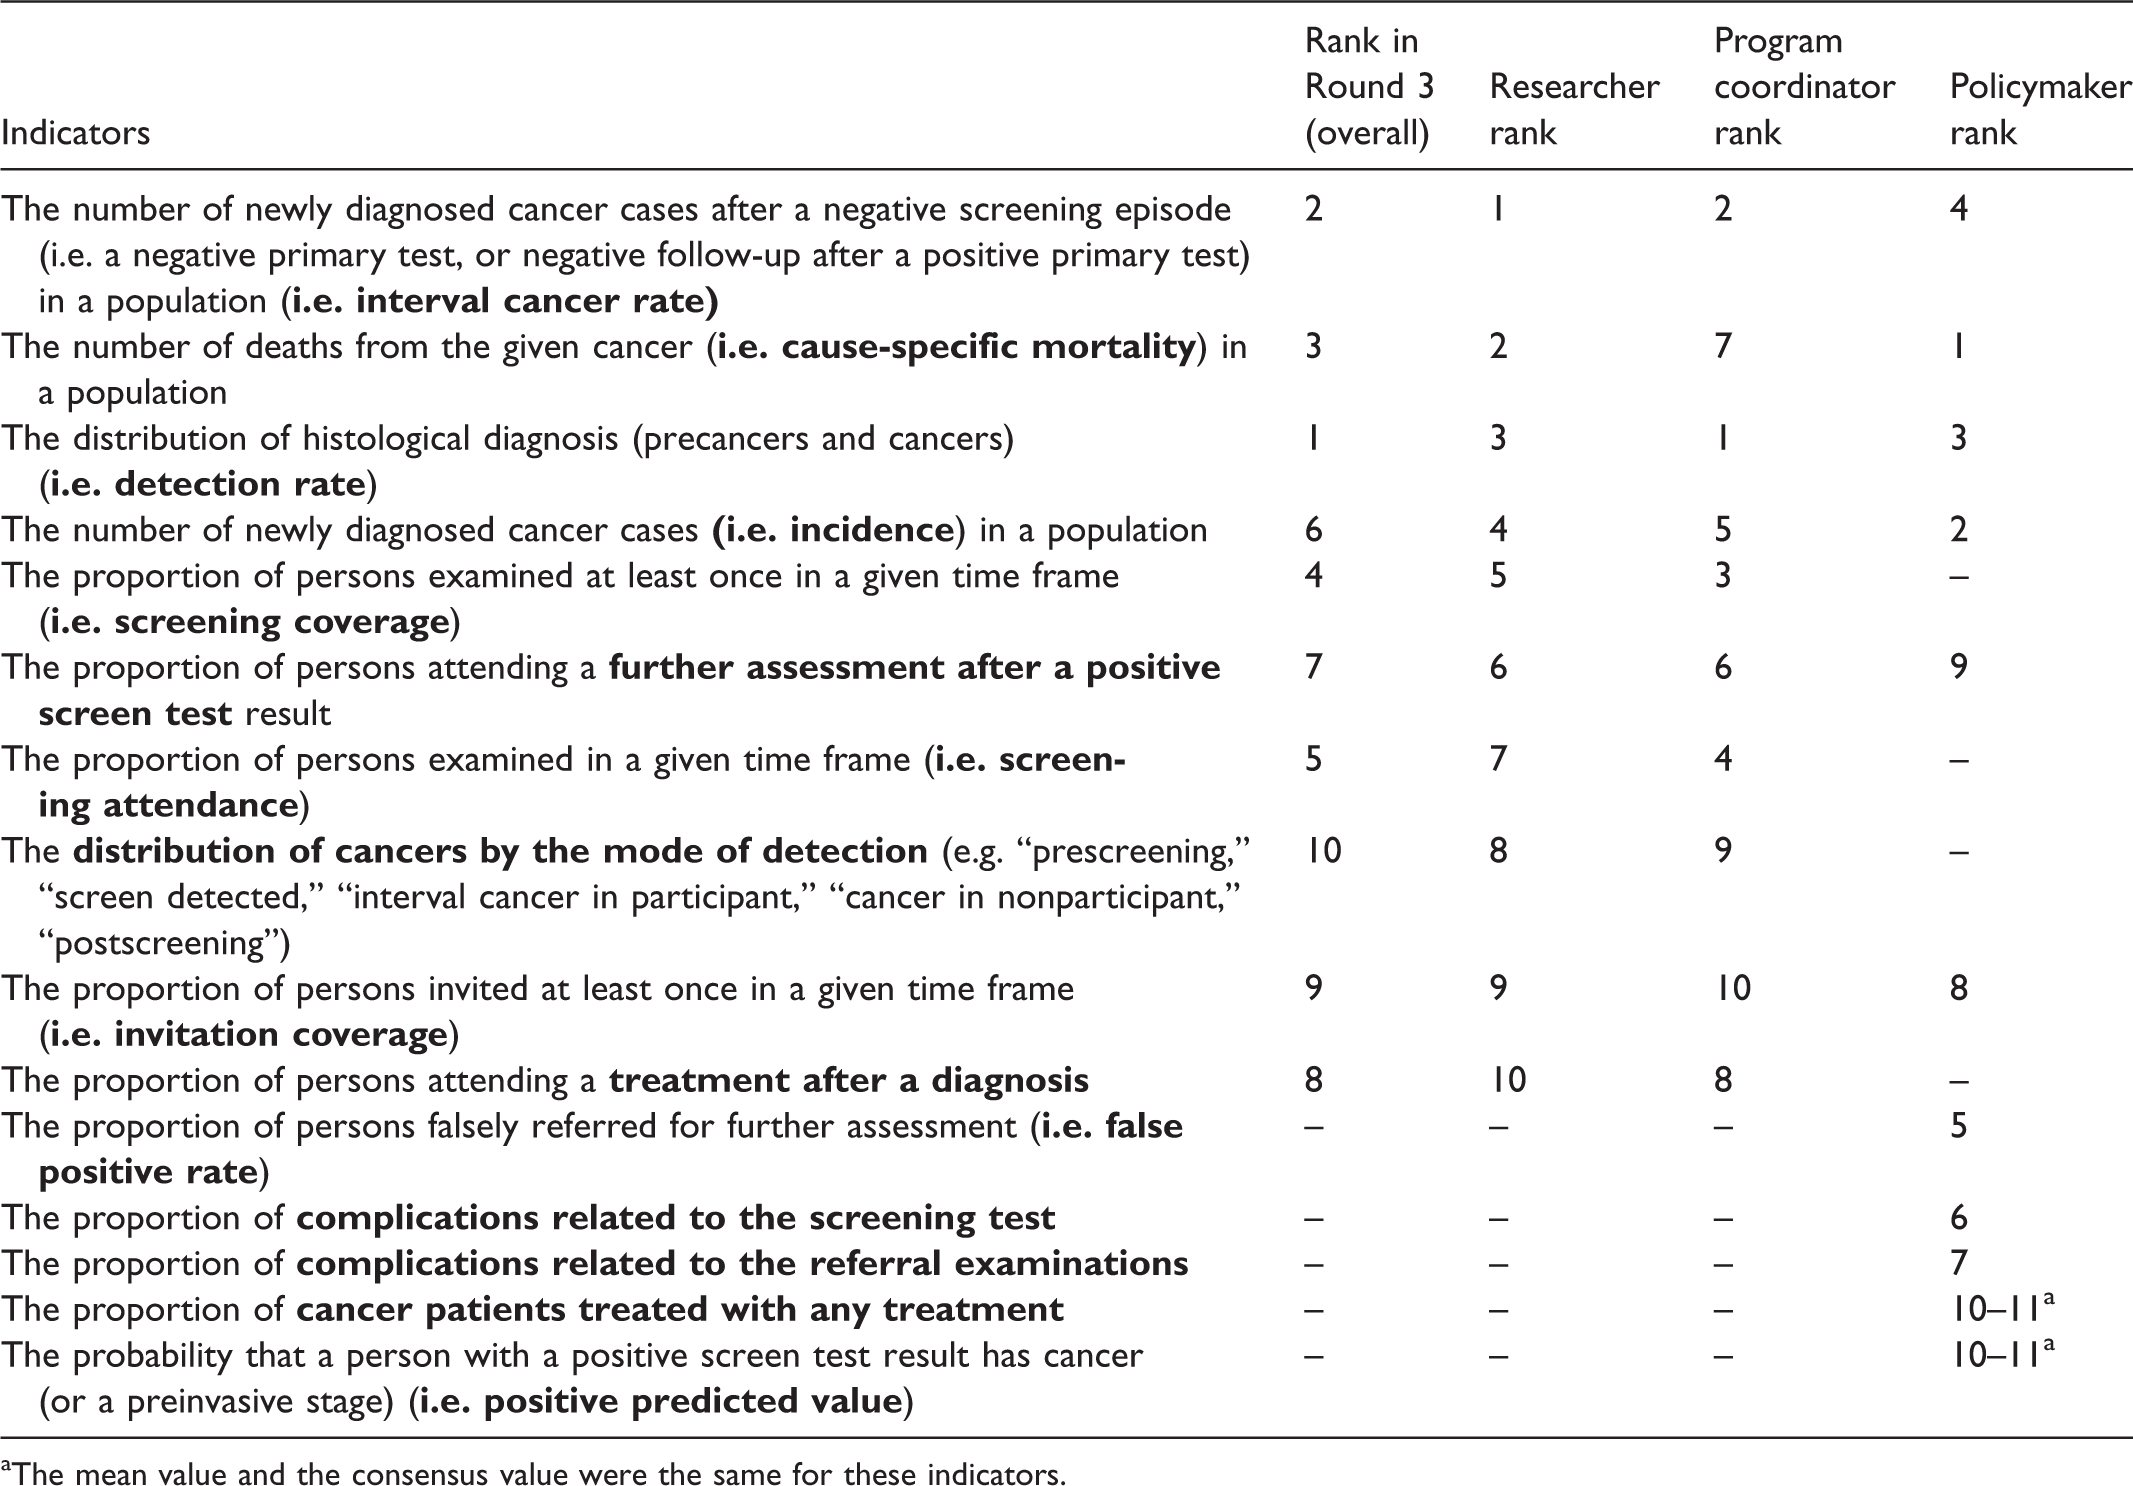
aThe mean value and the consensus value were the same for these indicators.
Discussion
Despite considerable progress in the implementation and organization of cancer screening programs in the EU member states since 2003, much work remains to be done, and procedures for continued monitoring, regular feedback, and periodic reporting should be ensured. 23 Our study adds to this recommendation by providing a consensus from screening experts on the most important indicators required to evaluate organized screening programs. Previous initiatives in monitoring and quality assurance have not attempted to prioritize among organized screening program indicators.
We found a strong consensus among European screening experts on the key indicators of organized screening programs. In the third round of the Delphi panel, we observed a larger difference between the indicators ranked 10 and 11 compared with the previous round, and also we found an increase in the average consensus value. This indicates that workshop participants had a better consensus during the face-to-face meeting toward defining a list of key indicators.
Screening experts had a strong consensus that interval cancer rate, screening attendance, and screening coverage are the most important indicators of screening programs. They ranked performance indicators higher than outcome indicators, probably due to the closer temporal and causal association of screening efforts with performance indicators than with outcome indicators. As effective mobilization of the population, good organization of the screening programs, and good quality of the screening tests are all prerequisites of health benefits, therefore this ranking is not particularly surprising.
Although indicators on screening benefits were generally graded with higher priority, indicators on potential harms should not be neglected. Because there is ongoing debate over the benefits and harms of screening programs, 24 when countries evaluating their program the data collection should include, for instance, overdiagnosis, as it causes overestimations of the sensitivity, specificity, and positive predictive value of screening tests and the incidence of disease. 25
Subgroup analyses by cancer sites and roles in the screening program showed similar results, except for experts in cervical cancer, and for policymakers. Experts in cervical cancer ranked indicators on complications related to the screening test, and to referral examinations, higher compared with the other two cancer sites. This indicates that the quality assurance of these examinations and monitoring of side effects should be prioritized, even though complications for the cervical screening itself are low, and it can be conducted safely even by trained health visitors. 26
We also found that policymakers, in general, had different priorities compared with other stakeholders, which may have different reasons. First, our sample size of policymakers (n = 10) was low compared with researchers (n = 36) and program coordinators (n = 29). Therefore, data on policymakers were less robust to define the top 10 indicators. Second, policymakers tended to put more emphasis on the potential harms of screening activities (i.e. proportion of persons falsely referred for further assessment, complications related to the screening test, and complications related to referral examinations), as these are politically more sensitive issues. In general, they appeared to prioritize the close monitoring of these undesired events that could place screening into a negative context. However, these data are often not routinely available from the screening databases.
The other two stakeholder groups had the same top 10 indicators, but the individual rankings of the indicators were somewhat different. Most notably, cause-specific mortality was ranked as the second most important indicator for researchers, but only the seventh most important for program coordinators. Giving higher priority to performance indicators (e.g. detection rate, interval cancer rate, screening coverage, or screening attendance) was even more noticeable among program coordinators compared with the other two stakeholder groups. We believe that this is because these indicators more closely relate to their responsibilities in the screening programs.
It is important to note that due to the specific approach of early detection with screening, the evaluation of long-term outcomes is not feasible for many years after program implementation. Nonetheless, indicators on the impact of screening should be closely and systematically monitored, to give an early indication of whether the program could lead to the expected benefits. Based on this approach, health economic modeling could be applied to estimate long-term outcomes and the cost-effectiveness of a program, which has been illustrated in previous examples, with considerable influence on screening policy.27–30
This study has some limitations due to its design. First, Delphi studies are usually carried out in a smaller number of experts from the same field; however, representation should be assessed by the qualities of the expert panel, rather than its numbers. 31 As we aimed to achieve a consensus among European screening experts, our sample size included experts in three cancer sites, from relevant institutes of cancer screening throughout 31 European countries. Second, although we attempted to cover as wide range of indicators as possible, we had to limit these to a manageable list in order to perform the Delphi exercise. There may therefore be some aspects of organized screening programs that were not captured in the analysis. Nonetheless, our initial list is based on a comprehensive review of the literature, which was made publicly available by the EU-TOPIA project before the study. Our study did not cover practical and feasibility issues of data collection, or timely availability of relevant data. These issues, however, should be handled by individual countries, according to their institutional settings (e.g. national registries, screening coordination organizations), legal environment on personal data (e.g. data linkage between organizations), and screening related know-how. Another issue might be the definition of more complex indicators, such as the interval cancers. 32 Therefore, further efforts for standardizing the calculation of key indicators, for example the NordScreen project, 33 are required.
Conclusion
This was the first study to attempt to provide a small set of key indicators over three different cancer sites by relying on expert opinion. We found a strong consensus among European screening experts on the key list of screening indicators. Subgroup analyses revealed some differences, more notably for policymakers, who had slightly different perspective from researchers and program coordinators. The implication of our priority ranking depends on the countries’ current practice of systematic data collection and regular monitoring. We recommend that countries without regular and systematic approach of monitoring should primarily design their system to collect at least the defined key indicators. For countries where a systematic approach for data collection is already in place, our priority ranking should be considered as a checklist, by which monitoring procedures can be verified or, if necessary, further updated.
Footnotes
Acknowledgements
The content of this publication reflects only the EU-TOPIA groups’ views and the European Commission is not liable for any use that may be made of the information contained herein. We would like to acknowledge all members of the EU-TOPIA consortium for their support in the development of the project and contributions to this publication.
Declaration of conflicting interests
The author(s) declared no potential conflicts of interest with respect to the research, authorship, and/or publication of this article.
Funding
The author(s) disclosed receipt of the following financial support for the research, authorship, and/or publication of this article: This study was part of the EU-TOPIA project, funded by the EU-Framework Programme (Horizon 2020) of the European Commission, project reference 634753.