
Abstract
Objective
The Norwegian Breast Cancer Screening Programme invites women aged 50–69 to biennial mammographic screening. Although 84% of invited women have attended at least once, attendance rates vary across the country. We investigated attendance rates among various immigrant groups compared with non-immigrants in the programme.
Methods
There were 4,053,691 invitations sent to 885,979 women between 1996 and 2015. Using individual level population-based data from the Cancer Registry and Statistics Norway, we examined percent attendance and calculated incidence rate ratios, comparing immigrants with non-immigrants, using Poisson regression, following women's first invitation to the programme and for ever having attended.
Results
Immigrant women had lower attendance rates than the rest of the population, both following the first invitation (53.1% versus 76.1%) and for ever having attended (66.9% versus 86.4%). Differences in attendance rates between non-immigrant and immigrant women were less pronounced, but still present, when adjusted for sociodemographic factors. We also identified differences in attendance between immigrant groups. Attendance increased with duration of residency in Norway. A subgroup analysis of migrants' daughters showed that 70.0% attended following the first invitation, while 82.3% had ever attended.
Conclusions
Immigrant women had lower breast cancer screening attendance rates. The rationale for immigrant women's non-attendance needs to be explored through further studies targeting women from various birth countries and regions.
Introduction
Breast cancer is the most common cancer among women worldwide and in Norway, with the highest incidence occurring in Europe, North America and Oceania.1,2 In these regions, immigrant women have lower breast cancer incidence, overall, than non-immigrants, but this effect is not observed among second generation immigrants.3,4 Immigrant and ethnic minority women are also diagnosed with more advanced disease than non-immigrants.5,6
As mammographic screening has both benefits and harms, recommendations underscore the importance of enabling women to make an informed choice about screening participation. 7 In Norway, the European Union (EU), Australia, New Zealand and North America, most independent panels and policy makers recommend mammographic screening for women in higher-risk age-ranges. 7–13 These recommendations are in keeping with those from the International Agency for Research on Cancer, 14 but guidance is not stratified by women's country of origin.
Studies suggest that sociodemographic factors influence attendance rates in high-income countries (HIC).15–17 Low income, low educational status and being married have been found to be associated with non-attendance. A recent Norwegian study suggested that improvements in breast cancer incidence and mortality after the turn of the century have primarily benefited higher educated women. 18 Studies from other HIC have shown that immigrant women have lower attendance rates than non-immigrants,19–25 however, some of these studies are limited by small sample sizes, short study periods or inaccuracies associated with self-reported attendance.
About 14% of Norway's population are immigrants, and their children account for a further 3% of the population. 26 Although 53% of immigrants come from Europe, the 10 countries from which most women have emigrated include Somalia, Iraq, Syria, the Philippines, Pakistan and Eritrea. Many Pakistani immigrants have lived in Norway since the 1970s, and their descendants almost equal the number of Pakistani immigrants. Most immigrants from the new EU member states have lived in Norway for less than five years. Since 1989, family reunification has been the most common reason for immigration, followed by work. Employment rates are lower for immigrants than non-immigrants, and less immigrant women are employed than immigrant men. A higher proportion of immigrants from the EU member states are employed than non-immigrants, while the proportion of employed immigrants from Africa and Asia is lower compared with the rest of the population.
The Norwegian Breast Cancer Screening Programme (NBCSP) started in four counties in 1996, and was nationwide in 2005 after a staggered implementation. The programme offers two-view mammographic screening to women aged 50–69 through 10 screening rounds over 20 years. Currently, approximately 600,000 women are invited to each screening round. 27 Women are identified through the National Registry, and receive a personalised invitation letter with a time and place for examination. Screening is performed at 26 stationary and four mobile units. Women must pay their travel expenses to the screening location, and a user fee of 240 NOK (about €26) for screening and any subsequent recall and diagnostic work-up. The average attendance rate for a screening round is 75%, and 84% of invited women attended the programme at least once between 1996 and 2014. 28 Attendance rates per screening round vary between regions, from 62% in Oslo to 82% in the rural county of Sogn og Fjordane. The programme is described in detail elsewhere. 29
In this study we aim to investigate mammographic screening attendance among various immigrant groups compared with non-immigrants, and to see how this has varied when adjusted for sociodemographic factors. We also wanted to investigate how attendance rates have varied among various immigrant groups since the start of the programme in 1996, and how attendance rates vary with years since immigration.
Methods
The Cancer Registry of Norway holds attendance information for approximately 900,000 women invited to the NBCSP since its inception in 1996. The Norwegian resident registry allocates all residents a unique personal identification number, which allows linkage of information from the screening programme to other registries. Statistics Norway gathers information from several population-based registries, 30 which contain information about country of birth, date of immigration to Norway and sociodemographic factors. This provides a unique opportunity to merge data on an individual level from different population registries with the mammographic screening database, and to examine the attendance rates in the NBCSP among non-immigrant and immigrant women.
Data sources and modifications
Number of women, invitations, attendance rates and crude and adjusted incidence rate ratios for attendance after the first invitation and whether women have ever attended the Norwegian Breast Cancer Screening Programme, 1996–2015, by (a) non-immigrants versus immigrants, (b) geographical region of birth and (c) second generation immigrants versus other non-immigrants.
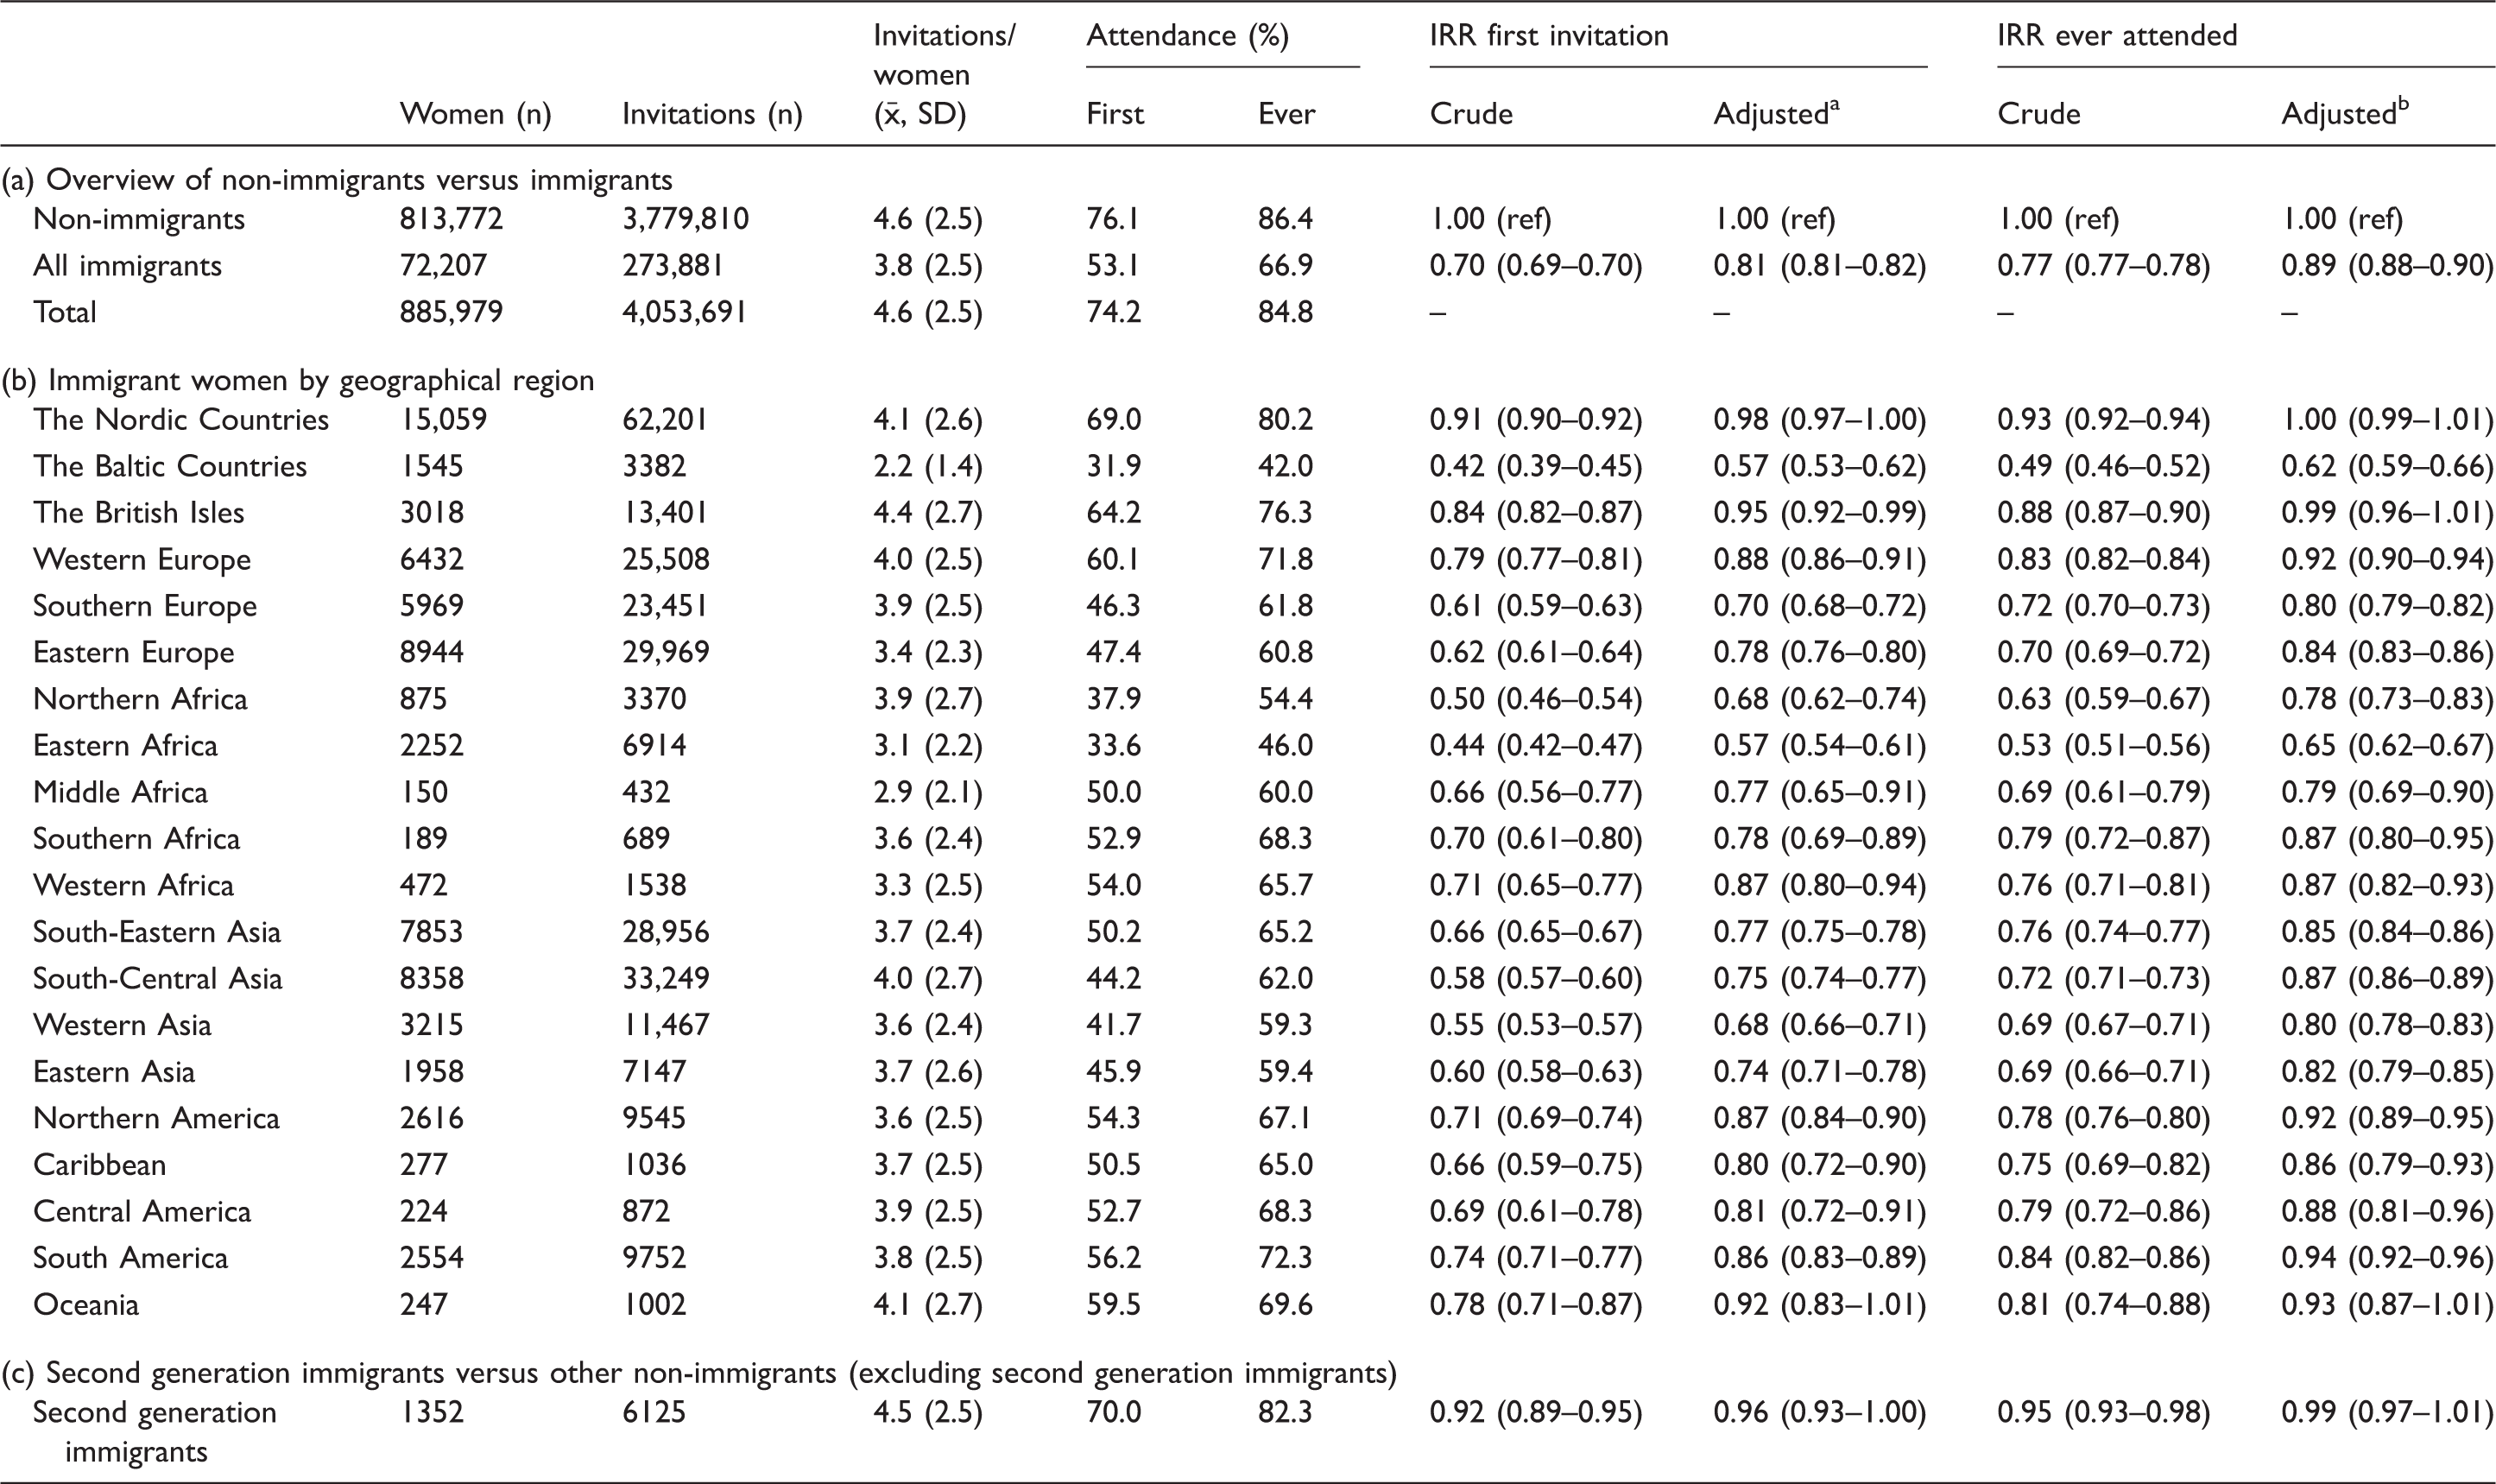
Adjusted for income, net worth, education, disability benefits, marital status, citizenship, whether women were living in the capital city or not and screening year.
Adjusted for income, net worth, education, disability benefits, marital status, citizenship and whether women were living in the capitol city or not.
We divided immigrant women, according to their country of birth, into geographical regions based on the United Nations' Population Division, 31 with some modifications (Cyprus and Kosovo were included in Southern Europe, and Greenland was included in Northern Europe). Based on political, historical and cultural circumstances, we further divided Northern Europe into Norway (non-immigrants), the (other) Nordic Countries (Sweden, Denmark, Finland, Faroe Islands, Iceland and Greenland), the Baltic Countries (Estonia, Latvia and Lithuania) and the British Isles (United Kingdom, Ireland, Channel Islands and Isle of Man). The four regions of Oceania were combined into one region as very few women originated from countries other than Australia or New Zealand. As it would be very difficult to present all 21 regions in figures, we used the United Nations' Population Division's categories of HIC, middle-income countries (MIC) and low-income countries (LIC) for graphical presentations (see online appendix for categorisation).
We chose sociodemographic variables based on findings from other studies and the data available.15–17,19–22,28,32 Data on yearly income and net worth were available for all years. We categorised these data into deciles derived from all women in Norway aged 25–67. Disability benefit recipient status was dichotomised, and women were classified as recipients if their disability degree was ≥50%. As women may receive invitations early in the year, we used data on income, net worth, employment status and disability benefit recipient status from the year prior to each screening appointment. For each invitation, a variable indicated whether women were living in or outside of Oslo at the time of screening appointment. The highest level of education recorded, as provided by Statistics Norway, as none/unspecified, primary and lower secondary, upper secondary, short tertiary (≤4 years of college/university) or long tertiary (>4 years of college/university). Statistics Norway retrieved educational data from 1971 onwards from national registries (not self-reported), while educational data prior to 1971 was based on the 1970 national census (self-reported). 33 Surveys performed in 1991 and 1999 have reduced the proportion of immigrants with unknown educational level. Only the most recently updated data were available for marital status, which was categorised as not married, married/registered partner, unmarried or widowed. Whether the women were Norwegian citizens or not also pertained to the most recently updated data. Lastly, we used age at time of screening appointment and age at immigration to calculate years since immigration.
Statistical analyses
We performed descriptive analyses of attendance rates by country of birth, screening period and years since immigration. Using Fischer's exact test, we compared each group to non-immigrants, and to women born in HIC, MIC and LIC over time. All tests were two-sided and considered significant if p < 0.05. Crude and adjusted incidence rate ratios (IRR) were calculated with 95% confidence intervals (95% CI) for attendance among immigrant compared with non-immigrant women, using Poisson regression with robust variance. We investigated first round attendance for each woman (first invitation), and whether women had ever attended the programme. Results were stratified by region of birth. Our adjusted regression model included income, net worth, education, disability benefit recipient status, marital status, citizenship, place of residence and screening year. To avoid multicollinearity, we performed pairwise associations between candidate variables using the coefficient of determination (R2) with a cut-off value of 0.10. Hence, age and employment status were excluded from our adjusted model. When analysing whether women had ever attended, we used sociodemographic values from a random invitation if a woman had received more than one invitation, and also excluded screening year. Statistical analyses were conducted using STATA/MP 14.1 for Windows.
Results
We analysed data pertaining to 813,772 non-immigrant women who had received 3,779,810 invitations to screening, and 72,207 immigrant women who had received 273,881 invitations (Table 1). Attendance rates following the first invitation were 76.1% for non-immigrant women, and 53.1% for all immigrant women; 86.4% and 66.9%, respectively, had ever attended.
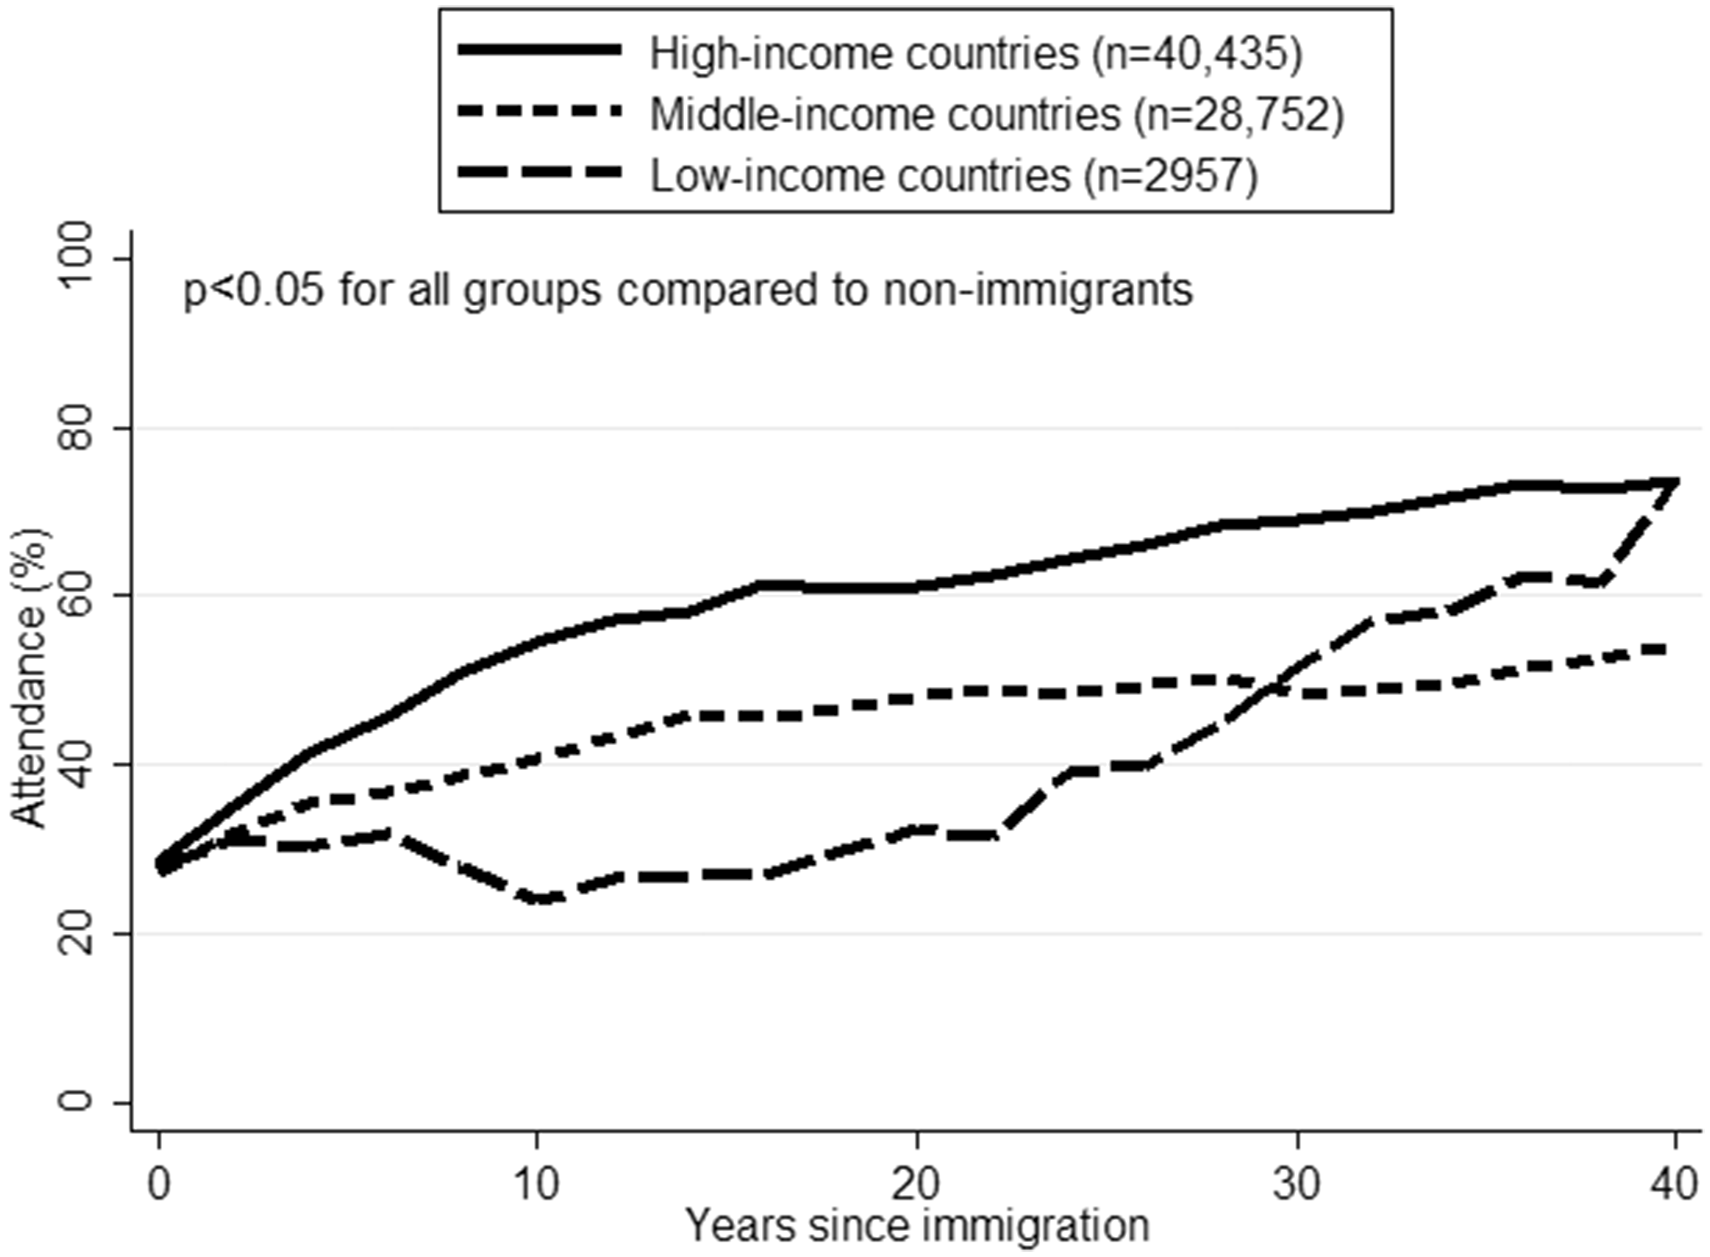
Over the 20-year observation period, non-immigrant women had consistently higher attendance rates than immigrant women (Figure 1). Differences in attendance rates between immigrants from HIC, MIC and LIC decreased over time. At the end of the study period, women born in HIC and MIC attended at similar rates following the first invitation (p = 0.09). Looking at all invitations, attendance rates increased considerably with years since immigration. At 0–2 years after immigration, attendance rates were about 30% for women born in HIC, MIC and LIC. At 38–42 years after immigration, rates were 73.1% for women from HIC, 54.0% for women from MIC and 63.4% for women from LIC (Figure 2).
Attendance rates by screening year for (a) all invitations, and (b) first invitation. Attendance rates after first invitation by years since immigration.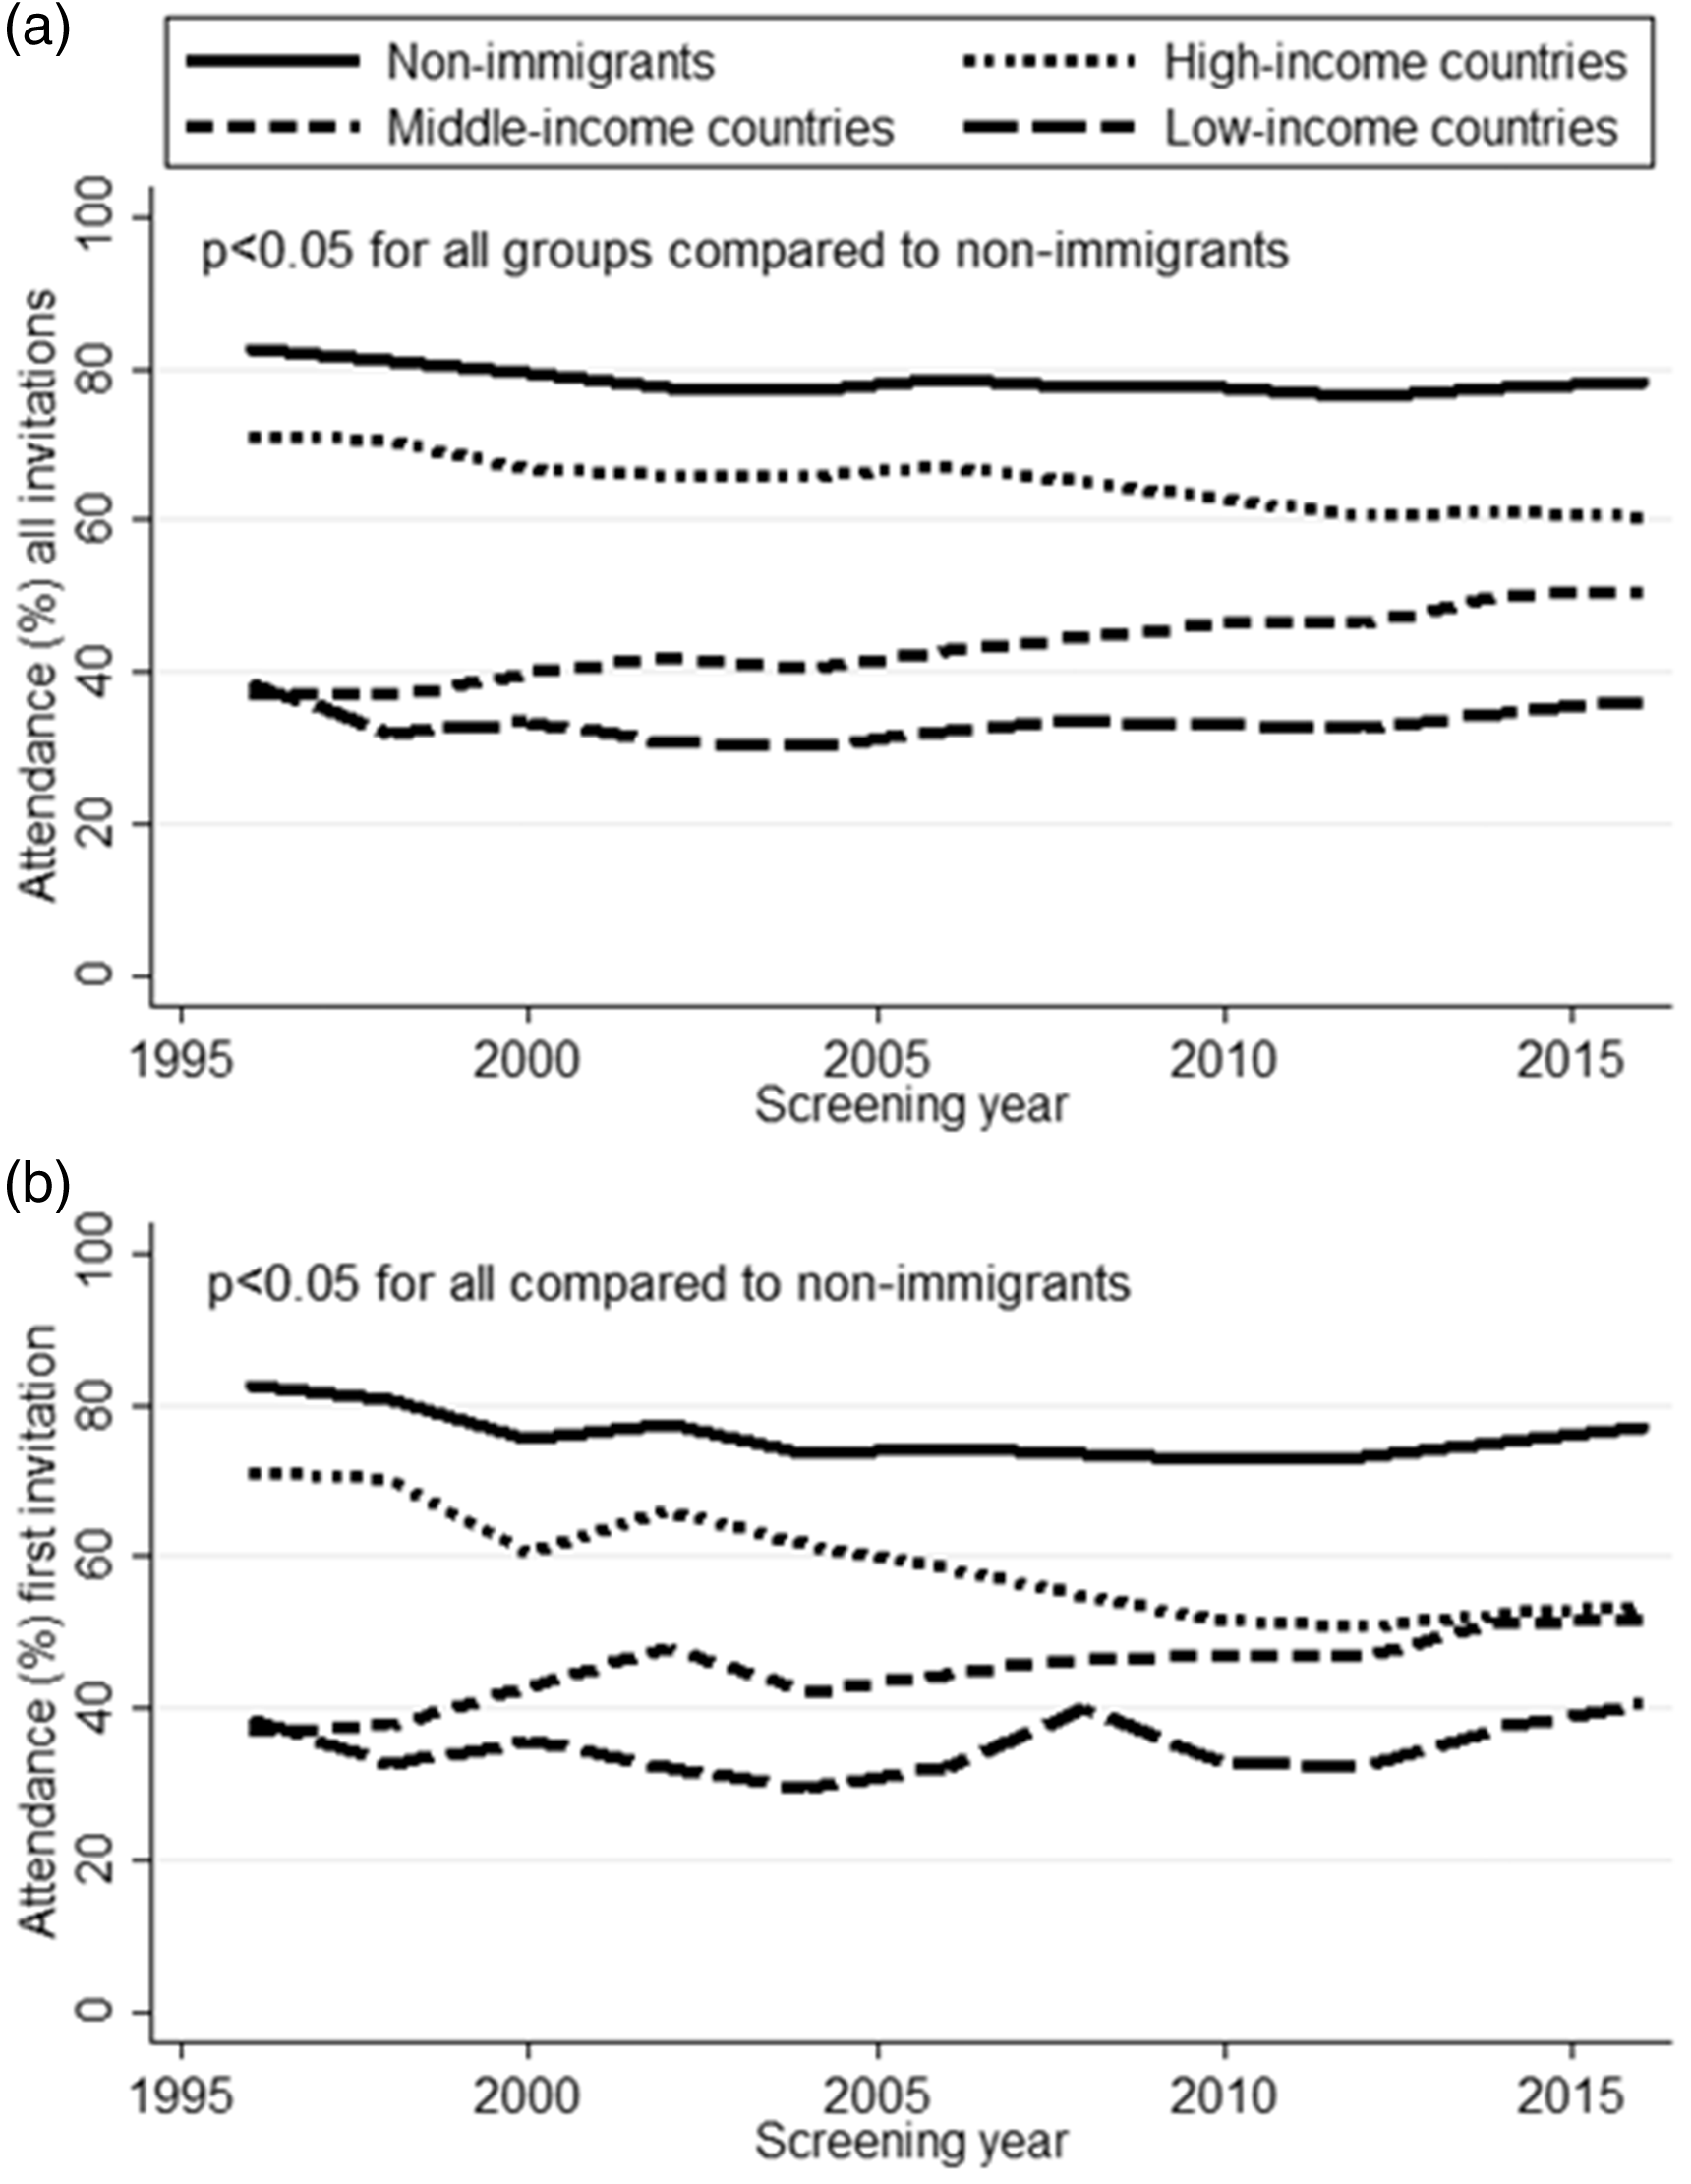
Women in our study were born in 195 countries. We present results for women by geographic region of birth (Table 1), and by country of birth for the 72 countries from which there were more than 100 women eligible for participation in the programme (online Appendix). Women born in Somalia had the lowest attendance rate following their first invitation to the programme (16.7%) (online Appendix). The rate was also <40% for women born in the Baltic countries (<40% for women born in each of the Baltic countries, and 31.9% combined), Eastern Africa (33.6%), Northern Africa (37.9%) (Table 1), Iraq (37.1%), Pakistan (37.4%), Morocco (37.5%) and Afghanistan (37.6%), amongst others (online Appendix).
In general, attendance rates and IRRs were lower after the first invitation than ever attendance. The lower attendance rates following first invitations were particularly prominent among women born in Somalia (16.7% versus 26.6%), Afghanistan (37.6% versus 57.7%), Iraq (37.1% versus 56.5%) and Pakistan (37.4% versus 58.6%). Immigrant women had lower attendance rates following their first invitation to screening than non-immigrants, with adjusted IRRs (95% CI) of 0.81 (0.81–0.82); adjusted IRRs (95% CI) for ever having attended screening was 0.89 (0.88–0.90) (Table 1).
Women from certain continents and regions had similar attendance rates to non-immigrants, as measured by adjusted IRR following their first invitation. This pertained to women from Oceania (0.92, 95% CI: 0.83–1.01), the (other) Nordic countries (0.98, 95% CI: 0.97–1.00), the British Isles (0.95, 95% CI: 0.92–0.99) and Australia/New Zealand (0.93, 95% CI: 0.84–1.03). The same groups also had attendance rates similar to non-immigrants for ever having attended.
Second generation immigrants had higher attendance rates than immigrants, but lower than other non-immigrants. When adjusted for sociodemographic factors, second generation immigrants had similar attendance to other non-immigrants, with IRR (95% CI) of 0.96 (0.93–1.00) after first invitation, and 0.99 (0.97–1.01) for attendance at least once (Table 1). Of second generation immigrants, 97.9% were descendants of immigrants from Europe or North America.
Discussion
This study showed lower attendance rates among immigrants than non-immigrants in the NBCSP between 1996 and 2015. Rates varied substantially between groups of immigrants depending on country of birth, and increased with duration of residency in Norway. Our findings are in keeping with studies from other HICs. 19–25 Differences in attendance rates between non-immigrant and immigrant women were less pronounced, but still present, when adjusted for sociodemographic factors. Adjusted IRRs were higher for ever having attended screening than for attendance after the first invitation. Women born in Northern Africa, South-Central Asia and Western Asia in particular had low rates for attendance after first invitation compared with attendance at least once. Our findings might imply that immigrant women who attend screening do so irregularly, and that past attendance may have a larger effect on future attendance for non-immigrants than immigrants. This hypothesis is strengthened when considering attendance across all invitations (online Appendix).
The difference in attendance rates between immigrant women born in HIC and other immigrant women decreased over the 20-year observation period, largely because a smaller proportion of immigrant women born in HIC took part in the screening programme towards the end of the observation period. In 2004, Cyprus, the Czech Republic, Estonia, Hungary, Latvia, Lithuania, Malta, Poland, Slovakia and Slovenia (all HIC) joined the EU, ensuring free movement of people within the European Economic area, of which Norway is a member (despite not being an EU member). This expansion changed demographics among immigrants born in HIC, as the proportion born in the new EU member states increased substantially. 34 Women born in most of these countries had lower attendance rates than women born in HIC overall.
Figure 2 shows that attendance rates increased with years since immigration. Immigrants arriving in Norway face many circumstances that are different from their home countries; linguistic, social and economic circumstances might prevent recent immigrants from gaining access to, or prioritising screening. For instance, recent immigrants might have difficulties understanding the invitation letter in Norwegian. With increasing length of stay, we expect that women become more familiar with the Norwegian language and the health care services. Our findings might indicate that prioritisation of and access to screening increases with time since immigration. Notably, immigrants from LIC who immigrated less than 20 years ago did not have increased attendance with years since immigration, while LIC immigrants who immigrated more than 30 years ago had higher attendance rates than corresponding MIC immigrants. Only 259 women from LIC in our population immigrated over 30 years ago, and numbers should therefore be interpreted with caution. Over 66% of women from LIC who had immigrated less than 20 years ago were born in Somalia or Afghanistan. Less than 2% of women from LIC who had immigrated over 30 years ago were born in these countries.
Data on immigrants from individual countries and regions are often combined into larger geographical units to obtain sufficient statistical power. In our study, immigrant women from Southern and Western Africa had higher attendance rates than women born in other parts of Africa, and also than women born in some parts of Europe. Presenting results for all women from Africa as one group would fail to reveal these differences. The groups in our graphical presentations fail to reveal similar differences. For instance, women born in the (other) Nordic Countries, the British Isles, and Western Europe had the highest attendance rates, and were categorised as HIC. Women born in the Baltic countries had the lowest attendance rates, but were also categorised as HIC.
Regional differences in adjusted IRR showed that differences in attendance persisted despite adjusting for the sociodemographic factors available to us. It is possible that including other sociodemographic factors, such as religion, religiosity, family size, smoking, alcohol use or comorbidities, would have given different estimates. The observed differences in attendance could also represent different reactions to receiving the invitation letter. Some women might see the formal wording and logo and feel obliged to attend, while others might feel that this is not something relevant for them. Some women might read the invitation letter and the accompanying fact sheet, weigh the benefits against the harms, and decide not to attend. Fewer women from Southern and Western Africa had no recorded education or low income compared with women from other parts of Africa (results not shown). It is possible that the higher attendance among women from Southern and Western Africa is a result of more women making an informed decision to participate, as they were better able to understand the invitation letter, and that they were in a better position to prioritise money for screening.
Pre-migratory factors, such as health habits, preventive health services including mammographic screening and cancer risk in the women's country of origin could also contribute to explaining the differences. The Baltic countries have lower breast cancer incidence rates than most other European countries. 35 If we theorise that low incidence rates of a disease leads to lower awareness of that disease in the population, we can hypothesise that lower breast cancer incidence rates lead to lower breast cancer prevention awareness, which might further contribute to the low attendance rates among women from these countries. However, some of these women might have obtained mammographic screening in their birth countries, which are geographically fairly close to Norway. 36 Somalia and other countries in Eastern Africa have some of the lowest breast cancer incidence rates in the world. 1 Women from Somalia had the lowest attendance rates in our population (26.6% had ever attended). It is unlikely that these women travelled to Somalia for screening. The birth countries of women with the lowest attendance rates differ with respect to history, culture, language(s), main religion(s), health care systems and circumstances that may play a role for emigration. Some of these countries are located in Europe, others in Africa and yet others in Asia, with the Baltic countries categorised as HIC, Pakistan as MIC and Somalia as LIC.
The user fee for mammographic screening in Norway may be considered symbolic, but for economically disadvantaged women, regardless of country of birth, it might be significant. There are also additional costs related to screening attendance, such as transport and loss of productivity. Due to sparsely populated areas in Norway, some women must travel for up to four hours to reach a screening unit. However, there was still an effect of country of birth after adjusting for sociodemographic factors.
Invitation letters are issued in Norwegian only, which could work to exclude women who have difficulties understanding written Norwegian. Limited information about the programme is offered online in English, Arabic and Urdu, but to access this information women need to identify and navigate an unfamiliar website, in which foreign-language information is not readily available. In 2009–2010, both the Cancer Registry of Norway and the Oslo Breast Centre headed campaigns to increase non-Western immigrants' screening attendance, in particular women from Pakistan. Educational DVDs in Urdu and Somali were uploaded to YouTube by the Norwegian Cancer Society shortly after these campaigns. A small increase in attendance from 32% to 36% among Pakistani-born women following the campaigns corresponds to an increase in attendance among other women born in MIC.
Language, cost of the examination, personal income and patient navigation are factors that might contribute to prevent access to preventive health care, such as mammographic screening. Other factors may include differences in perception of health and disease, and breast cancer awareness. However, regardless of these factors, in order for a service to be utilised, it must be considered meaningful for the people for whom it is intended. 37
This study aimed to identify groups that are not reached by the current strategies. Identifying groups of non-attenders may indicate that strategies to reach these groups have been unsuccessful. Equity in access to healthcare is traditionally considered a central principle of the Nordic model of healthcare. 38 Access to health care must take into account formal availability, actual accessibility, relevance and acceptability.39,40 To ensure access equity, information and accessibility should ideally be tailored to the needs of the various immigrant groups.
The main strength of this study is the complete and detailed data about screening attendance, sociodemographic factors and country of birth on an individual level for a large population over a 20-year period. This study also has limitations: some data from Statistics Norway are inaccurate, for instance, women who emigrate without notifying the authorities are considered non-attenders in our study, until registered as emigrated. A larger proportion of immigrants than non-immigrants emigrate, which may result in artificially low attendance rates among immigrants, although it is unlikely that this is a major limitation as the registration as emigrated is delayed, rather than missing. Further, results are presented with birth country as the smallest geographic unit, not taking into account heterogeneity among women from the same birth country. In a British study, Hindu-Gujaratis had higher attendance rates than other Hindus and Muslims in the period 2001–2004. 41 Our data do not allow us to identify such differences among Indian women in Norway. While we have data about the women's sociodemographic factors after immigration to Norway, we have limited pre-migratory information.
Conclusion
Between 1996 and 2015, immigrant women from all continents, regions and countries had lower attendance rates in the NBCSP than non-immigrants. Based on our findings, we recommend qualitative research targeting women from various birth countries or regions, to explore the rationales for immigrant women's attendance and non-attendance in organised mammographic screening.
Footnotes
Research ethics
This study has been approved by the regional committee for medical and health research ethics in South-eastern Norway, REC South East (2013/795).
Declaration of conflicting interests
The author(s) declared no potential conflicts of interest with respect to the research, authorship, and/or publication of this article.
Funding
The author(s) disclosed receipt of the following financial support for the research, authorship, and/or publication of this article: This work was supported by the Norwegian Extra Foundation for Health and Rehabilitation [2016/FO76429] (![]() English description towards the end). The funding source had no involvement in the conduction of the study, interpretation of the results or preparation of the manuscript.
English description towards the end). The funding source had no involvement in the conduction of the study, interpretation of the results or preparation of the manuscript.
References
Supplementary Material
Please find the following supplemental material available below.
For Open Access articles published under a Creative Commons License, all supplemental material carries the same license as the article it is associated with.
For non-Open Access articles published, all supplemental material carries a non-exclusive license, and permission requests for re-use of supplemental material or any part of supplemental material shall be sent directly to the copyright owner as specified in the copyright notice associated with the article.