
Abstract
Objectives
Comprehensive nationwide monitoring and evaluation of screening through registry-based review of key indicators is necessary for programme optimization, especially as new tests and strategies are introduced. We aimed to investigate and report on the use of these key indicators in the Swedish programme.
Setting and methods
Organized population-based cervical screening targeting women aged 23–50 and 51–60 every three and five years, respectively, is regionally implemented in Sweden. All cytological and histopathological test results and invitations are exported to the National Cervical Screening Registry. We describe the methods to obtain registry-based quality indicators by age, region, and calendar period.
Results
In 2013, there were 633,592 cervical smears in Sweden, of which 69% were organized smears resulting from an invitation. Screening test coverage for women aged 23–60 was 80% and similar for the previous decade, but varied greatly between and within counties over-time. Among women aged 23–25, test coverage increased dramatically during the previous six years, reaching 87% in 2013. The proportion of women with cytological high-grade cervical lesions found in cytology that had been followed-up with biopsy within one year was 97%. Major variations in cervical cancer incidence between counties were observed.
Conclusions
Registry-based analyses of key quality indicators provided the basis for prioritizing improvements of the organized cervical screening programme.
Introduction
Efficient, organized cervical screening is dependent on a population-based registry for follow-up and incremental improvements of the programme.1,2 Most European countries have organized cervical screening programmes, and almost all countries have mass screening registries with identifiable data. 3 The real-life effectiveness of cervical cancer screening is considerably less than the theoretical gains, and the reasons for this can be investigated by registry-based analyses, with subsequent evidence-based design of improvements. A common problem is that the required activities of the screening registry for such analyses and suggesting of remedies are not well understood. 3 While many registries publish annual reports, these are often only in local languages and not easily retrievable. Most published articles are one-time research investigations, usually comparing different countries, 4 rather than descriptions of how over-time follow-up is being used to improve programmes. We produced an abridged and translated version of the Annual Report of the Swedish National Cervical Screening Registry, to provide a readily available example of the process for how a registry-based analysis can be used to provide a scientific basis for incremental improvements to a cervical screening programme.
Methods
The Swedish National Cervical Screening Registry (NKCx) aims to provide an evidence base for incremental improvements of the cervical cancer screening programmes, by continuous reporting of the quality and impact of prevention efforts. Identifiable data on all cytological and histopathological analyses, as well as all invitations to screening, are exported from all laboratories and regional screening organizations in Sweden. The laboratories send a copy of the same data that is reported to the clinic that requested the analysis, ensuring completeness and correctness. Registry coverage is thus 100%, for both cytological and histological analyses, as well as for invitations to screening. Data are exported as text files in a predefined format, and sent to the register either by internet using encryption, or on CDs sent by registered mail. Because of variations in how different cytological diagnoses were recorded in different laboratories, a translation table to the standard nomenclature recommended by the Swedish Society of Clinical Cytology was developed. An automatic script translates the raw data and monitors the quality of imported data, with systematic corrections of duplicates, missing data, and other issues (Figure 1).
Schematic description of the processes and data of the national cervical screening registry.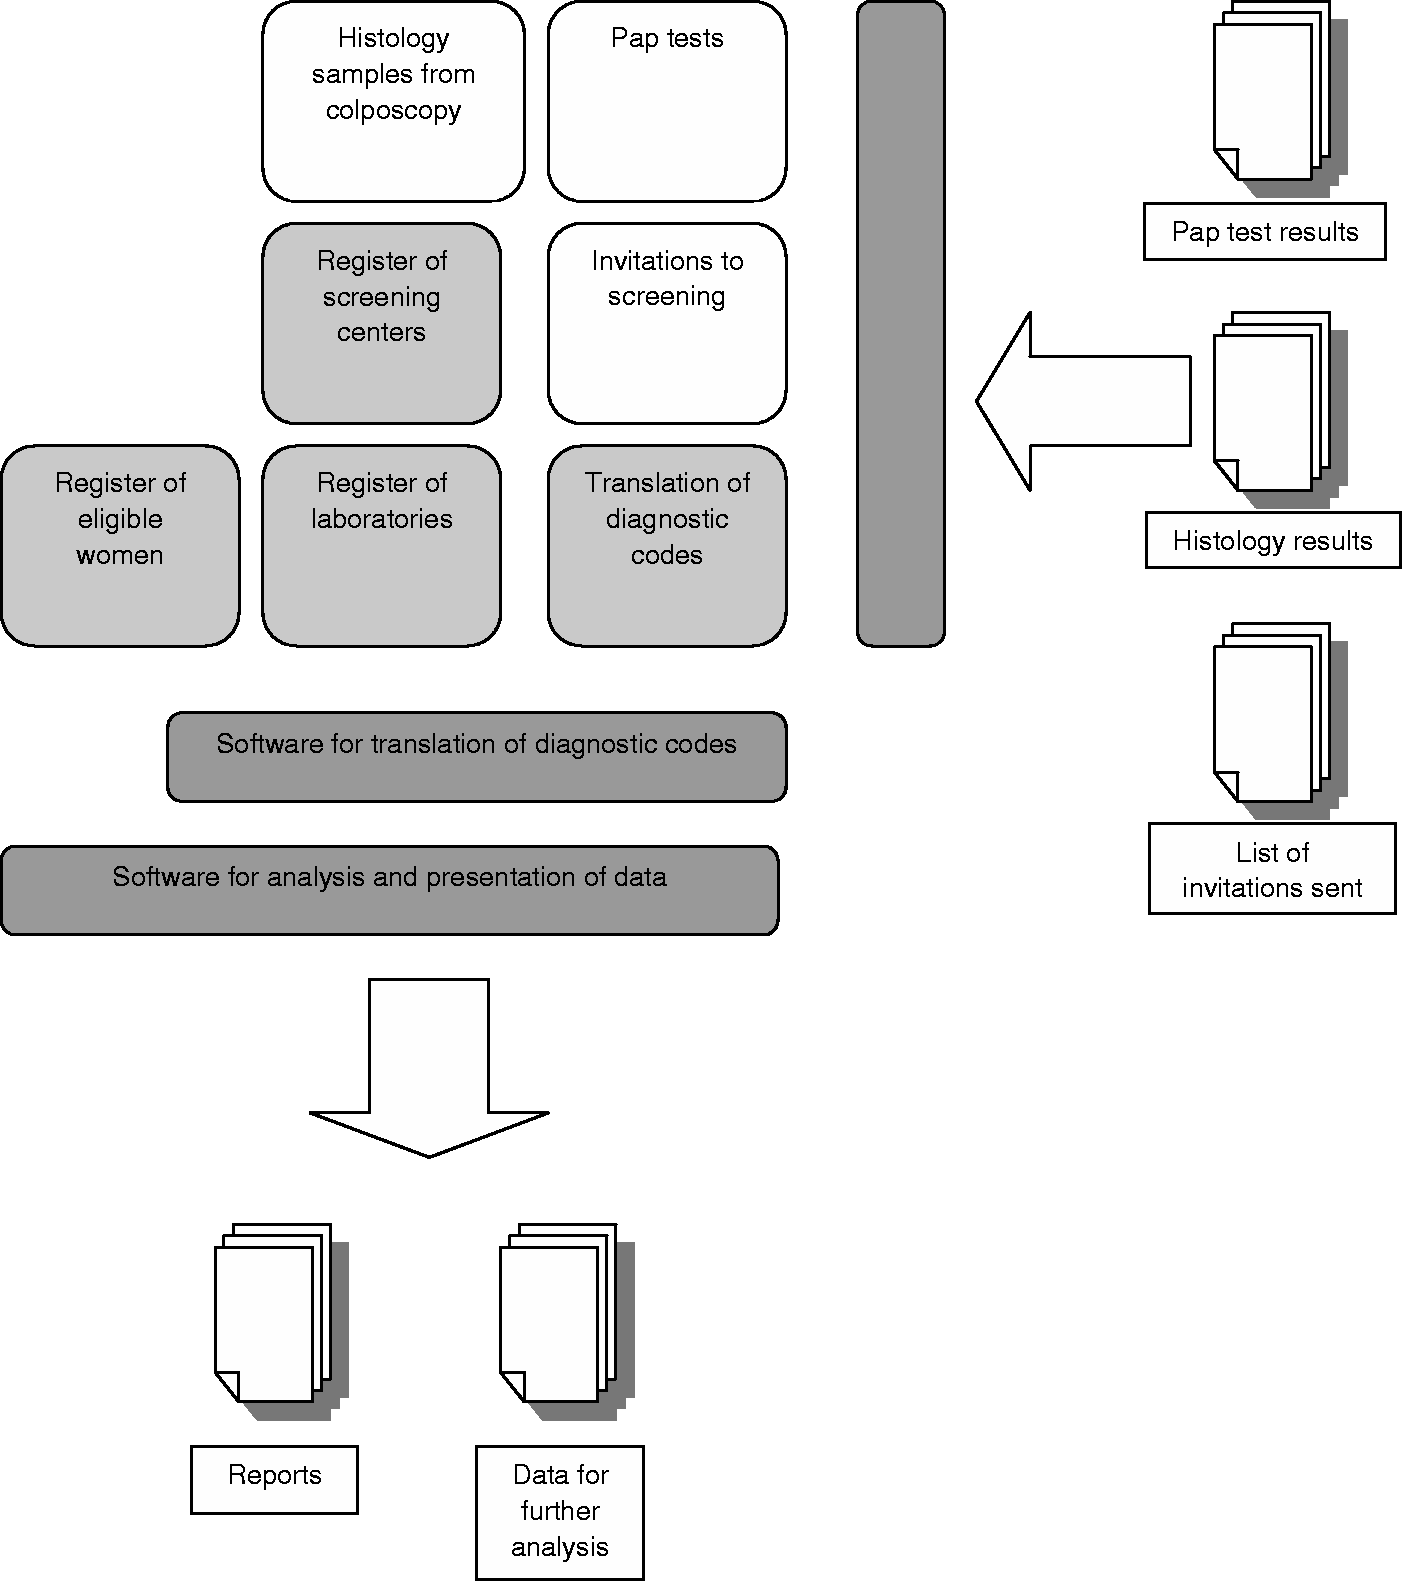
National data collection started in the mid-1990s, but many laboratories were able to provide data dating back to the 1970s. The database holds all cervical cytologies for Sweden from 1997 (Figure 2a), and for all cervical histopathologies from 1998 (Figure 2b). Collection of data on invitations started much later and several regional programmes had not saved the older data on invitations, but from 2008 the registry is complete (Figure 2c).
(a) Complete (100%) cytology data in the registry, by calendar year and reporting laboratory. The three lines that become one line at the bottom denote that three laboratories in the Stockholm region were fused into a single laboratory in 2005. (b) Complete histology data in the registry, by calendar year and reporting laboratory. The three lines that become one line at the bottom denote that three laboratories in the Stockholm region were fused into a single laboratory in 2005. (c) Complete data on invitations to screening in the registry, by calendar year and reporting regional screening programme. The five lines that become one line in the middle denote that five invitation-issuing units in Western Sweden started reporting data on invitations via a joint regional database in 2013.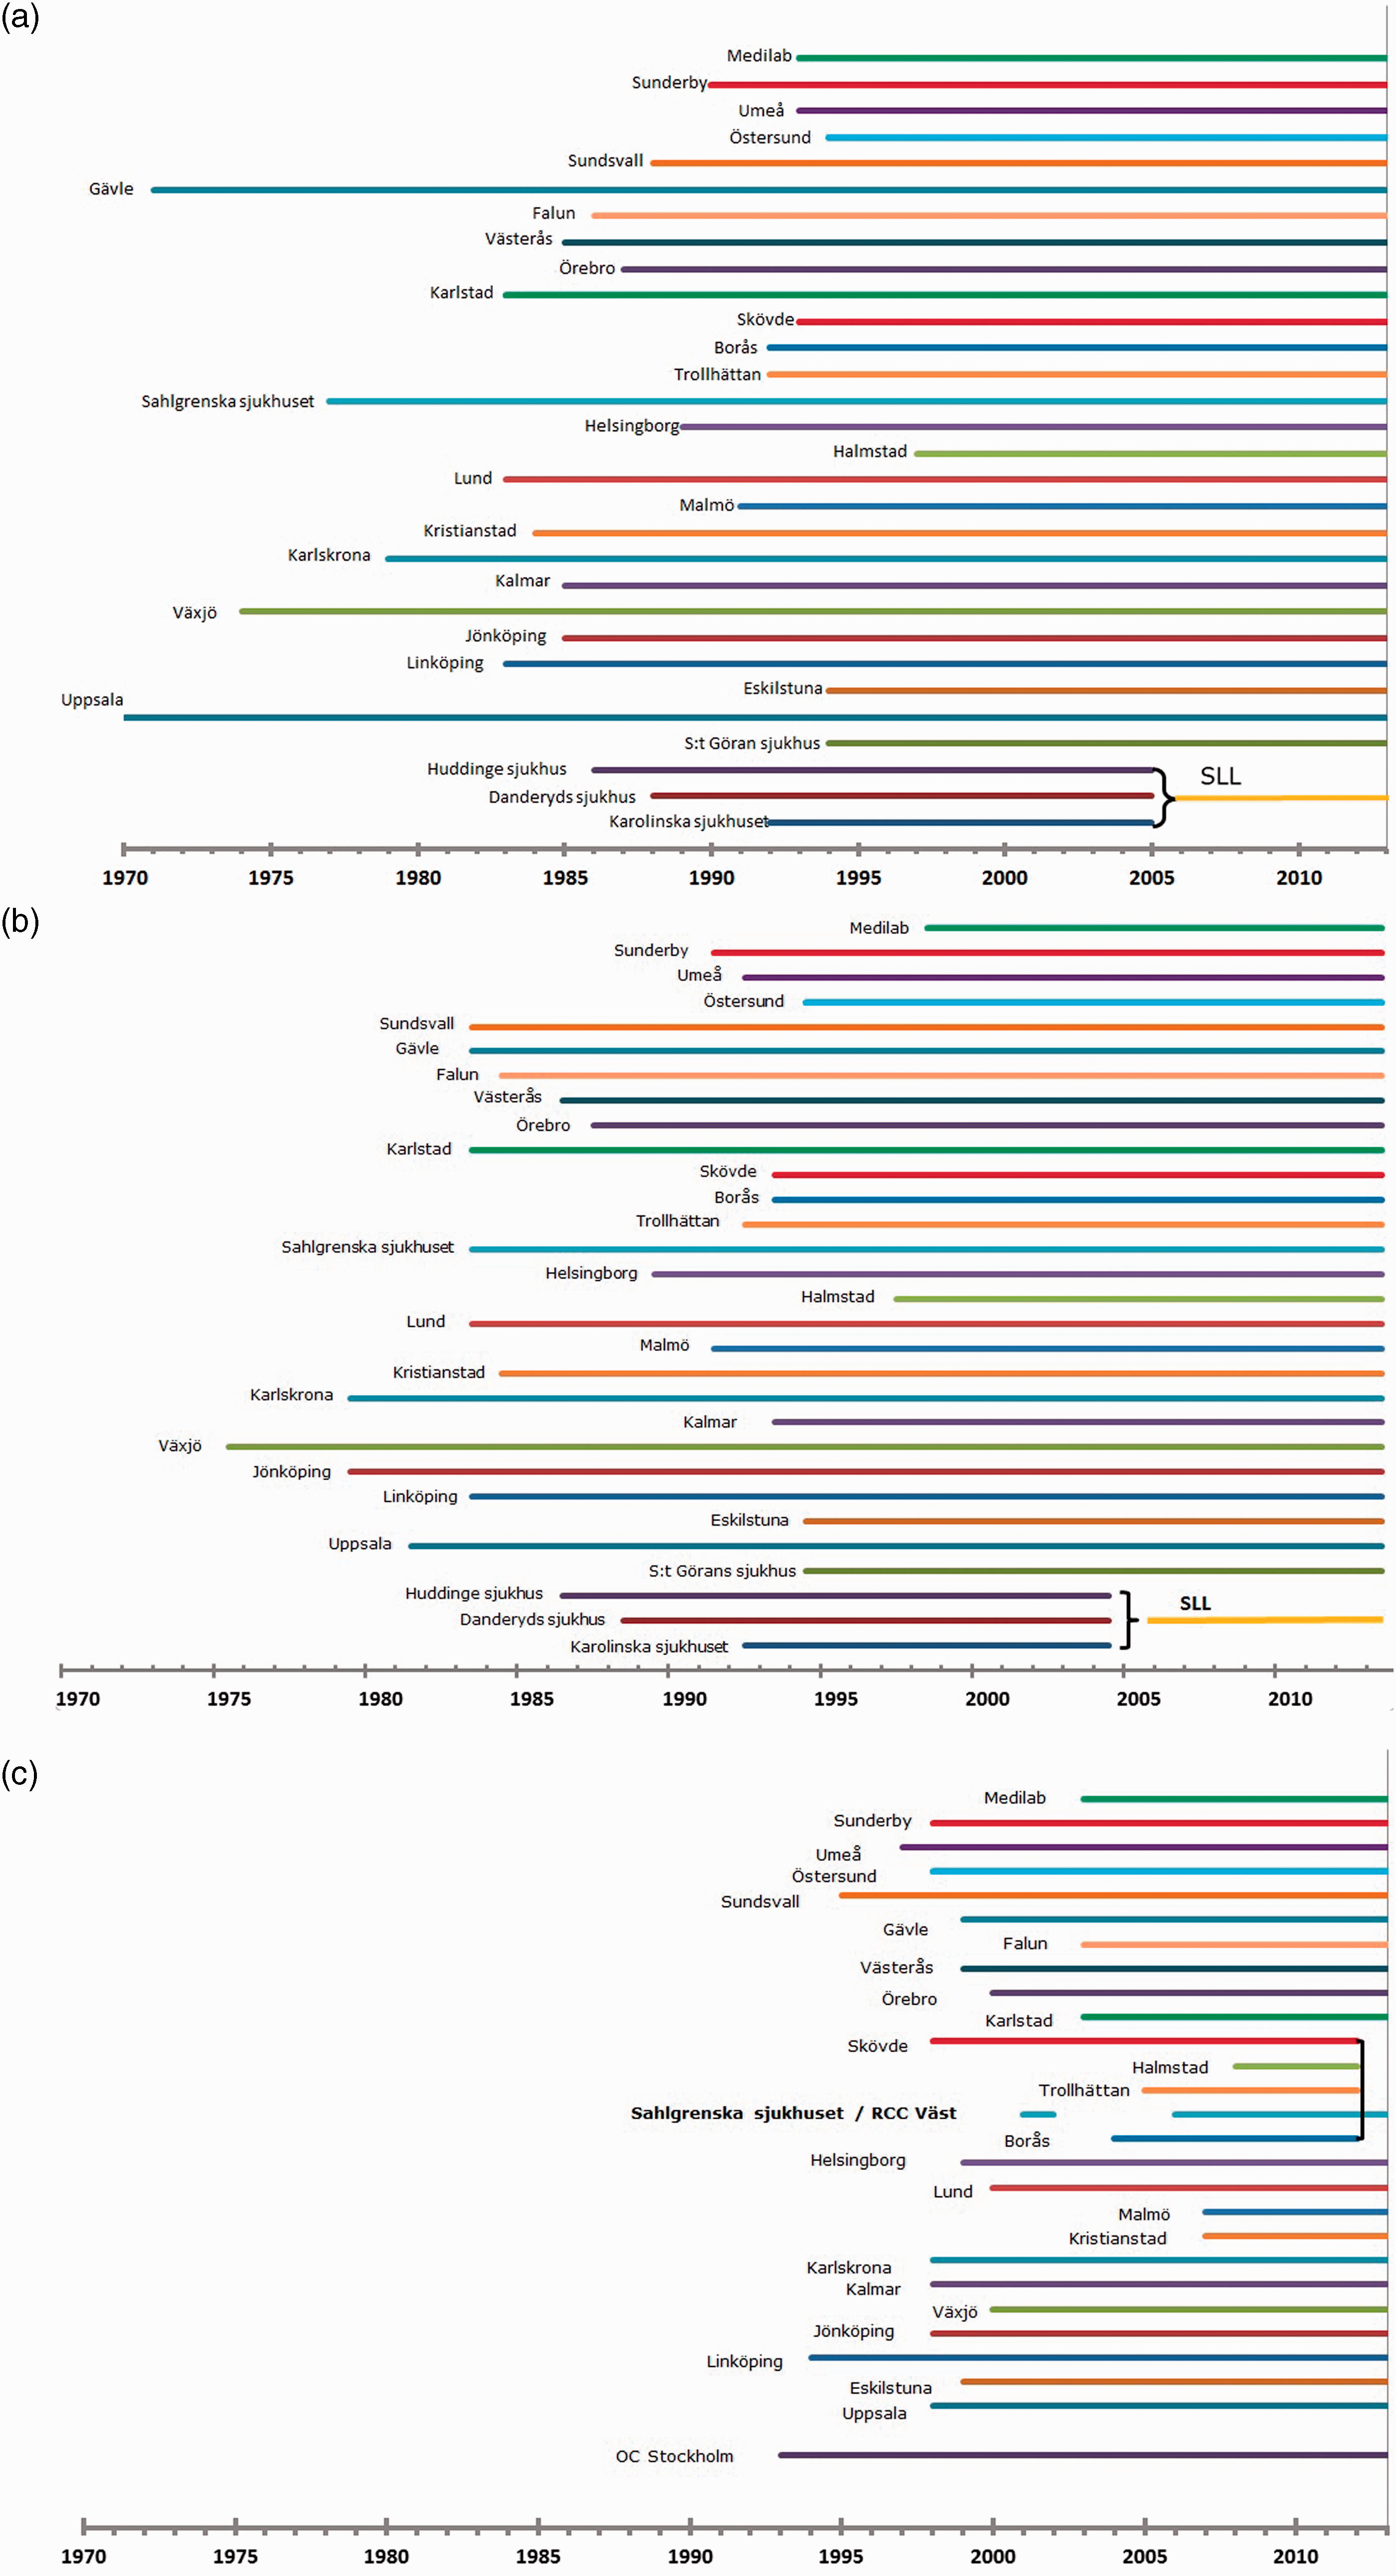
Information on women in the target population in the catchment area is drawn from the population registry. This information is linked to the screening registry, and women are individually invited by letter to screening with a (rebookable) specified time and location. Information on opportunistic screening is integrated into the call and recall system so that women are invited to screening once the age-specific interval has passed since the last smear was taken (three years for women aged 23–50 and five years for age 51–60). Screening is carried out at maternity care centres and samples are taken by midwives.
Results
Number of cervical samples and proportion of organized smears
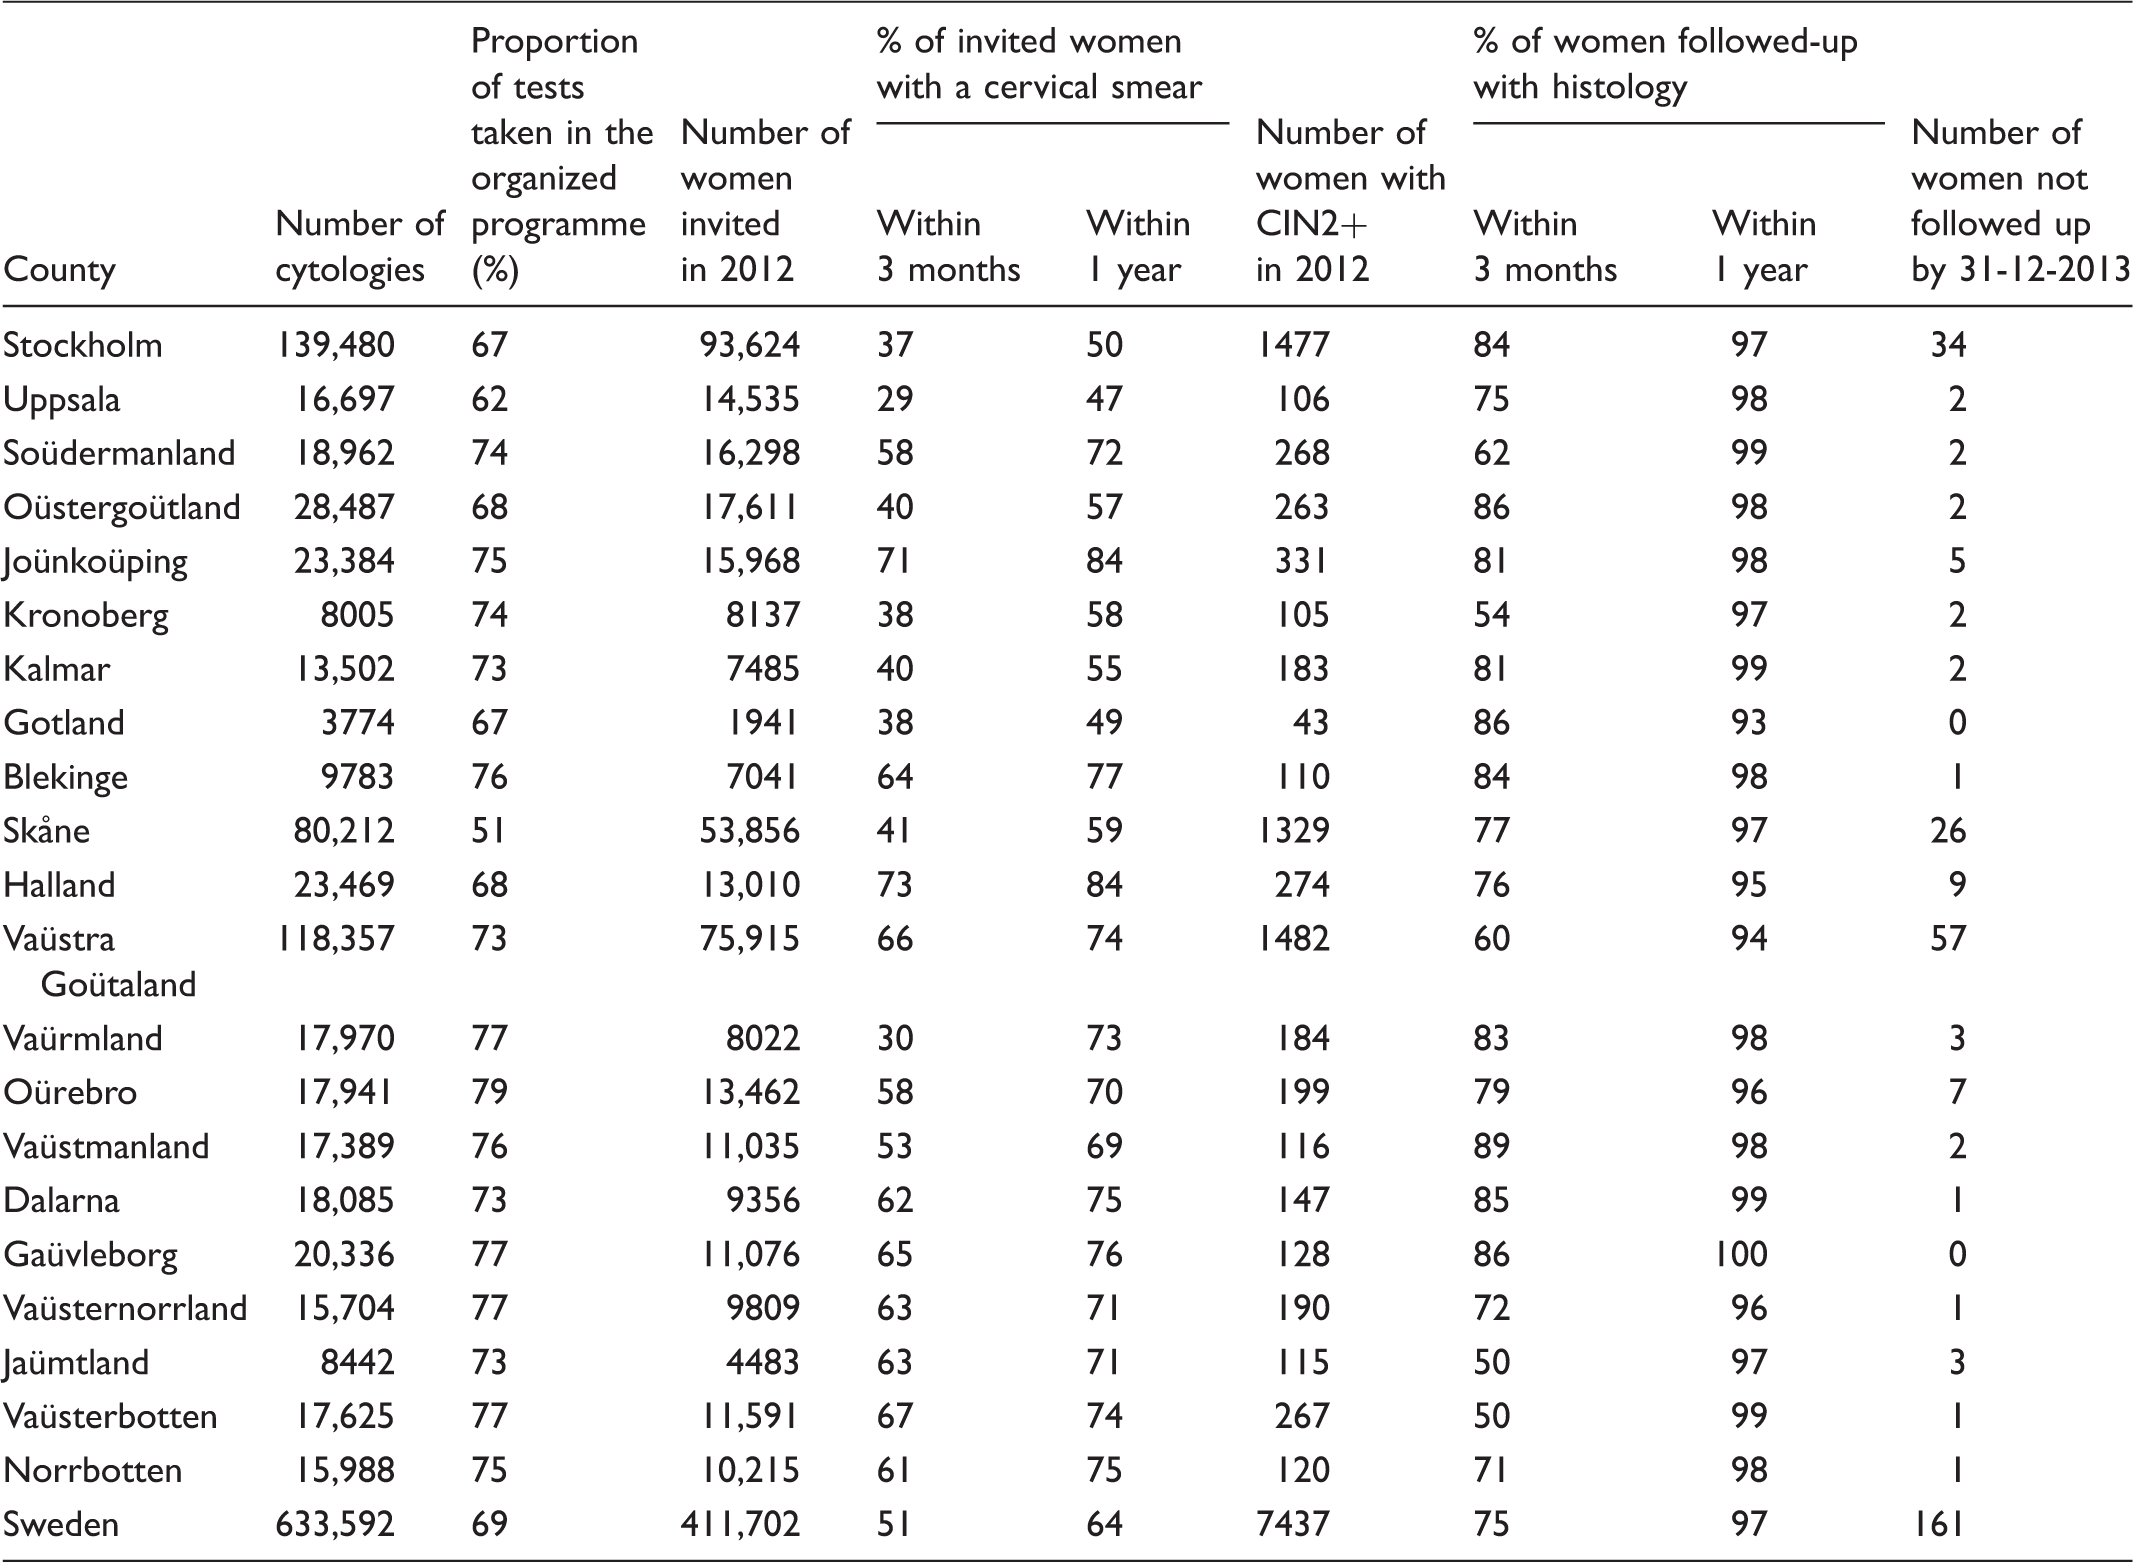
Number of cervical smears, proportion of organized smears, participation after invitation to screening and follow-up of high-grade cytological abnormalities (CIN2+) with biopsy in 2012–2013 by county and nationally in 2013 (age 23–60 only).
Participation after screening invitation among women aged 23–60
The quality indicator (QI) “participation following invitation” is useful to rapidly obtain feedback on, for example, whether improved invitations or improved accessibility to the screening have resulted in increased participation. Participation within one year after invitation was calculated as the inverse of the survival function (1-probability not to participate) using the Kaplan–Meier method, showing the cumulative proportion of women who have had a screening test following invitation. Invitations are classified as either primary invitations or reminders, by analyzing whether another invitation had been sent during the last three years or not. This QI is calculated using only the primary invitations as the denominator. All invitations that were issued within less than three years (for women aged 23–50) and five years (for women aged 51–60) were classified as reminders, and were excluded. All screening tests completed after the invitation was issued are included in this QI. Participation after invitation (both within three months (90 days) and within one year (365 days)) varies greatly between counties, and correlates well with the population test coverage (Table 1).
Follow-up of high-grade cytological lesions
Follow-up of high-grade cytological abnormalities with colposcopy and biopsy is important, as a measurable proportion of women with invasive cervical cancer have had cytological abnormalities that had not been followed up. 5 The proportion of cancer cases with a screening history of abnormalities differs between different countries, implying that it should be possible to prevent these cancer cases in well-organized programmes with adequate follow-up of cytological abnormalities. The Swedish Society of Obstetrics and Gynecology recommends that a smear test result of CIN2 or worse (CIN2+) should be followed up with colposcopy and biopsy within three months of diagnosis. The registry-based follow-up was performed in the national database to include biopsies taken in other counties (e.g. if the woman moved after her CIN2+ smear). The cumulative proportion of CIN2+ smears that were followed with a biopsy anywhere in the country was calculated as the inverse of the survival function (1-probability of not having a biopsy) using the Kaplan–Meier method. Overall, 75% of all cytologies with CIN2+ were followed up with a biopsy within three months, and 97% within one year. The proportion of CIN2+ cytology diagnoses followed-up within three months varied greatly between counties (Table 1). The absolute number of women who had a CIN2+ smear in 2012 that had not been followed-up by biopsy before 31 December 2013 (follow-up 12–24 months, average 18 months) was 161 (Table 1).
Test coverage by target age group and for different lengths of follow-up
The national recommendations state that women aged 23–50 should be offered screening every three years and women between the age of 51 and 60 every five years. Test coverage is the number of women in a particular age group and geographic region that have taken a cervical smear test within a defined period of time, divided by the average population of women in the same age group, region, and time period. All smears are included, regardless whether they were taken within the organized programme. The regional screening programmes import data files from a) the population registry, and b) the regional cytology laboratories, and then issue invitations with appointments for screening when three years has passed since the last screening test (or five years for women aged 51–60). Therefore, most women have their smear after receiving their invitation (i.e. most women take the test slightly after the three and five year interval has passed). International guidelines recommend computing the test coverage after an additional half a year has passed. 2 For each woman with a cervical smear, the follow-up time from her last smear to 31 December 2013 (follow-up period) was calculated. The number of women with smears was then added up by age group, follow-up period, and region. The denominator used was the average population for each age group and region over the next three, four, five, or six-year period (as population statistics are reported by calendar year). In 2013, coverage among women aged 23–50 was 74% for three years of follow-up, 80% for 3.5 years, 84% for four years, 89% for five years and 92% for six years. For women aged 51–60, coverage was 79% for five years, 82% for 5.5 years and 87% for six years (test coverage by target age group and follow-up time is posted at www.nkcx.se). A few counties do not invite according to national recommendations. Two counties invite women aged 51–60 every three years. The national measurements were made in an identical manner and did not take possible differences in local invitation practices into account. In summary, less than 10% of Swedish women had not taken a smear within the previous six years.
Coverage by county, age 23–50 and 51–60
Cervical smears were assigned to the county where the sample taker was located. If the sample taker location was unknown, samples were assigned to the county of the laboratory. As the regional population statistics are calculated from the residents registered in each county, and a laboratory sometimes may analyse smears from women non-resident in the county where the laboratory is located, the numerator (number of smears) and the denominator (the female population in the county) may not fully represent the same population when coverage per county is calculated. Laboratories in Sweden typically have a specific regional uptake area, but one (Medilab) analyses cervical samples from several parts of the country. For samples from Medilab, we consistently use the location of the smear taker. The European Union has recommended that cervical screening coverage should be 85% or higher. 1 Sweden's national cancer strategy 6 also states that the aim for population test coverage should be 85%. However, conditions for achieving high coverage differ between regions (e.g. urban and rural areas), which need to be considered when comparing coverage between different counties. The trend over-time for the same county may be more informative. Coverage was 85% or higher for women aged 23–60 in nine Swedish counties. The coverage for the country was 80% for the age group 23–60 (test coverage by county is posted at www.nkcx.se).
Coverage by region, 2003–2013
Test coverage for Sweden has been stable over the past 11 years, but coverage has varied considerably in several counties. Coverage over-time among women aged 23–60 is presented for each county. In the northern Swedish counties of Jämtland and Norrbotten, the coverage has been consistently at 85% or above. Coverage in Västerbotten was lower than the national average until 2007, after which it began to increase steadily and became comparable with the other northern counties in the past two years (Figure 3a). The coverage in Dalarna is consistently around 90%. Örebro and Västmanland counties first had a decline, but recovered in 2013. Värmland decreased from about 85% to 80% in 2009, and then steadily increased to nearly 90% in 2013. In Sörmland, the coverage fell drastically after 2007, from about 80% to a level that was the second lowest in the country over 2009–2011. Since 2012, there has been a dramatic increase (more than seven percentage points per year) in coverage, and in 2013 Sörmland was at the national average again. Coverage in Uppsala is consistently the lowest in Sweden. There was a declining trend after 2007, but since 2011 the coverage has stabilized around 65% (Figure 3b). Coverage in Stockholm declined in 2006, but has since recovered to a level of around 75% (Figure 3c). In the Gothenburg region (Västra Götaland), coverage increased from below 80% to well above 85%, increasing by a few percentage points per year since 2010. In Halland, the coverage was relatively constant just above 80%, and then increased to approximately 90% for the four years leading to 2013 (Figure 3d). Kalmar and Jönköping in the southeastern region have been well above 80% throughout the period. Östergötland fluctuates around 80%, with a decreasing trend since 2009 and then stabilization at just above 75% (Figure 3e). Kronoberg in the southern region had a clear decrease in the last five years of the period. In the southern county of Skåne, there was an increase to reach the national average from 2007 to 2010, and then a decrease again in the following three years (Figure 3f). In most cases, increasing coverage in a county was associated with known improvements in the organization of the programme.
(a–f) Population coverage of the screening test by region over the years 2003–2013. Sweden is organized in 21 different counties, where each county is running an organized programme in need of feedback. Each panel displays the coverage over time for 2–7 counties/panel. The coverage over time for the entire country of Sweden is displayed in each panel, for comparison.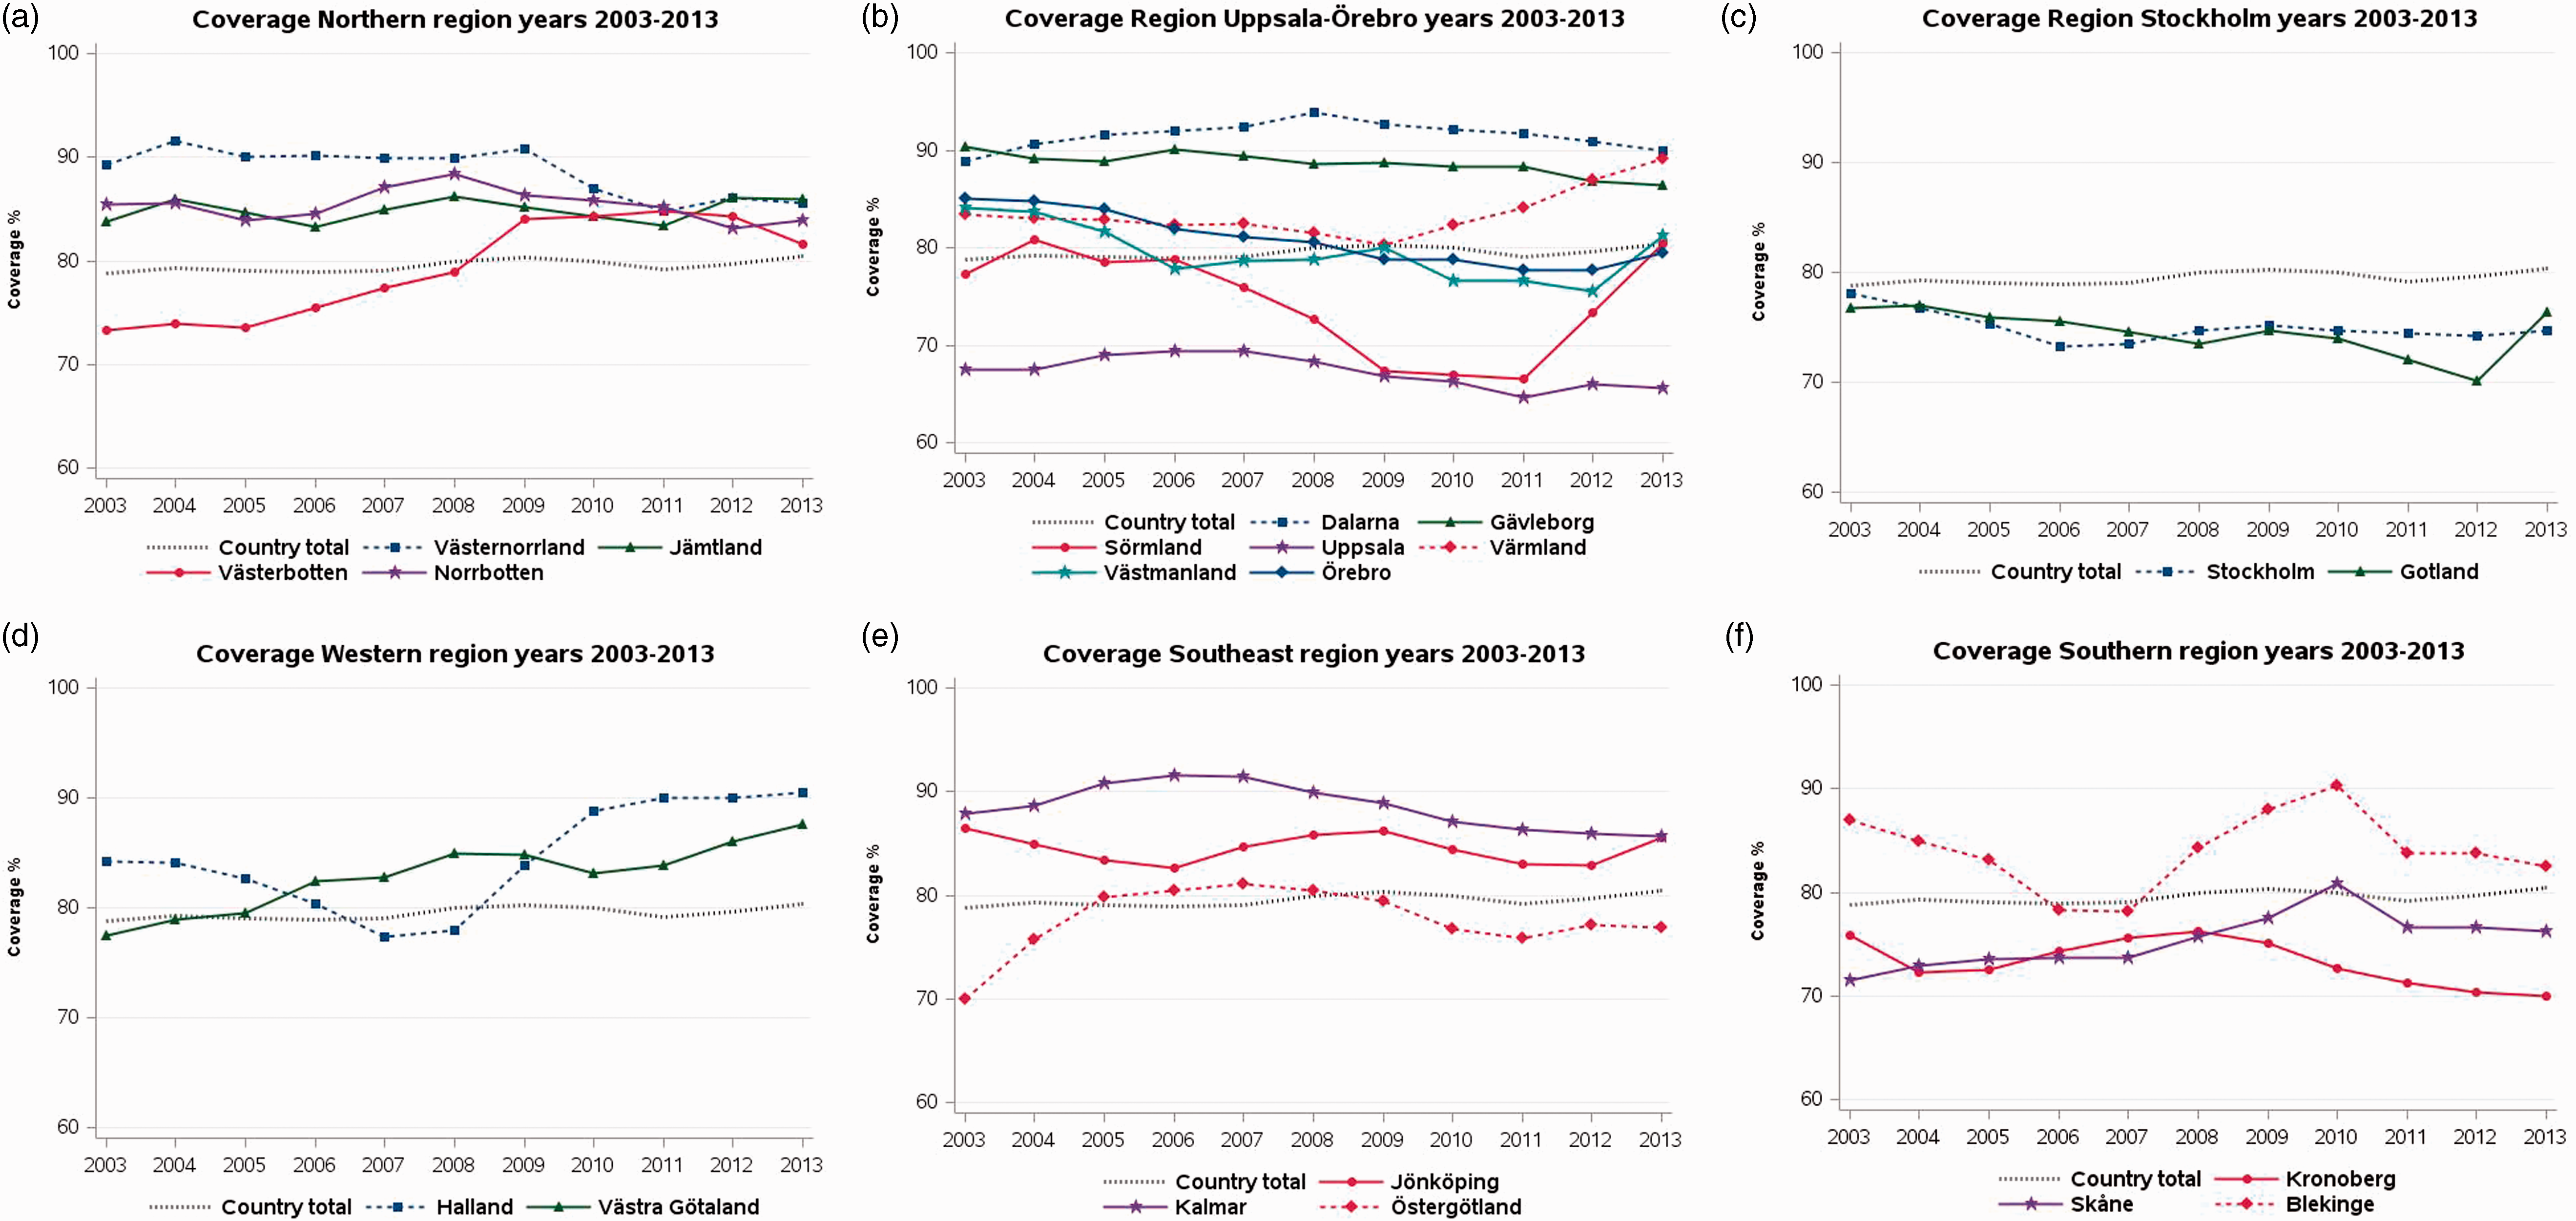
Coverage over the past 15 years by age group
Screening coverage for women aged 23–25 has increased dramatically over the past six years, reaching 87% in 2013, which is higher than any other age group. While the reason for this increase is unknown, it coincides with the introduction of human papillomavirus (HPV) vaccination in Sweden, and may conceivably result from increased attention given to cervical cancer prevention in general. The increase is accentuated from 2012, when free HPV vaccination in schools was introduced for girls aged 10–12, with a catch-up for girls aged 13–18. Only minor changes in other age groups were seen (Figure 4).
Population coverage of the screening test in Sweden during 1999–2013, by age.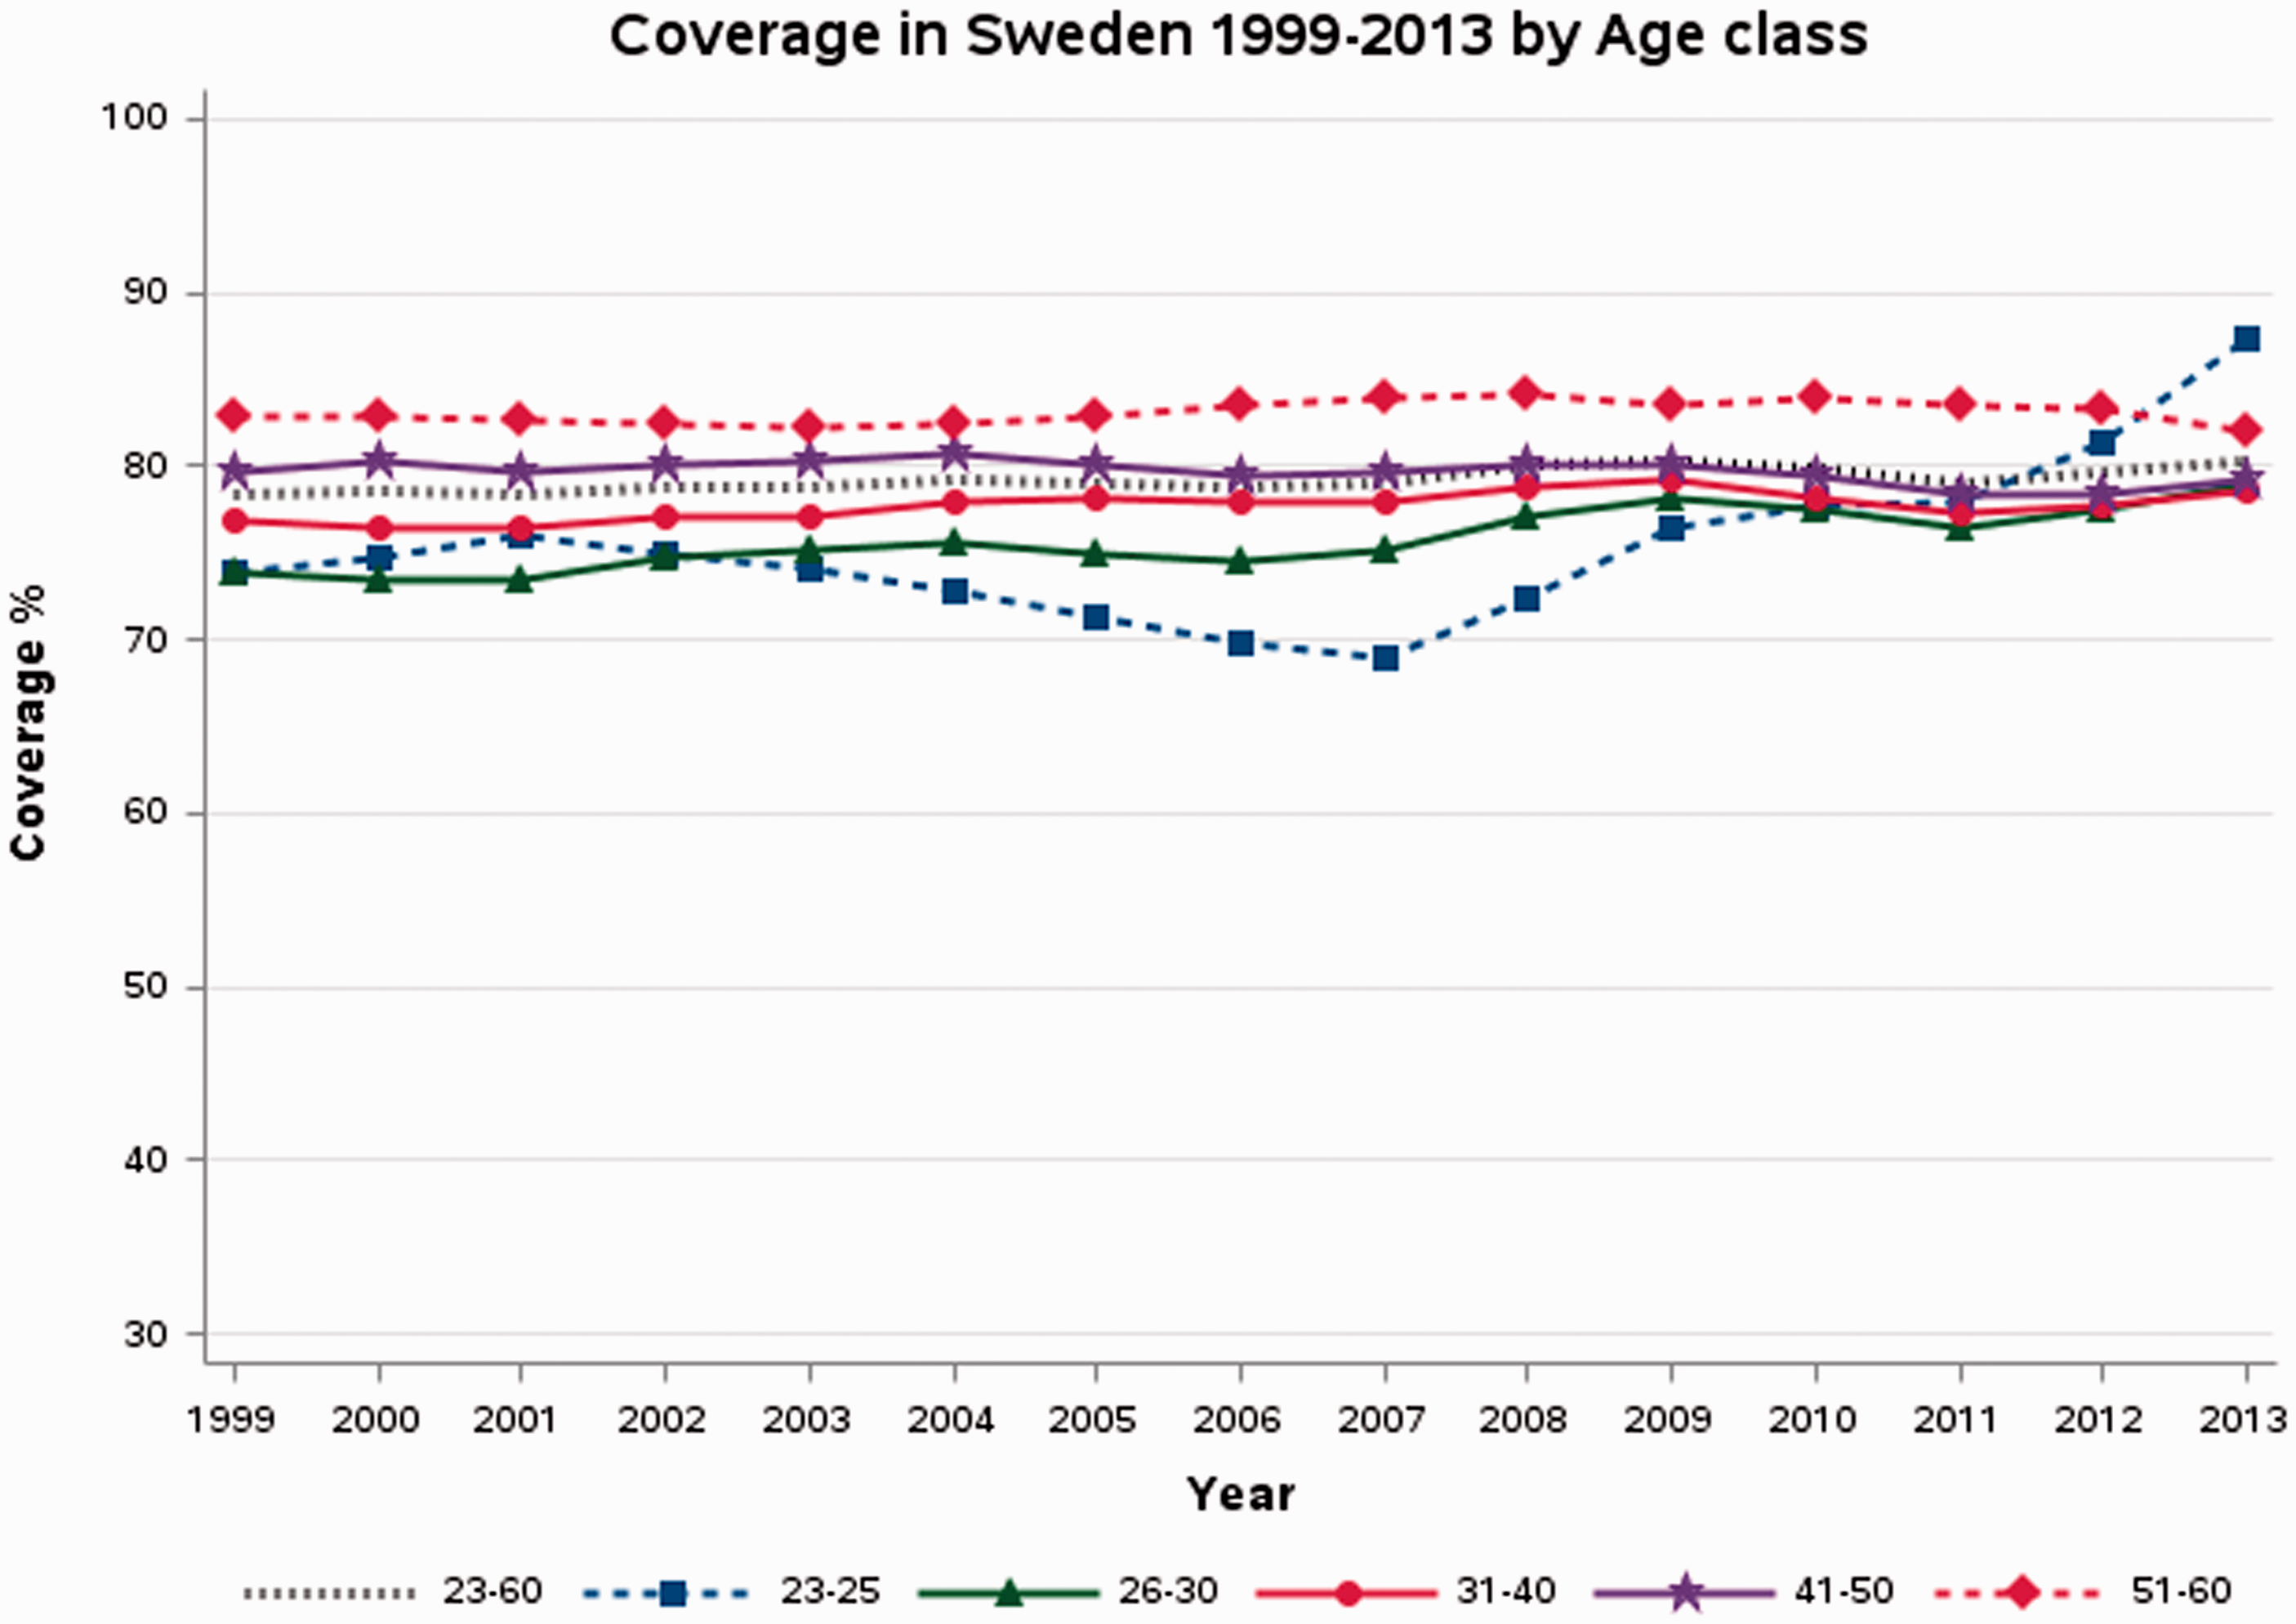
Diagnostic profile
Only 2442 of the 683,933 cytological samples taken in 2013 had a diagnostic code that could not be interpreted. The diagnosis codes for “koilocytosis” and “poor sample” are not reported, as use of these terms is not recommended (samples should be classified as either adequate or inadequate). Approximately 91% of samples were cytologically normal. There was a strong increasing trend over-time in the proportion of cytological samples with a diagnosis of ASCUS, CIN1 and CIN2 (Figure 5a). This can only partly be attributed to the switch to liquid-based cytology. As the burden on gynaecology clinics for follow-up is increasing, there is an increasing need to optimize the management of these women. A slight increase in cytological CIN3 can also be seen (Figure 5a). The proportion of cytological samples with atypia in cells of unclear origin has decreased, which is in line with current recommendations that cells should be classified as either squamous or glandular (i.e. ASCUS or AGUS) (Figure 5b). Monitoring diagnosis profiles over time contributes to our understanding of the effect of changing underlying risk in the population (and corresponding impact on referral needs) and switching test methods, and allows us to evaluate changes in registration policies.
(a–d) Diagnostic profile (proportion of analysed smears with different diagnoses) for 2007–2013 (Sweden, all laboratories together), overall number of smears with each diagnosis in 2013 given below the figure. ASCUS n = 27,446; AGUS n = 1063; CIN1/LSIL n = 16,108; adenocarcinoma/AIS n = 175; CIN2 n = 5907. Atypia in cells of uncertain origin n = 792. CIN3 n = 2864. Malignant neoplasm of uncertain origin n = 6. Inadequate n = 4437. Benign n = 621,657. Squamous cell carcinoma n = 65. Endocervical cells lacking n = 68,167.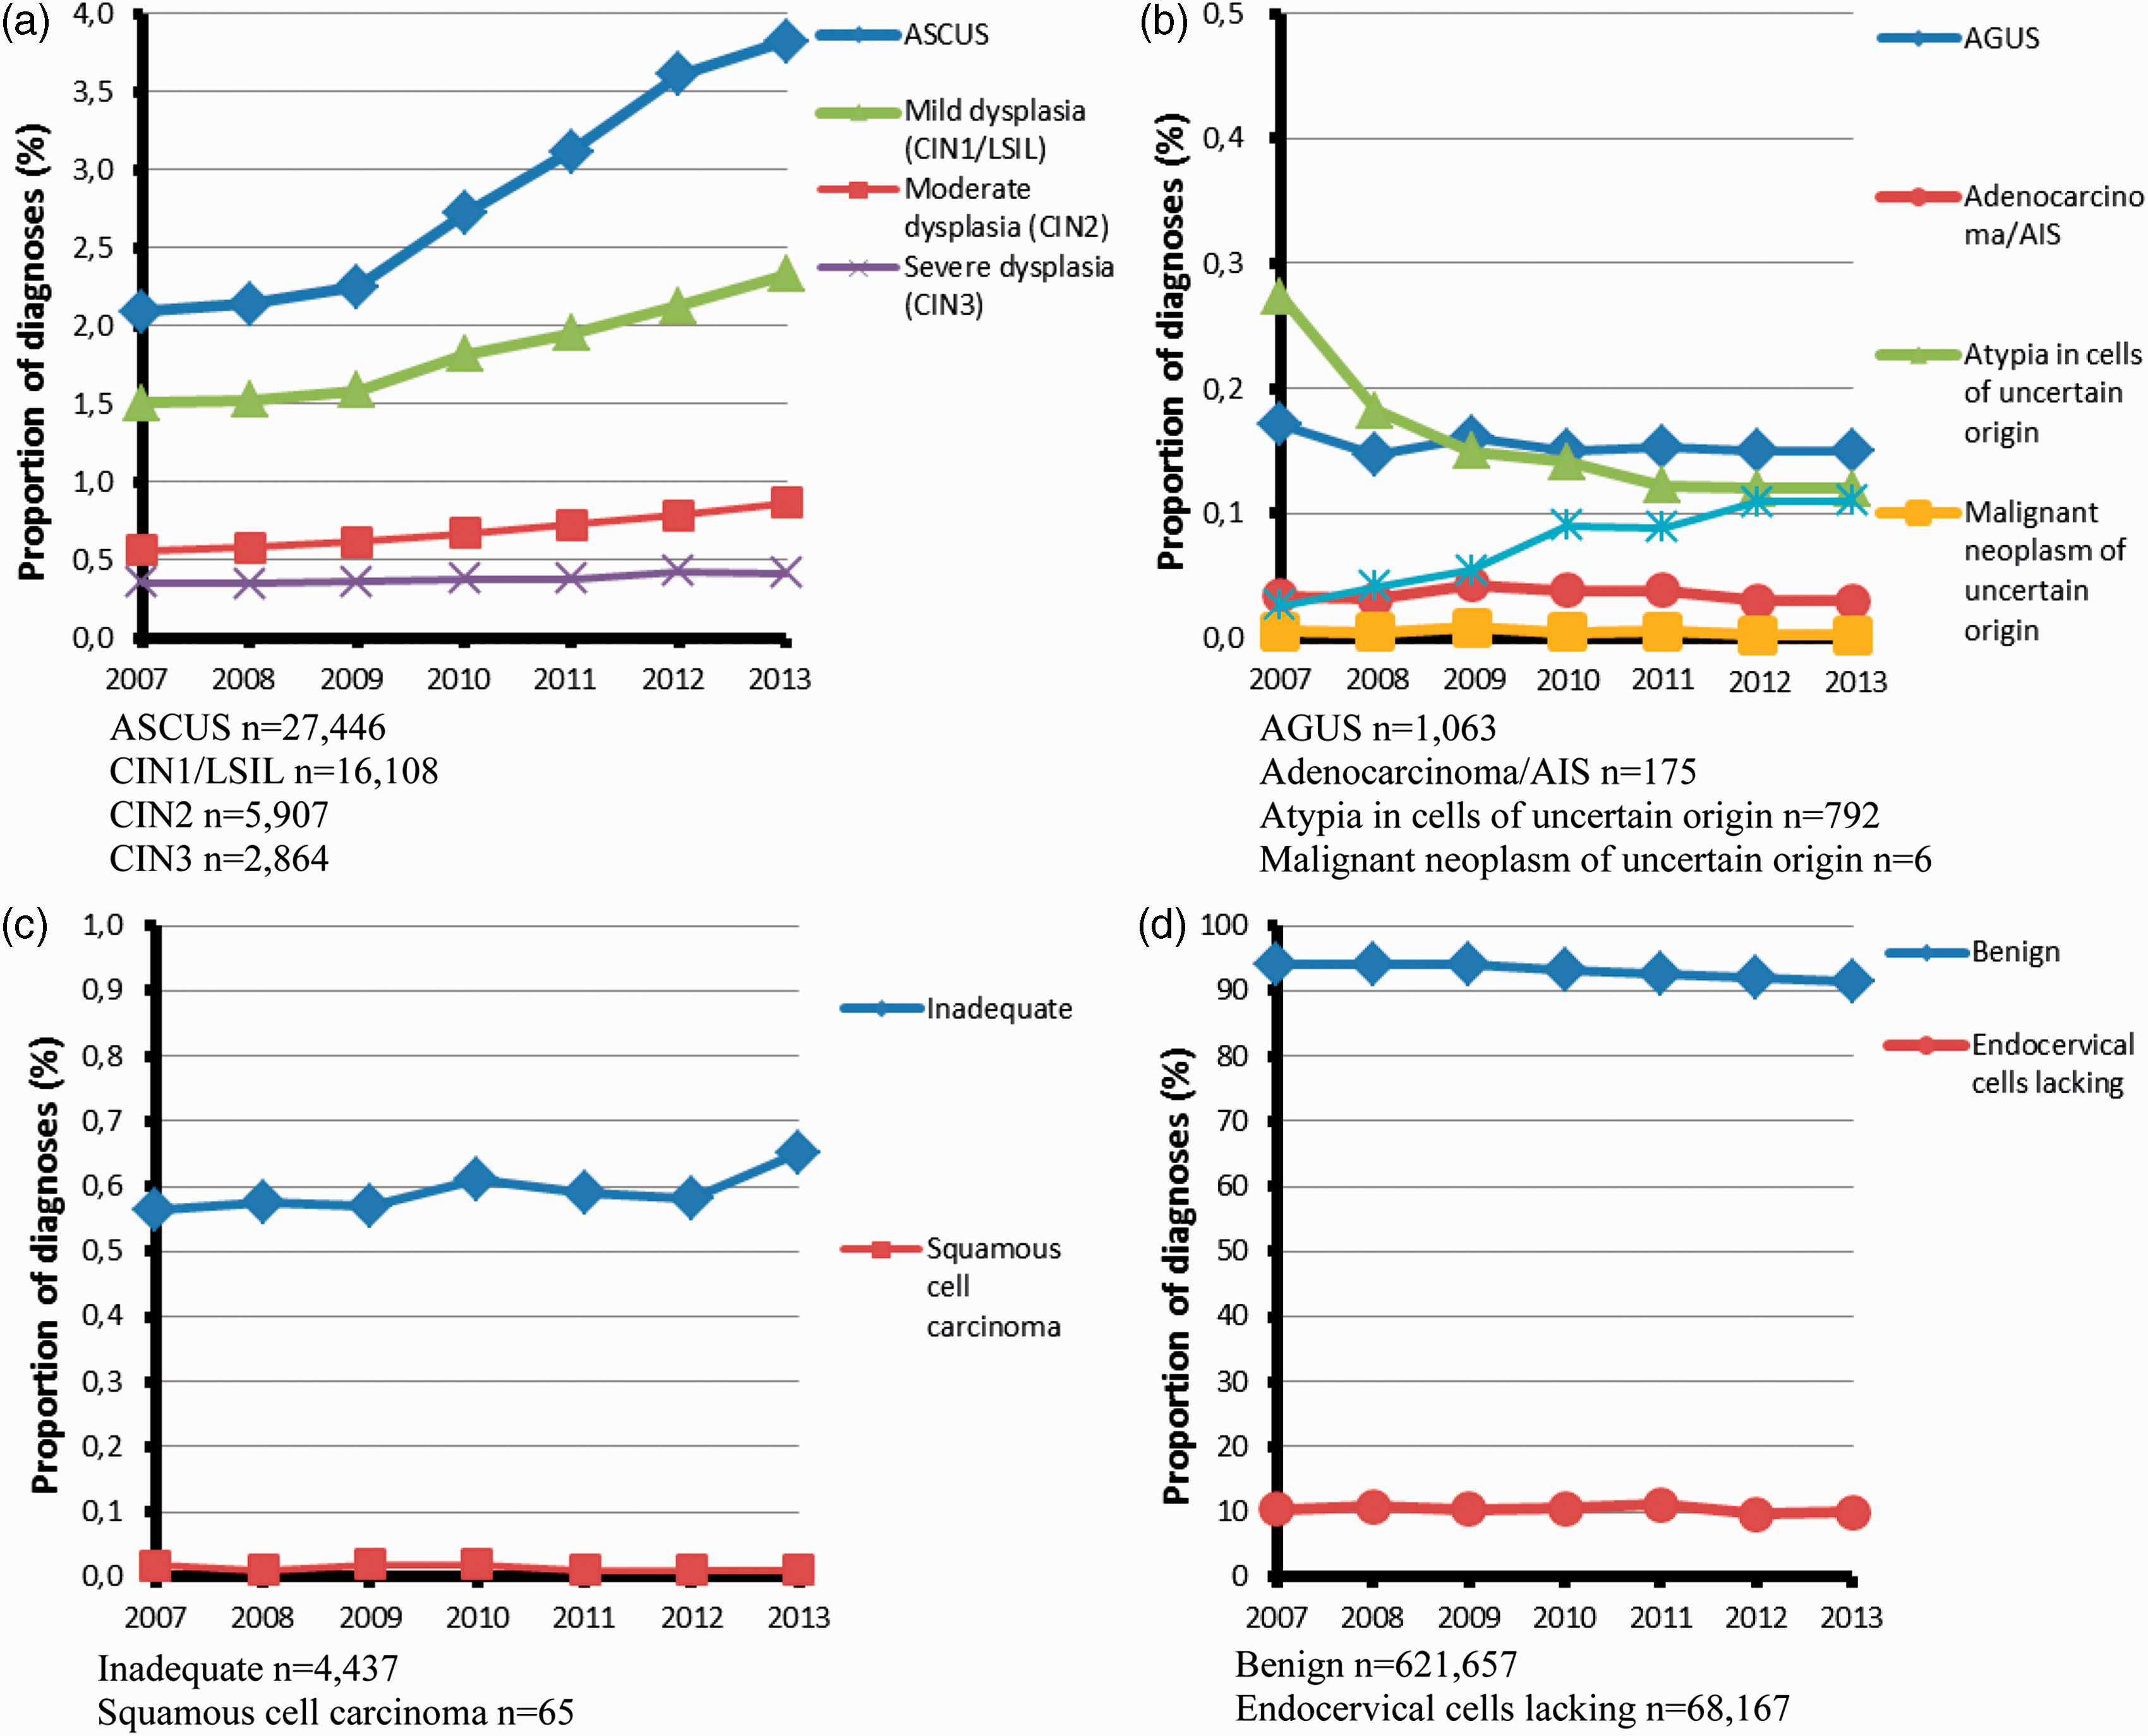
Quality of reported SNOMED codes
To ensure patient safety, use of standardized codes is important. CIN terminology is used for diagnoses in Sweden and the SNOMED code system is defined by Swedish Association for Clinical Cytology (for a description of codes see: http://nkcx.se/templates/SNOMED_nomenklatur_cervix_cytologi.pdf). Each year, the register has a dialogue with the laboratories to interpret locally used codes that have appeared. In most cases, the codes can be interpreted. For a number of laboratories, however, the diagnostic profile differs from the national average by more than three standard deviations, which could either be the result of differences in local coding, or a real diagnostic problem. There have been examples where the same SNOMED code can indicate different diagnoses in different counties. Under the NKCx QI for use of codes, the number of diagnostic codes used that are in accordance with the recommendation is divided by the total number of different codes used. In 2013, this QI of the SNOMED coding use varied from 3% to 88% among laboratories.
Invasive cervical cancer: Age-standardized incidence rates
The age-standardized incidence of cervical cancer was calculated for each county and for the country as a whole for three time periods (2004–2006, 2007–2009, 2010–2012) as well as the average percentage change in incidence between the three-year periods. The incidence rates are age-standardized using the Swedish population in 2000. Data on invasive cervical cancer were from the National Board of Health and Welfare statistics database and data on the mean female population were from Statistics Sweden.
The age-standardized incidence of invasive cervical cancer at the national level was unchanged during the three time periods, at just under 10 per 100,000 women. However, there are large variations between different counties and in time trends over the periods studied. Two counties were above the national average during all three time periods (range 11.21–13.05 for Uppsala and 10.74–11.46 for Gävleborg), while five counties were consistently below (Jönköping range 4.87–7.98, Kronoberg range 7.21–9.72, Västra Götaland 7.58–9.19, Dalarna range 5.32–8.69, and Västerbotten range 6.88–8.46). The remaining counties fluctuated over the time periods, but few of these trends were statistically significant (p value > 0.05). A statistically significant increase in incidence over the three-year periods was seen in Uppsala (>7% increase per three-year period). In Kronoberg and Västra Götaland, there was a significant decrease per three-year period (approximately −15% and −10%, respectively) (data by county shown in the 2014 report available on the NKCx website). The high and increasing incidence in Uppsala is consistent with low screening coverage for many years, and the decreasing trend in Västra Götaland is consistent with the increasing coverage (Figure 3). The high incidence in Gävleborg is difficult to explain, as screening coverage has been >85% for more than 10 years (Figure 3) and follow-up of cytological abnormalities has been quite high (Table 1). A systematic clinical and histopathologic review of all cervical cancer cases in Sweden during the last 10 years (approximately 4500 cases) is ongoing, and should hopefully provide leads towards an explanation. Big changes in counties with small populations were not statistically significant and may thus be due to random variation. To reduce this problem, NKCx only uses the trend in incidence in three-year periods over the last nine years as QI. However, this slow measure of incidence changes means that even obvious trends can only be seen if there has been a continuous improvement (or deterioration) over a decade or longer. Interpretation of cervical cancer incidence by county should take into account that there may be differences in the background risk. For example, before screening commenced in the late 1960s, the large cities of Stockholm and Malmö had a higher incidence than the national average.
Discussion
Using straightforward processes to obtain and analyse test results and invitations to screening provides a basis for design of incremental improvements of cervical screening programmes. Test coverage was high in our study in comparison with many other countries, 3 and known improvements in organization were associated with strong coverage increases. The cause of the dramatic increase in screening test coverage for women aged 23–25 is unknown, and should be studied further. Resource use was adequate compared with many other countries, 3 as almost 70% of smears were the result of organized invitations. The strong increasing trend in the proportion of cytological samples with a diagnosis of ASCUS, CIN1 and CIN2 requires new guidelines for triage and management strategies that can be used safely with the available resources. Although follow-up of high-grade cytological abnormalities with biopsy was 97% after one year, some variability between counties suggests room for improvement. The cancer incidence QI remained unchanged during the period 2004–2012, but trends were seen in some counties.
Guidelines for monitoring and evaluating screening programmes are outlined in the second edition of the European Guidelines for Quality Assurance in Cervical Cancer Screening (2008) 2 and the 2015 supplements 3 that elaborate on HPV-based screening and vaccination. Organized, population-based screening programmes are operational in an increasing number of European countries, but quality and implementation methods differ.4,7 Evidence from our recent survey of organization and quality assurance in European cervical cancer screening programmes suggests that the majority of countries reporting an organized programme also have a mass screening registry in place, and systematically collect cytology and histology data at the regional or national level. 7 Nearly half of the countries reported collecting opportunistic and organized screening results in a similar manner, which allows for monitoring screening consumption and integration into the call and recall system. 7 The vast majority of countries also publish an annual report for the programme, although often in the local language. 7 Reports from Italy have presented a series of process indicators, including compliance to colposcopy referral, helpful for monitoring follow-up of abnormal results. 8 England has a long history of screening resulting in a strong reduction in incidence, 9 and a well-established quality assurance system7,10 and tradition of auditing.11,12 A decision to nationalize screening in the Netherlands was made in the 1980s and a databank was built to include standardized results from screening, although no annual report is currently published.7,13 The Finnish programme began in the early 1960s 1 4 with screening data dating back to the 1960s (opportunistic screening information is not systematically included in the screening registry), and an annual report is published. 7 There are solid examples of monitoring and evaluation in European programmes, and a significant body of evidence in the literature on specific issues addressed.
We describe the follow-up of cervical cancer prevention efforts using registry data, from data collection to the calculation of a range of QI that can be used for incremental improvements of programmes. Examination of QI at the county level and over-time was more informative than mere reporting of the national average. Detailed and consistent registry-based monitoring and evaluation of programme QI can provide a reliable evidence base for prioritization and evaluation of improvement strategies.
Footnotes
Acknowledgements
Declaration of conflicting interests
The author(s) declared no potential conflicts of interest with respect to the research, authorship, and/or publication of this article.
Funding
The author(s) disclosed receipt of the following financial support for the research, authorship, and/or publication of this article: the Swedish Association of Local Authorities and Regions (SKL) and the Swedish Foundation for Strategic Research (SSF).