
Abstract
Background
The importance of cancer screening is well-recognized, yet there is great variation in how adherence is defined and measured. This manuscript identifies measures of screening adherence and discusses how to estimate them.
Discussion
We begin by describing why screening adherence is of interest: to anticipate long-term outcomes, to understand differences in outcomes across settings, and to identify areas for improvement. We outline questions of interest related to adherence, including questions about uptake, currency or being up-to-date, and longitudinal adherence, and then identify which measures are most appropriate for each question. Our discussion of how to select measures focuses on study inclusion criteria and outcome definitions. Finally, we describe how to estimate different measures using data from two common data sources: survey studies and surveillance studies. Estimation requires consideration of data sources, inclusion criteria, and outcome definitions. Censoring often will be present and must be accounted for.
Conclusion
We conclude that consistent definitions and estimation of adherence to cancer screening guidelines will facilitate comparison across studies, tests, and settings, and help to elucidate areas for future research and intervention.
Introduction
The importance of cancer screening is well-recognized, yet there is no consensus on how adherence should be defined and measured. Based on work by the International Cancer Screening Network, Bulliard et al. 1 published a review of cancer screening participation definitions and measures, focusing primarily on participation in a single round of screening, and noting that measures of participation across multiple rounds of screening are complex and in need of further research. We build on this work by Bulliard et al. by considering in more detail measures not only of one-time screening participation, as are often used by national screening programmes, 2 but also of long-term adherence.
Methods
We aimed to describe definitions and measures of adherence appropriate for answering different questions, and to specify how to estimate these measures. We first define adherence and describe reasons why adherence may be of interest. We review questions of interest regarding adherence, measures that allow us to quantify the answers to these questions, and statistical methods for estimating these quantities. Throughout, we identify strengths and limitations of alternative data sources for answering different questions, and discuss their ability to estimate different types of measures related to adherence.
Discussion
What is adherence?
In the context of cancer screening, adherence has several dimensions because recommendations are usually multi-faceted. Recommendations often include guidance on starting and stopping ages, types of screening tests, and frequency of screening. A person may be adherent to some aspects of a cancer screening recommendation, but not others. This article focuses on selecting measures of cancer screening adherence based on the question of interest. We first frame this discussion by addressing why adherence matters.
Why do we care about adherence?
To anticipate long-term outcomes
An underlying assumption in studying screening adherence is that better adherence leads to better outcomes. In the context of an intervention or programme, studying adherence may help to anticipate potential benefits before long-term outcome data are available. It will often take years for an effect on cancer mortality, or even incidence, to manifest itself. An early sign that an intervention may be working or failing is whether people undergo screening as intended; adherence is necessary, but not sufficient, for screening to be effective.
To understand differences across settings
The effectiveness of cancer screening interventions, programmes, recommendations, or guidelines depends, in part, on the level of adherence in the population in which the intervention takes place. Generalizability of results to other settings depends, in part, upon comparable levels of adherence. For example, a screening recommendation that reduces cancer mortality when adherence is nearly 100% would not be expected to be as effective in a setting where only 50% of the population was adherent. Measuring adherence may help to explain why the effectiveness of screening varies across settings.
To identify areas for improvement
Measuring adherence may also help identify opportunities to develop interventions and programmes that reduce disparities. If one group is more adherent to an intervention than another, or an intervention elicits better adherence in one setting than another, we can learn where there is room for improvement and greater equity.
How are data on adherence collected?
The way in which data are collected influences the types of adherence questions that can be answered. For the purposes of this discussion, we consider two data sources common in studies of cancer screening: surveys and surveillance.
Survey data
Healthcare delivery systems, health departments, medical clinics, and research studies often administer surveys. A common feature of surveys is that they can assess past cancer testing behavior and sometimes diagnoses of specific cancers. They may be administered once or multiple times. A recent example of a survey used to assess cancer screening adherence was reported in Morbidity and Mortality Weekly Reports (MMWR). 3 The authors used cross-sectional data from the 2013 National Health Interview Survey (NHIS) to determine what percentage of patients was up-to-date with testing for different cancers. The interview included questions about type and timing of different tests to detect cancer, as well as ages at diagnosis with specific cancers. 4 MMWR reported the percentage of persons that had been tested within the recommended interval (e.g. mammography within the past 2 years) in the period prior to survey administration.
Surveillance data
For the purposes of this article, we consider surveillance data to be information on cancer screening and tests recorded in real-time (or close to real-time). These data may be available in medical records, administrative databases, or screening programme databases. One key feature of surveillance data—as defined for our purposes—is that they do not rely on recall. Most countries with screening programmes use this kind of data to monitor screening participation.2,5–8 As an example, in 2013, Green et al. published results from a randomized controlled trial (RCT) based on data from an electronic health record (EHR). 9 The four-arm trial compared interventions to increase colorectal cancer screening. The outcome—a binary indicator of being up-to-date for testing in both years following randomization—was based on colonoscopy procedure codes and laboratory fecal occult blood tests in participants’ EHR, recorded as they occurred.
What kinds of questions can we ask about adherence?
For simplicity, we focus on three categories of questions about adherence: (a) questions about screening uptake, i.e. first-time screening after the inception of an intervention or becoming eligible to screen; (b) questions about being up-to-date for or not in need of screening at a given point in time; and (c) longitudinal adherence, i.e. screening over a period of time that generally spans more than one recommended screening interval (or round of screening, in the case of a screening programme). There are other kinds of questions about adherence (e.g. over-use, stopping age), but these three categories cover some of the most frequently asked and important questions. Of note, all questions can be framed as comparisons between different groups, but for simplicity, we focus on questions about a single group.
Questions about uptake
At what age do people start screening? What is the prevalence of having been screened at least once?
Bulliard et al. point out that uptake can be a useful indicator of test acceptability, the efficiency of the screening process, and the impact of organizational characteristics. 1 Outside of an organized programme, uptake may reflect effects of the screening setting, such as the availability of providers offering screening, cost of screening, or health literacy.
Questions about currency or being up-to-date
What is the prevalence of being current for screening? What is the prevalence of being out of compliance for screening? What is the prevalence of needing screening? What is the prevalence of not needing screening?
We propose a conceptual distinction between two outcomes in a population eligible for screening (e.g. on the basis of age or other cancer risk factors): not needing screening and being current (or up-to-date) for screening. Being classified as “not in need of screening” requires only that an individual was tested, regardless of the indication. For example, someone who has a diagnostic colonoscopy to investigate rectal bleeding has not been screened, but is also not in need of screening. These data help us understand who is in need of screening and who is not; the MMWR analysis 3 based on NHIS data is an example of this kind of analysis. In contrast, to be classified as “current for screening,” an individual must have received a test conducted for the purpose of screening, i.e. in the absence of signs or symptoms of cancer.
Questions about longitudinal adherence
How long do people remain adherent to screening guidelines? What is the prevalence of receiving regular screening? (Note that “regular” could be defined in a number of ways.)
The RCT conducted by Green et al.,
9
described above, is an example of a study that assessed adherence over time. Surveillance and other sources of longitudinal data are well-suited to answering questions about the period of time over which individuals remain adherent to screening recommendations. Longitudinal adherence is sometimes described using the concept of “covered time,” the period of time during which an individual is considered to be not in need of screening. For instance, Vogt et al. incorporated the concept of covered time into the prevention index, an assessment of healthcare quality designed to be more sensitive than traditional measures like Health Plan Employer Data and Information Set (HEDIS) score.
10
In the context of an organized screening programme, questions might be refined based on the number of screening rounds that have occurred. Based on examples by Bulliard et al., we can pose questions such as:
In a given round of screening, does participation vary based on participation in past rounds? What proportion of invitees participates in all screening rounds?
None of the questions described in this section are the right or wrong ones to ask; they focus on different aspects of adherence, and our list is not exhaustive.
What measures are best used to answer each question?
Scientific questions about screening adherence and corresponding measures.
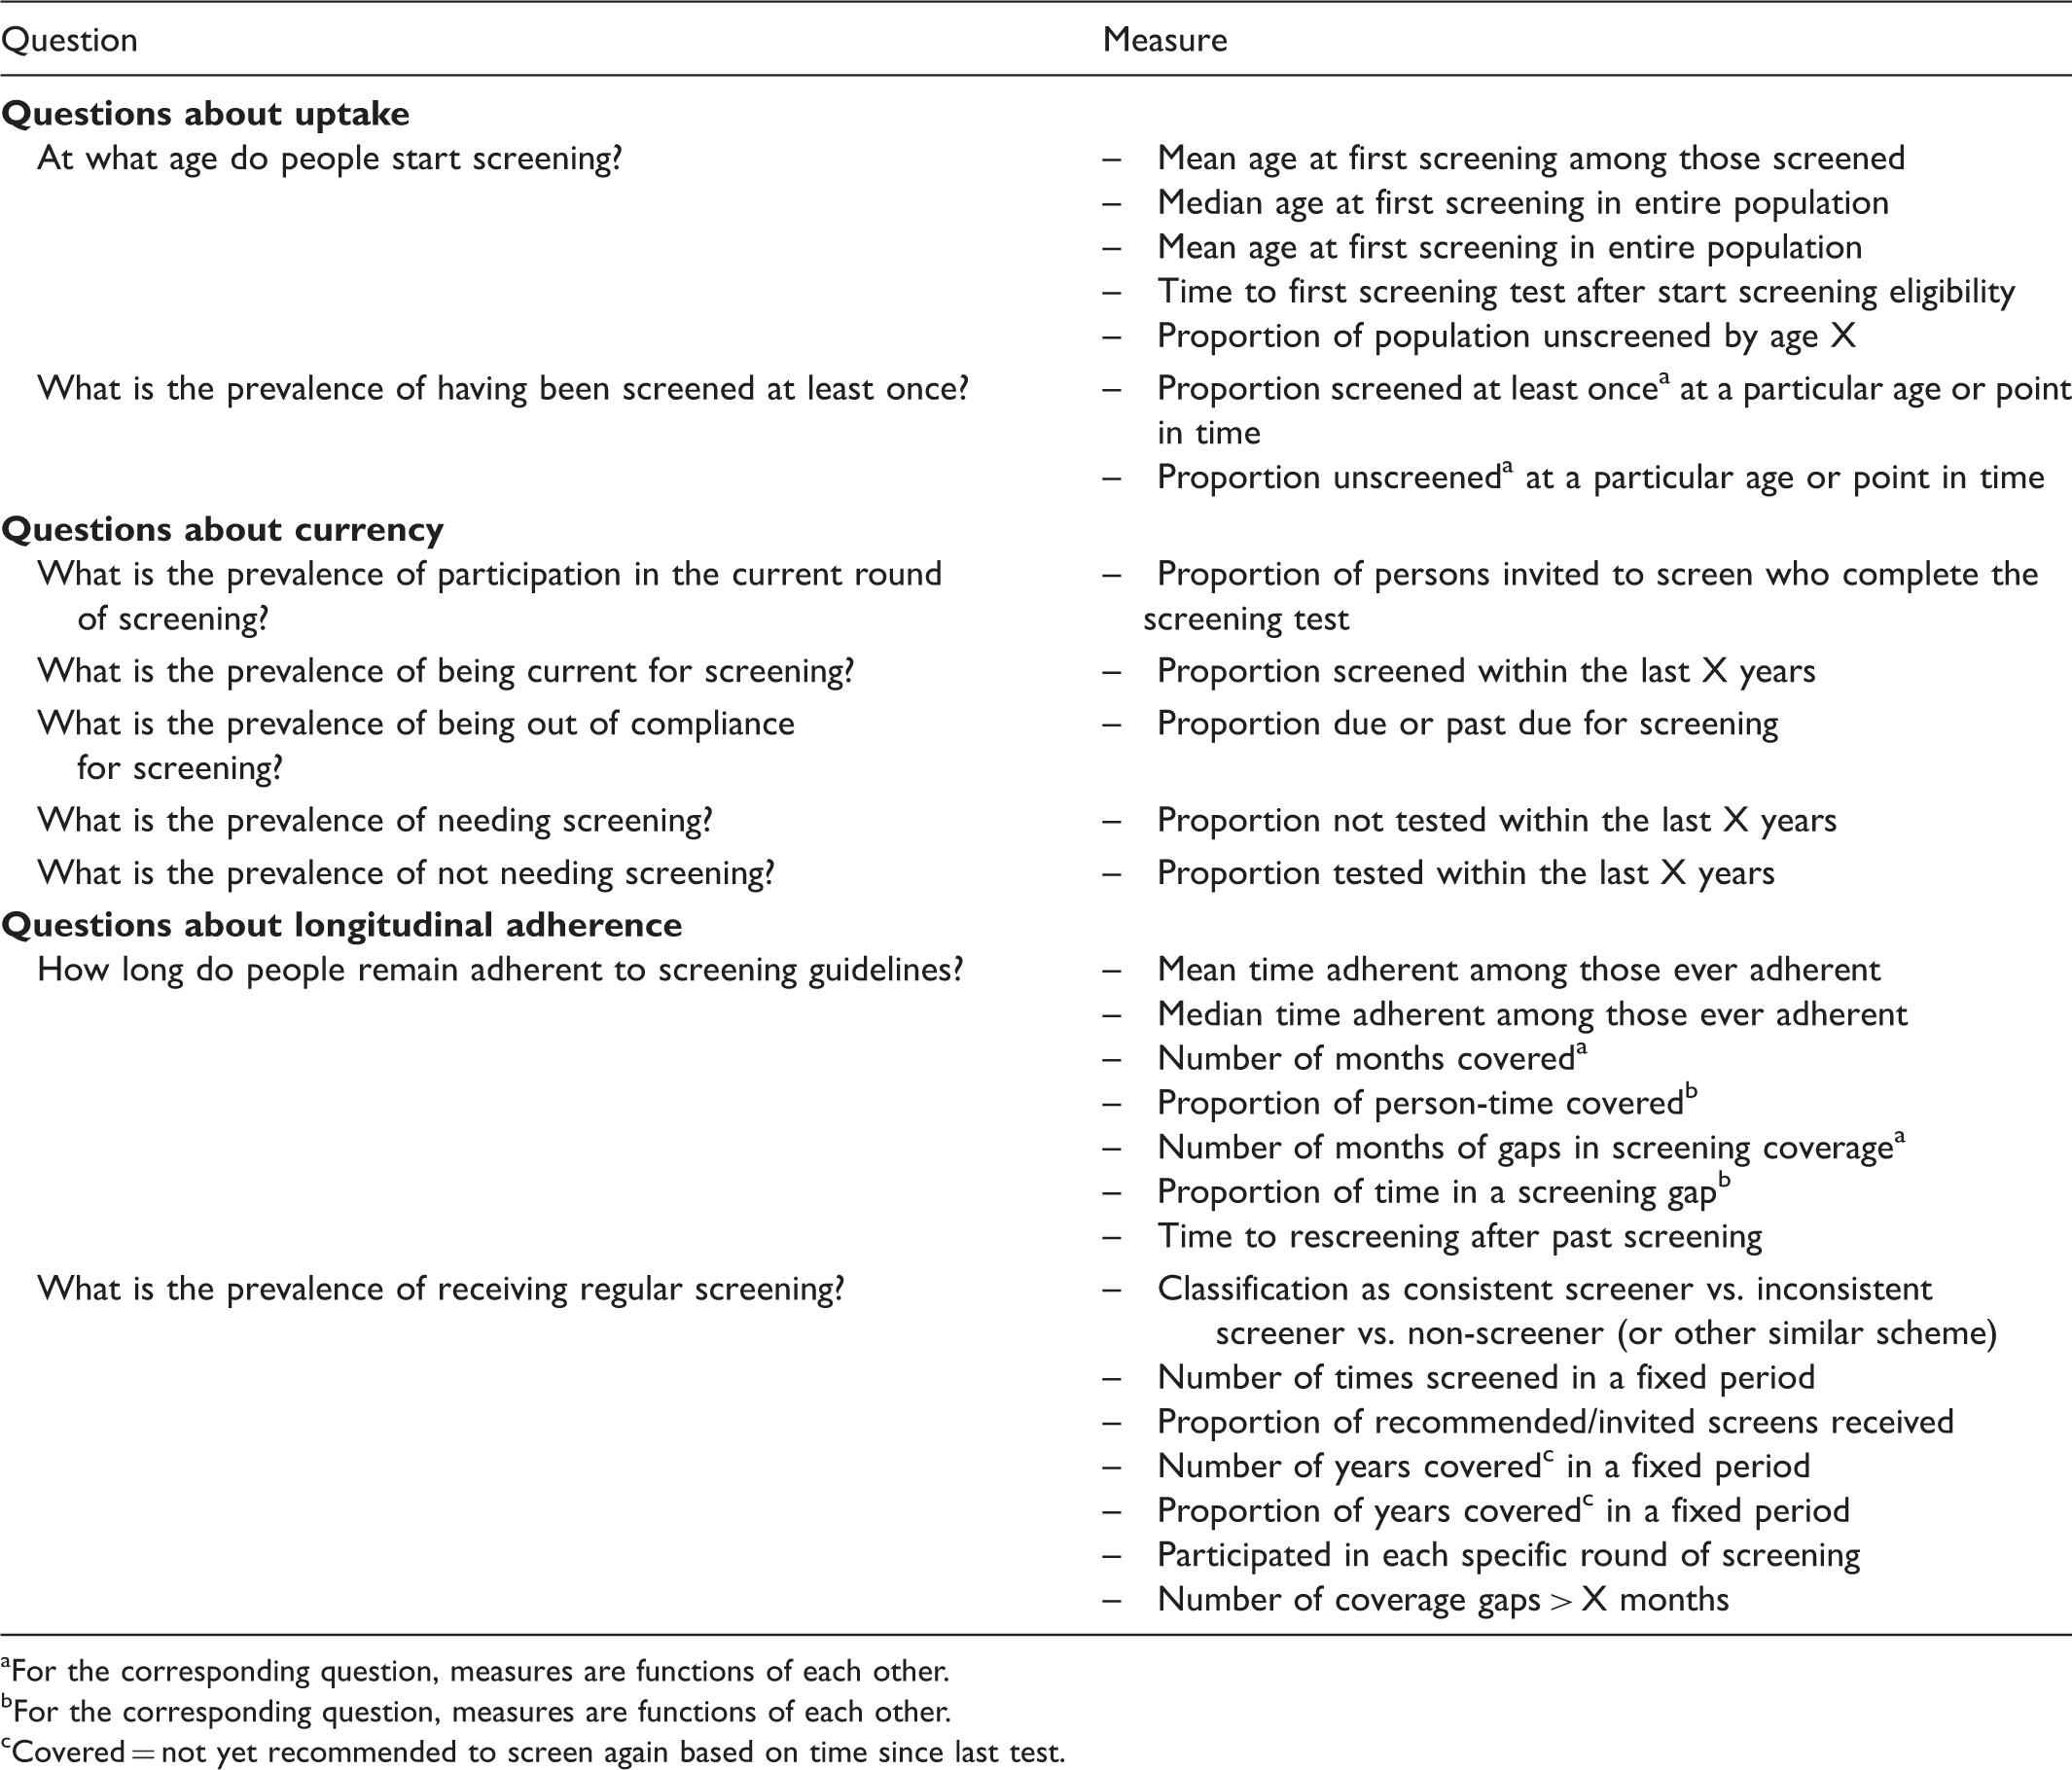
For the corresponding question, measures are functions of each other.
For the corresponding question, measures are functions of each other.
Covered = not yet recommended to screen again based on time since last test.
Inclusion criteria
Determining who is eligible to be studied depends on the question of interest. Broadly, there are three possibilities: the entire population (i.e. everyone), people meeting eligibility criteria for screening, and people who previously have been screened. It is important to note that a person’s eligibility may change over time, and so a person may be included in analyses at some points, but not at others.
Entire population
For studies that focus on the proportion of the population in need of screening, the entire population of a country or health plan may be the denominator of interest. However, usually the entire population is not of interest, because it is not the goal to study people who are not eligible for screening.
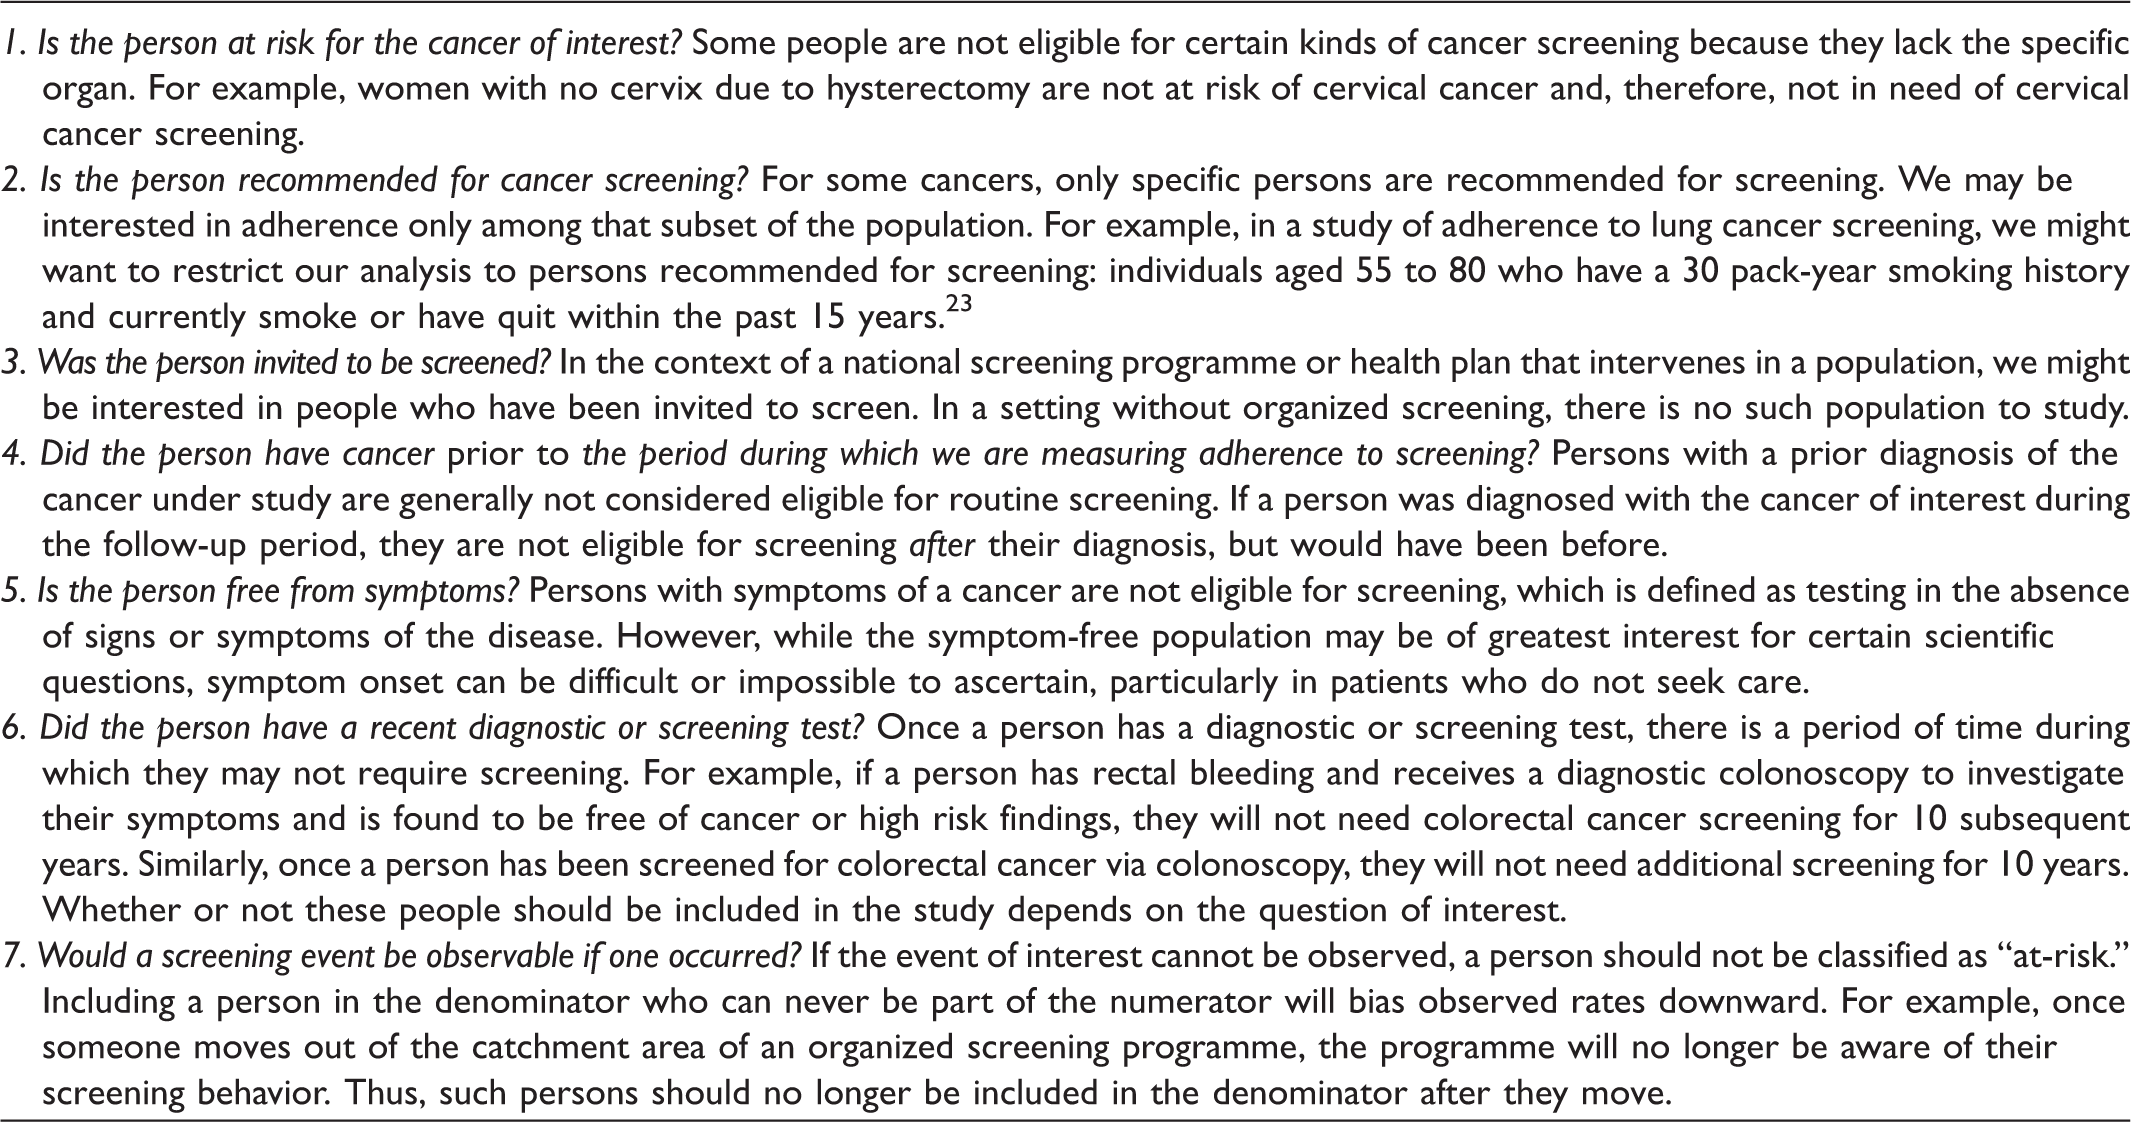
People eligible for screening
Considerations in defining eligibility in studies of cancer screening adherence.
People previously screened
In some measures of interest, the denominator (population) is limited to persons previously screened. One example of this is a measure of time to rescreening.
Outcome of interest
To estimate the screening measures of interest, it is necessary to define the outcome, e.g. screened or in need of screening. If the goal of a study is to assess the need for screening, then the outcome of interest should be receipt of any test for the condition of interest, regardless of indication. For example, the MMWR study 3 does not differentiate between screening and diagnostic tests, but by reporting the percentage of screen-eligible persons who have not been tested (e.g. 100% minus 72.6% who received a mammogram), they provide an estimate of the percentage of the population in need of screening. (27.4%, assuming persons do not have other conditions that contra-indicate screening.)
To be classified as “current for screening,” we propose that an individual must have received a test conducted for the purpose of screening, i.e. in the absence of signs or symptoms of cancer, within the relevant timeframe. However, even in such a study, it might be sufficient to measure testing for any indication. Some studies may aim to evaluate how well an intervention promotes screening. In the context of an intervention to increase screening (such as the RCT example by Green et al. 9 ), differences in rates or prevalence of testing across groups is likely to reflect differences in screening, because there is no reason to expect large differences in the prevalence of symptoms or, therefore, diagnostic testing across groups. So, even if screening per se is the main outcome of interest, focusing on testing may still be informative, and will be more straightforward to evaluate because it does not require knowledge of test indication or screening eligibility.
Figure 1 illustrates proportions that can be computed for alternative outcomes of interest: the proportion of eligible persons in need of screening; the proportion of eligible persons screened; the proportion of eligible persons tested; the proportion of the entire population screened; and the proportion of the entire population tested. Each may be of interest, depending on the scientific question, and data availability may limit which are possible to compute.
A hypothetical population consisting of persons ineligible and eligible for screening at a point in time is shown. Unshaded boxes represent individuals who are not screened or tested; light shaded boxes represent screened individuals; and dark shaded boxes represent persons who have received a diagnostic test.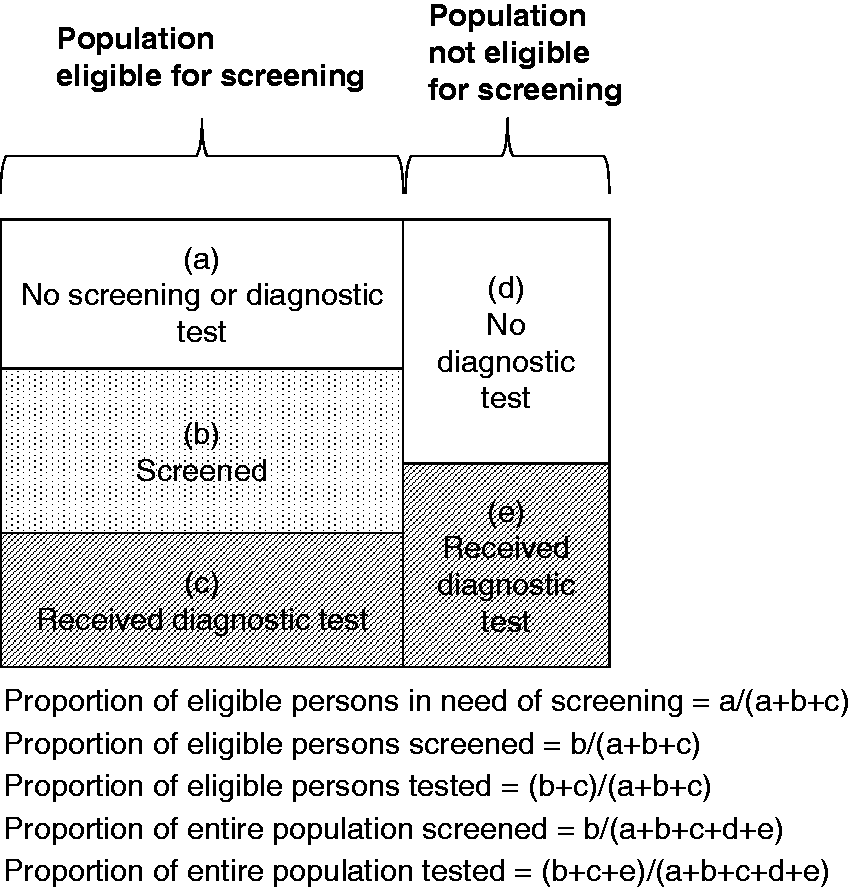
How do we estimate the measures of interest?
In this section, we describe approaches to estimating the measures of interest in Table 1. We consider how approaches may vary based on how data were collected. When comparing results across studies that have collected data differently, it is important to consider whether differences in results are attributable to data sources, or whether the studies are answering slightly different questions.
Questions about uptake
Questions about uptake typically necessitate estimating a summary measure of age at screening initiation. For instance, questions about the age at which individuals begin screening can be answered by considering age at first screening examination to be the outcome of interest. If information on age at first screening examination is available for a representative sample of the target population, it is possible to summarize age at first screening using simple descriptive statistics, such as the mean age at first screening examination. However, with either surveillance or survey data, it is unlikely that age at first screening will be observed for the entire population under study. Using either survey or surveillance data, there will typically be some individuals who have not yet been screened. For these individuals, age at first screening is only known to be greater than their current age, making age at first screening right censored. If the population of interest is the screening eligible population, then age at first screening will also be right censored by events such as a cancer diagnosis, that remove individuals from the target population. Under right censoring, it is not possible to estimate the mean age at screening initiation without making strong parametric assumptions. However, standard non-parametric survival analysis methods provide an alternative. Survival methods allow the quantification of age at first screening, using summary statistics like the median age at first screening, or the proportion of the population screened by a given age. This can be done by treating individuals who have not yet been screened as right censored at the most recent age at which data were collected, or at the time of other censoring events. Comparative questions about uptake can also be answered using survival analysis methods. Summary statistics can be computed within strata (e.g. median age at first screening in group A vs. B), or inferential statistical tests, like the log-rank test, can be used to test for a difference in uptake between strata.
Questions about being up-to-date or not in need of screening
Questions about screening currency focus on point prevalence, and thus can be answered using cross-sectional study designs. A single round of survey data provides a cross-sectional snapshot of screening currency. It is straightforward to use these data to estimate quantities like the proportion of the target population who are up-to-date on screening. Surveillance data can also be used to answer prevalence questions, but require additional specificity about the question of interest. For instance, surveillance data, such as those from an organized screening programme, could be used to summarize the proportion of individuals up-to-date for screening (or not in need of screening, depending on the question) on a particular date (e.g. as of 1 April 2015 what proportion of the population was up-to-date for screening?), or at a particular age (e.g. among individuals aged 50–55, what proportion are up-to-date for screening?). One challenge arising when using surveillance data for this purpose is that not all individuals in the surveillance population will have adequate data available to compute the outcome of interest. For instance, if the aim is to estimate the proportion of the population aged 65 and over who are compliant with colorectal cancer screening guidelines, it is necessary to have data on all eligible individuals in the population covering their entire relevant period of screening. As screening colonoscopy any time in the prior 10 years would result in the classification of an individual as “current,” this implies that 10 years’ prior data are required for all eligible individuals. In practice, it is unlikely that complete data will be available for all eligible individuals in the surveillance population. Excluding individuals with incomplete information (i.e. only including those for whom at least 10 years of prior data are available) could lead to selection bias, as individuals who remain in the surveillance population over a lengthy period of time are not necessarily representative of all individuals eligible for screening. Methods to address selection bias, such as inverse probability weighting, can be used if it is possible to characterize the population that remains under surveillance for the complete period of time required using, for example, demographic and health care utilization data.
Questions about longitudinal adherence
Estimating longitudinal measures of screening adherence requires longitudinal data. For surveys, which most often collect data on screening during a defined period, multiple rounds of survey assessments of the same individuals are generally needed to estimate longitudinal adherence measures. Estimating longitudinal measures of adherence from repeated rounds of survey data can be challenging, because these data take the form of discrete snapshots of individuals’ screening participation. These can be used to assemble a complete history of screening participation, to determine how long an individual was adherent, and when he or she first became non-adherent. Individuals may experience events, such as a cancer diagnosis, that remove them from the target population between successive waves of the survey; they should be censored at the time of these events, if available, or at the last prior wave of the survey. Surveillance data that follow a cohort longitudinally lend themselves more naturally to answering questions about longitudinal adherence.
Longitudinal adherence questions about length of time adherent, or age when an individual first becomes non-adherent, can be answered using survival methods. It is necessary to define a starting point, such as the beginning of screening eligibility, for each individual and then follow them forward longitudinally until they become non-adherent or are censored from the cohort. The timescale for such analyses could be age or time since first eligibility. Censoring could be due to a variety of causes, including leaving the study catchment pool, death, cancer diagnosis, or becoming ineligible for screening. The length of time people remain adherent to screening guidelines can be summarized in terms of the median time adherent, using survival methods to account for right censoring. Comparative questions can be answered descriptively by comparing the median length of adherence or inferentially using regression models for right censored data such as the Cox proportional hazards model. Over any period of interest, the cumulative probability of having been screened can also be estimated using survival approaches.
Other questions about longitudinal adherence may focus on the total time spent adherent to screening guidelines, rather than the length of time prior to the first instance of non-adherence. This could be summarized with a variety of different measures, including the mean or proportion of time eligible for screening spent adherent to guidelines (i.e. covered time). The mean time adherent will typically not be a useful measure for summarizing adherence, as it does not account for differences between individuals in the total amount of time eligible for screening and under observation. The proportion of eligible time spent adherent can be computed for each individual, and then summarized across individuals as the mean proportion of time spent adherent. In interpreting the percentage of time spent adherent, it is important to consider the average length of follow-up. Being adherent for 1 year is easier than being adherent for 10 years, especially when a screening test offers several years of coverage (e.g. mammography). We therefore suggest that reports of covered time also present the mean or median follow-up (observation) time in each group being studied.
Conclusion
Adherence is becoming an increasingly important concept in cancer screening as screening recommendations proliferate. Measurement of adherence can help to predict long-term effectiveness of screening interventions, explain differences in screening outcomes across settings, and identify areas for improvement or intervention. There are many subtle variations in questions that can be asked about screening adherence, each with several measures that can be computed. Estimating these measures requires careful consideration of the data sources, inclusion criteria, and outcome definition. Censoring often will be present, and must be accounted for. Consistent use and estimation of adherence to cancer screening guidelines will facilitate comparison across studies, tests, and settings, and help to elucidate areas for future research.
Footnotes
Acknowledgments
We thank Ms. Melissa Anderson, Dr. Noel Weiss, Dr. Sally Vernon, and Dr. Aruna Kamineni for comments on previous versions of the manuscript and Dr. Karen Wernli for helpful discussions during the early phases of this work.
Declaration of conflicting interests
The author(s) declared no potential conflicts of interest with respect to the research, authorship, and/or publication of this article.
Funding
The author(s) declared the following potential conflicts of interest with respect to the research, authorship, and/or publication of this article: This study was funded by the National Cancer Institute at the National Institutes of Health, Award Numbers: U54CA163261 (Chubak), R03CA182986 (Hubbard), and UC2CA148576 (Buist and Doubeni). The content is solely the responsibility of the authors and does not necessarily express the views of the National Institutes of Health.