
Abstract
Objectives
Obesity is associated with an increased cancer incidence and mortality and therefore cancer screening is particularly important for obese individuals. However, some US studies find lower screening uptake in this group. This study explored whether rates of breast and colorectal screening in England are lower for obese than healthy weight individuals.
Setting
Data were from the English Longitudinal Study of Ageing (ELSA).
Methods
We analysed data from adults who were eligible to have been invited to the UK national screening programmes for breast or colorectal cancer (CRC) in the last five years, and had been given the screening module in Wave 5 of ELSA (N = 1804 for CRC screening, N = 2401 for breast cancer screening). Weight and height were measured by a nurse at Wave 4 (two years earlier). Logistic regression was used to calculate the odds of breast and CRC screening (ever) for participants in higher weight categories (Body Mass Index [BMI] ≥ 25) compared with healthy weight individuals (BMI <25), controlling for socio-demographic variables.
Results
Of ELSA participants, 63% reported CRC screening, and 92% of the women reported breast cancer screening. Obesity was associated with lower CRC screening, but effects were strongest for class III obesity (BMI ≥40) (45% screened; OR = 0.48, 95% CI = 0.32–0.93, P = .029). There was no association between weight status and breast cancer screening.
Conclusion
Severe obesity appears to be a deterrent to CRC screening but not breast cancer screening. Targeted interventions may be required to promote CRC screening uptake in this group, which already has a heightened risk as a consequence of weight.
Introduction
Obesity is associated with increased incidence and mortality of certain cancers.1,2 The biological mechanisms linking obesity and cancer are still being uncovered, although sex hormones and growth factors are both known to play a role.3–5 Differences in early detection behaviours - screening and symptomatic presentation - could play a part in raised mortality.
Two recent meta-analyses of US studies have explored relationships between obesity and mammography attendance 6 and colorectal cancer (CRC) screening. 7 For mammography, there was an inverse relationship overall between obesity and recent mammography, and women with class III obesity were significantly less likely to have received mammography than normal weight women. For CRC screening, while a higher Body Mass Index (BMI) was not associated with lower rates of screening overall, white women with class I, II, or III obesity were less likely to have been screened than normal weight women, and white men with class II obesity were also less likely to have been screened compared with those with a normal BMI. However, none of the studies included in the review used objectively measured weights, which may have had the effect of ensuring that the groups identified as obese were even heavier than they appeared.
With the exception of three studies - one study in Canada 8 , one in Korea 9 , and one in Switzerland 10 - studies in this area have all been based on US samples. It is important to determine if weight status differences are found in a country where organized national screening programmes are offered for both breast and CRC. The aim of the present study was therefore to examine differences in breast and CRC screening behaviour in England in a sample of age eligible adults with objectively measured weight status. We hypothesized that screening would be lower for obese individuals than for those in the healthy weight range.
Methods
Study population
The data for these analyses are from the subset of participants who were asked questions about cancer screening in Wave 5 of the English Longitudinal Study of Ageing (ELSA), carried out in 2010/2011. ELSA is a cohort of individuals aged 50 and over, living in England, who have been followed up every two years since 2002, with weight and height measurements taken by nurses in alternate waves (Waves 0, 2 & 4). The total ELSA sample in Wave 5 consisted of 13,428 participants.11,12 The screening module was introduced part way through Wave 5. Valid nurse-measured heights and weights from Wave 4 (2008/2009) were available for 77.5% of Wave 5 participants. The current study was exempt from ethical approval under the guidelines of the University College London Research Ethics Committee because it was secondary analysis of ELSA data that was provided to researchers in an anonymized format, with no identifiable information included. Data from the 2 waves are linked using unique individual serial numbers.
Measures
Anthropometric, demographic and health measures
Height to the nearest millimetre was measured using a portable stadiometer, and weight was calculated to the nearest 0.1kg with Tanita THD-305 portable electronic scales. These values were used to calculate BMI using the standard formula, and BMI was categorized into normal weight (BMI< 25), overweight (BMI 25–29.9), class I obesity (BMI 30–34.9), class II obesity (BMI 35–39.9) and class III obesity (BMI ≥ 40).
Age, sex, ethnicity, marital status, and non-pension wealth (a sensitive indicator of socioeconomic status (SES) in this age group) were reported. For our analyses, age was categorised as <65 vs. ≥65, marital status as married vs. unmarried (single/never married, separated, divorced, or widowed), ethnicity as white vs. non-white, and wealth was split into quintiles.
Participants also reported any diagnosis of cancer, angina, diabetes, stroke, coronary heart disease, or other limiting long standing illness.
Cancer screening
As part of the UK National Health Service (NHS) breast screening programme, women aged 50 to 70 (extended to 74 in some areas) are invited for screening by mammography every three years. The NHS Bowel Cancer Screening Programme was fully implemented in England in 2010. Men and women aged 60–69 (being extended to 74) are sent a Faecal Occult Blood Testing (FOBT) kit every two years to complete at home and return for analysis.
The screening questions were prefaced with: ‘I would like to ask you about any screening you may have had to check for different types of cancer’. Women were asked: Have you ever had a mammogram (x-ray of your breasts)’ and (if yes) ‘How long ago was your most recent mammogram’; followed by ‘What was the reason for your most recent mammogram’, which included the response option ‘Routine screening by the NHS Breast Screening Programme’. All participants were asked ‘Have you ever completed a home testing kit for screening bowel cancer’, and (if yes) ‘How long ago was your most recent test’; followed by ‘Was this test part of the NHS Bowel Cancer Screening Programme’.
We were specifically interested in those who reported NHS screening, as other offers of screening may have been made because of a specific health concern (e.g. a non-routine referral or follow-up cancer care) and it is likely that individuals would respond differently to these. Therefore, for the purposes of our analyses, only NHS screening was classified as screening (excluding 23 potential participants from the CRC screening analysis, and 80 from the breast cancer screening analysis). The present analyses used ‘ever been screened’ as the outcome.
Statistical analysis
We restricted our age range to those who would have been invited to NHS screening within the last five years, taking account of age eligibility and (for CRC screening) the date that the programme was fully implemented across the country. For CRC screening, this was age 62–69, and for breast cancer screening 50–72. Multivariable logistic regressions including age, sex (CRC screening only), ethnicity, marital status, and SES (indicated by non-pension wealth) were used to calculate the odds of CRC and breast cancer screening for individuals in each higher weight group (overweight, class I obesity, class II obesity, class III obesity) compared with those with BMI <25. Polynomial contrasts were used to examine overall trends. 13 Because co-morbidities may influence screening uptake4,14–17, analyses were repeated after controlling for a diagnosis of cancer, angina, diabetes, stroke, coronary heart disease, or other limiting long standing illness. To explore potential gender differences, we checked for an interaction between weight status and sex for CRC screening. Analyses were carried out using IBM SPSS Statistics version 19, with a two-sided P value <0.05 determining statistical significance.
Results
CRC Screening
Respondents for the analysis of CRC screening were predominantly married (74%) and white (98%). The mean (standard deviation [SD]) age was 65.0 (2.2) and the mean (SD) BMI was 28.2 (5.1). Overall, 63% of this sample reported ever having had CRC screening.
Multivariable logistic regression models predicting screening.
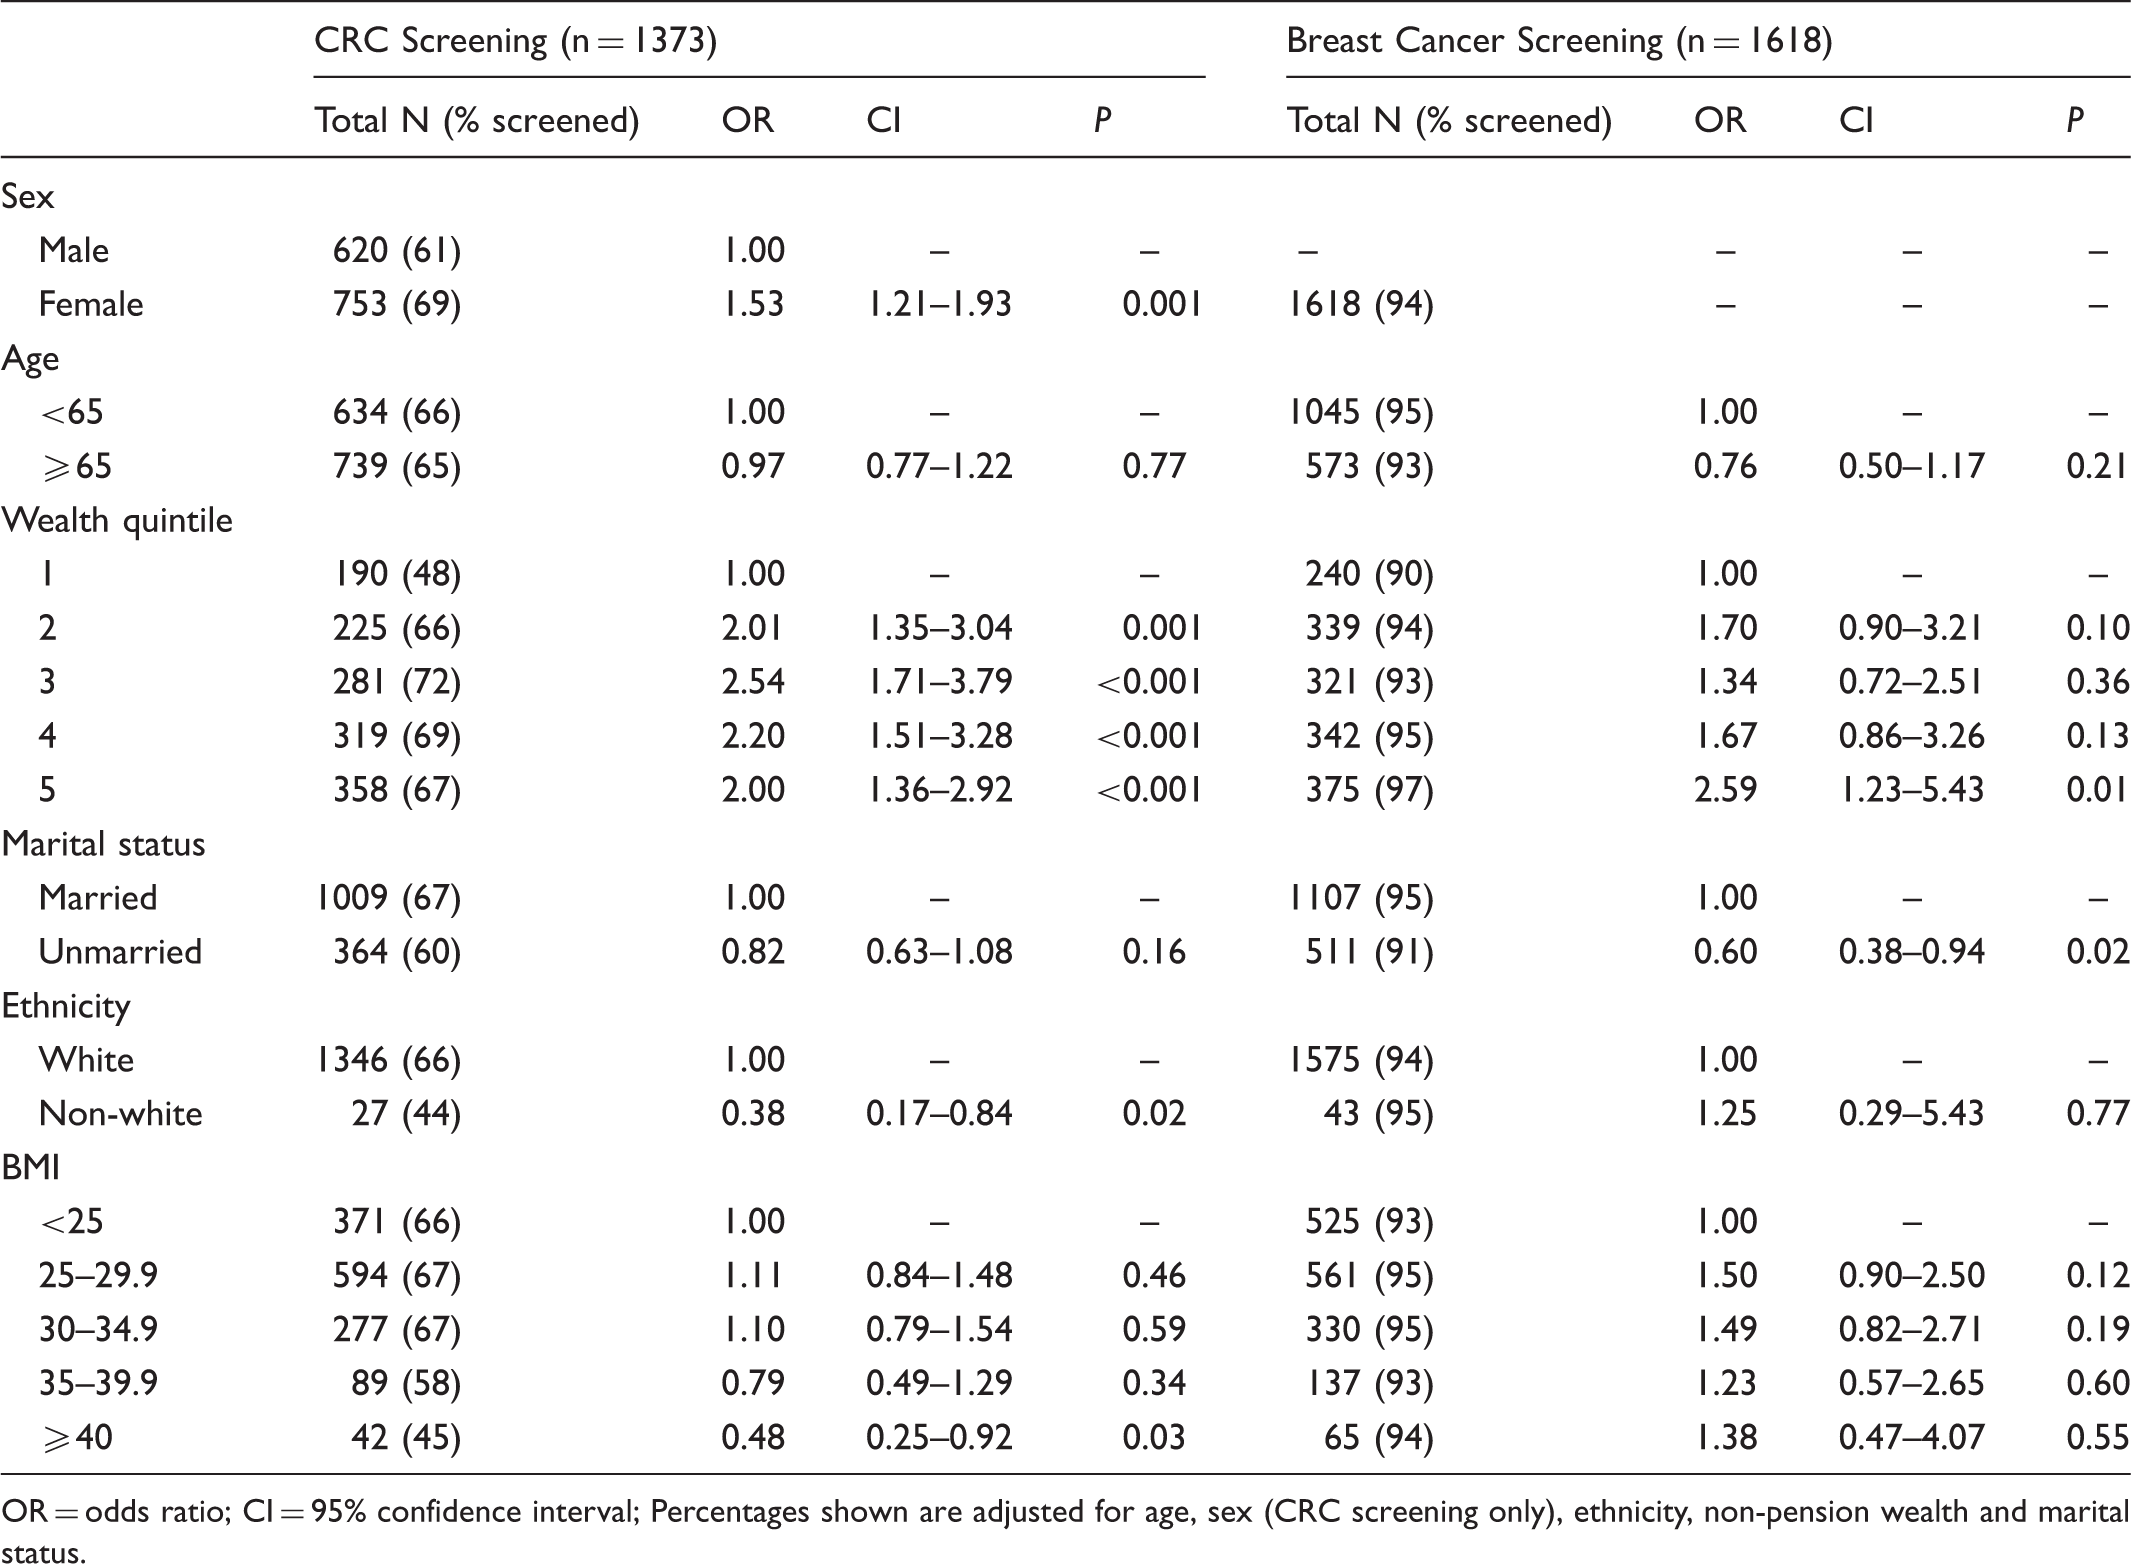
OR = odds ratio; CI = 95% confidence interval; Percentages shown are adjusted for age, sex (CRC screening only), ethnicity, non-pension wealth and marital status.
Consistent with other studies18–20, women were more likely than men to have been screened (69% vs. 61%; OR = 1.53, 95% CI = 1.21–1.93; P < .001), those in the higher quintiles for wealth were more likely to have been screened than the bottom quintile (66–72% vs. 48%; all P values ≤ .001), and non-white respondents were less likely to have been screened than white respondents (66% vs. 44%; OR = 0.38, 95% CI = 0.17 to 0.84, P = .017).
We repeated the analyses controlling for a diagnosis of cancer, angina, diabetes, stroke, coronary heart disease, or other limiting long standing illness, and results were essentially unchanged.
Breast Cancer Screening
Women in the sample analyzed for breast cancer screening were predominantly married (70%) and white (96%). Their mean (SD) age was 61.45 (5.54) and mean (SD) BMI was 28.26 (5.81). Over 90% reported ever having had breast cancer screening.
The results of the multivariable logistic regression model are shown in Table 1. Rates were broadly similar across categories, and showed no evidence of a drop-off at higher weight levels (normal weight: 93%, class III obesity: 94%). Consistent with previous research 18 , women in the highest wealth quintile were more likely to have been screened than those in the bottom quintile (97% vs. 90%; OR = 2.59, 95% CI = 1.23–5.43, P = .012). Unmarried participants were significantly less likely to have been screened than those who were married (91% vs. 95%; OR = 0.60, 95% CI = 0.38–0.94, P = .024).
We repeated the analyses controlling for a diagnosis of cancer, angina, diabetes, stroke, coronary heart disease, or other limiting long standing illness. As with CRC screening, results were essentially unchanged.
Discussion
In this cohort of adults in England, overall rates for ever having had breast or CRC screening were 92% and 63% respectively, comparable with other population-based survey data. 21 The lower rates of CRC screening compared with breast cancer screening also corresponds with differences in screening uptake rates for the two types of cancer in Britain.18,22 In line with our hypothesis that screening rates would be lower for obese individuals, respondents with class II/III obesity were less likely than normal-weight respondents to have had CRC screening, independent of potential demographic and health confounders. There was also a significant linear trend for BMI on CRC screening, with rates decreasing as weight status increased. We found no deterrent effect of obesity on breast cancer screening.
For CRC screening, we also checked for an interaction between BMI and sex on screening rates, but found no differential effect. Previous studies have also explored differences by race16,23–25, however, we were unable to do so in our sample due to the small numbers of non-white responders (<5%).
A number of explanations have been offered for the lower screening rates among the severely obese. Patients with comorbidities may feel that screening is not a priority 26 , particularly given that many obese individuals are not aware of their increased cancer risk27,28, although controlling for co-morbidities did not alter the results in our sample. Obese people often have poor body image, which could cause embarrassment or unease when dealing with health care practitioners29,30, although FOBT tests are done in the home which should avoid this problem. Individuals with higher BMIs may simply be less engaged in health-seeking behaviours, with CRC screening representing an aspect of this. 26 However this does not fit with the fact that, in our sample, obese women were just as likely to have been screened for breast cancer as women with a normal BMI. Lastly, it may be an issue of mobility or flexibility, given the actions required to collect the necessary sample for FOBT. Obesity is associated with mobility problems, particular in older adults31,32, which could be why we saw an effect of BMI on CRC screening, but not on breast cancer screening, where health professionals are available to help with any mobility problems.
Future research should explore barriers to CRC screening for obese individuals. A better understanding of these issues could help to inform interventions to promote screening equitably, regardless of body size. For example, if mobility or flexibility is a barrier, additional assistance could be provided, or flexible sigmoidoscopy offered, as an alternative method of screening, which may be easier for this population. With the introduction of flexible sigmoidoscopy to the NHS screening programme, it will be important to explore if the differences generalize to this form of CRC screening, particularly as US research has shown differences in the relationship between screening and BMI dependent on the screening modality. 23
This study had a number of limitations. The generally high levels of screening may be a reflection of the ELSA cohort members being conscientious about health matters, and therefore findings cannot be assumed to generalize to the wider UK population. As in other studies, screening was self-reported, so there is a risk that behaviours were over-reported. 33 The percentage screened for CRC represents one (or at most two) round(s) of screening, whereas for breast cancer it may be four or five rounds, and so those who reported not attending breast cancer screening are more likely to be “persistent non-responders” whereas, for CRC, the non-attenders are likely to include both those who would never attend and those who would do so only erratically. Persistent non-attenders may have different characteristics and barriers compared with those who attend only some of the time, which we were unable to explore. ELSA has a lower representation of ethnic minorities than England generally (97% white in ELSA vs. 86% white in the general population 34 ), and because the screening questions were only relevant to a small age range, the ethnic minority numbers were particularly low in our sample. This made it difficult to explore ethnic differences, other than through the comparison of white vs. non-white. An advantage of our study was that it included objective measurements of height and weight, because dependence on self-reported BMI has been cited as a limitation of the research in this area.6,7
The results of this study highlight the potential impact of weight on participation in CRC but not breast cancer screening, in England. To our knowledge, this is the first investigation of screening uptake by weight status in the English population, and it is therefore important that the findings are replicated. As they stand, they suggest that severely obese individuals may be doubly disadvantaged, with a higher underlying risk of CRC and lower uptake of screening. A better understanding of the barriers to screening for severely obese individuals would help to inform the development of interventions.
Footnotes
Funding
This study was supported by Cancer Research UK [grant number C1418/A7974].
The funding for ELSA is provided by the National Institute of Aging in the United States, and a consortium of UK government departments co-ordinated by the Office for National Statistics. The developers and funders of ELSA and the Archive do not bear any responsibility for the analyses or interpretations presented here.
Acknowledgements
The data were made available through the UK Data Archive (UKDA). ELSA was developed by a team of researchers based at the NatCen Social Research, University College London and the Institute for Fiscal Studies. The data were collected by NatCen Social Research.