
Abstract
The main objective of this study is to evaluate how different metal oxide nanoparticles influence the physical properties of polymer composite containing conducting polyaniline and biopolymer chitosan, which help in creating sustainable industrial solutions. Herein, a polyaniline-chitosan composite comprising various nano oxides (MO2, M = Ti, Si, and Zr) was created using an in situ chemical polymerisation technique. The following methods were used to characterize all synthesised composites: XRD, FT-IR, SEM, BET, TGA, and DTA. The impact of those nano oxides on the polyaniline-chitosan matrix was demonstrated by the structural characterization of every sample under investigation. At room temperature (303 K), the sample containing nano TiO2 (PACT) had the highest conductivity value (9.75 × 10⁻⁸ S m−1) compared to the other samples containing ZrO2 (PACZ, 5.33 × 10⁻⁸ S m−1) and SiO2 (PACS, 1.14 × 10⁻⁸ S m−1). Good thermal stability behaviour was displayed by the same sample. At 1 MHz, the PACT sample had the lowest tan δ value (0.19) among the others in consideration of dielectric characteristics. The PACT sample has the lowest dielectric properties (tangent loss (tan δ)) when compared to other related samples that have been previously studied. Based on these preliminary dielectric measurements, the material may be used for high-frequency device applications such as dynamic random-access memory and decoupling capacitors in radio frequency and microwave technology after further investigations.

Keywords
Introduction
Nowadays, polymeric materials are used in almost every part of life due to advancements in nanoscience. Biopolymers play a vital role in industries by offering sustainable, biodegradable alternatives to synthetic materials. They enhance product performance while reducing environmental impact across sectors like packaging, healthcare, and agriculture. Discarding non-biodegradable plastics has become a significant worry for human society, nevertheless, due to their harmful effects on the environment. 1 Utilising natural resource-based biodegradable polymeric materials can help address environmental concerns and enhance their qualities for usage in a range of applications. 2 Chitosan (CS), an abundant natural biopolymer, possesses excellent mechanical strength, good water permeability, biocompatibility, non-toxicity, and remarkable film-forming ability. However, its reactive hydroxyl and amino groups make it susceptible to chemical modification.3,4 Chitosan finds applications in diverse fields, including drug delivery systems, biosensors, separation membranes, and wastewater treatment. Recently, its combination with conducting polymers, nanoparticles, and oxide agents has enabled the development of hybrid materials that leverage the unique properties of each component and exhibit enhanced synergistic effects. Polyaniline (PANI) is one of the most extensively studied conductive polymers due to its facile synthesis, low cost, unique charge-transfer mechanism, tunable conductivity, environmental stability, and superior sensing ability.5–10 Its potential applications include anticorrosive coatings, organic electronic devices, rechargeable batteries, switchable membranes, actuators, and sensors.6,8,9,11 The electrical conductivity of PANI is strongly influenced by its redox state, moisture content, and level of doping. 5 Various doping strategies have been employed to enhance its conductivity, achieving performance comparable to oxide-based materials.8,10 Because of these properties, PANI is often referred to as a “synthetic metal,” combining the mechanical, electrical, and physical characteristics of metals with the corrosion resistance, low weight, and durability of polymers. 8 The combination of polyaniline with chitosan enables the formation of hybrid materials that synergistically leverage the properties of both components.12–15 The mechanical characteristics and processability of polyaniline have been comparatively enhanced by the addition of chitosan.16,17 Polyaniline’s interaction with ions has been studied recently. The reported increase in polyaniline conductivity through contact with ions was one of the most significant findings. This was accomplished by polyaniline reacting with transition metal salt,18,19 alkali metal salt, 20 or Lewis’s acids in anhydrous media. 14 A two-step redox mechanism was proposed for transition metal ions, 21 where the ions oxidize the polymer amine, coordinate with the backbone imine, and generate radical cation segments along with oxidized ions. By incorporating nano oxides, there have been multiple attempts to improve the performance of chitosan and polyaniline, which depends on surface chemistry and structural modification.22,23 Here, as a new trial of enhancing the conductivity and dielectric properties of polyaniline - chitosan matrix, polyaniline - chitosan composite containing different nano oxides (MO2, M = Ti, Si and Zr), with a definite concentration, were synthesized via in situ chemical polymerization approach. The aim and novelty of this work is to modify the structure of the polyaniline - chitosan matrix through incorporating different nano oxides in a definite concentration, to synthesize interacted structural matrix which supports the electrical conductivity and dielectric properties. This synthesized matrix may be expected to have available applications in radio frequency, microwave, and high-frequency device applications such as dynamic random-access memory and decoupling capacitors.
Materials and methods
Materials
Ammonium persulphate (NH4)2S2O8 (APS) (Merck, 98%), medium molecular weight chitosan (Merck, 98%, MMW = 350 kDa), aniline (C6H5NH2) (Merck, 99%, MMW = 93.13 kDa), nano titanium (IV) oxide (Merck, 99%, Crystallite Size = 25 nm), nano silicon (IV) oxide (Merck, 98%, Particle Size = 5–20 nm), and nano zirconium (IV) oxide (Merck, 98%, Crystallite Size <100 nm) were used. Every chemical utilised was of analytical quality and didn’t require any additional purification.
Preparation of pure polyaniline-chitosan composite
According to Ref., 24 the polyaniline-chitosan in emeraldine base (EB) was created via the chemical oxidation process. Approximately 0.75 g of chitosan was dissolved in 4% acetic acid and aggressively agitated for an hour. A transparent solution was then created by dissolving 3.06 g of polyaniline in 0.5 M HCl and stirring the mixture for 20 min at room temperature. The reaction flask was then submerged in an ice bath to chill the resulting solution. To perform the polymerization, 0.3 g of ammonium persulphate was added to 0.5 M HCl. The monomer was poured with this solution while being forcefully stirred. The grafting is confirmed when the solution gradually turns green and emerald during the addition process. To make sure the reaction was finished, the stirring was maintained at the same temperature for an additional hour. The precipitation resulted after neutralising it with 2M NaOH to bring the pH just above 7. For a full day, the mixture was kept facilitating the chemical reaction. The blue-violet sediment was washed with distilled water many times before being filtered. Using a mortar, the collected residue - which includes polyaniline and chitosan—was completely ground after being oven-dried for 12 h at 80°C.
Preparation of polyaniline - chitosan - MO2, M = Ti, Si and Zr nano composites
Similarly, as mentioned above, titanium (IV) oxide (10 Wt. %) was added to chitosan before adding aniline with a continuous stirring for 5 h. The resulting clear solution was cooled, and the above process was repeated with the addition of ammonium persulfate to synthesis polyaniline-chitosan-TiO2. In the same manner, silicon (IV) oxide (10 Wt. %) and zirconium (IV) oxide (10 Wt. %) were also used to synthesis polyaniline-chitosan-SiO2 and polyaniline-chitosan-ZrO2. All prepared composites were denoted as PAC, PACT, PACS and PACZ for pure polyaniline-chitosan, polyaniline – chitosan containing nano TiO2, polyaniline-chitosan containing nano SiO2 and polyaniline-chitosan containing nano ZrO2, respectively. Preparation method and illustration of the structure mechanism of Polyaniline/chitosan/MO2, M = Ti, Si, Zr were represented via schematic diagrams, Figures 1 and 2. The PNAI/CS nanocomposites form through hydrogen bonding and electrostatic interactions, resulting in a stable, nanoscale interpenetrating network. Preparation of polyaniline-chitosan - MO2, M = Ti, Si, Zr. Illustration of the structure mechanism of Polyaniline-chitosan-MO2, M = Ti, Si, Zr.

Characterization tools
With a Philips diffractometer 321/00 at room temperature, the XRD patterns were assessed for each sample in the 2θ range of 10° to 70° at a scan rate of 5° min−1. At 10 mA and 36 kV, the XRD patterns were captured using Cu Kα radiation (λ = 1.541 Å). The Tecnai G20, Super twin, double tilt 1010, 200 kV FEI was used to examine sample morphologies. The FT-IR spectra in the 500–4000 cm−1 region were tracked using a dual beam Perkin Elmer spectrometer. Following their tablet-forming mixing with KBr (1:100), the samples were placed in the sample holder. A standard volumetric device (Quantachrome NOVA Automated) was utilised to quantify the surface properties, BET surface area, total pore volume (Vp), and mean pore radius (r) during the adsorption of N2 gas at 77 K. Pore diameter distribution was found using BJH analysis. PAC and its nanocomposites were subjected to thermogravimetric analysis using a Dupont 2100 Thermal Analyser in static air at a temperature range of 30 to 1000°C and a heating rate of 10 K/min.
Results and discussions
Structural characterization
XRD
The XRD patterns of the PAC, PACT, PACS, PACZ, TiO2, SiO2, and ZrO2 are shown in Figure 3(a) and (b). The patterns of commercial nano oxides (TiO2, SiO2 and ZrO2) show characteristic diffraction peaks (crystalline nature for TiO2 and ZrO2 and amorphous one for SiO2) identical to standard JCPDS database cards (No. 75-1537, No. 41-1413 and No. 79-1769 for TiO2, SiO2 and ZrO2, respectively). XRD patterns of (a) PAC, PACT, PACS, and PACZ and (b) TiO2, SiO2, and ZrO2 samples.
The pattern of PAC (Figure 3(a)) shows principal diffraction peaks at about 2θ = 15.2, 21.5, and 25.3°, indicating an amorphous nature with some degree of crystallinity, which may be attributed to periodicity parallel and perpendicular to polyaniline chains, respectively. 25 The presence of a broad peak at around (20–30°) was attributed to overlapping of chitosan with polyaniline. 26 The characteristic peaks of oxides (especially for TiO2 and ZrO2) were also observed in their nanocomposites (PACT and PACZ), which indicate the presence of nanoparticles in the polymer composite matrix. Additionally, the PAC’s weak diffraction peaks in all nano composites get weaker than those in pure PAC. This behaviour could be explained by the fact that the coupling agent and oxide limit the configuration of PAC molecular chains. Using the Scherrer equation, 3 the average crystallite size of all composites was also determined to be 351.2, 515.4, 428.8, and 354.1 nm for PAC, PACT, PACS, and PACZ, respectively.
FT-IR
Figure 4(a) and (b) display the FT-IR spectra of PAC, PACT, PACS, PACZ, TiO2, SiO2, and ZrO2. FTIR spectroscopy reveals the nature of the interaction between chitosan, polyaniline, and the oxide framework. Tables 1 and 2 lists all the materials’ absorption band wave numbers along with their corresponding assignments. Chitosan was successfully loaded onto polyaniline, as evidenced by the FTIR spectrum’s PAC absorption bands, which are in good agreement with the distinctive bands of polyaniline and chitosan reported in the literature.27–34 The PAC bands are moved towards a higher or lower wave number value in the FTIR spectra of PACT, PACS, and PACZ (Table 2). This illustrates the significant interaction between polyaniline, chitosan, and nano oxides.
27
The results indicate that either nano oxide particles establish coordination bonds with polyaniline or chitosan nitrogen atoms, or both, or that amine (–NH–) and imine (–N=) nitrogen atoms interact with nano oxides through protonation or complexation.35–37 Band shifting is also influenced by hydrogen bonding.
38
Additionally, as shown in Figure 4(a), all the distinctive bands of nano oxides displayed a shift (higher/lower) of wave number values in their nanocomposites. Those modifications show that aniline monomer and nano oxides interact.
35
FT-IR spectra of (a) PAC, PACT, PACS, and PACZ and (b) TiO2, SiO2, and ZrO2 samples. FT-IR spectral basic bands assignment of TiO2, SiO2, ZrO2 samples. FT-IR spectral basic bands assignment of PAC, PACT, PACS, and PAC samples.

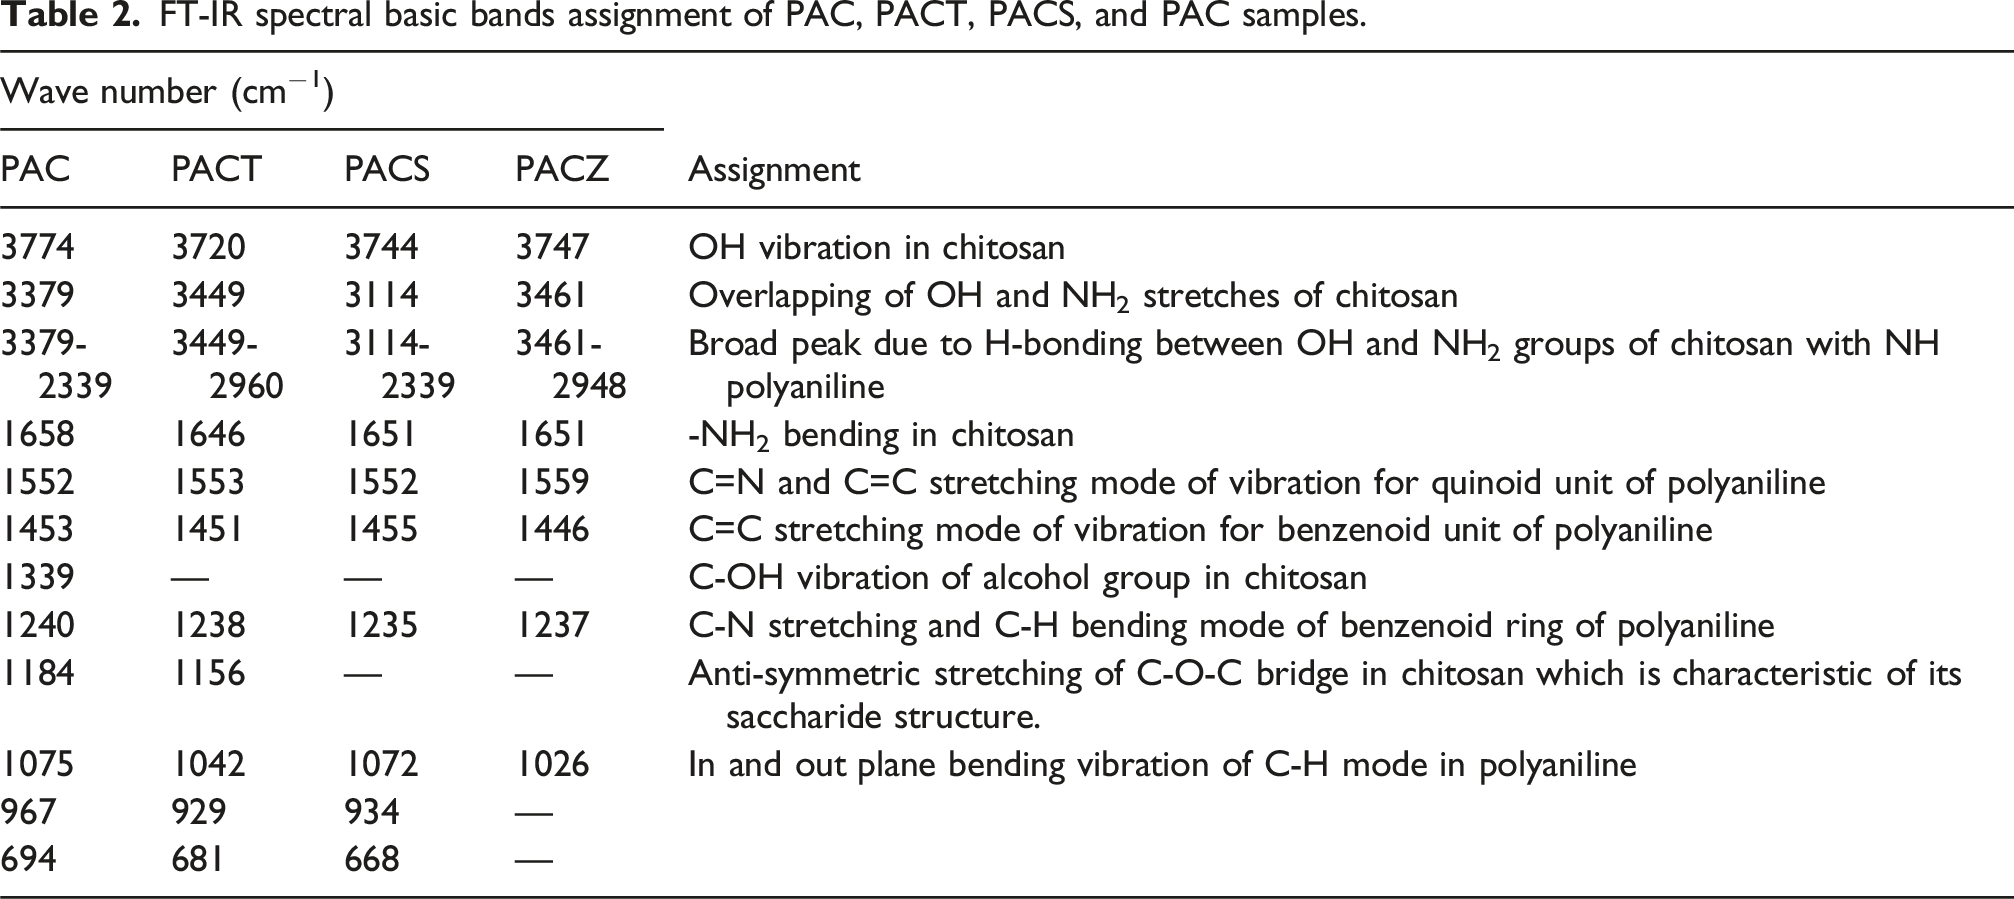
Also, In the IR spectra of the composites (Figure 4(a)), some peaks appear less distinct due to overlapping vibrations of the polymer matrix and incorporated nano oxides. The presence of multiple peaks corresponding to the oxides arises from different vibrational modes of the metal–oxygen bonds in MO2 (M = Ti, Si, Zr). These peaks confirm the successful incorporation of the oxides into the polyaniline–chitosan matrix.
SEM
Using SEM, the morphological structure is investigated. In Figure 5, the SEM pictures of PAC, PACT, PACS, and PACS are displayed. In contrast to the coherent granular morphology of the particles in the PAC matrix, which is shown in the nano composites (PACT, PACS, and PACZ) in Figure 5, the incorporation of nano oxides into the PAC matrix results in a uniform uncoherent granular porous morphology. This shows that the nano oxides are encased in PAC polymer chains, and the nano composites develop into multiparticle populations. The literature39,40 contains the same observations. This could be explained by the fact that ions cause a network and aggregation of polyaniline molecular chains. This is most likely because ions have multiple doping positions and can either bind to multiple nitrogen sites in polyaniline chains or coordinate to form interchain linkages among several adjacent polyaniline chains.41,42 SEM images of PAC, PACT, PACS, and PACZ samples.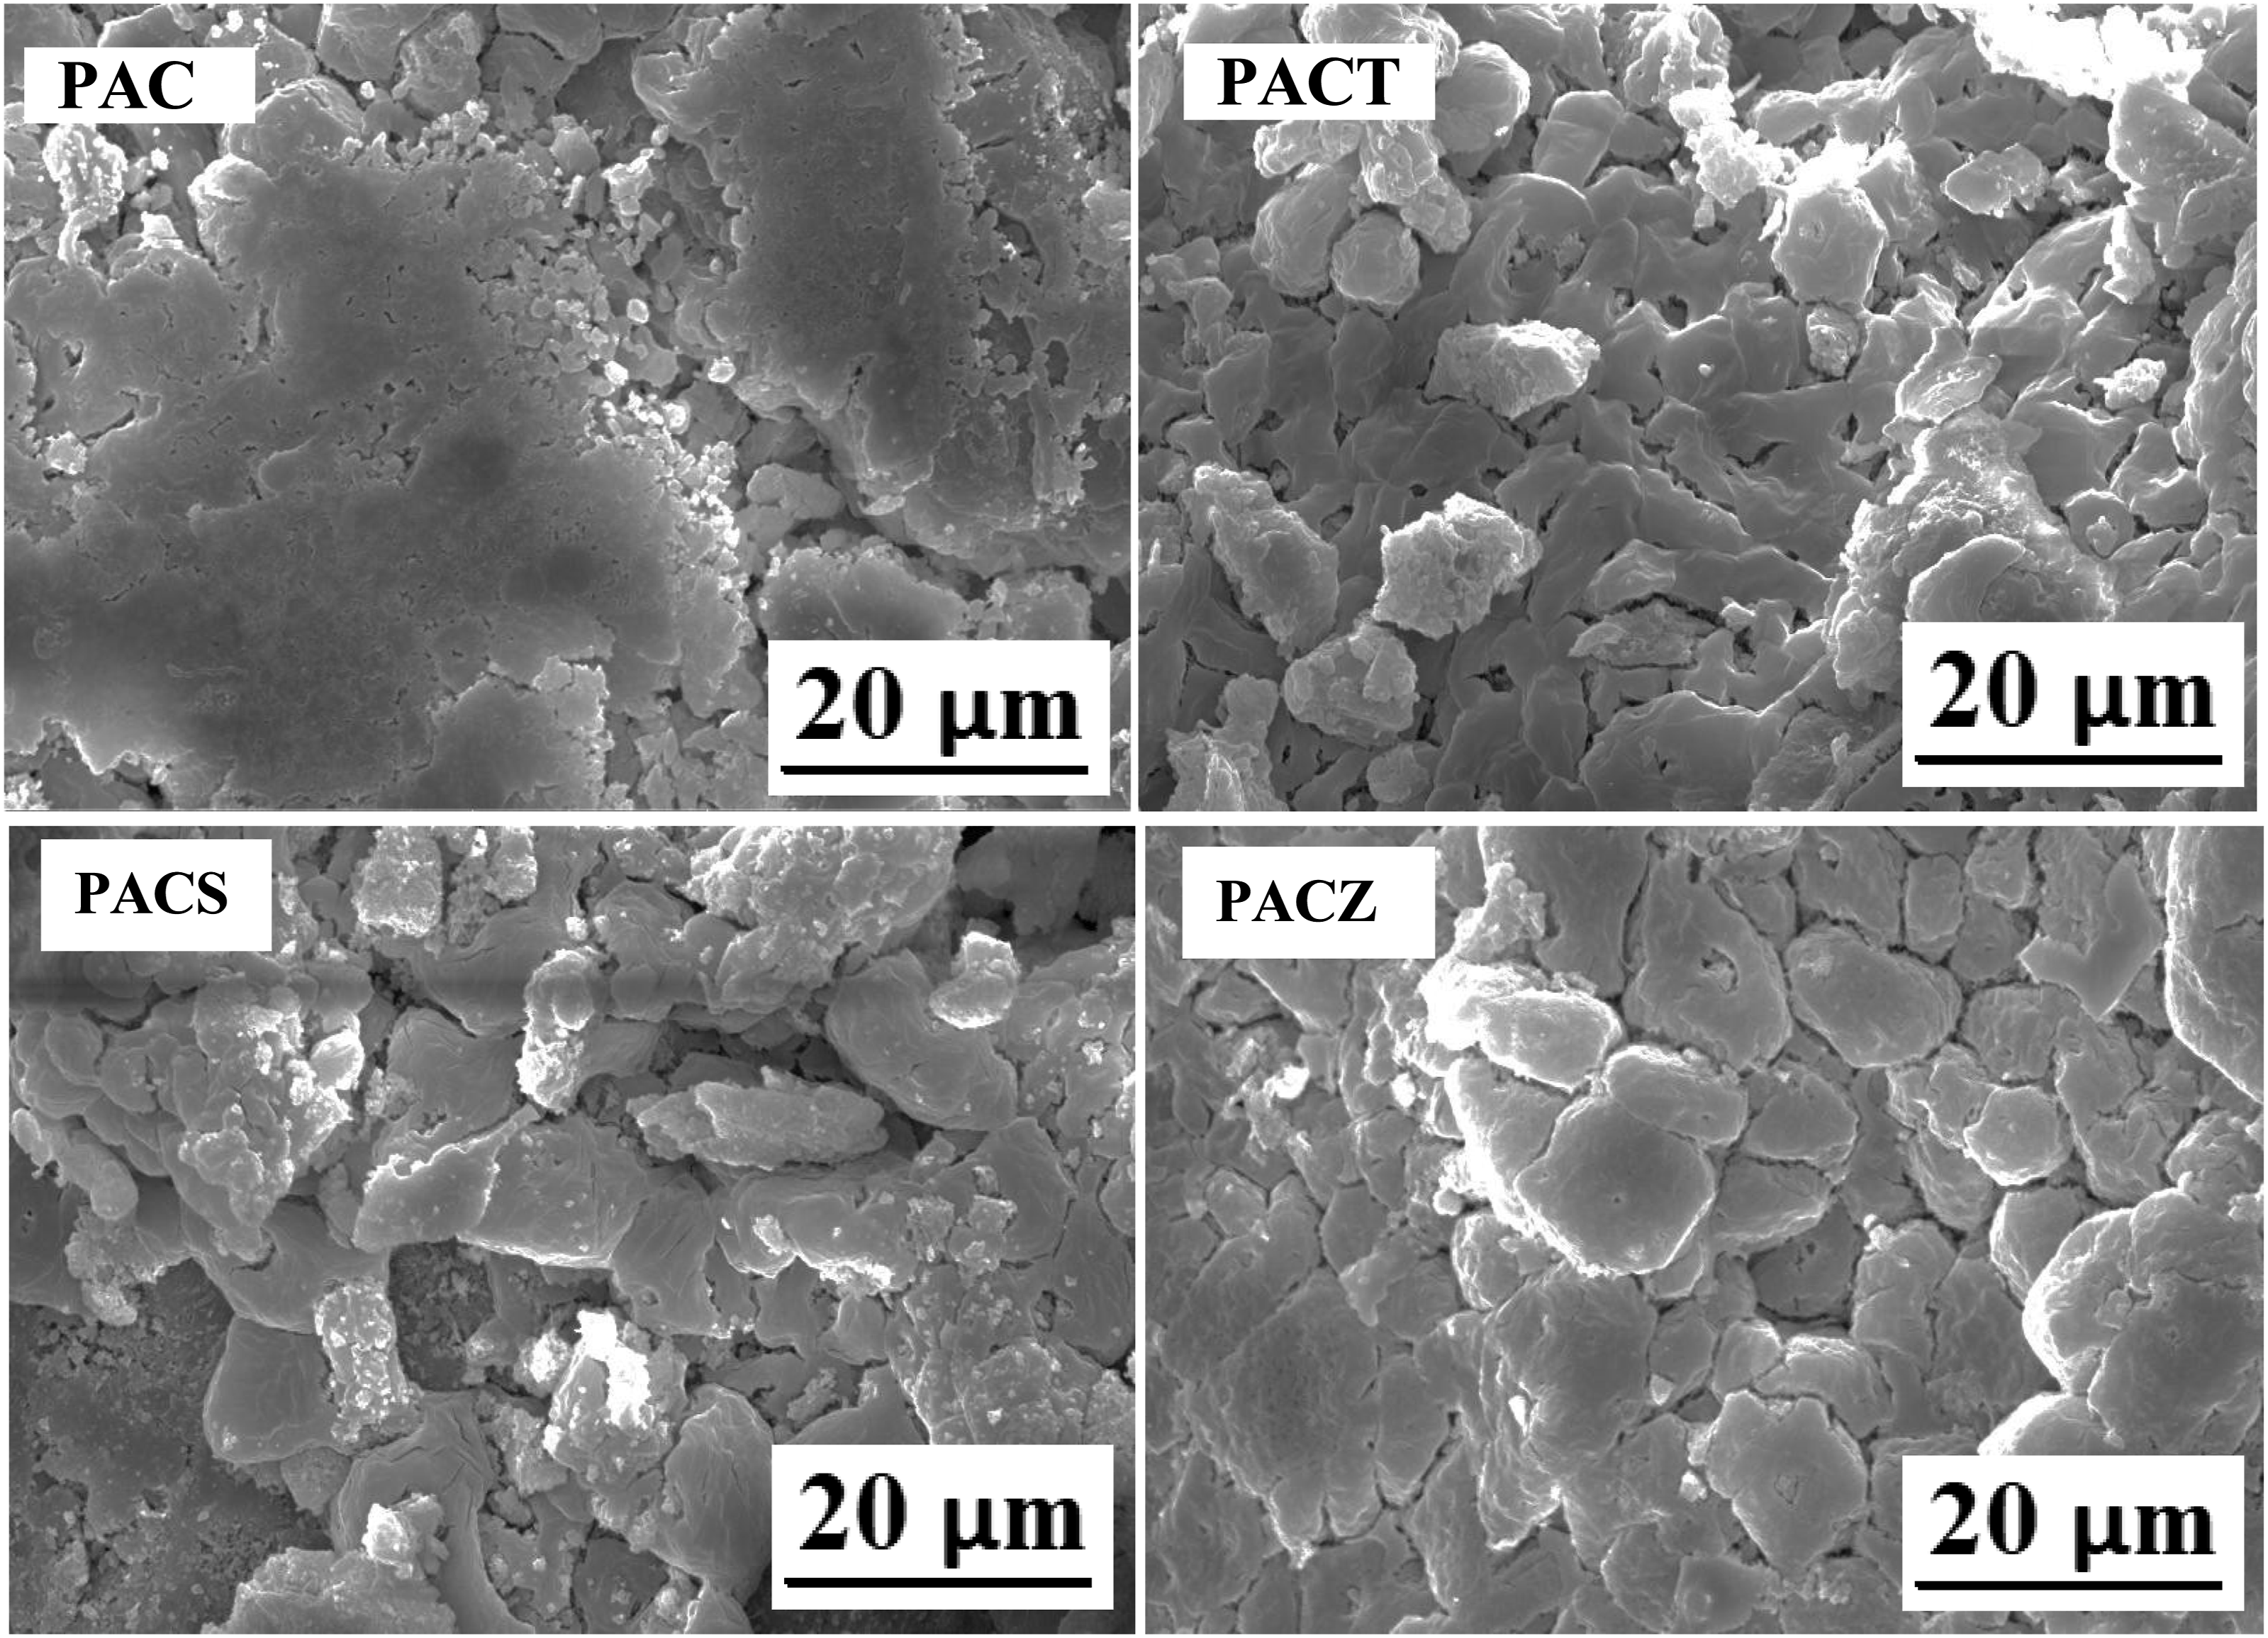
Surface properties
Figure 6(a) and (b) shows the particle size distribution and adsorption isotherms for PAC, PACT, PACS, and PACZ. The presence of porous structures is shown by the type IV with type H3 hysteresis loops seen in all samples (as detected from SEM images). As also shown from SEM images, this may be explained by the gaps that form between the PAC particles because of the incorporation of nano oxides. The surface parameters of each sample, as measured by the BET (Brunauer–Emmett–Teller) method,
43
are shown in Table 3. The table shows the order of surface area as following: PACS > PACZ > PAC > PACT. Additionally, all samples show the mean pore diameter in the range of 14.28–22.21 nm and total pore volumes, VP, in the range of 7.63 × 10⁻³‒ 2.38 × 10⁻² cm3/g. According to the mean pore diameter range, all samples have mesoporous structure. Here, it is a worthwhile to mention that the nanocomposite containing nano TiO2 (PACT) exhibited the highest value of mean pore diameter (22.214 nm). (a) N2-adsorption-desorption isotherms and (b) particle size distribution of PAC, PACT, PACS and PACZ samples. Surface property of PAC, PACT, PACS, and PACZ samples.

Thermal analysis
PAC and its nanocomposites (PAC, PACT, PACS, and PACZ) are evaluated for thermal stability using TGA and DTA; the results are shown in Figure 7(a) and (b). The TGA curve of PAn-CS in Figure 5(a) displays three stages of weight loss. Weight loss of about 7% during the first stage, which took place between 80 and 200°C, was in line with the material’s residual water loss. The breakdown of chitosan, vaporisation, and removal of volatile compounds were responsible for the second stage’s significant weight loss at 200–360°C, which resulted in a 24% overall weight loss.
44
Weight loss of 45% occurs continuously after 360°C and continues until 1000°C during the third stage; this may be primarily caused by the breakdown and disintegration of the polymer backbone. The results found by Ref. 45 were similar. Additionally, TGA of all the composites (PAC, PACT, PACS, and PACZ) reveals weight loss behaviour that was comparable to that of PAC. Weight loss was modified by the presence of nano oxides because of the crucial role that interactions between the nano oxide and the polymer matrix play in this issue. Based on the weight loss behaviour and as illustrated in Figure 7(a), the thermal stability of every sample under investigation is as follows: From PACZ to PACS to PAC > PACT. Additional details on the thermal transition of the PAC and its nano composites can be obtained using differential thermal analysis (DTA), as shown in Figure 7(b). During the DTA measurement, the PAC and its nano composites showed three main peaks. Consistent with the TGA data, the initial endothermic peak at lower temperatures was associated with the release of water molecules adsorbed in polymer composites. The breakdown of chitosan was most likely aided by a decrease in TGA measurement linked to the second endothermic peak, which was located between 230 and 300°C. Around 670–900°C, the third endothermic peak was ascribed to the breakdown of polymer chain, which was consistent with TGA. (a) TGA of PAC, PACT, PACS, and PACZ and (b) DTA of PAC, PACT, PACS, and PACZ.
Performance testing
Electrical conductivity properties
At 10 kHz, the AC-conductivity variation with temperature is examined for PAC, PACT, PACS, and PACZ (Figure 8). The figure demonstrates how the PAC sample’s AC-conductivity enhanced when nano oxides were included. At room temperature, the AC conductivity values were calculated (Figure 9) and tabulated (Table 4). The samples showed the following AC – conductivity values order at room temperature (303 K): Temperature dependence of AC- conductivity of PAC, PACT, PACS, and PACZ samples at 10 kHz. AC- conductivity values of PAC, PACT, PACS, and PACZ samples at 303 K and 10 kHz. Values of AC-conductivity and activation energy of PAC, PACT, PACS and PACZ samples.


[PACT; ơAC = 9.75 × 10⁻⁸ > PACZ; ơAC = 5.33 × 10⁻⁸ > PACS; ơAC = 1.14 × 10⁻⁸ > PAC; ơAC = 2 .00 × 10−9 S m−1]. To understand this conductivity value arrangement behaviour, it is important to note that the conductivity of the polyaniline-chitosan matrix of these composites is influenced by two factors: the physical presence of nano oxides and their involvement as electronic conductive materials. Regarding the first component, the incorporation of nano oxides can result in high conductivity values by forming an appropriate network related to the charge transport mechanism in the base polyaniline-chitosan matrix.46,47 An explanation for this efficient network is interchain hopping; the electrical conductivity of conducting polymers is derived from mobile charge carriers that are integrated into the π-electronic system through composite construction. Self-localization of these charge carriers results in nonlinear structures. Interchain hopping is a required secondary condition, and it is believed that large interchain transfer integrals are the primary cause of charge transport along conjugated chains.48–51 This aspect illustrates why nanocomposites exhibit higher conductivity values than PAC. Contrarily, the hopping process is responsible for the second factor, which has to do with the electrical conductivity of oxides themselves.46,52 Moreover, the sample containing nano TiO2 (PACT) delivered higher conductivity value than the other ones containing nano SiO2 and ZrO2. This can be discussed considering the band gap values of these oxides, the nano TiO2 has lower bad gap value (Eg = 3.2 eV) than that of nano SiO2 (Eg = 5.4 eV) and ZrO2 (Eg = 5 eV) ones. The oxide having low band gap, will have high electronic conductivity. Here, it is worthwhile to mention that the order of band gap values of oxides comes in good matching with the order of conductivity values of their nano composites, as shown above.
Furthermore, as indicated in Table 3, the PACT sample with the highest mean pore diameter (22.2 nm) in comparison to the other composites is also displaying the best electrical conductivity. Additionally, for every sample under investigation, Figure 8 demonstrated that AC- conductivity rises with temperature. This behaviour can be presented by Arrhenius formula.
53
Activation energy values of PAC, PACT, PACS, and PACZ samples. Frequency dependence of AC- conductivity of PAC, PACT, PACS, and PACZ samples at 303 K.


Dielectric constant
Temperature effects on frequency (at 303 K) and dielectric constant (ԑ`) (at 10 kHz) are investigated for PAC, PACT, PACS, and PACZ (Figures 12 and 13). First, the temperature dependency of the dielectric constant shows that it increased with temperature in all samples. This can be explained by assuming that the field tries to align the more localised dipoles created by thermal energy in the direction of the temperature increase.
54
In addition, the PACT sample had the highest dielectric constant value among the others. The sample’s value was 24, however the other values were in the following order: PACZ; 18.6 > PACS; 10 > PAC; 8.5 at 303 K. The disordered mobility of the charge carrier along the backbone of the conducting polymer chain partially explains the dielectric characteristics of these samples, which are primarily caused by interfacial polarisation and inherent electric-dipole polarisation.
55
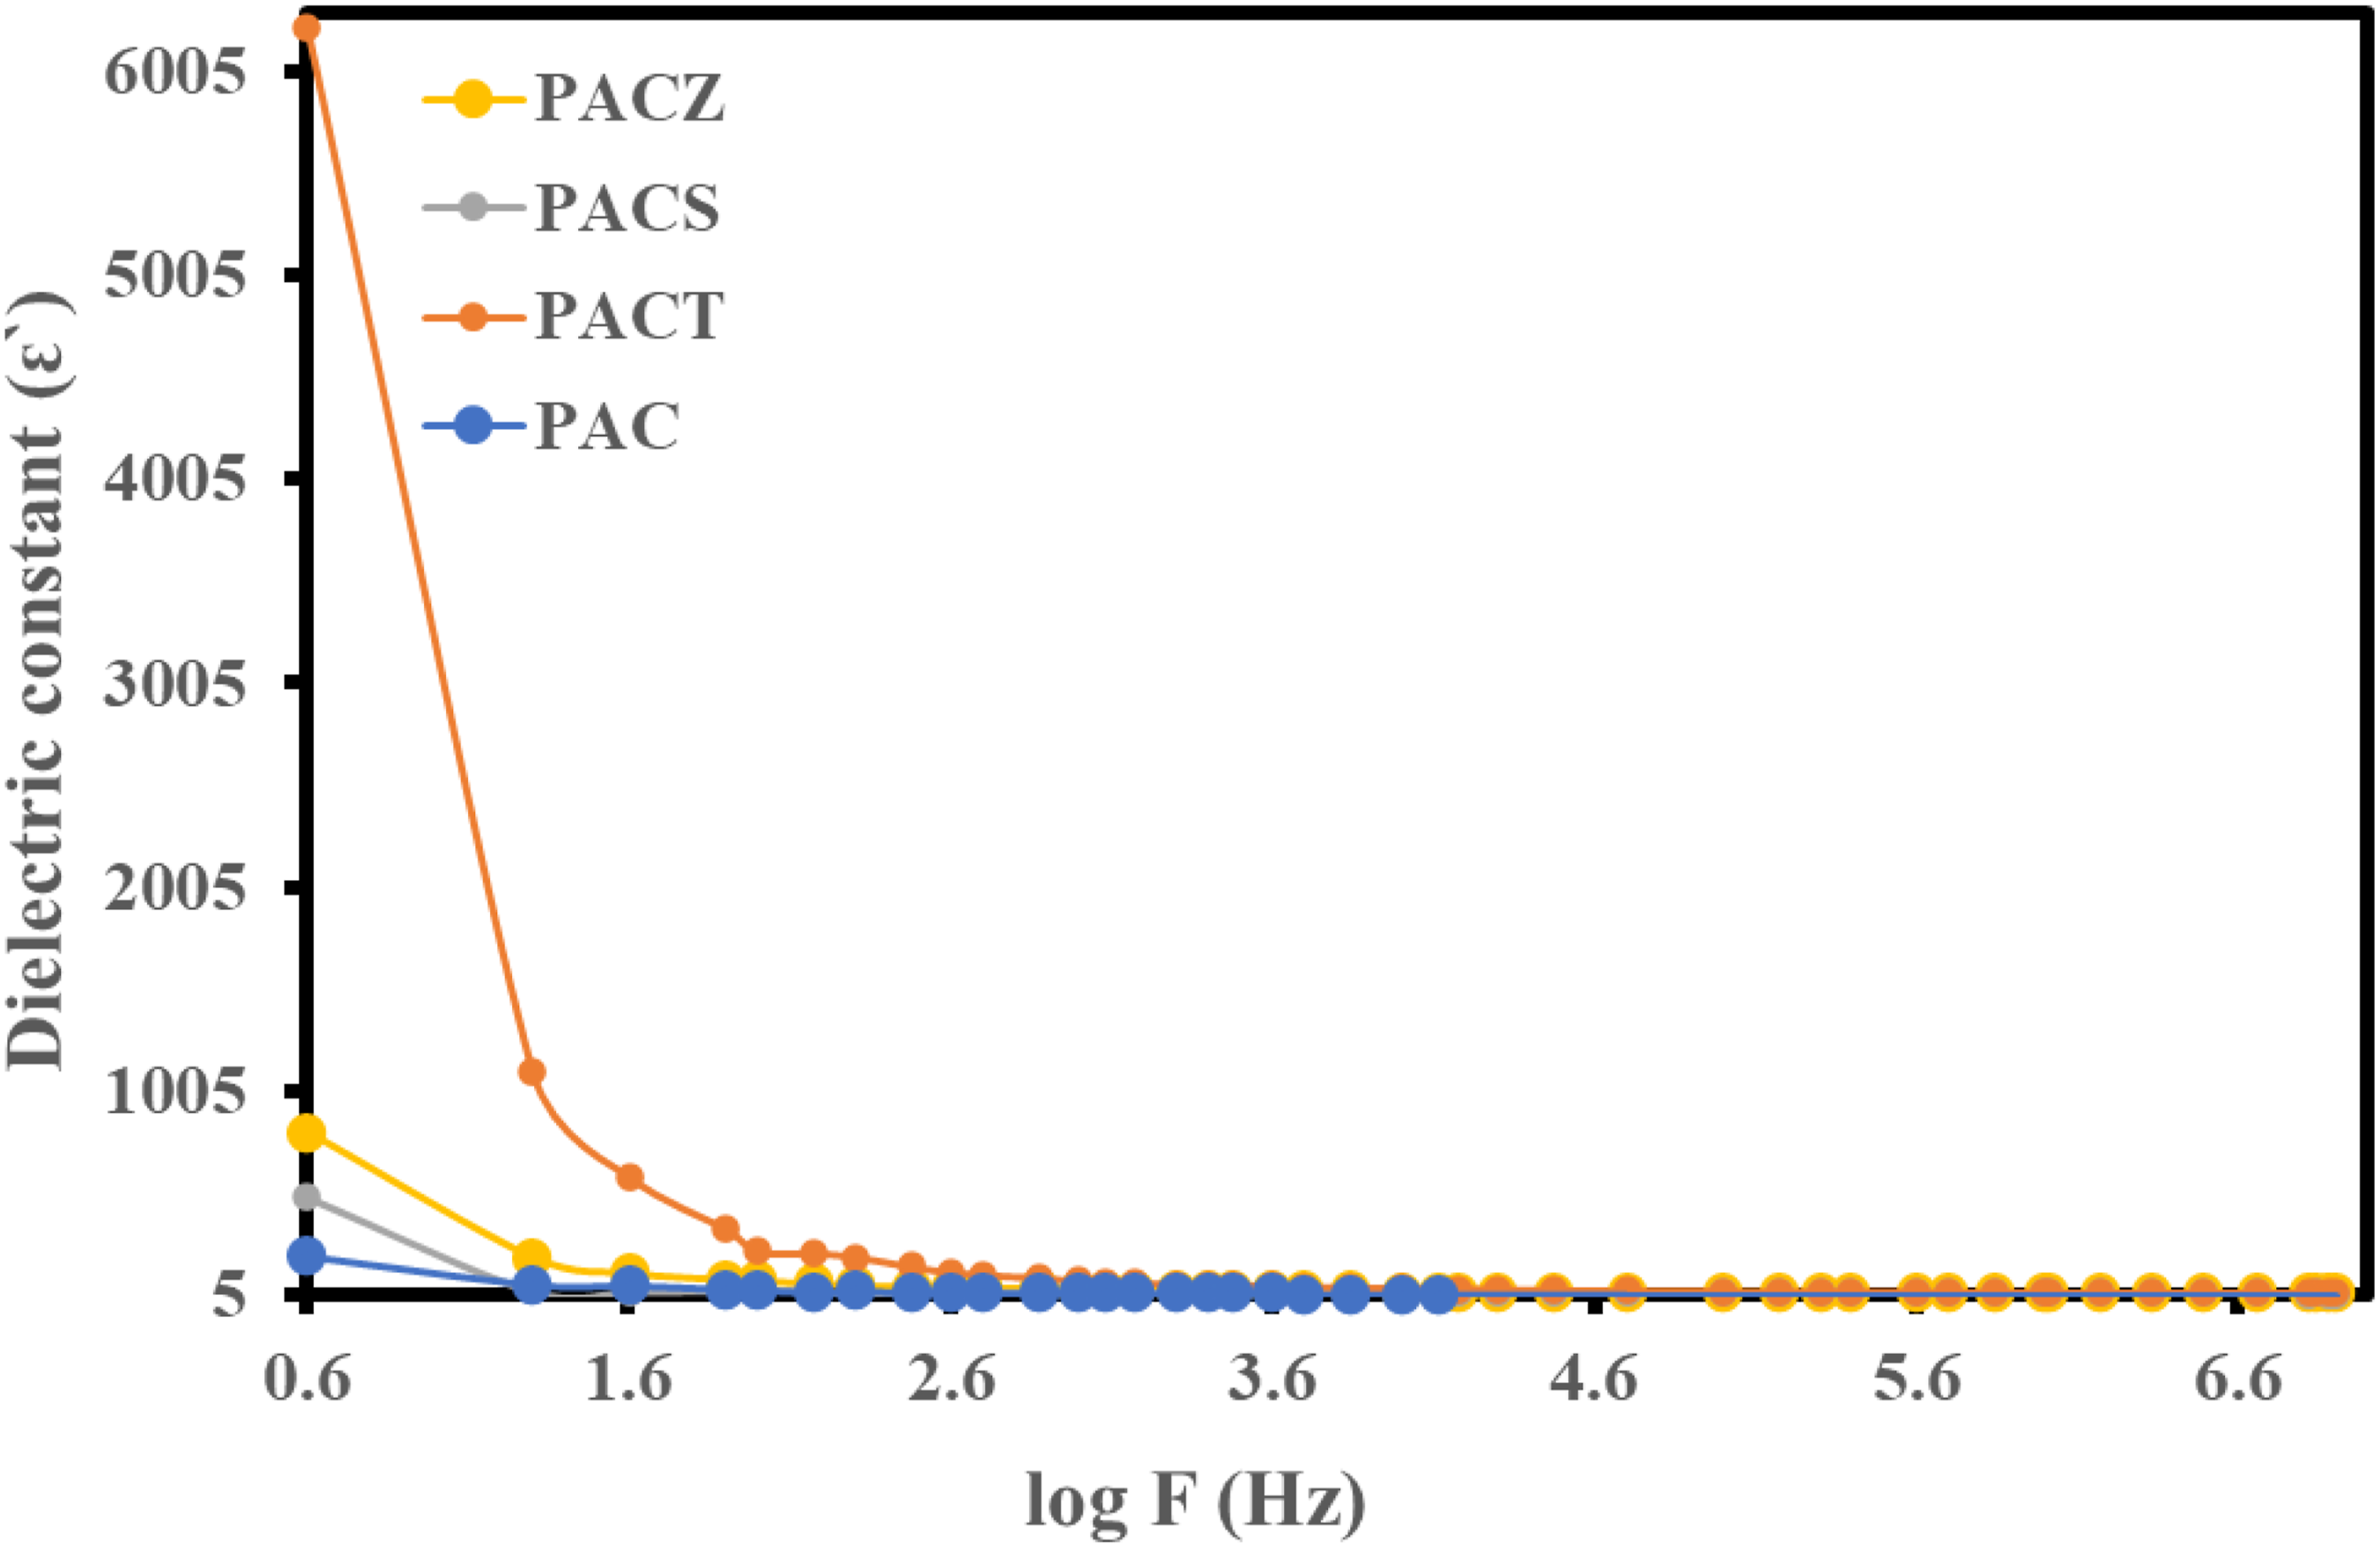
Second, there was a downward trend in the dielectric constant’s frequency dependency. Furthermore, all samples at 10 kHz have the same dielectric constant order and temperature dependency order. The PACT nanocomposite showed a value of 32.7, whilst the other samples showed the following values: PACZ; 18.6 > PACS; 9.94 > PAC; 5.5 at 10 kHz. Temperature dependence of dielectric constant of PAC, PACT, PACS, and PACZ samples at 10 kHz. Frequency dependence of dielectric constant of PAC, PACT, PACS, and PACZ samples at 303 K.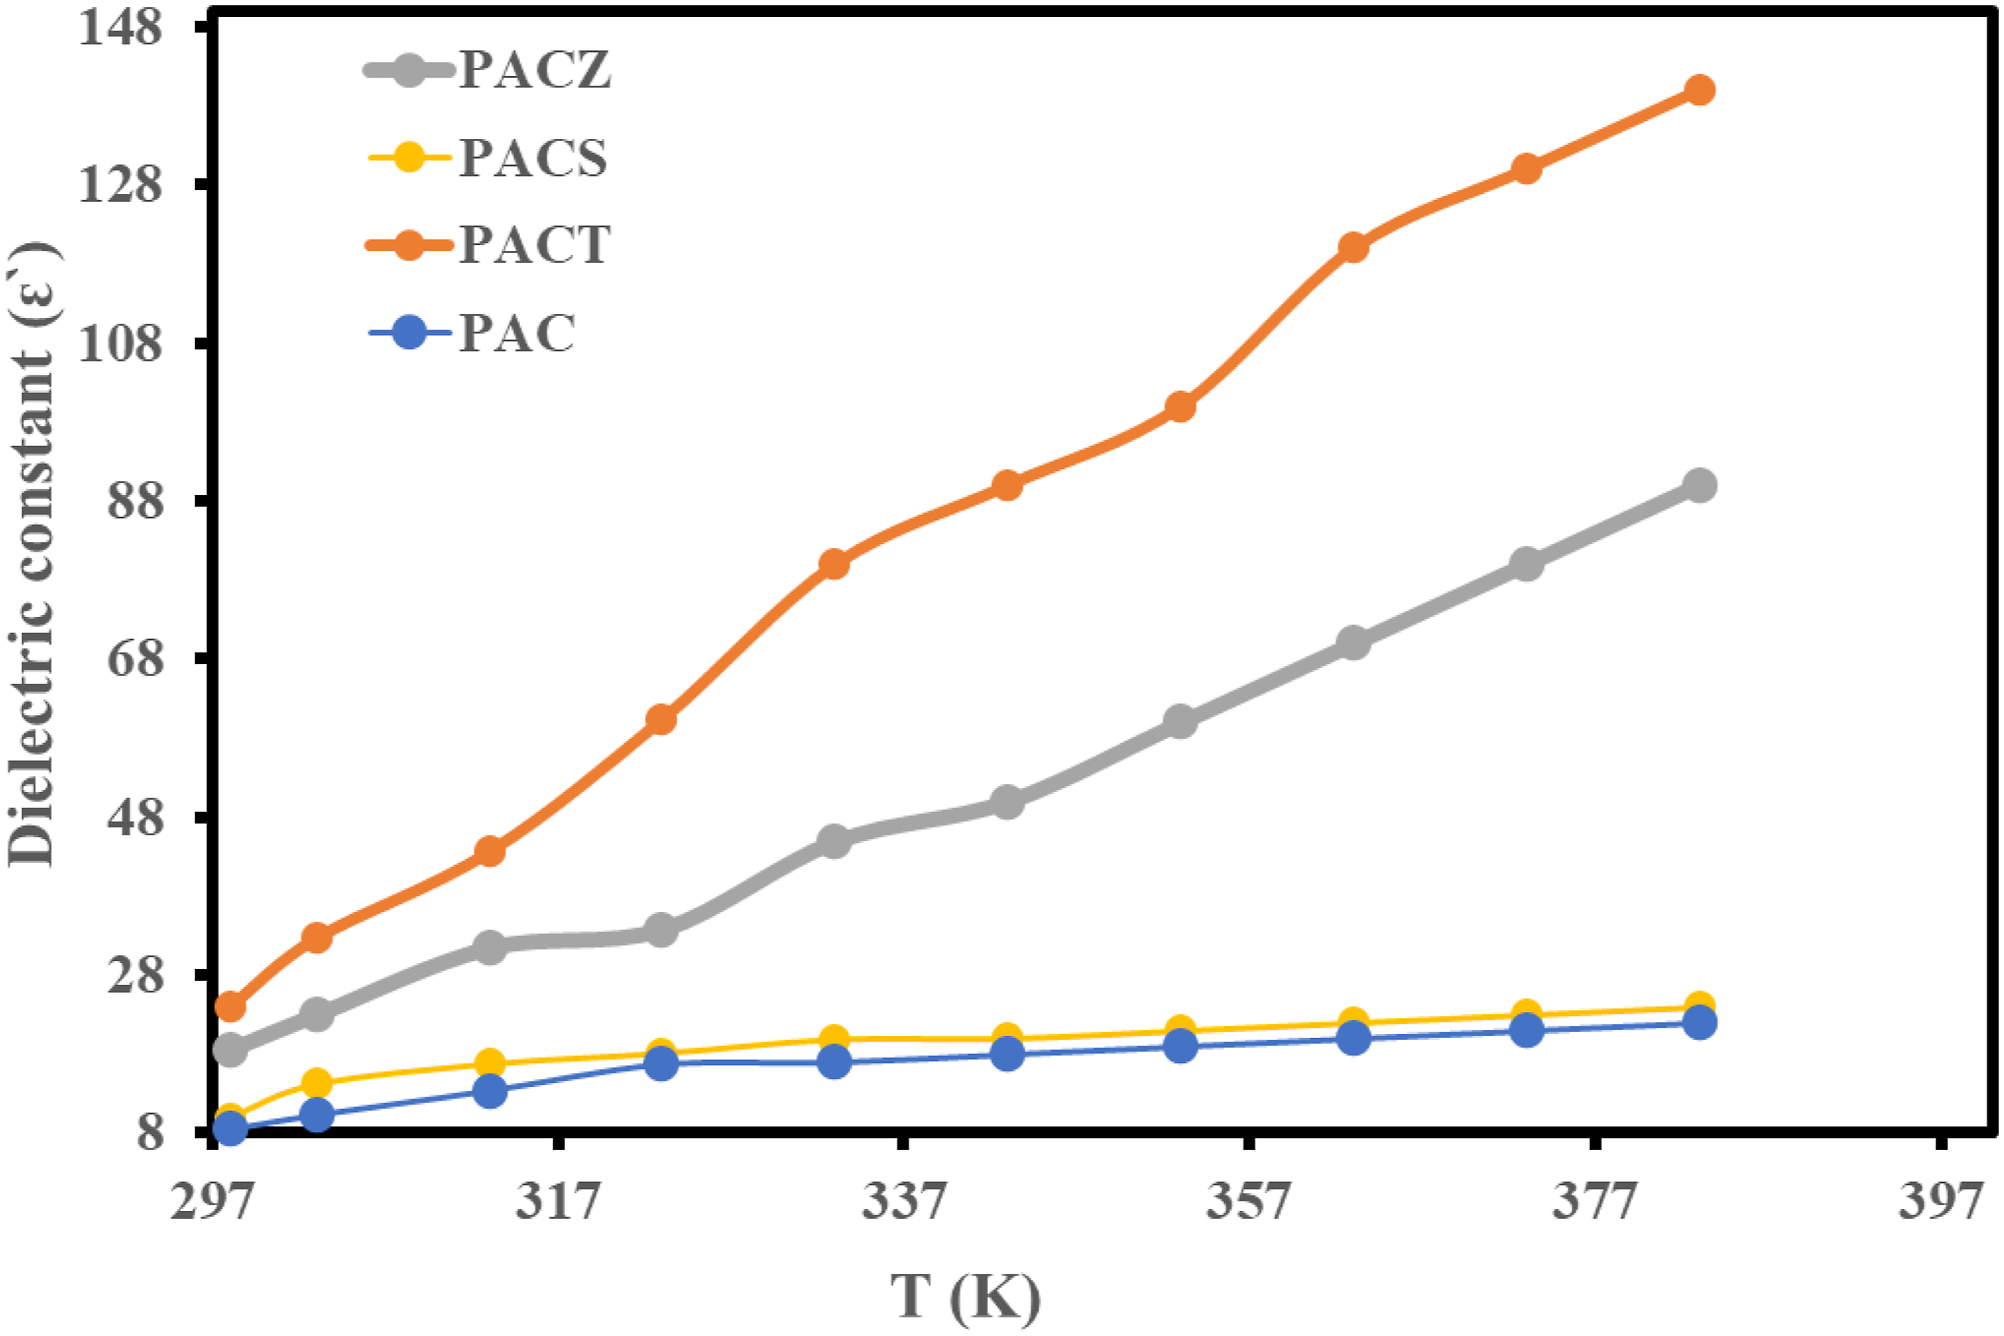
Dielectric loss
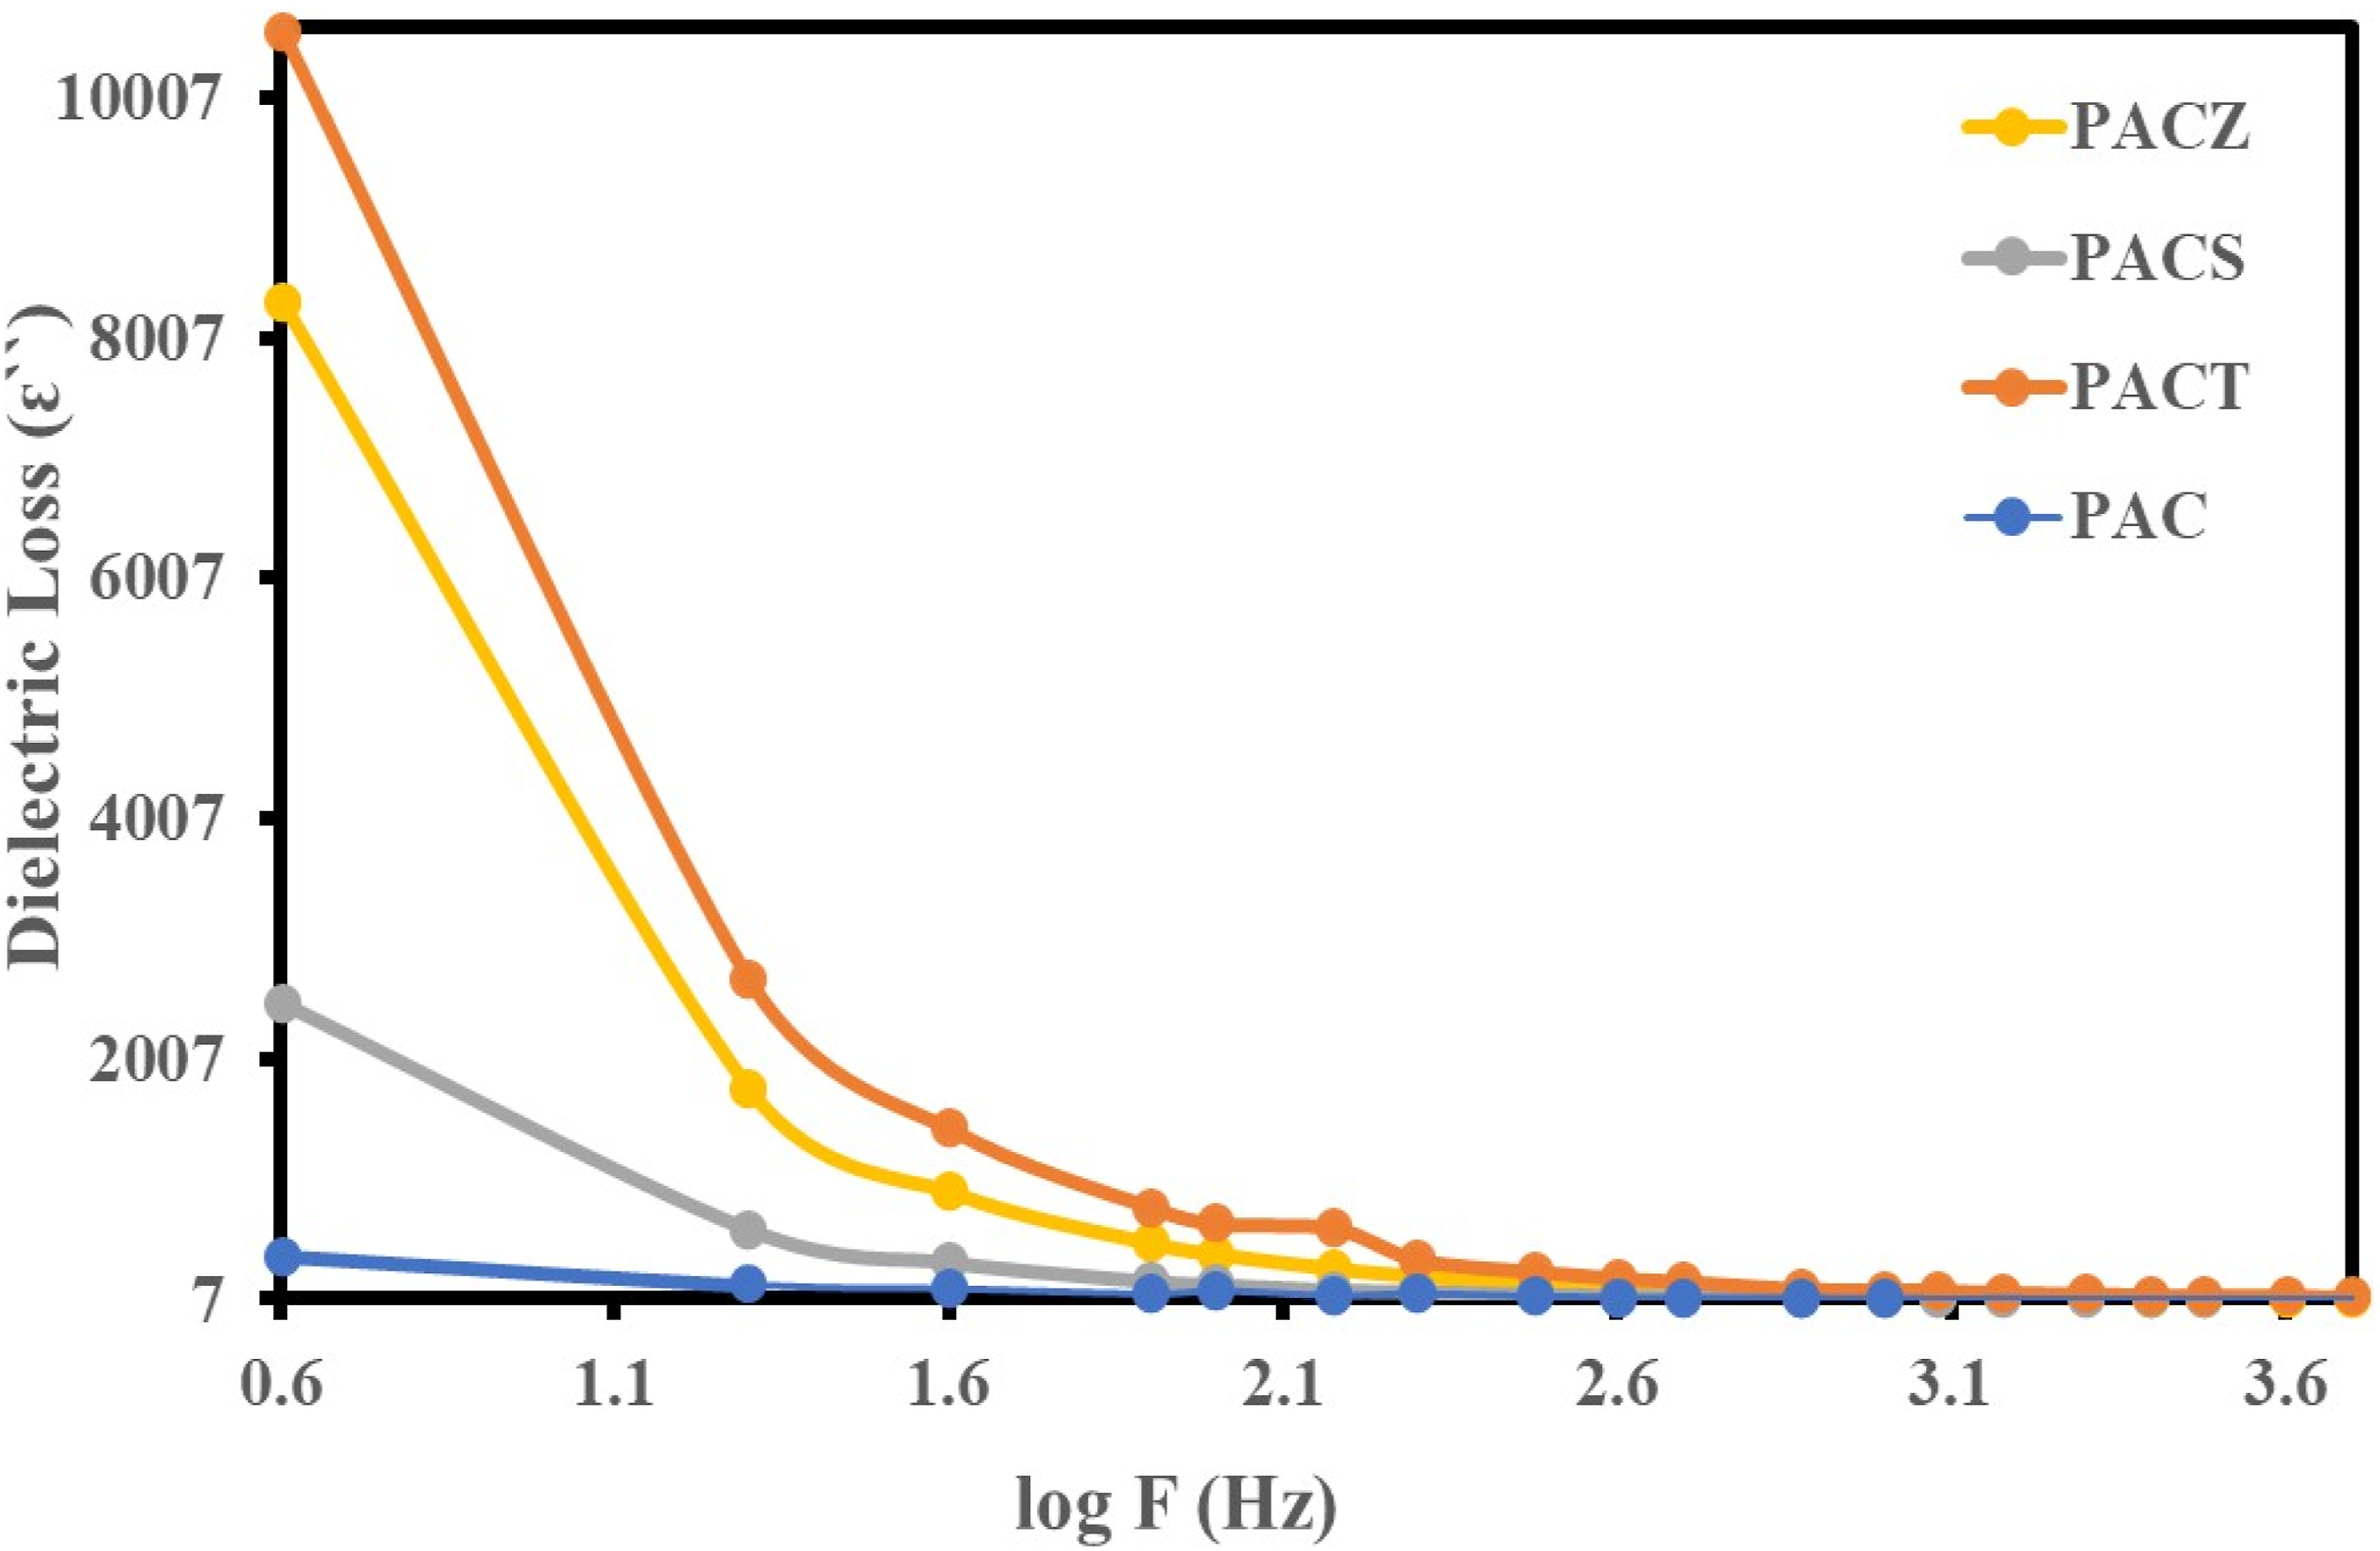
The dielectric loss (ɛ``) for PAC, PACT, PACS, and PACZ is plotted against temperature (at 10 kHz) and frequency (at 303 K) in Figures 14 and 15. The dielectric constant and the dielectric loss’s temperature and frequency dependence displayed comparable characteristics. Additionally, the sample values correspond to the previously stated sequence. At 10 kHz and 303 K, the PACT sample showed a value of 17.5. Given their low dielectric loss values, the examined samples are recommended as effective shielding materials.
56
In other words, due to cooperation of the charges and the consequent reduction of the relaxation period, the dielectric loss increases with temperature. This affects the dielectric loss in two ways. First, it causes more friction between the charges, which raises the amount of energy dissipated. Conversely, less energy will be needed to overcome the medium’s internal mechanical friction. Furthermore, the strong periodic reversal of the field at the contact is the reason for the dielectric loss decline with increasing frequency. As frequency increases, charges’ contribution to dielectric loss diminishes.
57
Temperature dependence of dielectric loss of PAC, PACT, PACS, and PACZ samples at 10 kHz. Frequency dependence of dielectric loss of PAC, PACT, PACS, and PACZ samples at 303 K.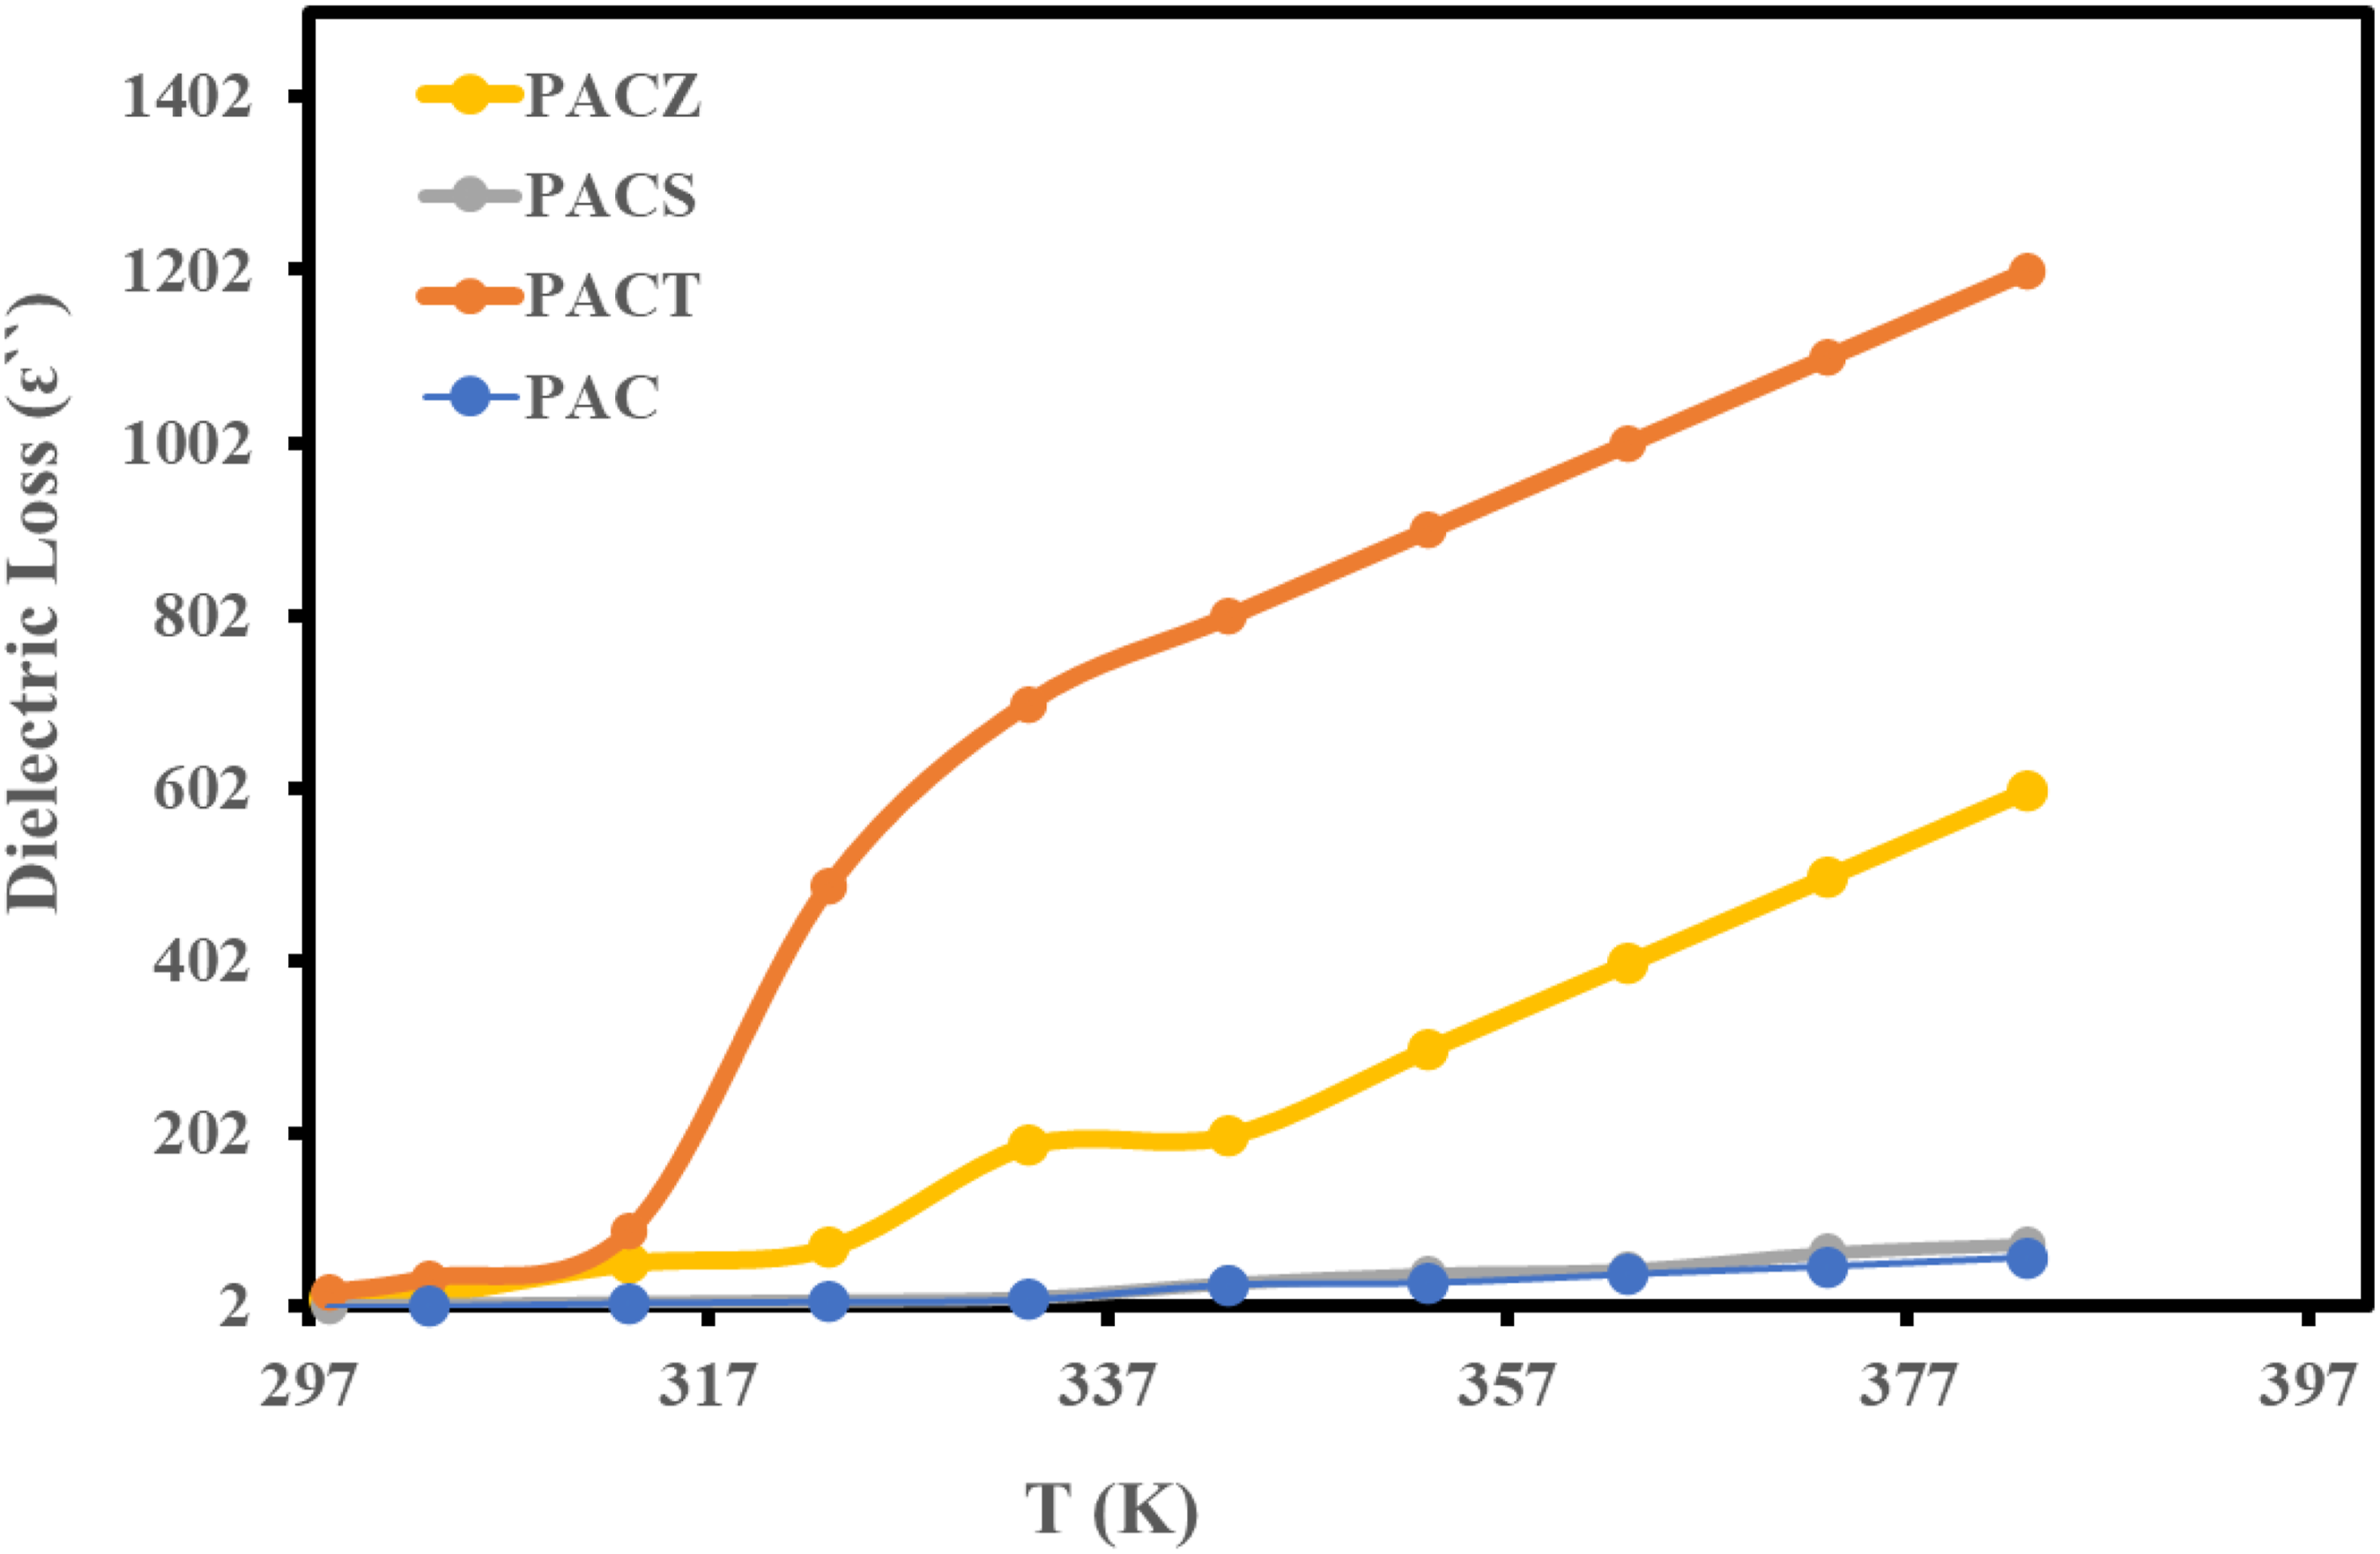
Tangent loss (tan δ)
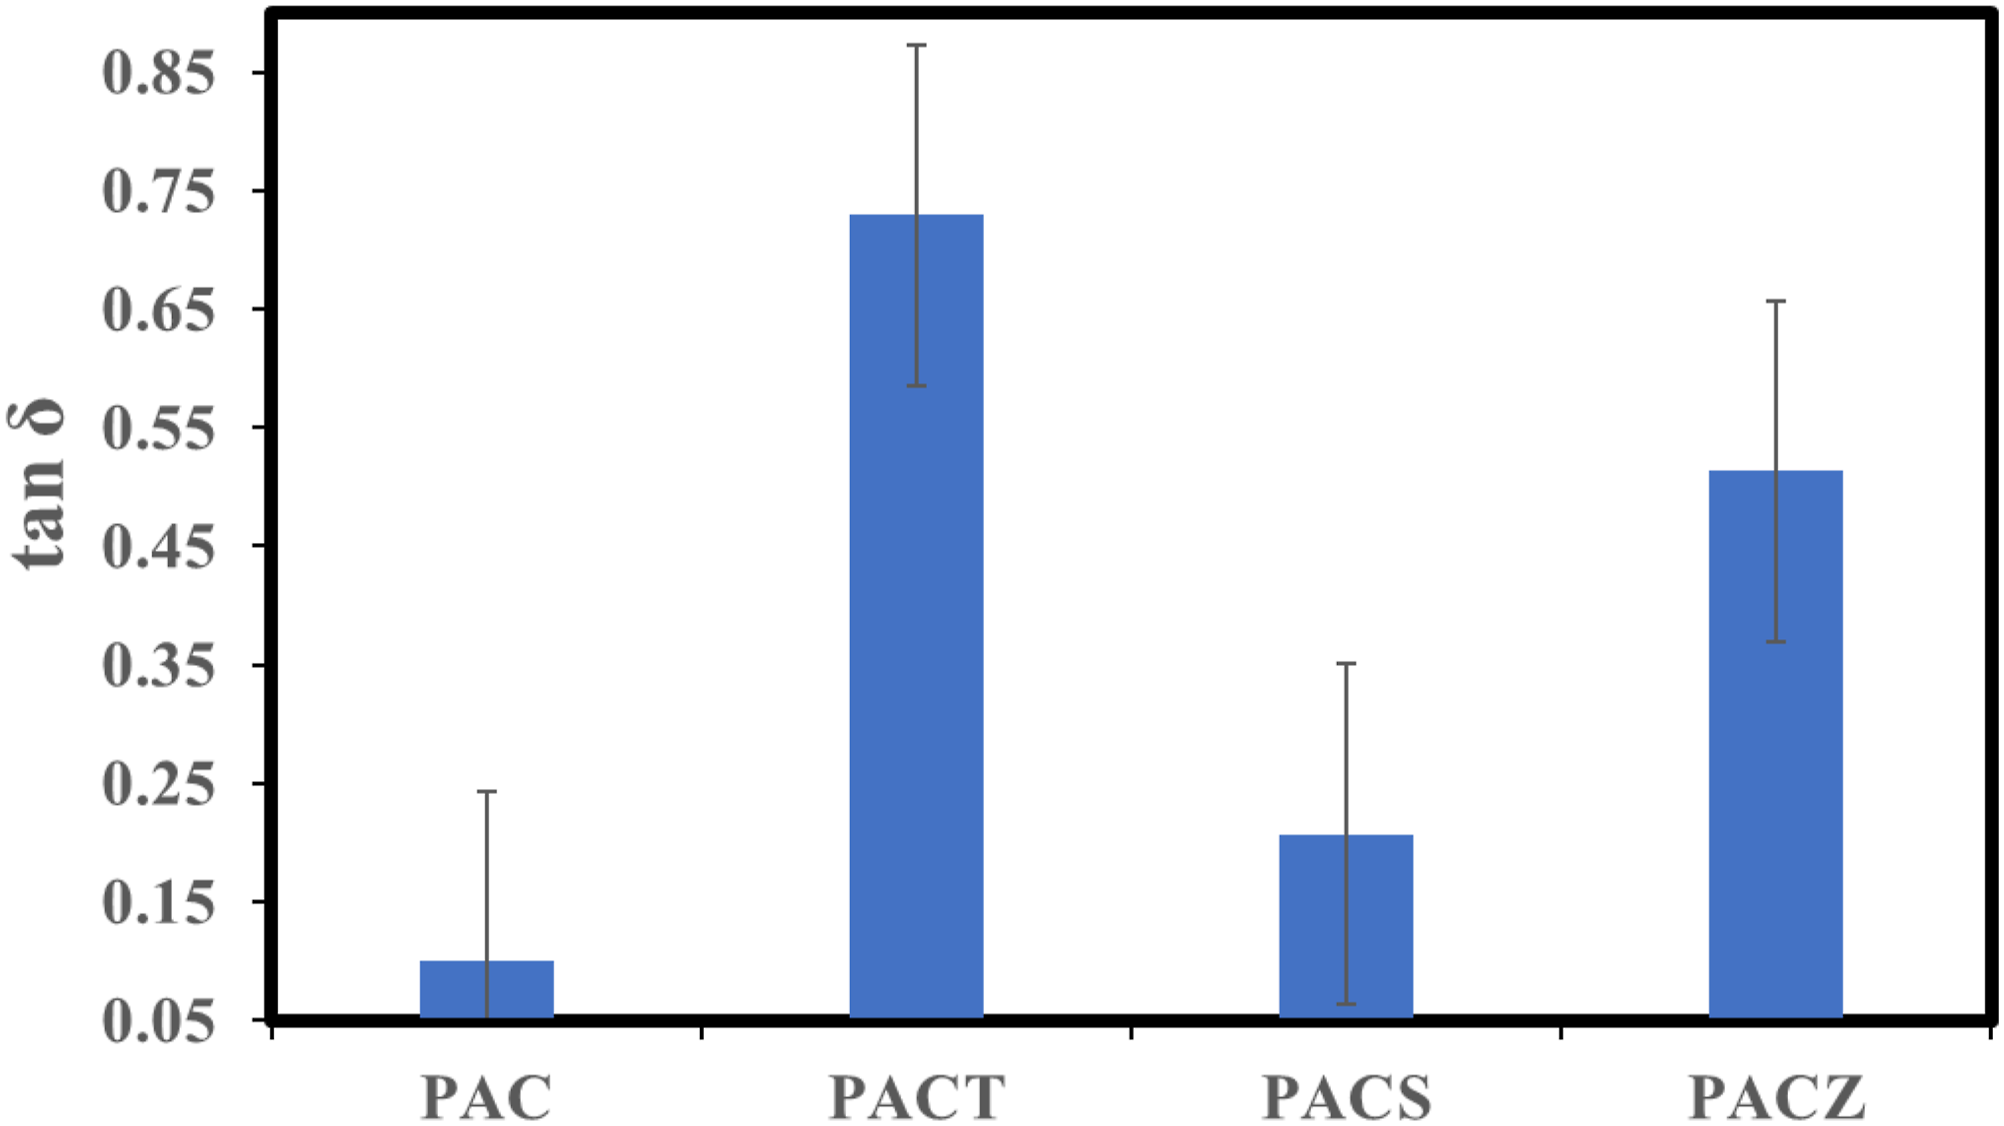
Tangent loss (tan δ) versus frequency (at 303 K) is studied for PAC, PACT, PACS, and PACZ, Figures 16 and 17. The hopping electrons’ relaxation period matching with the applied frequency is what causes the PACT and PACZ peaks in Figure 16.58,59 At higher frequencies, the composites’ low and constant values of ɛ`` and tan δ show that the materials are lossless, making them ideal for high-frequency, microwave, and radio frequency device applications such as dynamic random-access memory and decoupling capacitors.58–60 Figure 17 displays all composites’ tan δ values at 303 K and 1 MHz. When compared to the other samples, the PACT sample had the highest tan δ value (0.73), displaying the following order: PACZ; 0.51 > PACS; 0.2 > PAC; 0.1. Frequency dependence of tangent loss (tan δ) of PAC, PACT, PACS, and PACZ samples at 303 K. Tangent loss (tan δ) values of PAC, PACT, PACS, and PACZ samples at 303 K and 10 kHz.
Complex impedance
The complex impedance at 303 K for the PAC, PACT, PACS, and PACZ samples is displayed in Figure 18. All the composites’ semicircle behaviour verified their electrical conductivity.
61
Additionally, as shown in Figure 18, the equivalent circuit was calculated from the complex impedance spectrum of each composite, where R1 and C1 represent the capacity and bulk resistance, respectively. The bulk ionic conductivity values of each composite were also calculated and displayed in Table 4 and Figure 19. Among the samples, the PACT sample had the highest bulk conductivity value (σb = 2.95 × 10⁻⁸ S m−1) and the order was as follows: PACZ; 2.17 × 10⁻⁸ > PACS; 5.58 × 10⁻⁹ > PAC; 2.03 × 10⁻⁹ S m−1. The best sample from this investigation (PACT) was compared to other relevant samples that have already been studied9,62,63 in terms of tangent loss (tan δ) at 1 MHz, Table 5, to demonstrate the originality of the samples that were examined. According to the table, the PACT sample has the lowest tangent loss (tan δ) of all the samples. Based on these preliminary dielectric measurements, the material may be used for high-frequency device applications such as dynamic random-access memory and decoupling capacitors in radio frequency and microwave technology after further investigations.64,65 Complex impedance of PAC, PACT, PACS, and PACZ samples at 303 K. Bulk conductivity values of PAC, PACT, PACS, and PACZ samples at 303 K. Comparison of dielectric properties for PACT sample with other similar systems.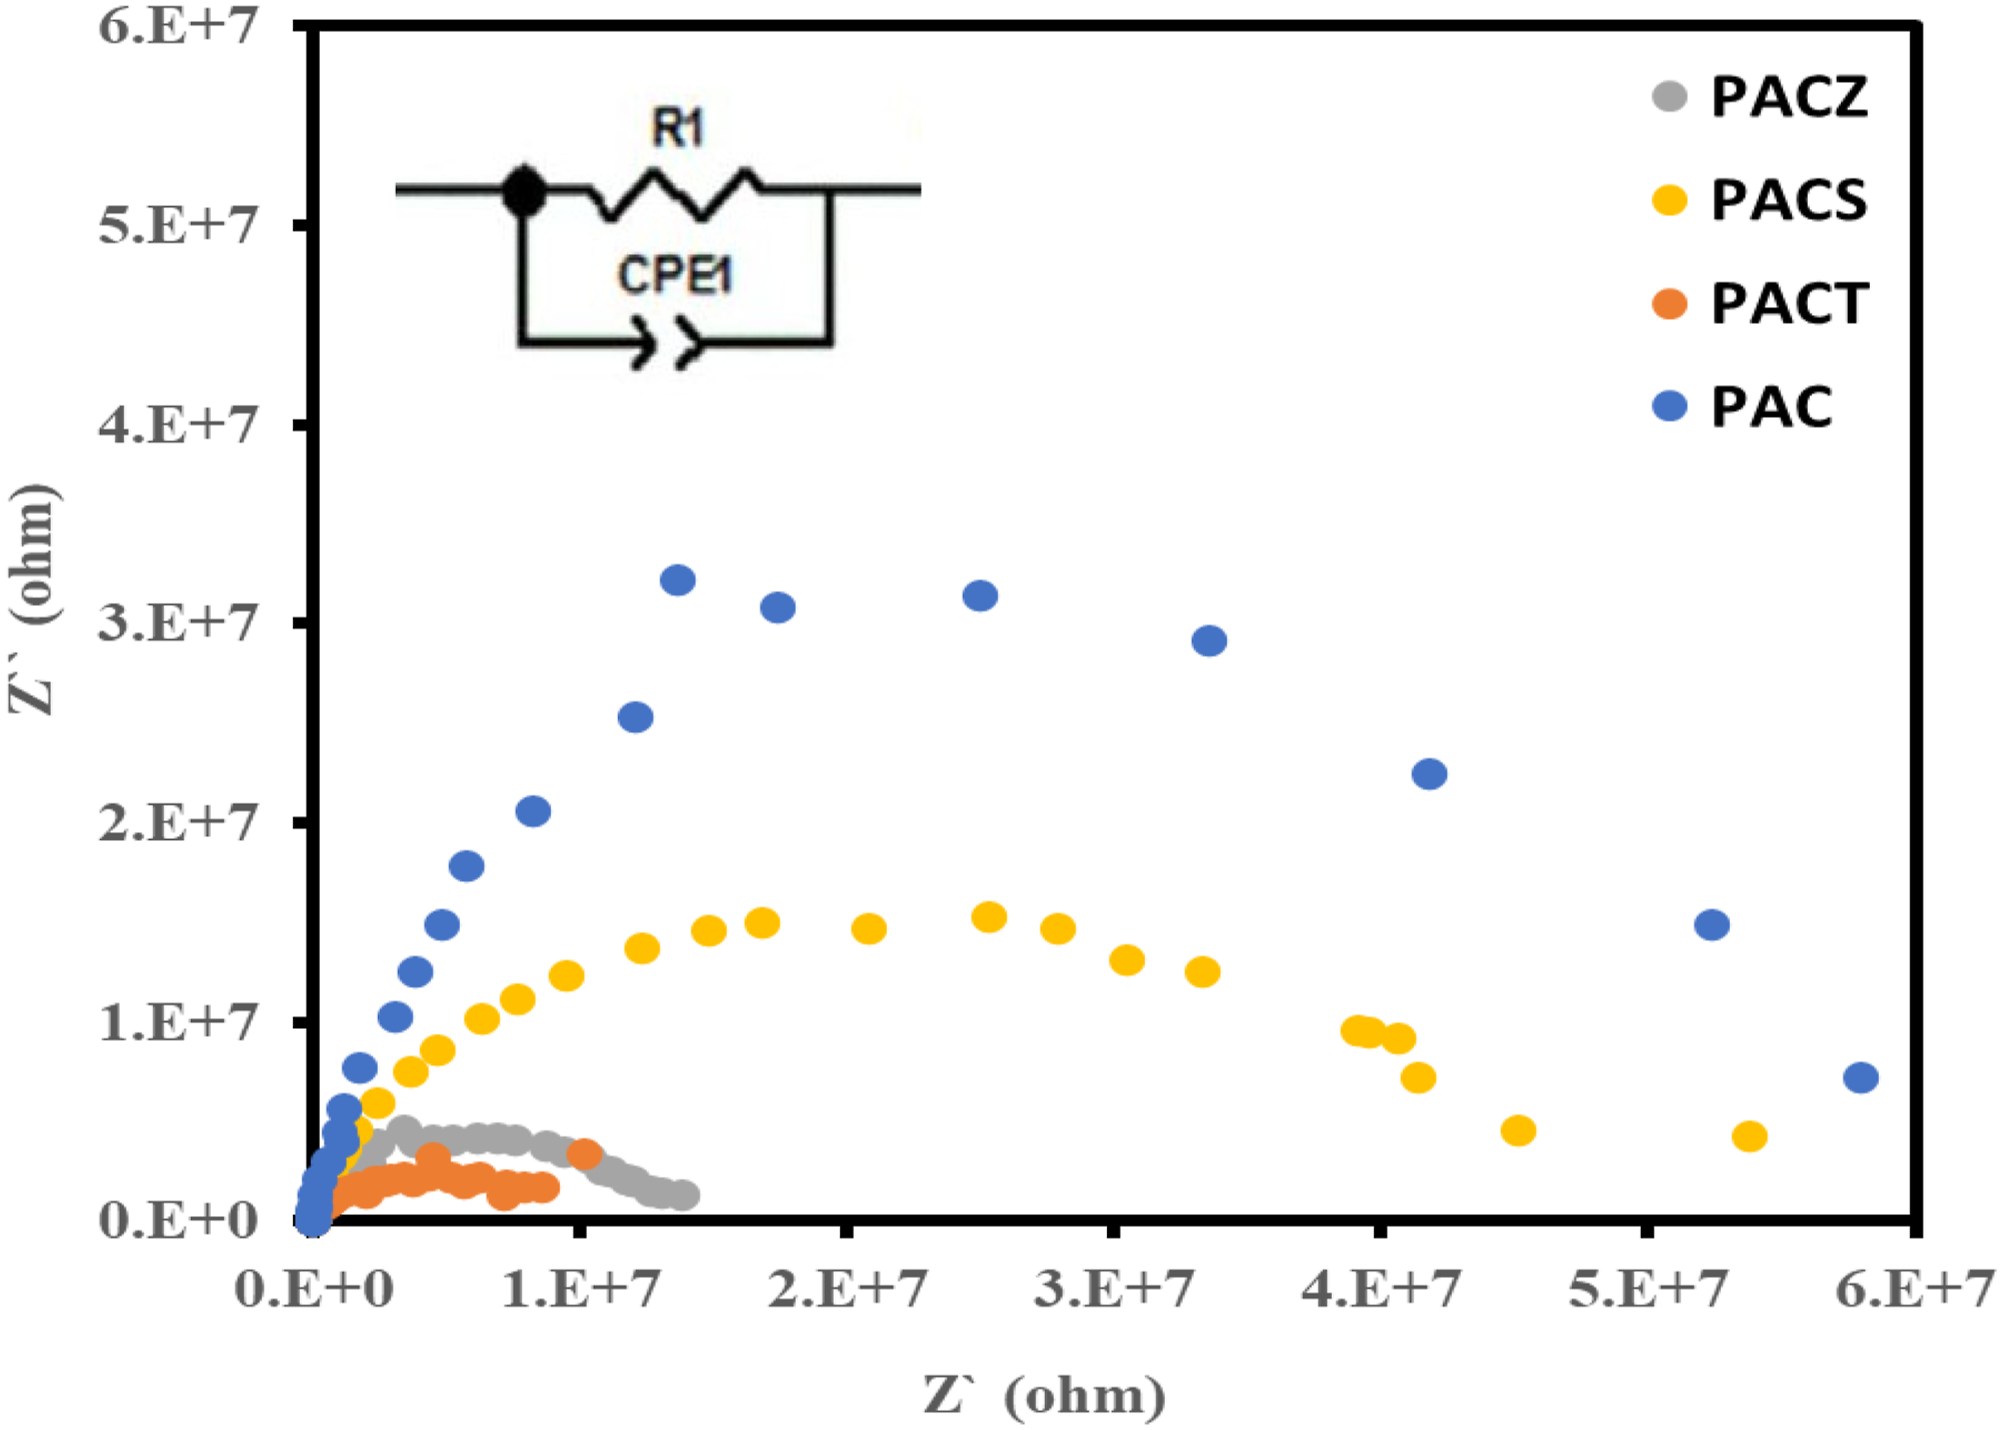


Conclusions
The aim and novelty of this work is to modify the structure of the polyaniline -chitosan matrix through incorporating different nano oxides in a definite concentration, to synthesize interacted structural matrix which supports the electrical conductivity and dielectric properties. In the present work, a polyaniline-chitosan composite including various nano oxides (MO2, M = Ti, Si, and Zr) was created using an in situ chemical polymerization technique. The impact of those nano oxides on the polyaniline-chitosan matrix was demonstrated by the structural characterization of every sample under investigation. The sample with nano TiO2 (PACT) has the best dielectric qualities and the highest conductivity value. At room temperature, the AC conductivity value of the PACT sample was 9.75 × 10⁻⁸ S m−1. Simultaneously, the sample yielded the highest dielectric constant value when compared to the others; its value was 24, while the other samples displayed the following values in order: PACZ; 18.6 > PACS; 10 > PAC; 8.5 at 303 K. At 303 K and 10 kHz, the sample also had a dielectric loss value of 17.5. Furthermore, in comparison to the other samples, which displayed the following order, the PACT sample also displayed the highest bulk conductivity value (σb = 2.95 × 10⁻⁸ S m−1): PACZ; 5.58 × 10⁻⁹ > PAC; 2.03 × 10⁻⁹; 2.17 × 10⁻⁸ > PACS. At 1 MHz, the PACT sample had the lowest tan δ value (0.19) among the others in consideration of dielectric characteristics. From the comparison study with other related and previously studied samples, the PACT sample showed the lowest dielectric properties (tangent loss (tan δ)). Based on these preliminary dielectric measurements, the material may be used for high-frequency device applications such as dynamic random-access memory and decoupling capacitors in radio frequency and microwave technology after further investigations including evaluation under real device conditions.
Footnotes
Funding
The authors disclosed receipt of the following financial support for the research, authorship, and/or publication of this article: This work was supported and funded by the Deanship of Scientific Research at Imam Mohammad Ibn Saud Islamic University (IMSIU) (grant number IMSIU-DDRSP2603).
Declaration of conflicting interests
The authors declared no potential conflicts of interest with respect to the research, authorship, and/or publication of this article.
Data Availability Statement
Data will be made available on a reasonable request.