
Abstract
Mass production of tires and their subsequent storage after use is a serious environmental problem that is tried to be solved in various ways. One of these ways is the mixture of these old used tires (ground tire rubber (GTR)) with various thermoplastic and thermostable polymers. These blends are made by modifying the pretreatment the GTR is subjected to, the degree of devulcanization, the mixing or pressing conditions, etc. Later the mixtures are analyzed structurally and mechanically, looking for possible industrial applications for them. The present work aims to obtain materials suitable for the electric industry from the mixture of polyamide with old used tires (GTR), starting from the requirement of minimum recycling costs, that is using vulcanized GTR without any prior treatment but acting on the particle sizes with a simple and inexpensive screening. A novelty of this study is the large number of compounds analyzed, and the deep analysis these have been submitted to dielectric, mechanical, thermal and microstructure analyses to get a large number of variables in each test. Compounds were categorized as the three GTR particle sizes (p < 200 μm, 200 < p < 500 μm and p > 500 μm) and seven concentrations of GTR (0%, 5%, 10%, 20%, 40%, 50% and 70%), resulting in a total of 21 new compounds. In addition, in order to have the dielectric tests as much exhaustive as possible and to show the behavior of the compound under widely changing conditions, a wide range of temperatures (30–120°C) and frequencies (1 × 10⁻² Hz to 3 × 10⁶ Hz) were taken into consideration. All these data have provided an accurate characterization of the properties of the new compounds, and according to these results, possible electrical applications have been explored, with the requirement that they must comply with official regulations.
Keywords
Introduction
The so important problem of accumulation of old used tires (ground tire rubber (GTR)) 1 –3 has driven the efforts of the international scientific community to seek solutions for their recovery and reuse. 4 Many plastic materials include elastomers to improve their toughness. In general, a thermoplastic or thermosetting polymer acts as a matrix and the elastomer acts as a dispersed phase. 5,6 Moreover, as in other two-phase polymer blends, 7 –9 interfacial compatibility between components is important for achieving the desired properties. In the case of recycled elastomers, when mixed with thermoplastic polymers, such as the polyamide (PA), the expected compatibility is low. One way to increase the compatibility between components is by reducing the cross-linking degree of GTR by devulcanization. 10 –12 Another way to increase the interfacial bond is by pretreating with acid 13,14 and producing micropores on the elastomer surface which facilitate the union between phases. 15,16 But this method makes the final product more expensive, besides having a weak influence on the improvement of the properties of the compound. Significant changes in the properties are observed when the size of the reinforcement particles is changed, which is the alternative studied in this article. 17,18 Since initially acquired GTR particles were mixed with different sizes, it was necessary to make a prior classification of the three desired particle sizes (p < 200 μm, 200 μm < p < 500 μm and p > 500 μm). This classification should be done through a simple and inexpensive technique in order not to increase the final cost of the compound. So, it was decided to use the screening method, which, however, presents the drawback of not taking advantage of the entire initial amount of GTR that was acquired.
This study aims to analyze the behavior of PA mixed with old used tires (GTR) according to the three particle sizes the GTR has been divided into and the seven selected concentrations (0%, 5%, 10%, 20%, 40%, 50% and 70% of GTR). Dielectric analysis has been conducted for a wide range of temperatures (30–120°C) and frequencies (1 × 10⁻² Hz to 3 × 10⁶ Hz). This has allowed obtaining results in different conditions: conductivity, permittivity, loss factor, relaxations, electric modulus, and so on, among others. Mechanical parameters as the Young’s modulus, tensile strength or toughness and elongation at break have been found by performing tensile stress test. Enthalpies and melting temperatures have been determined by means of the calorimetric analysis, which has allowed observation of changes in the crystal structure of the matrix. Finally, fracture surfaces of samples of the tensile stress test have been evaluated using scanning electron microscopy (SEM).
Using the results obtained and the requirements set by the official regulations (UNE, ANSI/IEEE, IEC, etc.), the suitable GTR rates in the compound for possible electric applications have been identified. It has been evidenced that, while the amount of GTR added to the matrix has little effect on some thermal properties, most mechanical and dielectric properties, specially elongation at break and toughness, are affected by the addition of reinforcement. With these features, mechanical and dielectric applications are restricted to materials with few specific requirements, among which we may find low-voltage electrical insulators for electric fences, electrical cable pipes and trays, universal joints for power cables, spacers for electrical power lines and filler for electrical applications.
Methodology
Materials
PA 6, also known as Nylon 6, is a transparent, hard and brittle solid, and it has been supplied by Ultrapolymers (BASF, Barcelona, Spain) under the trade name Ultramid B3S. Its melting temperature is 220°C, its melt flow rate is 1.55 g/min and its density is 1130 kg/m3. It is a semicrystalline thermoplastic which has high strength, toughness and impact resistance. It shows good slip behavior and good wear resistance. Old used tires, with particle sizes less than 700 μm, were provided by Alfredo Mesalles (Gavà, Spain). We have verified using thermogravimetric analysis that carbon black content was about 35%. The original GTR was separated by sieving into three categories of particles: p < 200 μm, 200 < p < 500 μm and p > 500 μm.
Preparation of the compound
Powder of the recycled tires was dried in an oven at 100°C for 24 h. Six samples of PA/GTR compound, varying the composition (0%, 5%, 10%, 20%, 40%, 50% and 70% of GTR), were prepared for each one of the three particle sizes. The mixing process was done with a Brabender Machine (Plastograph®, Lab-Station), type EHT PL, at 200–220°C to prevent degradation of the polymer, and the mixing time of 8 min. PA/GTR sheets (170 × 170 × 2 mm3) were obtained using a Collin Mod hot plates press P 200E (Dr. Collin GmbH, Ebersberg, Germany), at 100 kN, for 10 min at 220°C. The cooling step was done with a closed water circuit, which was held in the same press at the same pressure for 5 min. Samples for testing were properly configured according to the specifications of ASTM-D-412-98 standard, for the stress–strain test. Some samples of pure PA were also prepared with the same requirements in order to obtain comparable results.
Scanning electron microscopy
SEM was used to analyze the fracture surface of those samples that were broken in stress–strain tests. It is possible to analyze the effects of the reinforcement particles in the matrix by observing the environment of this filling material. Some images of the samples were analyzed according to the compound and the concentration of GTR. A JEOL 5610 microscope was used, and the samples were previously coated with a thin layer of gold in order to increase their conductivity.
Calorimetric analysis
The calorimetric assay was carried out using a Mettler DSC-821e calorimeter with a TSO801RO robotic arm. Samples of about 10 mg mass were placed in aluminum pans in nitrogen atmosphere. Nonisothermal experiments were conducted with temperatures of −50°C to 250°C, and a calorimetric flow of 10°C min−1 used as a tool to detect possible changes in the microstructure of the matrix of PA when adding a second component as reinforcement such as the GTR. Changes in composition might be analyzed by measuring the glass transition temperatures (T g).
Mechanical analysis
The stress–strain test was performed using an Instron 3366 (10 kN) Universal Machine (Instron, High Wycombe, UK), following the specifications of ASTM-D-638-84 type-V standard. The test speed was 20 mm/min. The test uniform temperature was 23 ± 2°C, and the relative humidity was of 50 ± 5%. The study of the mechanical properties and the size of the particles includes Young’s modulus, tensile strength, elongation at break and toughness, according to the GTR content of the samples in the matrix. These data have been calculated using Bluehill software, version 2. Five test samples were used for each compound. Finally, the mean and standard deviation were calculated for each magnitude, ignoring those values proved to be defective.
Dynamic electric analysis
The dielectric analysis was carried out only with particles smaller than 200 μm, because they provided the best results in the previous thermal and mechanical trials. The dielectric parameters and magnitudes were measured by means of the dynamic electric analysis with a BDS40 equipment, which incorporates a Novocontrol Novotherm temperature sensor, and using 2 cm diameter compression molds. The measurements were taken in a frequency range between 1 × 10⁻² Hz and 3 × 10⁶ Hz, at temperatures between 30°C and 120°C, and a rate of 3°C/min, using a parallel plate sensor.
Results and discussion
Scanning electron microscopy
Some SEM micrographs of the fracture surface of the PA/GTR samples of the stress–strain tests 19,20 are shown in Figure 1. We have chosen four representative concentrations in GTR (10%, 20%, 40% and 70%) for each compound, and we have combined them with the three tested particle sizes (p < 200 μm, 200 < p < 500 μm and p > 500 μm).
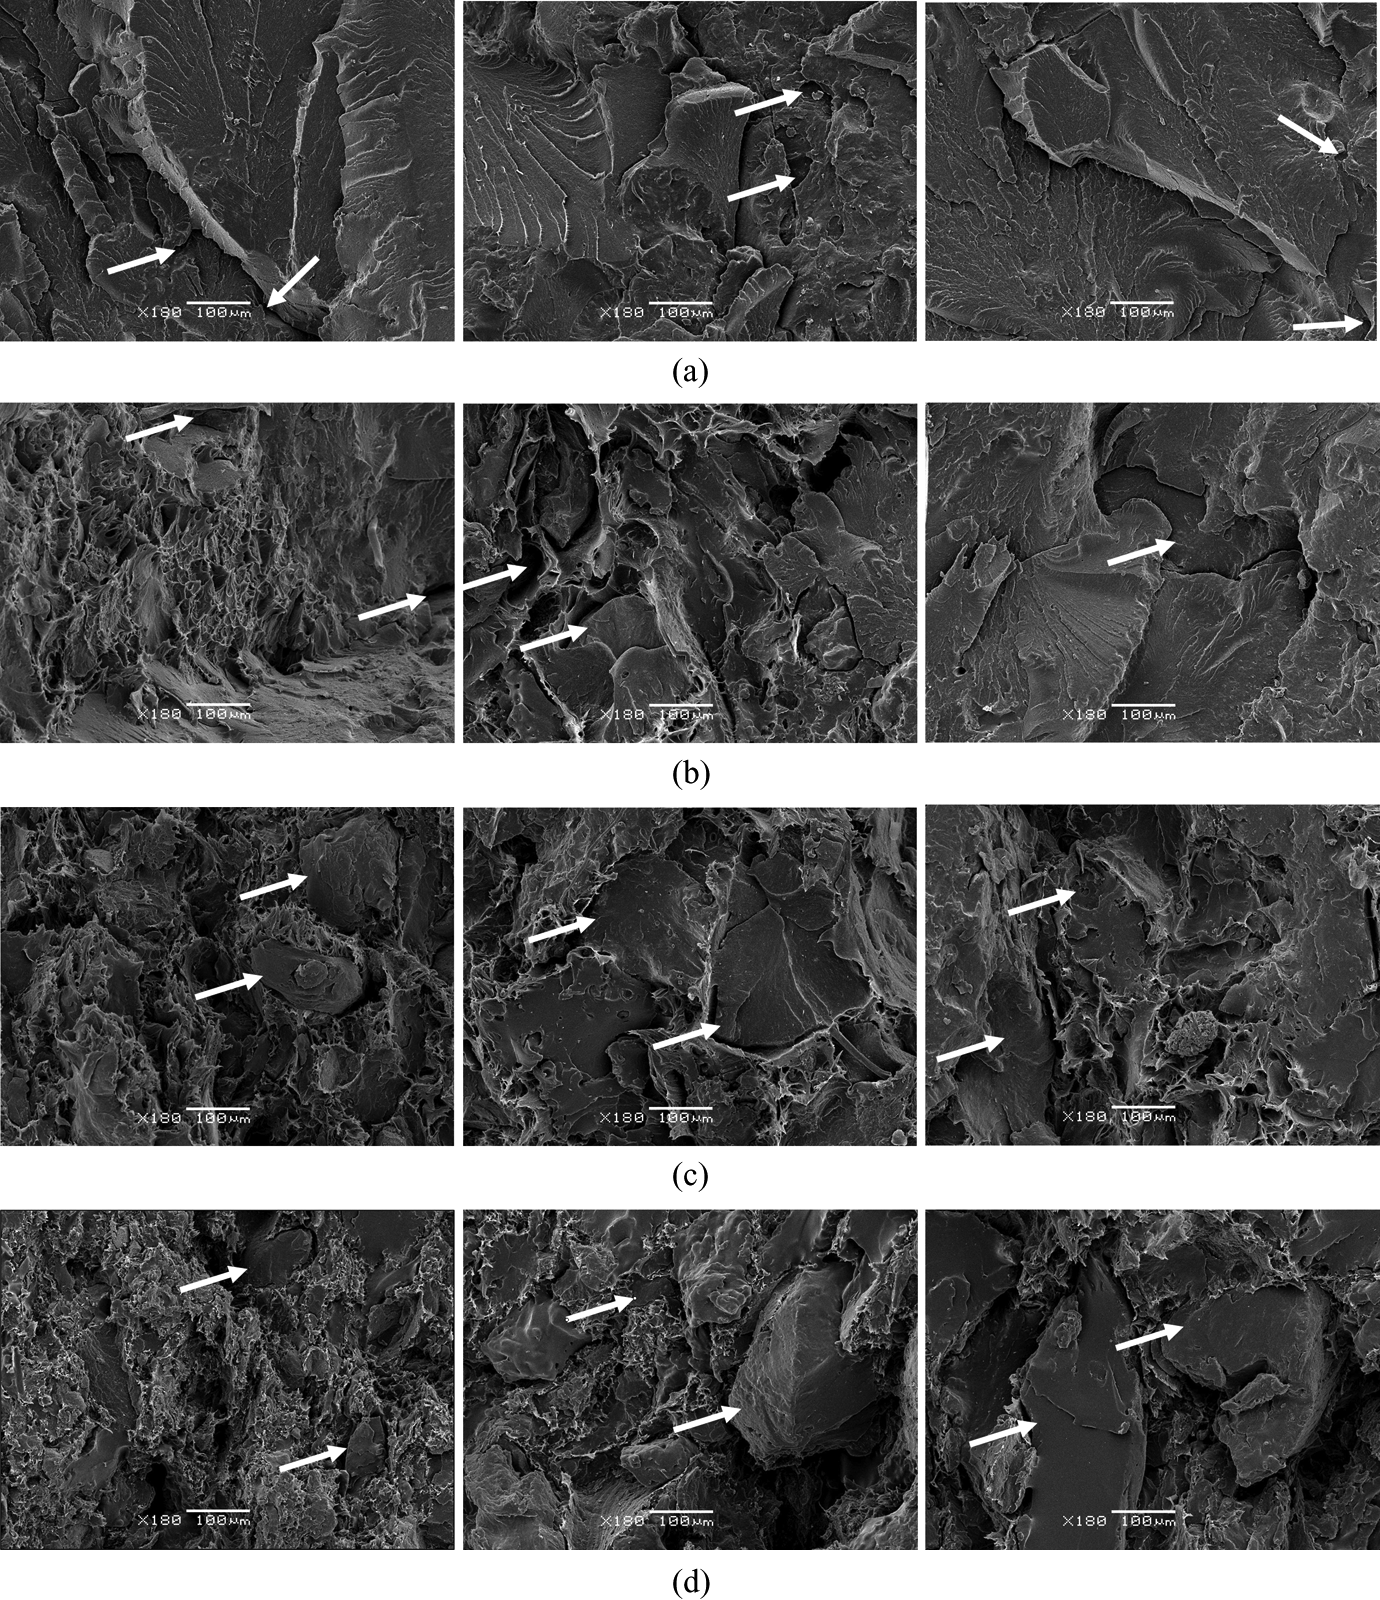
SEM micrographs of PA/GTR composites, for some concentrations in GTR and particle sizes (first column p < 200 µm, second column 200 µm < p < 500 µm, third column p > 500 µm. (a) PA + 10% GTR, (b) PA + 20% GTR, (c) PA + 40% GTR and (d) PA + 70% GTR). Arrows point out the presence of GTR particles. GTR: ground tire rubber; PA: polyamide; SEM: scanning electron microscopy.
GTR particles do not reach their degradation temperature when carrying out the mixture, and dispersed particles are clearly observed in the homogeneous media of the PA polymer matrix, which reaches the melting temperature. The result is a microgranulate mass with a degree of dispersion that depends on the mixing time and temperature and which does not facilitate cohesion between phases.
In general, small particles have larger specific surfaces, which increase their chances for good compatibility and interaction with the polymer. These small particles may develop microcracks, but as their lengths are less than the critical length, it does not harm the interfacial adhesion. In contrast, large-size particles are more likely to have important cracks and flaws, besides enabling the formation of agglomerates due to poor dispersion. These agglomerates reduce significantly the proper interfacial bonding with the presence of areas without matrix, which facilitates the establishing of strain nuclei where fractures of material are initiated.
Regarding the concentration, for low concentration of 10% of GTR (Figure 1(a)), the reinforcement particles are integrated and covered by the matrix. The topology in the matrices shows good interfacial adhesion. There are almost no visible particles, just small vertices of them which protrude from the matrix.
On the contrary, for high concentration of 70% of GTR (Figure 1(d)), the morphological structure of the materials is affected, resulting in an increased cracks and flaws in the matrix, which worsen interfacial adhesion. The adhesion varies significantly with the addition of reinforcement (GTR). In this case, although some particles still show good adhesion and the matrix covers and integrates them properly, the percentage of the polymer is not enough to wrap all of them, so the union becomes more difficult, and cracks and pores of considerable size appear in the contour of the particles. Holes are observed, due to the demise of GTR in the stress–strain tests, which proves that the fracture occurs through the interface of the matrix. Furthermore, higher possibilities of particles agglomeration exist with high concentration of GTR, and the agglomerate acts as a large-size particle.
Different bonding levels between components appear for intermediate concentration of GTR in the matrix (Figure 1(b) and 1(c)). 17,18 Thus, with concentrations up to 20% of GTR (Figure 1(b)), interfacial cohesion is still acceptable, as shown by the mechanical and calorimetric properties of the compounds. With higher percentages (40% in GTR, Figure 1(c)), particles start showing significant discontinuities in their contour with pores and cracks of considerable size that weaken their mechanical properties.
Calorimetric properties
Calorimetry applied to composite materials has been used as a tool to detect possible changes in the microstructure of the PA matrix by adding a second reinforcement component such as GTR. 21 –23 These changes can be analyzed by measuring the T g as shown in Figures 2 and 3 as well as in Table 1.
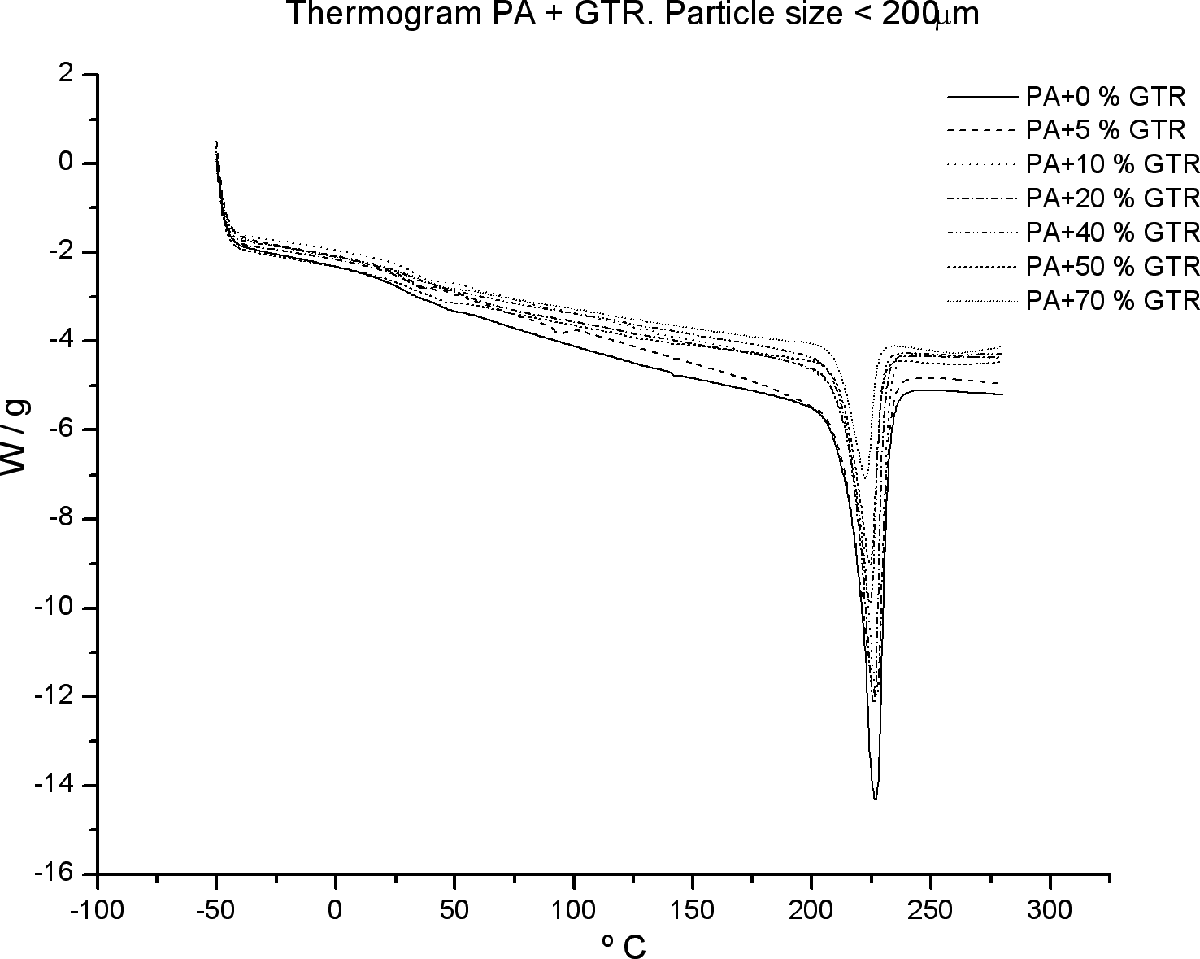
Glass transition and melting peak of PA/GTR blends for particle sizes <200 µm size. GTR: ground tire rubber; PA: polyamide.
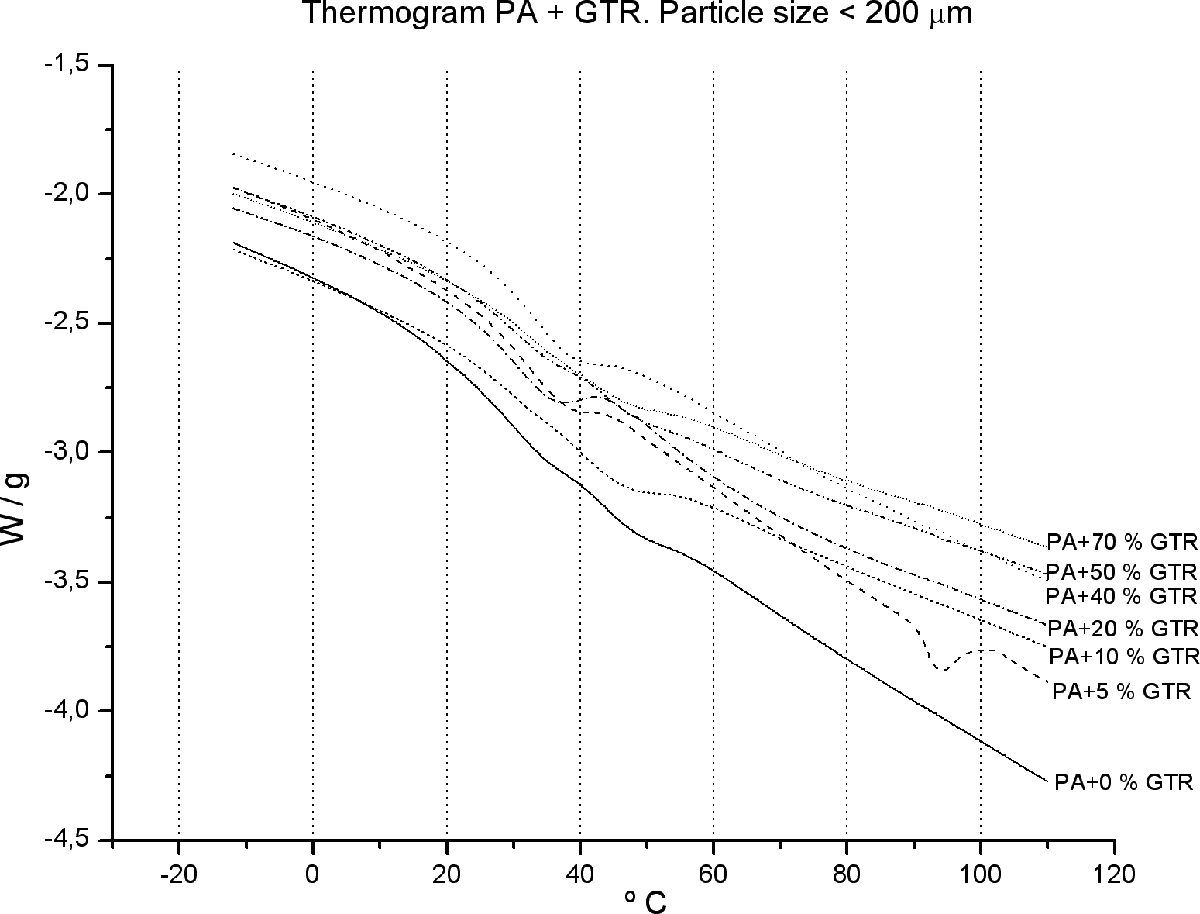
Enlargement of the glass transition area of PA/GTR blends for particle sizes <200 µm size. GTR: ground tire rubber; PA: polyamide.
Calorimetric parameters of the PA/GTR blends for particle sizes <200 µm (T g).
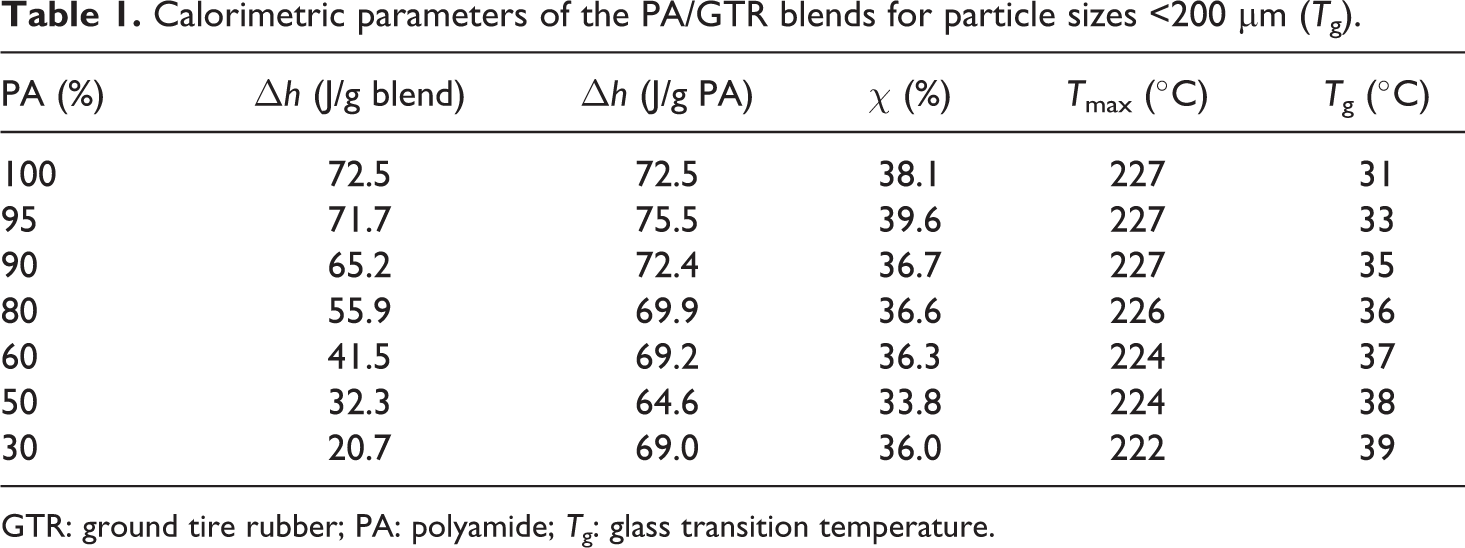
GTR: ground tire rubber; PA: polyamide; T g: glass transition temperature.
The incorporation of GTR into the matrix of PA does not alter the thermal properties of the blends. Since PA is a semicrystalline material, it will present a melting peak, besides the glass transition. Notably, through the analyses carried out by scanning differential calorimetry, a melting peak is observed (Figure 2) located between 200°C and 240°C. Besides, the T g has also been identified (Figure 3). There is a jump in heat capacity at about 35–40°C, indicating a transition temperature of T g = 38°C.
In principle, this compound behaves similar to other thermoplastic polymers studied. 17,18,20 Beyond the data and graphics, T g may influence the mechanical and dielectric properties of materials, since these properties are measured at room temperature and they are, therefore, close to the glass transition, which indicates that this material begins to be rubber like.
Table 1 shows how, by increasing the amount of reinforcement, T g tends to slightly increase to 70% of GTR (from 31°C to 39°C). Analyzing the results, it is observed how the addition of reinforcement particles does not significantly modify the thermal processes in the PA polymer matrix in terms of internal structure, due to the low interaction between the polymer and the reinforcement. Therefore, changes observed in the mechanical properties when increasing the content of GTR should not be assigned to any changes in the PA matrix but solely to changes in the particles and at the matrix–particle interface.
Mechanical properties
Figures 4 and 5 show the results of the mechanical properties determined by the stress–strain test. These properties were analyzed with different GTR concentrations and particle sizes in the PA matrix. 24,25
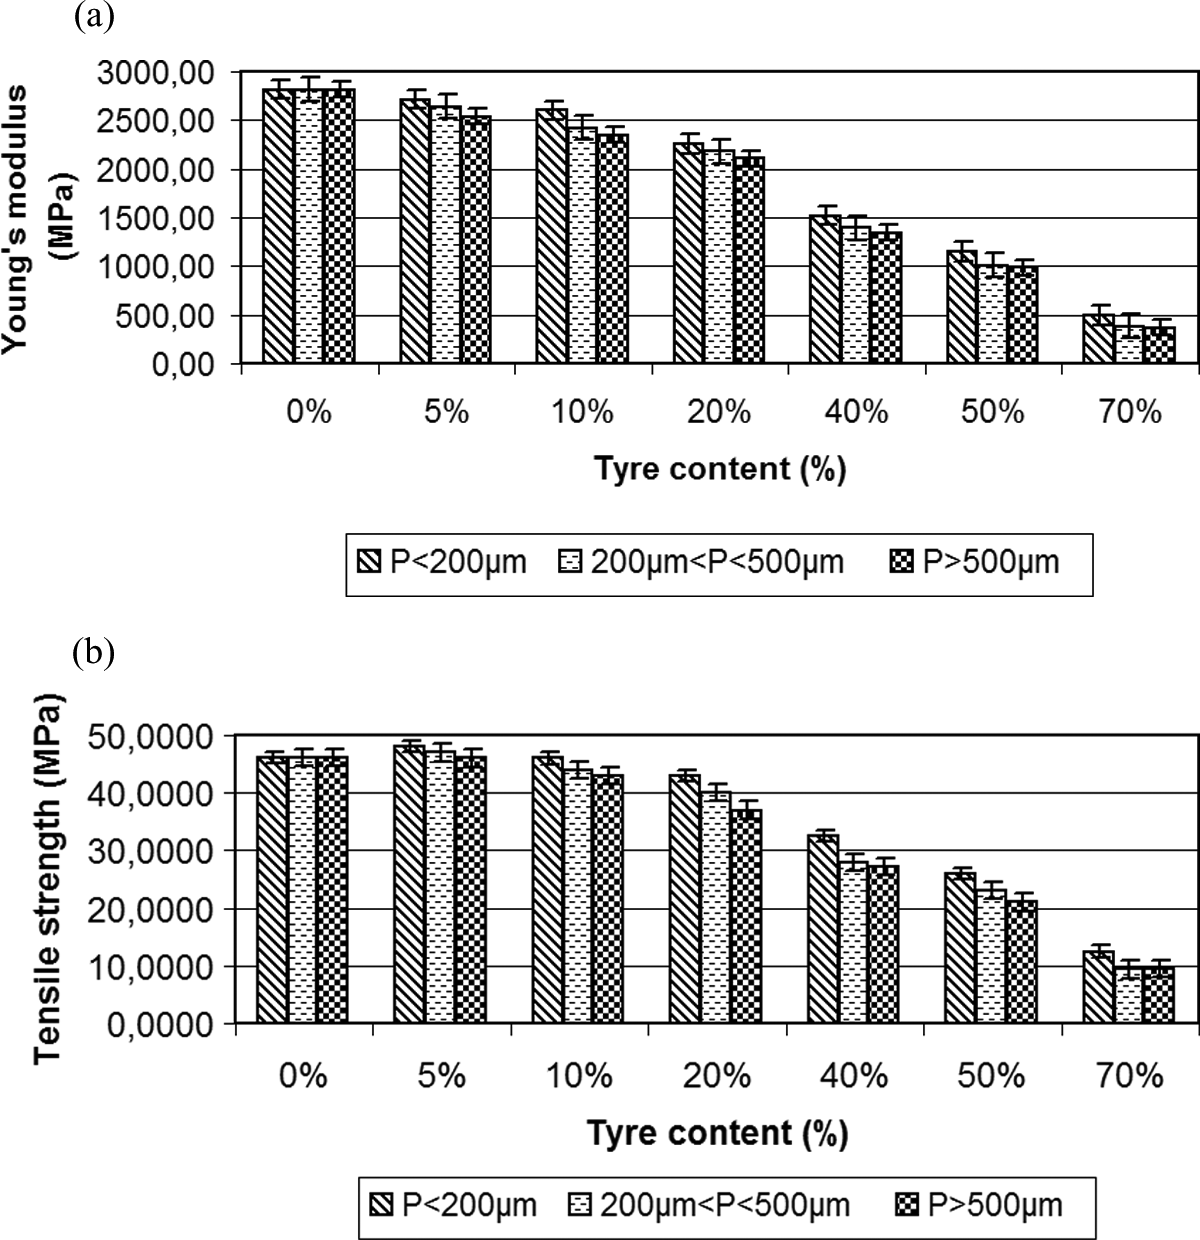
(a) Young’s modulus (MPa) and (b) tensile strength (MPa) for different concentrations of PA/GTR and particles sizes. GTR: ground tire rubber; PA: polyamide.
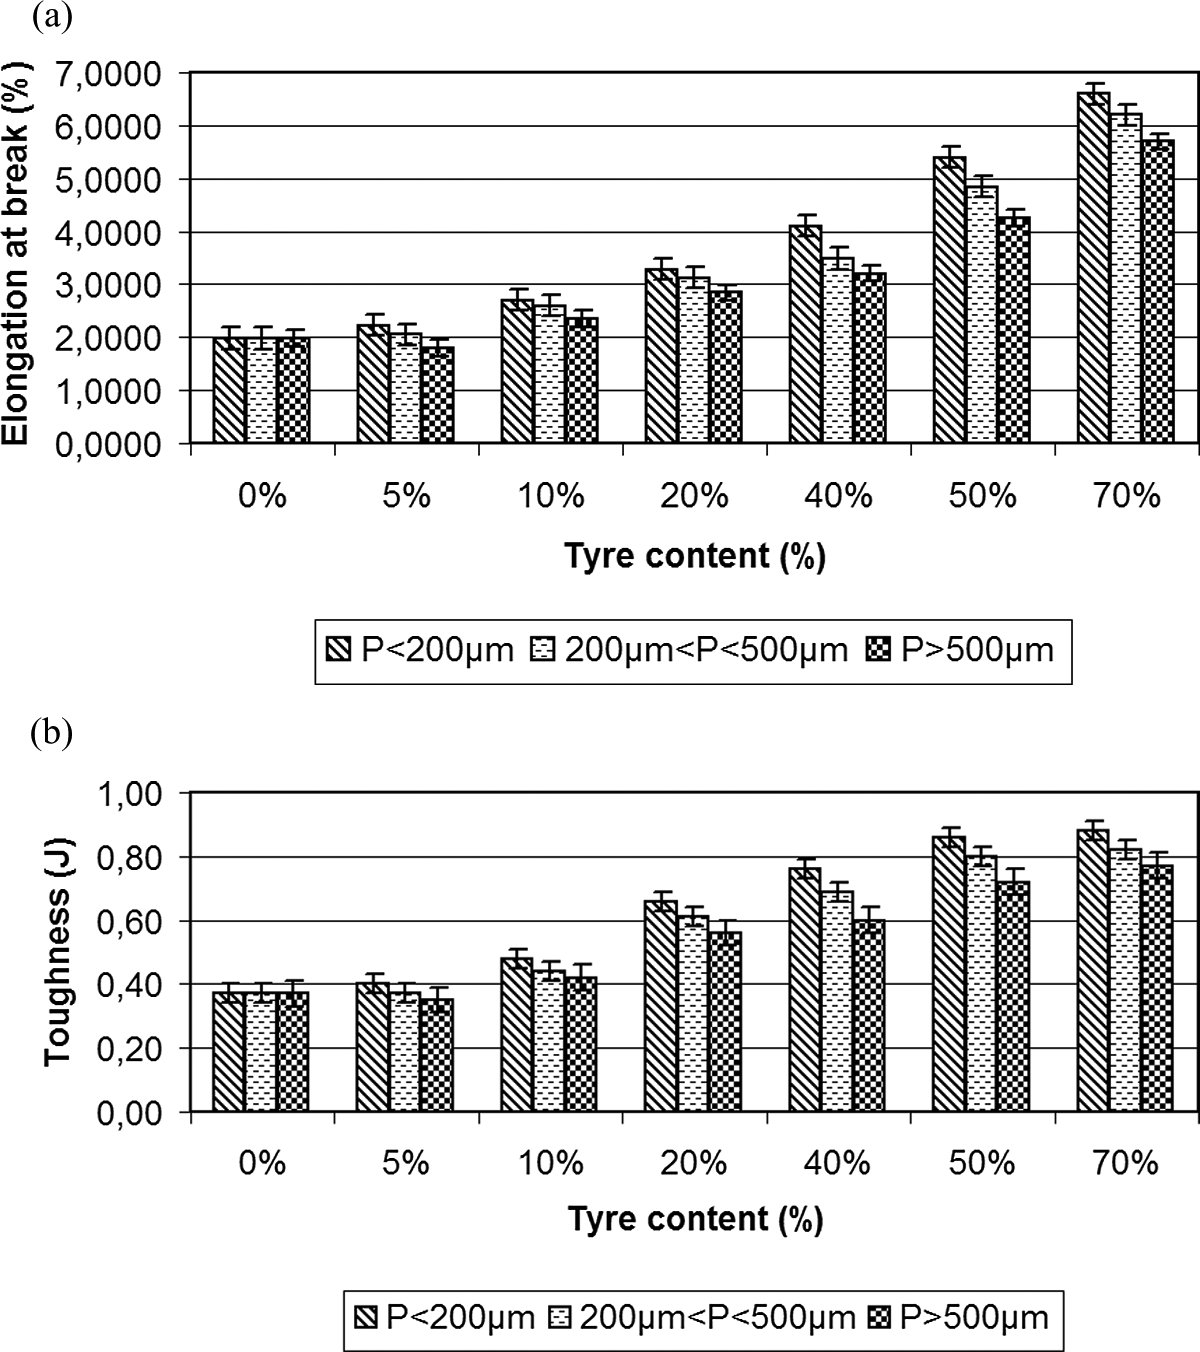
(a) Elongation at break (%) and (b) toughness (J) for different concentrations of PA/GTR and particle sizes. GTR: ground tire rubber; PA: polyamide.
Figure 4(a) shows Young’s Modulus of the compound, which decreases its value when adding reinforcement, compared to pure PA. 18,20 The decrease is initially soft, and it becomes more significant as reinforcement is added. At the concentration of 5% GTR, stiffness remains almost the same of pure PA (2818 MPa for pure PA vs. 2715 MPa for PA + 5% GTR, for particles with p < 200 μm). For these percentages, particle size has little effect on the values of stiffness, showing differences always less than 6.5% (2715 MPa vs. 2535 MPa for extreme sizes of particles). By increasing the concentration to 10% GTR and to 20% GTR, and the same particles sizes, the decrease compared to pure PA is still weak and lower than 15% (2600 MPa vs. 2252 MPa). Starting from these concentrations, Young’s modulus decreases significantly compared to pure PA, with values of 1522 MPa, 1146 MPa and 496 MPa, for particles with p < 200 μm and concentrations of 40%, 50% and 70% GTR, respectively. The so weak difference between the results obtained as a function of particle size (not more than 14%; 1146 MPa and 985 MPa for PA + 50% GTR and extreme sizes of particles) may be due to the internal structure of PA, which leaves open spaces. These open spaces can be filled with large-size particles. This counteracts the worse adhesion of other polymers when increasing the particles size, as it causes greater likelihood of cracks.
Figure 4(b) shows tensile strength, which follows a similar characteristic to Young’s modulus, but values of this magnitude increase slightly with the concentration of 5% GTR, and they decrease slowly thereafter to the concentration of 20% GTR. For particles sizes below 200 μm, composites of pure PA, PA + 5% GTR, PA + 10% GTR and PA + 20% GTR show values of 46.2 MPa, 48 MPa and 43 MPa, respectively. This means variations of 12% positive, and 1% and 7% negative, respectively, with regard to pure PA. So, compatibility between components is not bad for low GTR concentrations. Again, the size of the particles has little effect, and extreme differences are always less than 10%. For the particle size <200μm and for GTR concentration of 40%, the tensile strength decreases by 28% (32.5 MPa); for GTR concentration of 50%, it decreases by 44% (26 MPa). This trend continues with higher GTR concentrations, 12.5 MPa for 70% GTR (72% decrease).
The addition of old used tire particles in all the compounds produces an increase in the elongation at break (Figure 5(a)) and in toughness (Figure 5(b)). Thus, for particle sizes <200 μm, toughness and elongation at break of GTR compounds 26 show higher values than those of the matrix of pure PA. Particularly, for the elongation at break (Figure 5(a)) and particle sizes p < 200μm, values for PA are 2%; and for the rest of compounds, values are 2.23%, 2.70%, 3.28%, 4.10%, 5.4% and 6.6% for the concentrations of GTR-5%, GTR-10%, GTR-20%, GTR-40%, GTR-50% and GTR-70%, respectively. Again, the particles size has little effect, and the most important difference between extreme values of particles is 9% for PA + 50% GTR (5.4% for particles p < 200 μm and 4.9% for particles p > 500μm).
Similar figures are recorded concerning the toughness (Figure 5(b)). So, toughness for particles sizes of p < 200 μm for PA is 0.37 J; and for the rest of compounds, values are 0.40 J, 0.48 J, 0.66 J, 0.76 J, 0.86 J and 0.88 J for concentrations of GTR-5%, GTR-10%, GTR-20%, GTR-40%, GTR-50% and GTR-70%, respectively. The particle size, although not important, becomes more significant for high concentration of GTR, and the most important difference between extreme values of particles is 21% for PA + 40% GTR (0.76 J for particles p < 200 μm and 0.60 J for particles p > 500 μm).
In conclusion, PA is one of the worse performing tested materials concerning elongation and toughness. These properties improve by adding GTR.
Electrical properties
Dielectric analysis has been performed only with those particles with sizes smaller than 200 μm, since the best results in the previous analyses have been obtained from samples with this type of particles.
Conductivity
Figure 6(a) displays the real conductivity results of the PA and the different compounds PA/GTR at 30°C. In the zone corresponding to lower frequencies, conductivity tends to a plateau. This is particularly significant in the case of samples with high GTR concentrations and at frequencies lower than 0.1 Hz. On the other hand, in the regime of high frequencies, the dependency is seen as linear on a logarithmic scale. This is consistent with a sublinear dispersive conductivity of the type
27
Conductivity σ for PA/GTR compounds at 30°C (a) and 120°C (b) related to the frequency: O PA; □ PA + 5% GTR; 
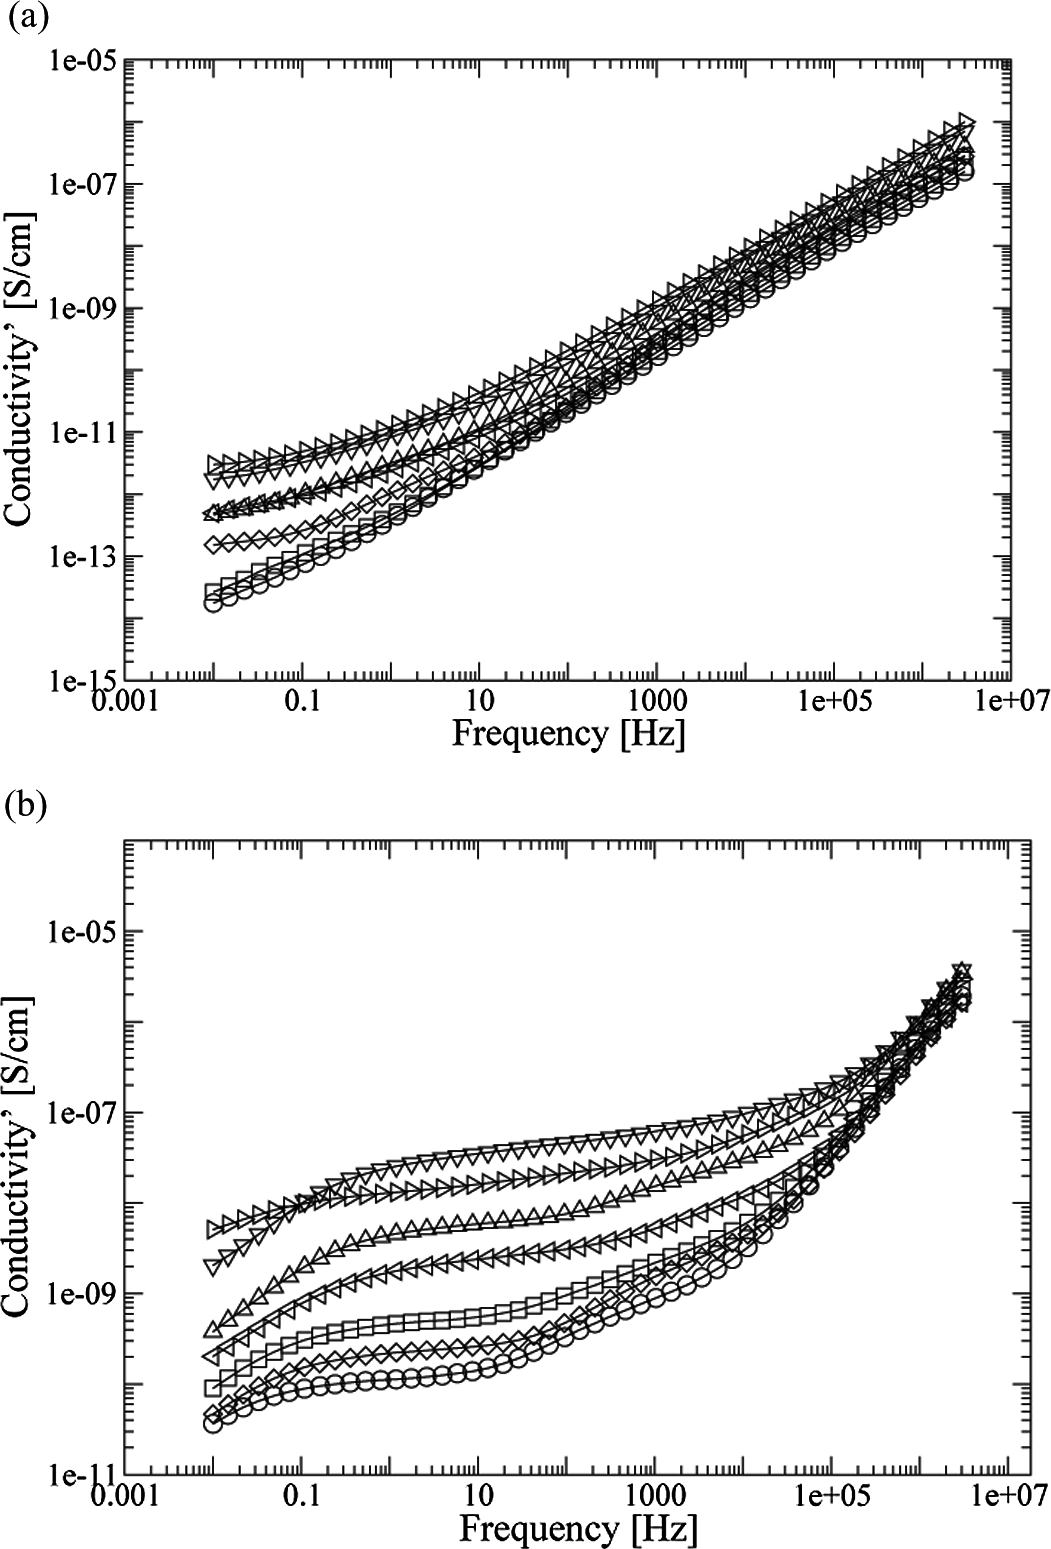
where σ 0 is the direct current (DC) conductivity, ω = 2Πf where f is the frequency, while A and n (which have values between 0 and 1) are parameters that depend on temperature and materials. This behavior is associated with materials with a high degree of disorder, and it has been observed in many polymers and polymeric compounds. 27 –30 The frequency that sets the boundary between one or other regime is not fixed, and it shifts toward higher values with temperature, due to the dependency of σ 0 on T. σ 0 strongly depends on the GTR content too. Thus, samples with larger GTR contents show higher conductivity values at low frequencies. It can be seen that, at low frequencies, the difference in conductivity between PA and PA + 70% GTR is about two orders of magnitude (2 × 10− 14 S/cm for PA and 3 × 10− 12 S/cm for PA + 70% GTR, at 0.01 Hz). At high frequencies, the difference decreases to below one order of magnitude. The increase in σ 0 with GTR concentration can be mainly attributed to the presence of carbon black in used tires. 31,32
Figure 6(b) shows the conductivity behavior of PA and PA/GTR compounds at 120°C. At low frequencies, conductivity values are more than three orders of magnitude higher than those at 30°C, in average. At frequencies higher than 1 × 10⁶ Hz, differences are smaller than one order of magnitude. For compounds with high GTR concentration, the sublinear dispersive regime is restricted to very high frequencies; while at intermediate frequencies, the conductivity seems to approach a plateau. At low frequencies, this behavior ends and the conductivity starts to sharply drop again for lower frequency values. This pattern is typical of electrode polarization phenomena. 33 On the other hand, compounds with low GTR concentrations show a peak between 100 and 10,000. This relaxation should be attributed to the PA, and it is masked by the addition of the more conductive GTR particles.
Finally, DC conductivity values at room temperature are within the acceptable range for antistatic applications (1 × 10− 9 S/cm to 1 × 10− 14 S/cm), 32 in all the concentrations of GTR. To be used in electrostatic dissipation applications or even as semiconductors, it would be necessary to incorporate some conductive filler (e.g. carbon black) into the compounds.
Permittivity
Figure 7(a) and (b) shows the values of real permittivity (∊′) and imaginary permittivity or loss factor (∊′′)—which are proportional to the stored and dissipated energy, respectively, in each cycle at 30°C. It can be seen that both real and imaginary permittivities increase with increasing GTR concentration. Also, both parameters, ∊′ and ∊′′, show a downward trend as the frequency increases. In the case of loss factor, a slight and wide relaxation between 100 and 100,000 Hz, which can be identified with the nylon 6 β-relaxation, 34 –36 is noticed. It is associated with localized motion influenced by hydrogen bonded amide groups in the presence of water. 35,36
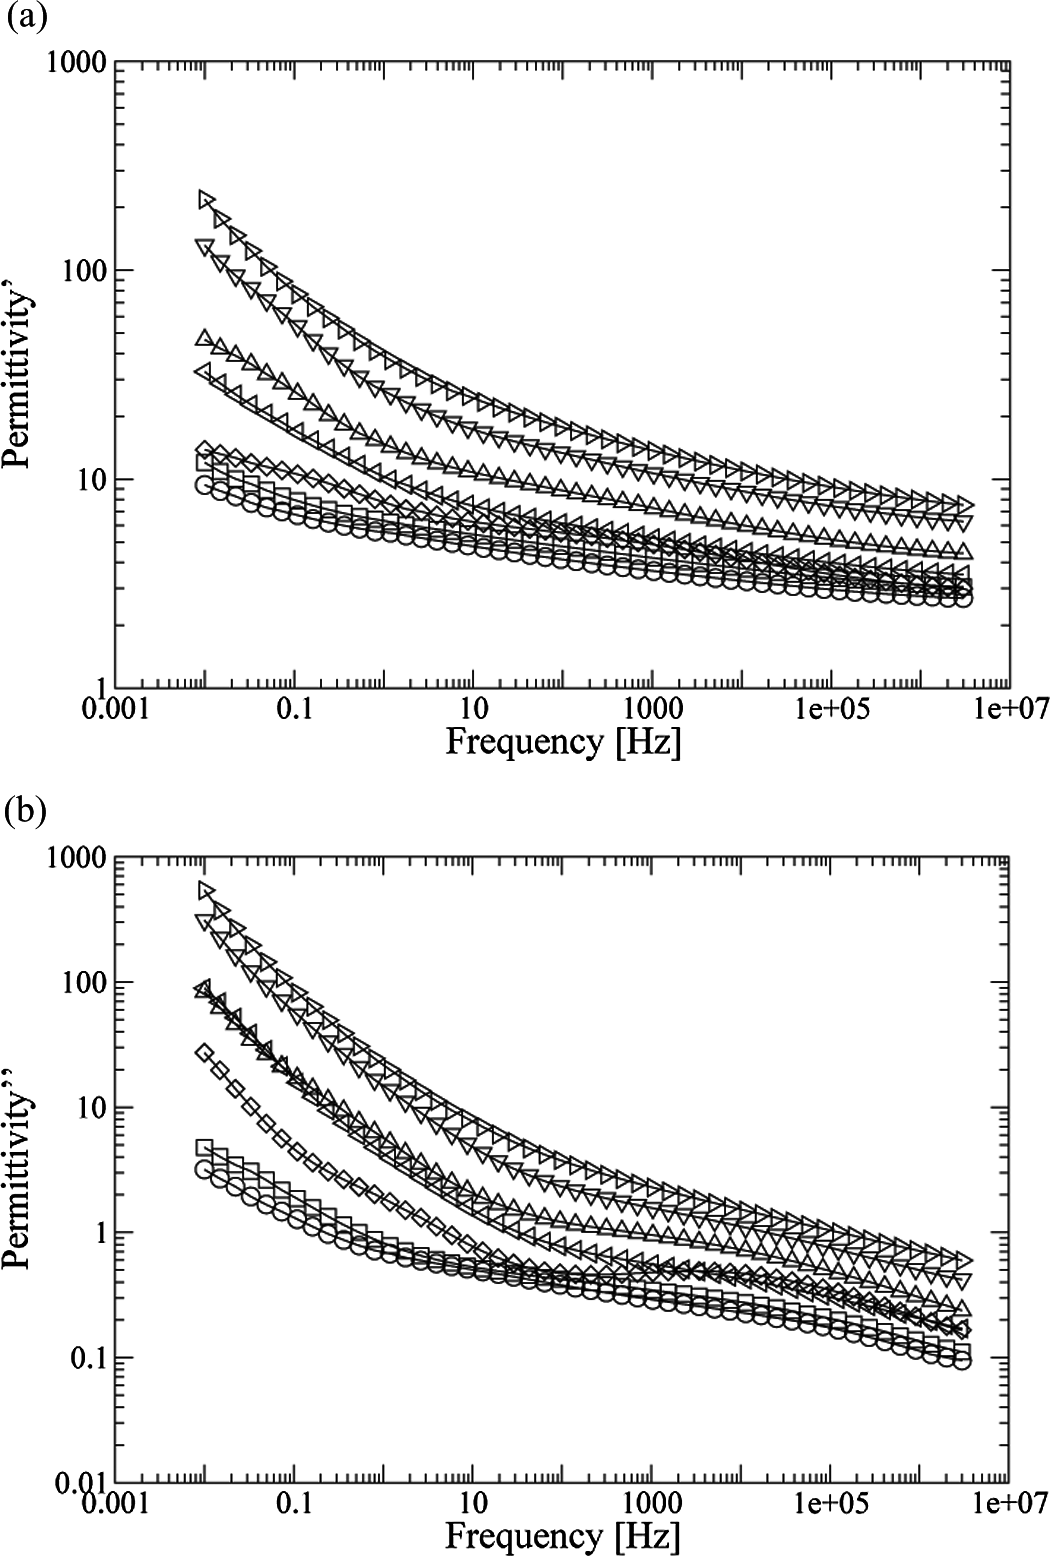
Real permittivity (a) and loss factor (b) of PA/GTR, at 30°C in function of the frequency: O PA; □ PA + 5% GTR;
Figure 8(a) and (b) shows the values of real permittivity and loss factor at 50 Hz, in function of the temperature. Again, both ∊′ and ∊′′ increase with the concentration in GTR. Both parameters grow with the temperature. In Figure 8(b), a peak can be noticed in some samples around 60°C, which should be attributed to the α w-relaxation. 35 This relaxation is associated with the movement of extended CH2 sequences on the backbone with the involvement of an amide group, which can be facilitated by the presence of water and small plasticizing molecules. Here, it appears as a shoulder of the nylon α-relaxation, a large-scale segmental motion of the amorphous phase related to the glass transition, which presents a maximum at higher temperatures for this frequency. 35,37 In the case of the β-relaxation, it is placed below 0°C at this frequency.
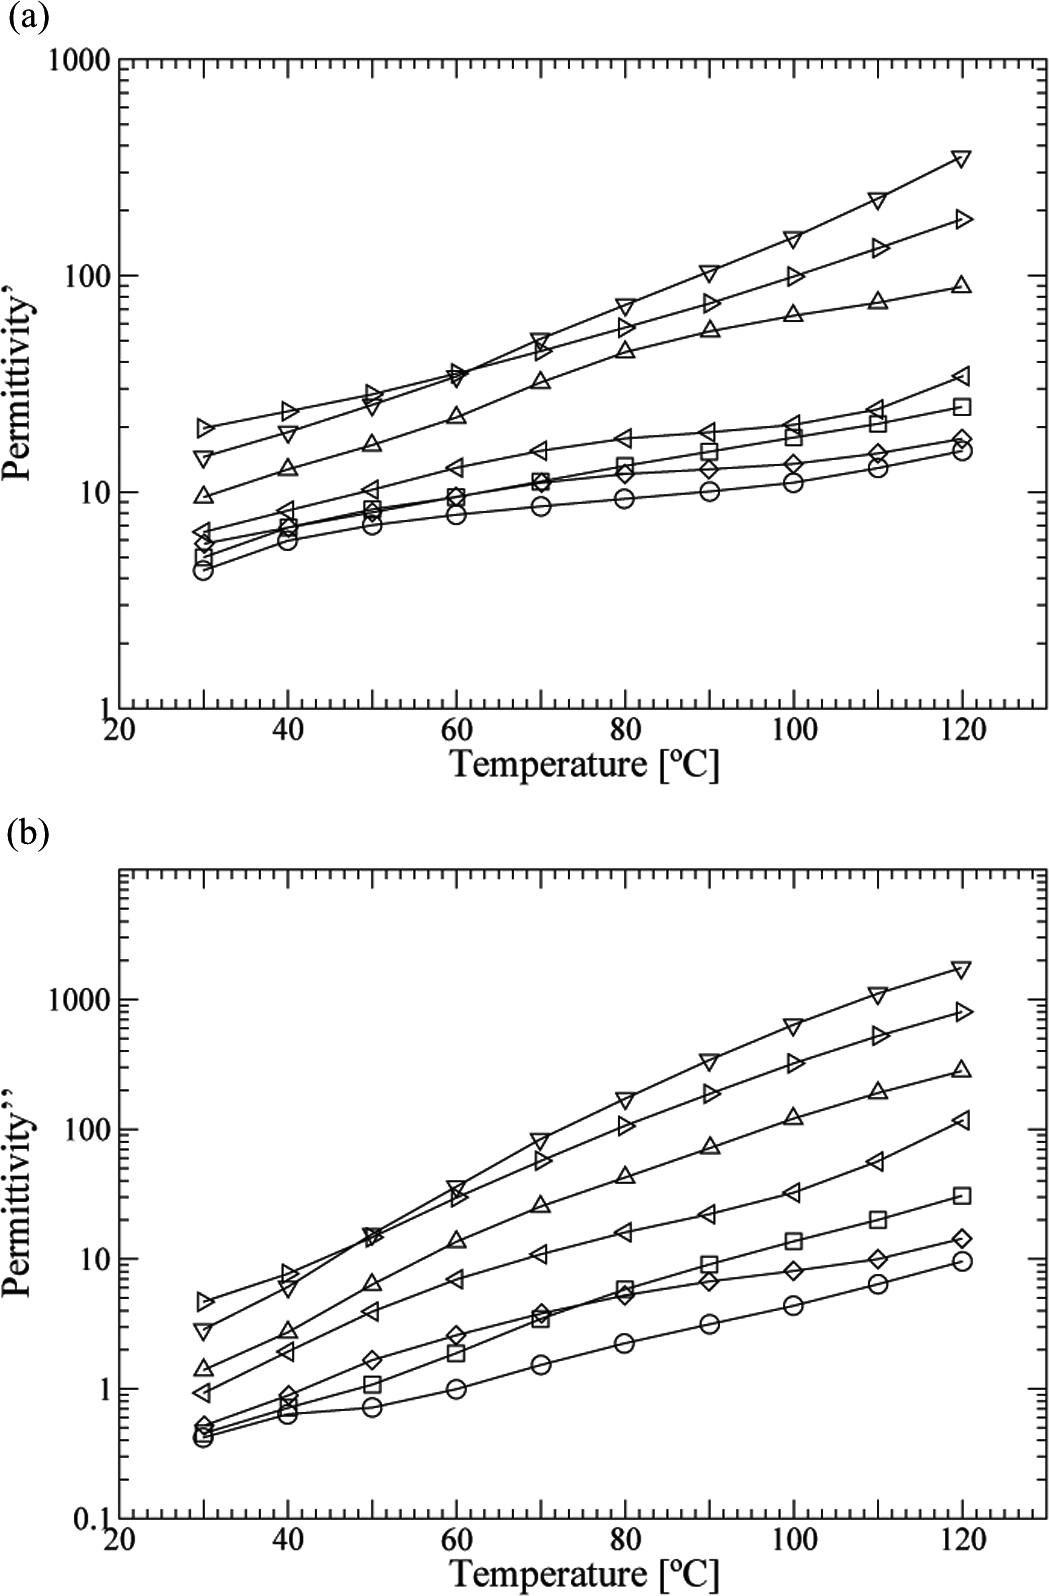
Real permittivity (a) and loss factor (b) of PA/GTR, at 50 Hz in function of the temperature: O PA; □ PA + 5% GTR;
Electric modulus
The electric modulus can be defined from the complex permittivity
Electric modulus relaxations correspond to the relaxations of the electric field when the electric displacement remains constant and, so, to the real dielectric relaxations. 27,38 The electric modulus formalism is usually used to avoid the conductivity contribution to the dielectric losses at low frequencies and high temperatures and, so, to be able to develop a relaxation analysis of such region. 39
Figure 9 shows the 3D diagram of the electric modulus imaginary component for PA and different PA/GTR compounds, in function of temperature and frequency. Three clear relaxations can be observed in these diagrams. At high frequencies, the referred β-relaxation is noticed in all the cases. At low and intermediate frequencies, there is a region in which two relaxations are partially overlapped. With the addition of GTR, the relaxation placed at lower frequencies (α) decreases with respect to the other one (α w); and for high GTR concentrations, it is almost unnoticeable. The sample with 10% of GTR is the only one that seems not to follow this trend. The observed drop in the intensity of α- and β-relaxations is explained by the decrease in the PA content. However, this drop is especially significant in the case of the α peak. This phenomenon can be associated with the fact that the GTR particles reduce the intermolecular cooperativity and can finally hinder the macromolecular motion. On the other hand, α w- and β-relaxations are highly influenced by the presence of water. 36,40 Since GTR particles incorporate water, their addition to the nylon 6 can enhance both relaxations, reducing the intensity drop linked to the decrease in nylon concentration, and even, almost compensating it in the case of α w-relaxation.
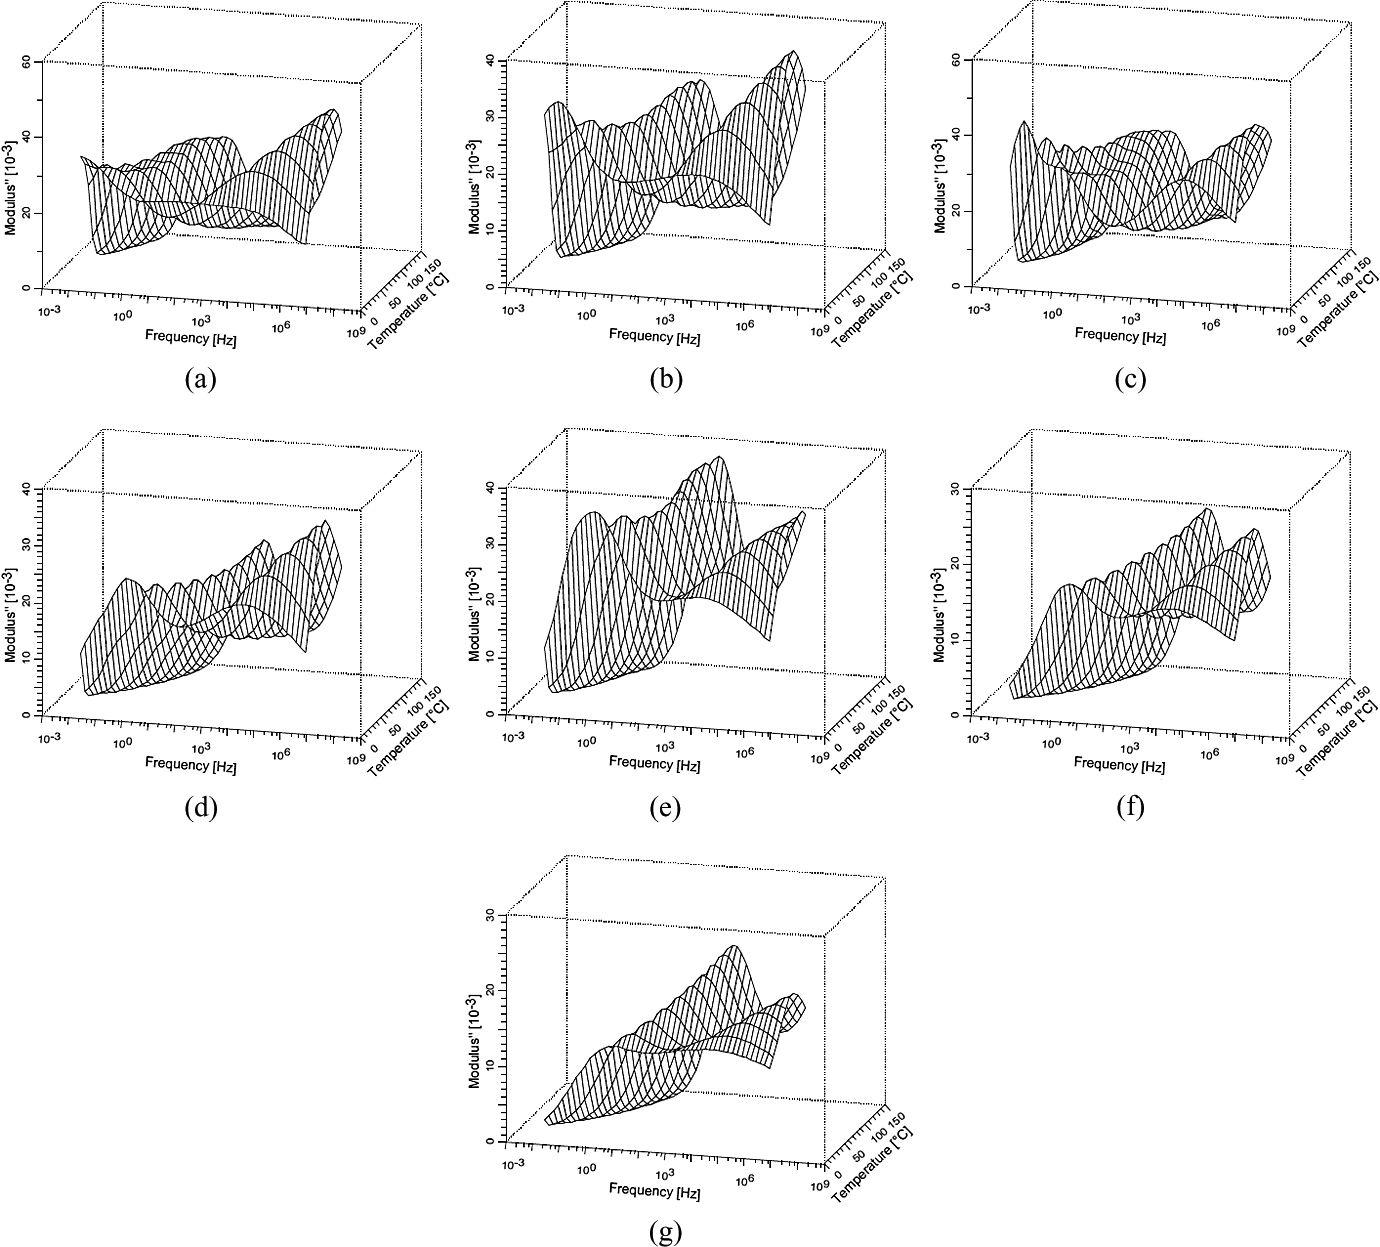
3D diagrams of the electric modulus imaginary component (M′′) with relation to frequency and temperature: (a) PA 100%, (b) PA + 5% GTR, (c) PA + 10% GTR, (d) PA + 20% GTR, (e) PA + 40% GTR, (f) PA + 50% GTR and (g) PA + 70% GTR. GTR: ground tire rubber; PA: polyamide.
Although interfacial Maxwell–Wagner–Sillars (MWS) relaxations have been found in nylon 6, neat or filled by other materials, 35,36 and even in other polymer/GTR composites, 28,30 in our tests, no MWS peak has been observed. Probably, the MWS interfacial relaxation of the PA is not significant enough to be directly noticed, in the range of frequencies and temperatures studied in this work. It is worth to note that the two peaks present in the region of low frequencies as shown in Figure 9 fit the Vogel–Tammann–Fulcher (VTF) equation, which is typical of the α- and α w-relaxations. Nevertheless, whenever the MWS relaxation has been found in a polymer/GTR composite, it has been always fitted successfully to the Arrhenius model. 28,30
β-Relaxation
If the frequency at which the peak of the β-relaxation appears is represented in relation to the reciprocal of the temperature, it can be seen that the points fit quite well to a straight line (Figure 10). This behavior is described by the Arrhenius expression for thermally activated relaxations Arrhenius plot of log f in relation to 1/T for the β-relaxation (for clarity, only the points of three different concentrations are shown): O PA; 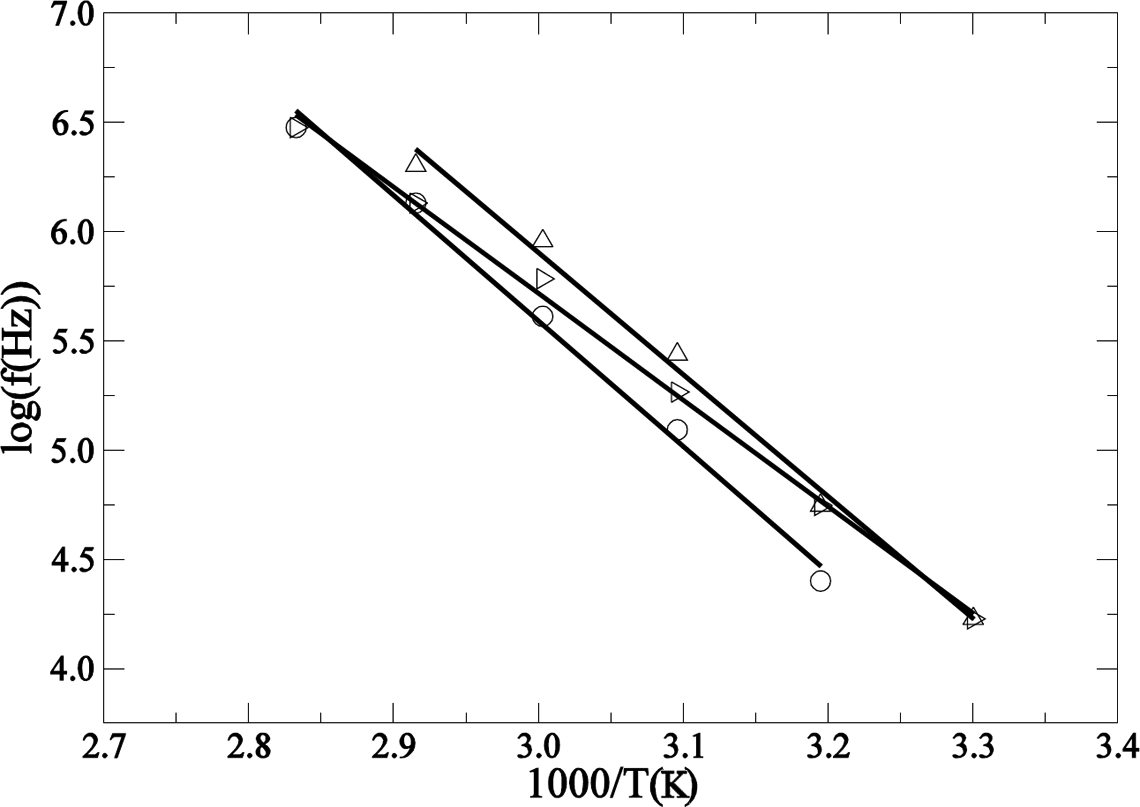

where f is the frequency of the maximum of the relaxation, f 0 is the natural frequency, E a is the activation energy, k is the Boltzmann constant and T is the temperature in degrees Kelvin.
Parameters obtained from the linear regression of the Arrhenius plot (Figure 10) are detailed in Table 2. No clear trend is observed in the behavior of both the activation energy and the characteristic relaxation time, τ 0 = f 0 −1.
Activation energy and characteristic time of β-relaxation for the analyzed PA/GTR compounds.
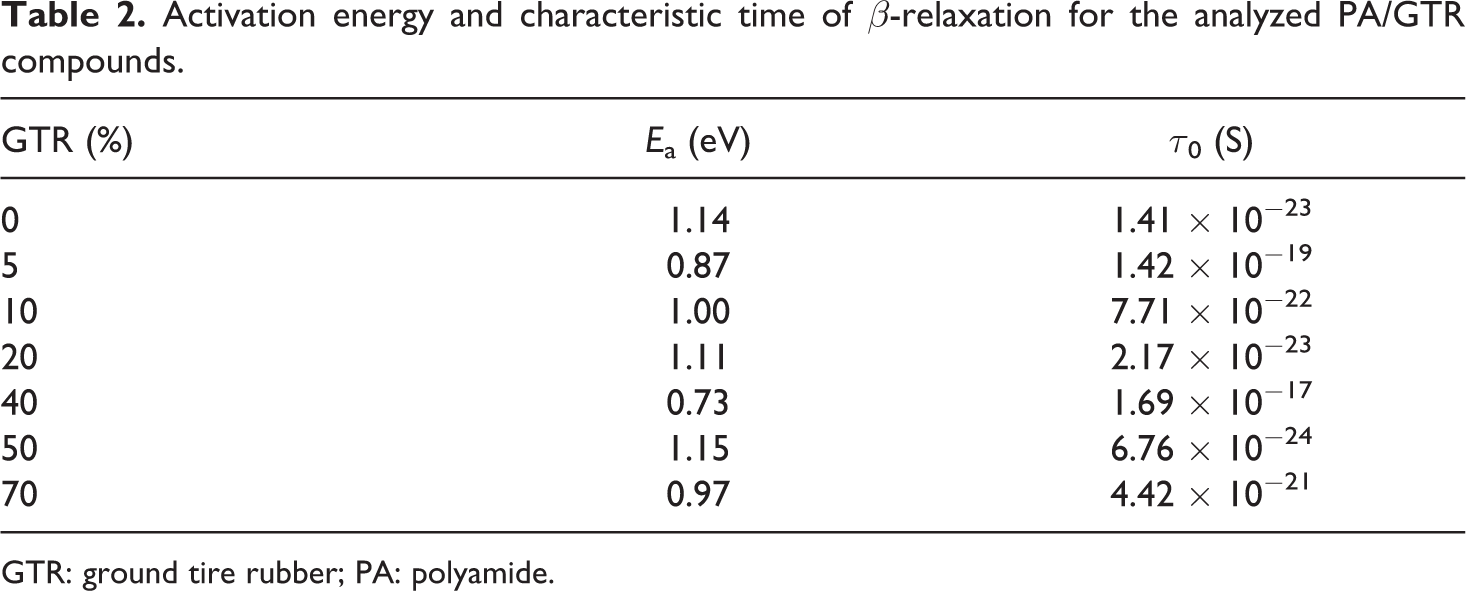
GTR: ground tire rubber; PA: polyamide.
α w-Relaxation
This relaxation fits well with the VTF equation (Figure 11), which can be written as
35

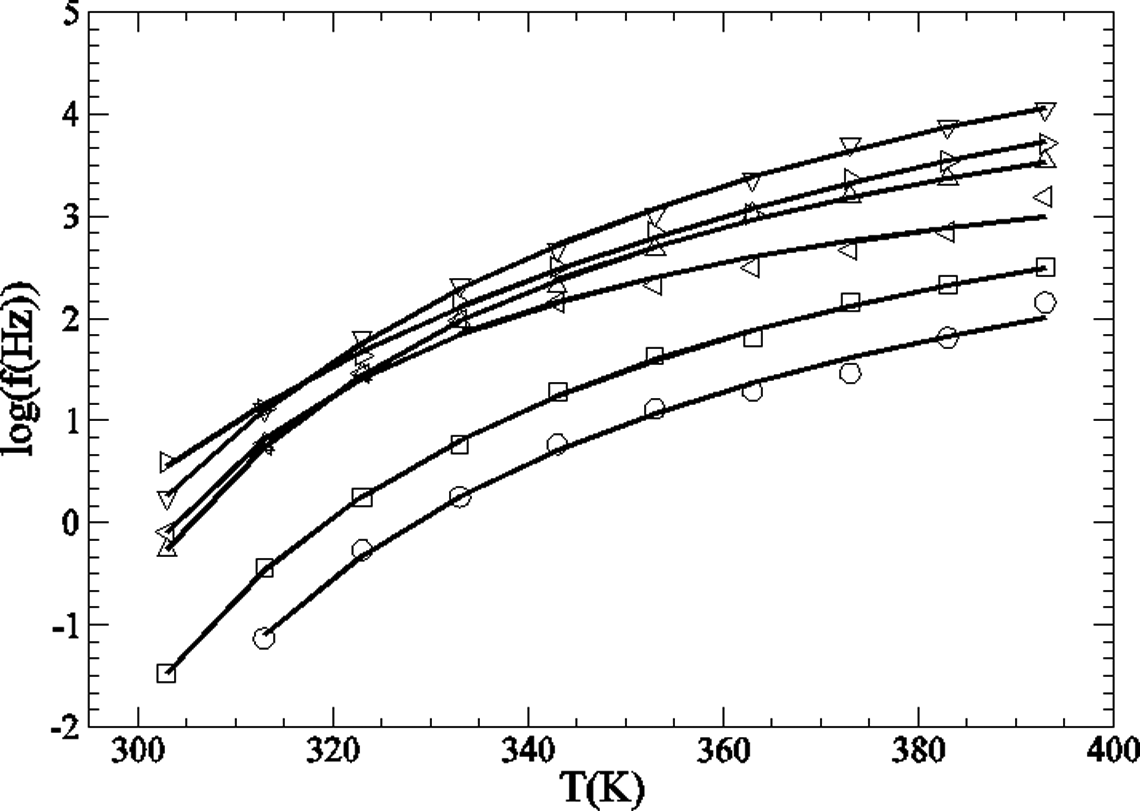
Representation of log f in relation to T for the α
w-relaxation: O PA; □ PA + 5% GTR;
where A, B and T 0 are constants. The T g can be obtained by the empirical relationship T g = 1.333T 0. Parameters obtained from VTF fittings of the α w-relaxation are shown in Table 3. In the case of the sample with 10% of GTR, it was not possible to obtain a successful fitting due to the overlapping between peaks, and it is not displayed in Figure 11, neither its parameters are shown in Table 3. T g values obtained from the low GTR concentration samples are in good agreement with those obtained from other authors for nylon 6, 35,41 but they are far from those found by calorimetric measurements (see ‘Calorimetric properties’ section).
VTF fitting parameters for the α w-relaxation.
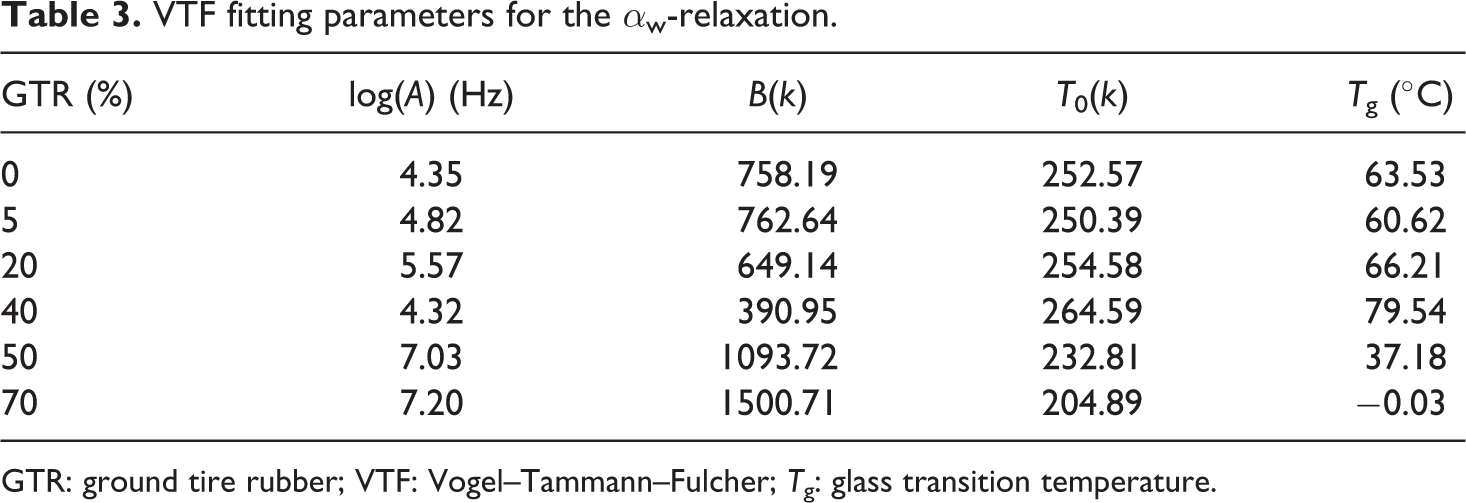
GTR: ground tire rubber; VTF: Vogel–Tammann–Fulcher; T g: glass transition temperature.
α-Relaxation
The α-relaxation also follows the VTF function (see Figure 12). 36,41 The fitting parameters can be seen in Table 4. In this case, the fittings were successful for only three different GTR concentrations. In fact, in samples with high GTR concentrations, the α peak is almost unnoticeable. Only in the case of 20% of GTR, the calculated T g is close to the one obtained from calorimetric measurements.
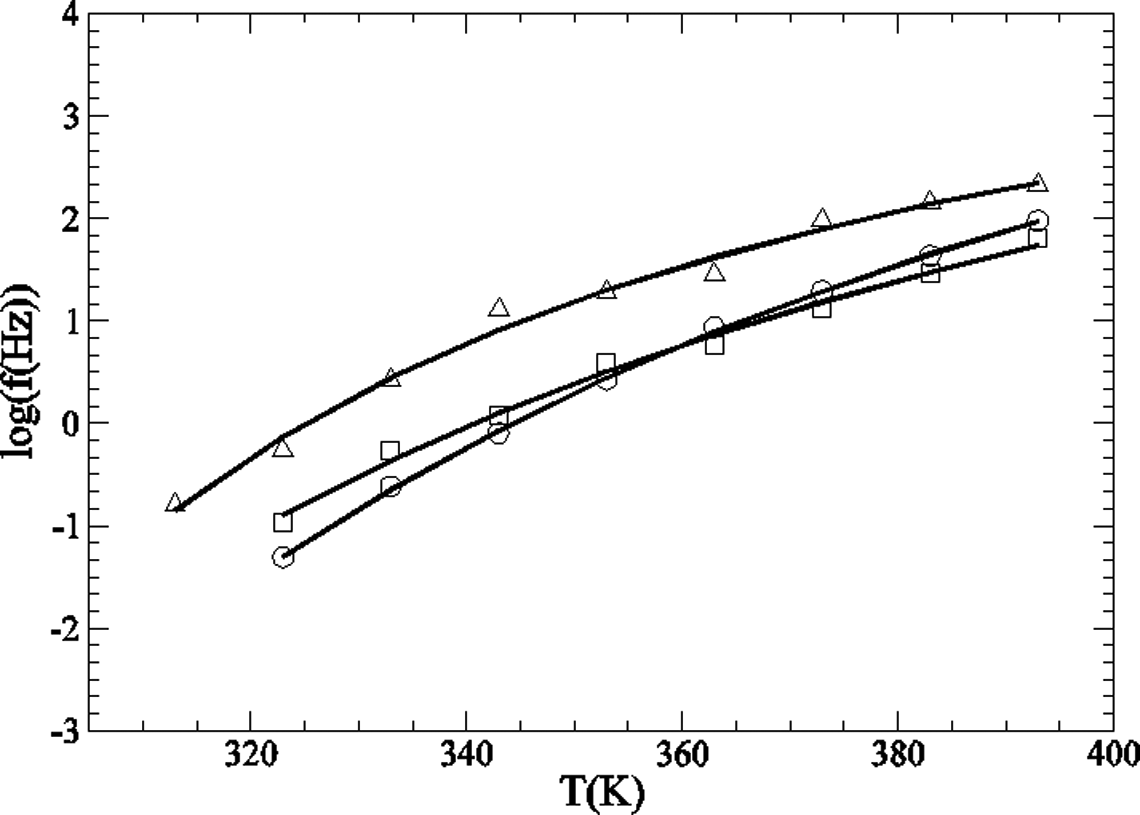
Representation of log f in relation to T for the α-relaxation: O PA; □ PA + 5% GTR;
VTF fitting parameters for the α-relaxation.
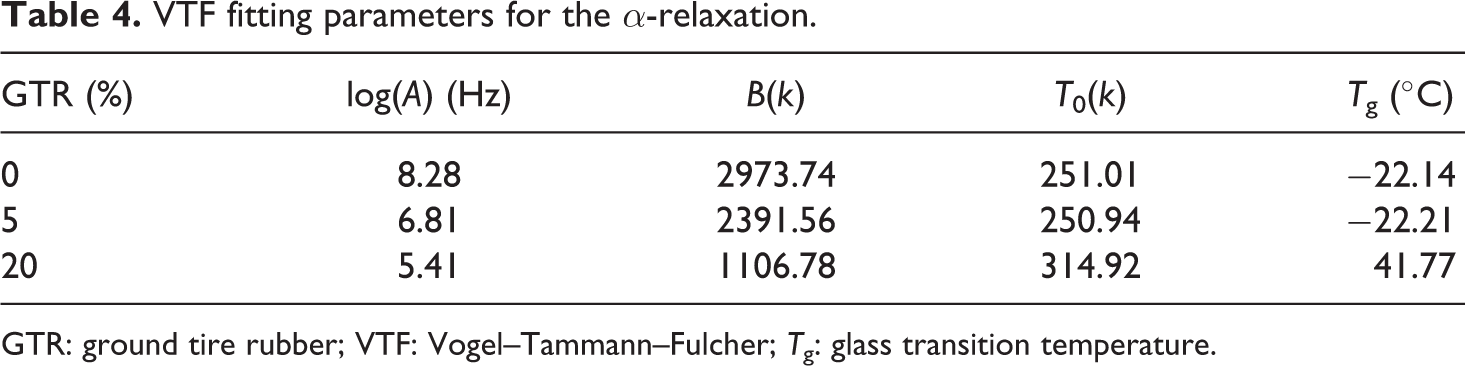
GTR: ground tire rubber; VTF: Vogel–Tammann–Fulcher; T g: glass transition temperature.
Conclusions
Analyses of SEM micrographs show relative differences in results depending on the particle size and GTR concentration in the compound. Concerning the size of the GTR particles, small-size particles stick better to the matrix mainly due to the high specific surface roughness and to the small size of pores and cracks. In contrast, large particles increase cracks in the matrix, worsening the interfacial adhesion. GTR concentration influences the microstructure of the compound by worsening interfacial adhesion. It causes agglomerations that produce quite large fractures and pores in the polymer–reinforcement contact surface.
It was found, using the DSC test, that the addition of GTR in the PA does not alter the thermal properties of the compound in terms of internal structure, due to the little interaction between the polymer and the reinforcement. Since PA is a semicrystalline material, it will show a glass transition at T g = 38°C and a melting peak between 200°C and 240°C. Changes in the internal structure at T g have been checked for different PA/GTR compounds.
Tensile stress test shows how, by increasing the GTR content in the matrix up to concentrations of 10%, some mechanical properties such as Young’s modulus or tensile strength keep within acceptable values. But when the content of GTR increases, those values start decreasing gradually. This decrease is little affected by particles sizes, while still outperforming those smaller than 200 μm. However, elongation at break and toughness increase with higher concentration of reinforcement, showing some values higher than those of pure PA, which is good for its use in various industrial applications.
According to the dielectric tests, the addition of GTR to nylon 6 leads to an increase in conductivity, permittivity and loss factor. Thereby, conductivity values obtained for PA/GTR compounds are suitable for antistatic applications. On the other hand, three dielectric relaxations of nylon 6 were observed: α, α w and β. The use of the electric modulus formalism allowed an analysis of these relaxations in relation to frequency, temperature and filler content. α peak intensity shows a dramatic drop with the increase in GTR concentration. In the case of α w and β, this drop is less significant, possibly due to the effect of the water present in the filler. The β-relaxation was fitted to the Arrhenius model, while the α- and α w-relaxations are well described by the VTF equation.
In view of the results, without any prior pretreatment with acids, which have been proven as ineffective and costly, the compound made of 90% PA + 10% GTR is the most suitable one for the considered applications. Its Young’s modulus is 2600 MPa, its tensile strength is 46 MPa, its elongation at break is 2.7% and its toughness is 0.48 J. Its dielectric properties, at 50 Hz, are similar to other compounds tested, its conductivity is 1.24 × 10⁻¹¹ S/cm, its dielectric constant is 5.7749 and its loss tangent is 0.09010. With such properties, its dielectric and mechanical applications are limited to those materials with few specific requirements, among which we may find: low-voltage electrical insulators for electric fences: ITC-BT-39, -22, -23, -24, UNE-EN 60335-2-76 and IEC 60335-2-76, conductivity <1 × 10⁻¹⁰ S/cm, T g δ < 1.5 and tensile strength >12.5 MPa; electrical cable pipes and trays: UNE EN 61537, UNE EN 50085-1 and IEC 61537 (EN 61537), conductivity <1 × 10⁻¹⁰ S/cm, tensile strength >15 MPa and elongation at break >40%; universal joints for power cables: IEC 60840 and UNE HD 628, conductivity <1 × 10⁻¹⁰ S/cm, tensile strength >12.5 MPa and elongation at break > 35%; spacers for electrical power lines: ANSI/IEEE C2 and IEC 61854 (273 and 278), conductivity <5.5 × 10⁻⁵ S/cm, tensile strength >17.2 Mpa and elongation at break >30%; filler for electrical applications: UNE 53 602, UNE 53 510, UNE-HD 632 and UNE-EN 60811-4-1, conductivity <1 × 10⁻¹⁰ S/cm, tensile strength >12.5 MPa and elongation at break >35%.
Footnotes
Acknowledgements
The authors would like to thank Nuclear Physics Department of the Universitat Politècnica de Catalunya, Terrassa Section, with special mention to Professors M. Mudarra and J. Belana for their support in carrying out the dielectric tests.
Funding
This research received no specific grant from any funding agency in the public, commercial, or not-for-profit sectors.