
Abstract
Exhaust gases from industrial activities are major sources of air pollution following fuel combustion. The principal air pollutants include volatile organic compounds (VOCs) and particulate matter (PM), which can enter the human lung and cause health damage if proper protective measures are not taken. Accordingly, this study successfully synthesized a fiber membrane composed of a metal-organic framework containing NH2-MIL-125 (NH2-Matériaux de l’Institut Lavoisier-125, NM125), carbon quantum dots (CQD), titanium dioxide (TiO2), Polyimide (PI), and Polyetherimide (PEI). The synthesized material was designated as CNP@PI/PEI. CNP@PI/PEI exhibited photocatalytic activity, filtration efficiency, and thermal resistance, enabling it to filter high-temperature exhaust gases from industrial activities and to decompose methylene blue and acetone. The highest photocatalytic degradation rates were 68.00% for methylene blue and 82% for 20 ppm acetone. The CNP@PI/PEI fiber membrane was produced under the following conditions: operating voltage (17.0 kV), collection time (2 h), catalyst addition (5 wt%), and CNP ratio (1.25). The resulting filtration efficiency and quality were 97.92% and 1.185 Pa-1, respectively. Based on the TG and DSC results, the CNP@PI/PEI fiber membrane demonstrated thermal resistance that is suitable for potential application in high-temperature exhaust treatment in industrial systems such as servers, steel mills, and ironworks. Consequently, the CNP@PI/PEI membrane effectively captured nanoparticles and provided multifunctional environmental remediation through the photocatalytic degradation of various contaminants.
Introduction
The quality of human life gradually improved with the massive progress of industrial activities, which also resulted in significant environmental pollution. Moreover, two serious respiratory diseases—coronavirus (COVID-19) and severe acute respiratory syndrome (SARS)—caused unexpected effects on air quality. Based on this situation, filtration and purification of air pollution and suspended aerosol became urgent issues to protect the human respiratory system.1–3 Moreover, there were some air pollution, such as particulate matter (PM), volatile organic compounds (VOCs), carbon oxide (CO), carbon dioxide (CO2), nitrogen dioxide (NO2), sulfur dioxide (SO2), and so on, caused negative effects on air quality. Therefore, this study investigated a polymer fiber membrane to filter air pollution and purify air quality simultaneously.
The major sources of air pollution are PM and VOCs, which cause serious damage to the human respiratory system. These two air pollutants also dramatically influence human lung function, resulting in several syndromes such as heart disease, asthma, respiratory diseases,4–6 cardiovascular diseases,4–6 and lung cancer.7–11 PM is one of the major components of air pollution and is categorized by the aerodynamic diameter of the particles, generally ranging from 2.5 to 10 μm (PM 10), <2.5 μm (PM 2.5), and <0.1 μm (PM 0.1). 12 The size of PM is highly variable due to the combination of complex compounds from various natural and anthropogenic activities. 13 Moreover, PM 10 and PM 2.5 are two important indexes related to respiratory harm, while PM 10 could pass through the nasal cavity to the throat, causing mild respiratory ailments. Meanwhile, PM 2.5 could pass into the lungs and result in major respiratory illnesses.5,14,15 Furthermore, smaller air particles are difficult to expel from the body once penetrated, and smaller particles exhibit greater penetration ability. Accordingly, approximately 99% of air particles belong to nano-PM, and most nano-PM cannot be blocked by masks, even when worn to filter PMs. 16
There are several VOC compounds, including alkane (CnH2n+2), cycloalkane, alkene (CnH2n), alkyne (CnH2n−2), and aromatic hydrocarbons. The sources of VOCs are diverse in modern life, including indoor decoration, industrial operations, semiconductor processes, and optoelectronics manufacturing. The concentration of VOCs is high during the indoor decoration process. The furniture industry is the second major source of VOCs due to the evaporation of paint, cleansers, and antioxidants. Outdoor sources of VOCs mainly originate from exhaust gases emitted by industrial plants, vehicles, and furnaces. Many diverse categories could undergo secondary reactions to produce various complex substances that significantly contribute to air quality degeneration.17–20 Long-term exposure to VOCs could lead to several health risks. Activated carbon absorption and photocatalytic reaction are commonly used to eliminate VOCs, and considerable research has focused on VOC removal through chemical absorption and decomposition. For example, Yuan et al. conducted a study that continuously monitored VOC variation in industrial activities to assess VOC distribution and seasonal fluctuations. 18 Methods such as graphitized carbon fiber, titanium dioxide (TiO2) superhydrophobic paint, and metal-organic framework (MOF) have also been applied to remove VOCs for human health protection.21–23
Previous research24–28 showed that polyimide/polyethersulfone (PI/PES) nano-fiber membranes were developed for PM removal. A dual-functional chemical composed of carbon quantum dots/titanium dioxide (CQDs/TiO2) was attached to the PI/PES membrane to enhance its photocatalytic and antibacterial activities. This study employed self-synthesized MOF combined with TiO2 as composite materials to broaden the light absorption range due to the spectral shift caused by loading CQDs on TiO2. In addition, MOF/CQDs/TiO2@polymer reduced the recombination of electrons and holes, thereby increasing light utilization and enhancing photocatalytic properties. 29 Accordingly, polyimide (PI) and polyetherimide (PEI) were used to produce nanofiber membrane via electrospinning, and MOF/CQDs/TiO2 was loaded onto PI/PEI fiber membrane to form MOF/CQDs/TiO2@PEI/PI nanofibers. These nanofibers possessed dual functions, including nanoparticle-scale fiber diameter, small pore size, low-pressure drop, high filtration efficiency, high-temperature resistance, and photocatalytic activity.
Experiment and methodology
Preparation of MOFs, CQDs, and photocatalysts
A mixture of methanol (MeOH, Thermo Scientific) and N,N-dimethylacetamide (DMAc, Thermo Scientific) was prepared in a 1:9 ratio with a total volume of 50 mL. In this solution, 0.503 g of 2-aminoterephthalic acid (NH2-BDC, Thermo Scientific) was added and thoroughly mixed. Subsequently, 3.728 g of titanium butoxide (TBOT, Thermo Scientific) was slowly introduced and stirred using a magnetic stirrer. The resulting solution was transferred to a hydrothermal reactor (BO-300, Hong Dun Co., Ltd.) and heated at 150°C for 24 h. After cooling to room temperature, the solid product was washed three times with methanol to remove any residual solvents. The powder was then dried at 80°C, yielding MOF (NH2-MIL-125) designated as NM125.
The same procedure was followed to prepare MOF (NM125) containing titanium dioxide (TiO2). After the addition of TBOT and thorough mixing, varying amounts of TiO2 (0.75, 1.00, and 1.25 g) were incorporated into the solution. The mixture was stirred for 30 min using a magnetic stirrer and then transferred to a hydrothermal reactor (BO-300, Hong Dun Co., Ltd.), where it was heated at 150°C for 24 h. After cooling to room temperature, the product (NM125/TiO2) was washed three times with methanol and dried at 80°C to obtain the final powder. The hydrothermal method for preparing carbon quantum dots (CQDs) was conducted with reference to the procedures described in previous research.26,30–33
The NM125/TiO2 was weighed, and its mass was recorded before dispersing it in 100 mL of ethanol (EtOH). Subsequently, 0.5 g of CQDs was added, and the mixture was stirred for 10 min. The solution was then transferred into a hydrothermal reactor and heated at 200°C for 4 h. After cooling to room temperature, the solvent was removed at 80°C to yield a photocatalyst (CQDs/NM125/TiO2) labeled as CNP.34,35 The designation of CNP was determined by the amount of added TiO2; thus, addition amounts of 0.75 g, 1.00 g, and 1.25 g of TiO2 in the CQD mixture represented CNP0.75, CNP1.00, and CNP1.25, respectively.
Electrospinning process
To prepare polymer electrospinning solutions of 16.0, 18.0, and 20.0 wt%, 3.2, 3.6, and 4.0 wt% of polyimide (PI, Biosynth) were weighed and dissolved in 84.0, 82.0, and 80.0 wt% of dimethylacetamide (DMAc, Thermo Scientific), respectively. Subsequently, 12.8, 14.4, and 16.0 wt% of polyetherimide (PEI, Sigma-Aldrich) were added, and the mixtures were heated to 90°C with stirring until fully dissolved. To prepare electrospinning solutions containing photocatalysts (CQDs/NM125/TiO2, CNP), photocatalysts were added at concentrations of 1, 3, and 5 wt%. The amount of DMAc was adjusted accordingly to account for the increasing photocatalyst content. Once the PI was completely dissolved in DMAc and uniformly dispersed, PEI was added, and the solution was heated until fully dissolved, completing the preparation of the electrospinning solution.
An electrospinning apparatus (FES-COS, Falco Co, Taiwan) was used to produce the CNP@PI/PEI composite nanofibers by electrospinning the mixed PI/PEI polymer and CQDs/NM125/TiO2 solutions.36–38 In this study, heat-resistant PI and PEI polymers were used as materials for fiber membranes. Effective CNP@PI/PEI nanofiber membranes were produced at the optimal parameters of operating conditions of 17 kV, a collection time of 2 h, a catalytic addition of 1 wt%, a CNP ratio of 0.75, and a distance of 15 cm between the collector plate and the 21-gauge needle.
Characterization analysis
An X-ray photoelectron spectroscopy (XPS; K-Alpha, Thermo Scientific) with a monochromatized Al Kα line (1486.6 eV) 12 was used to measure the surface chemical compositions and the recombination of electrons/holes in CQDs/NM125/TiO2. A scanning electron microscope (SEM; TESCAN, 5136 MM) equipped with an energy-dispersive X-ray spectrometer (EDS, X-Act, Oxford) was used to observe the surface morphology of CQDs/NM125/TiO2. The functional groups and nano-scale and/or atomic level structures of the photocatalysts were analyzed by Fourier-transform infrared spectrophotometer (PerkinElmer, Spectrum 100).
Photocatalytic activity and filter quality
The acetone decomposition rate evaluated the photocatalytic activities of CQDs/NM125/TiO2 under various light sources, as illustrated in Figure 1. The light sources included a 365 nm lamp (Philips, 8 W) and light-emitting diode (LED) lamps at wavelengths of 435–450 nm (blue light), 492–577 nm (green light), 577–597 nm (yellow light) and 622–760 nm (red light). The light intensity and wavelength distribution were characterized using an LI-COR LI-1800 spectroradiometer (LI-COR) at the outer surface of the inner reactor tube. Acetone concentrations in the samples were measured using a Thermo TVA 1000 (Kaoten) equipped with a flame ionization detector (FID).23,39–41 The temperature of the photoreactor was maintained at 25°C throughout all experiments. Schematic diagram of the annular photoreactor and filter testing system.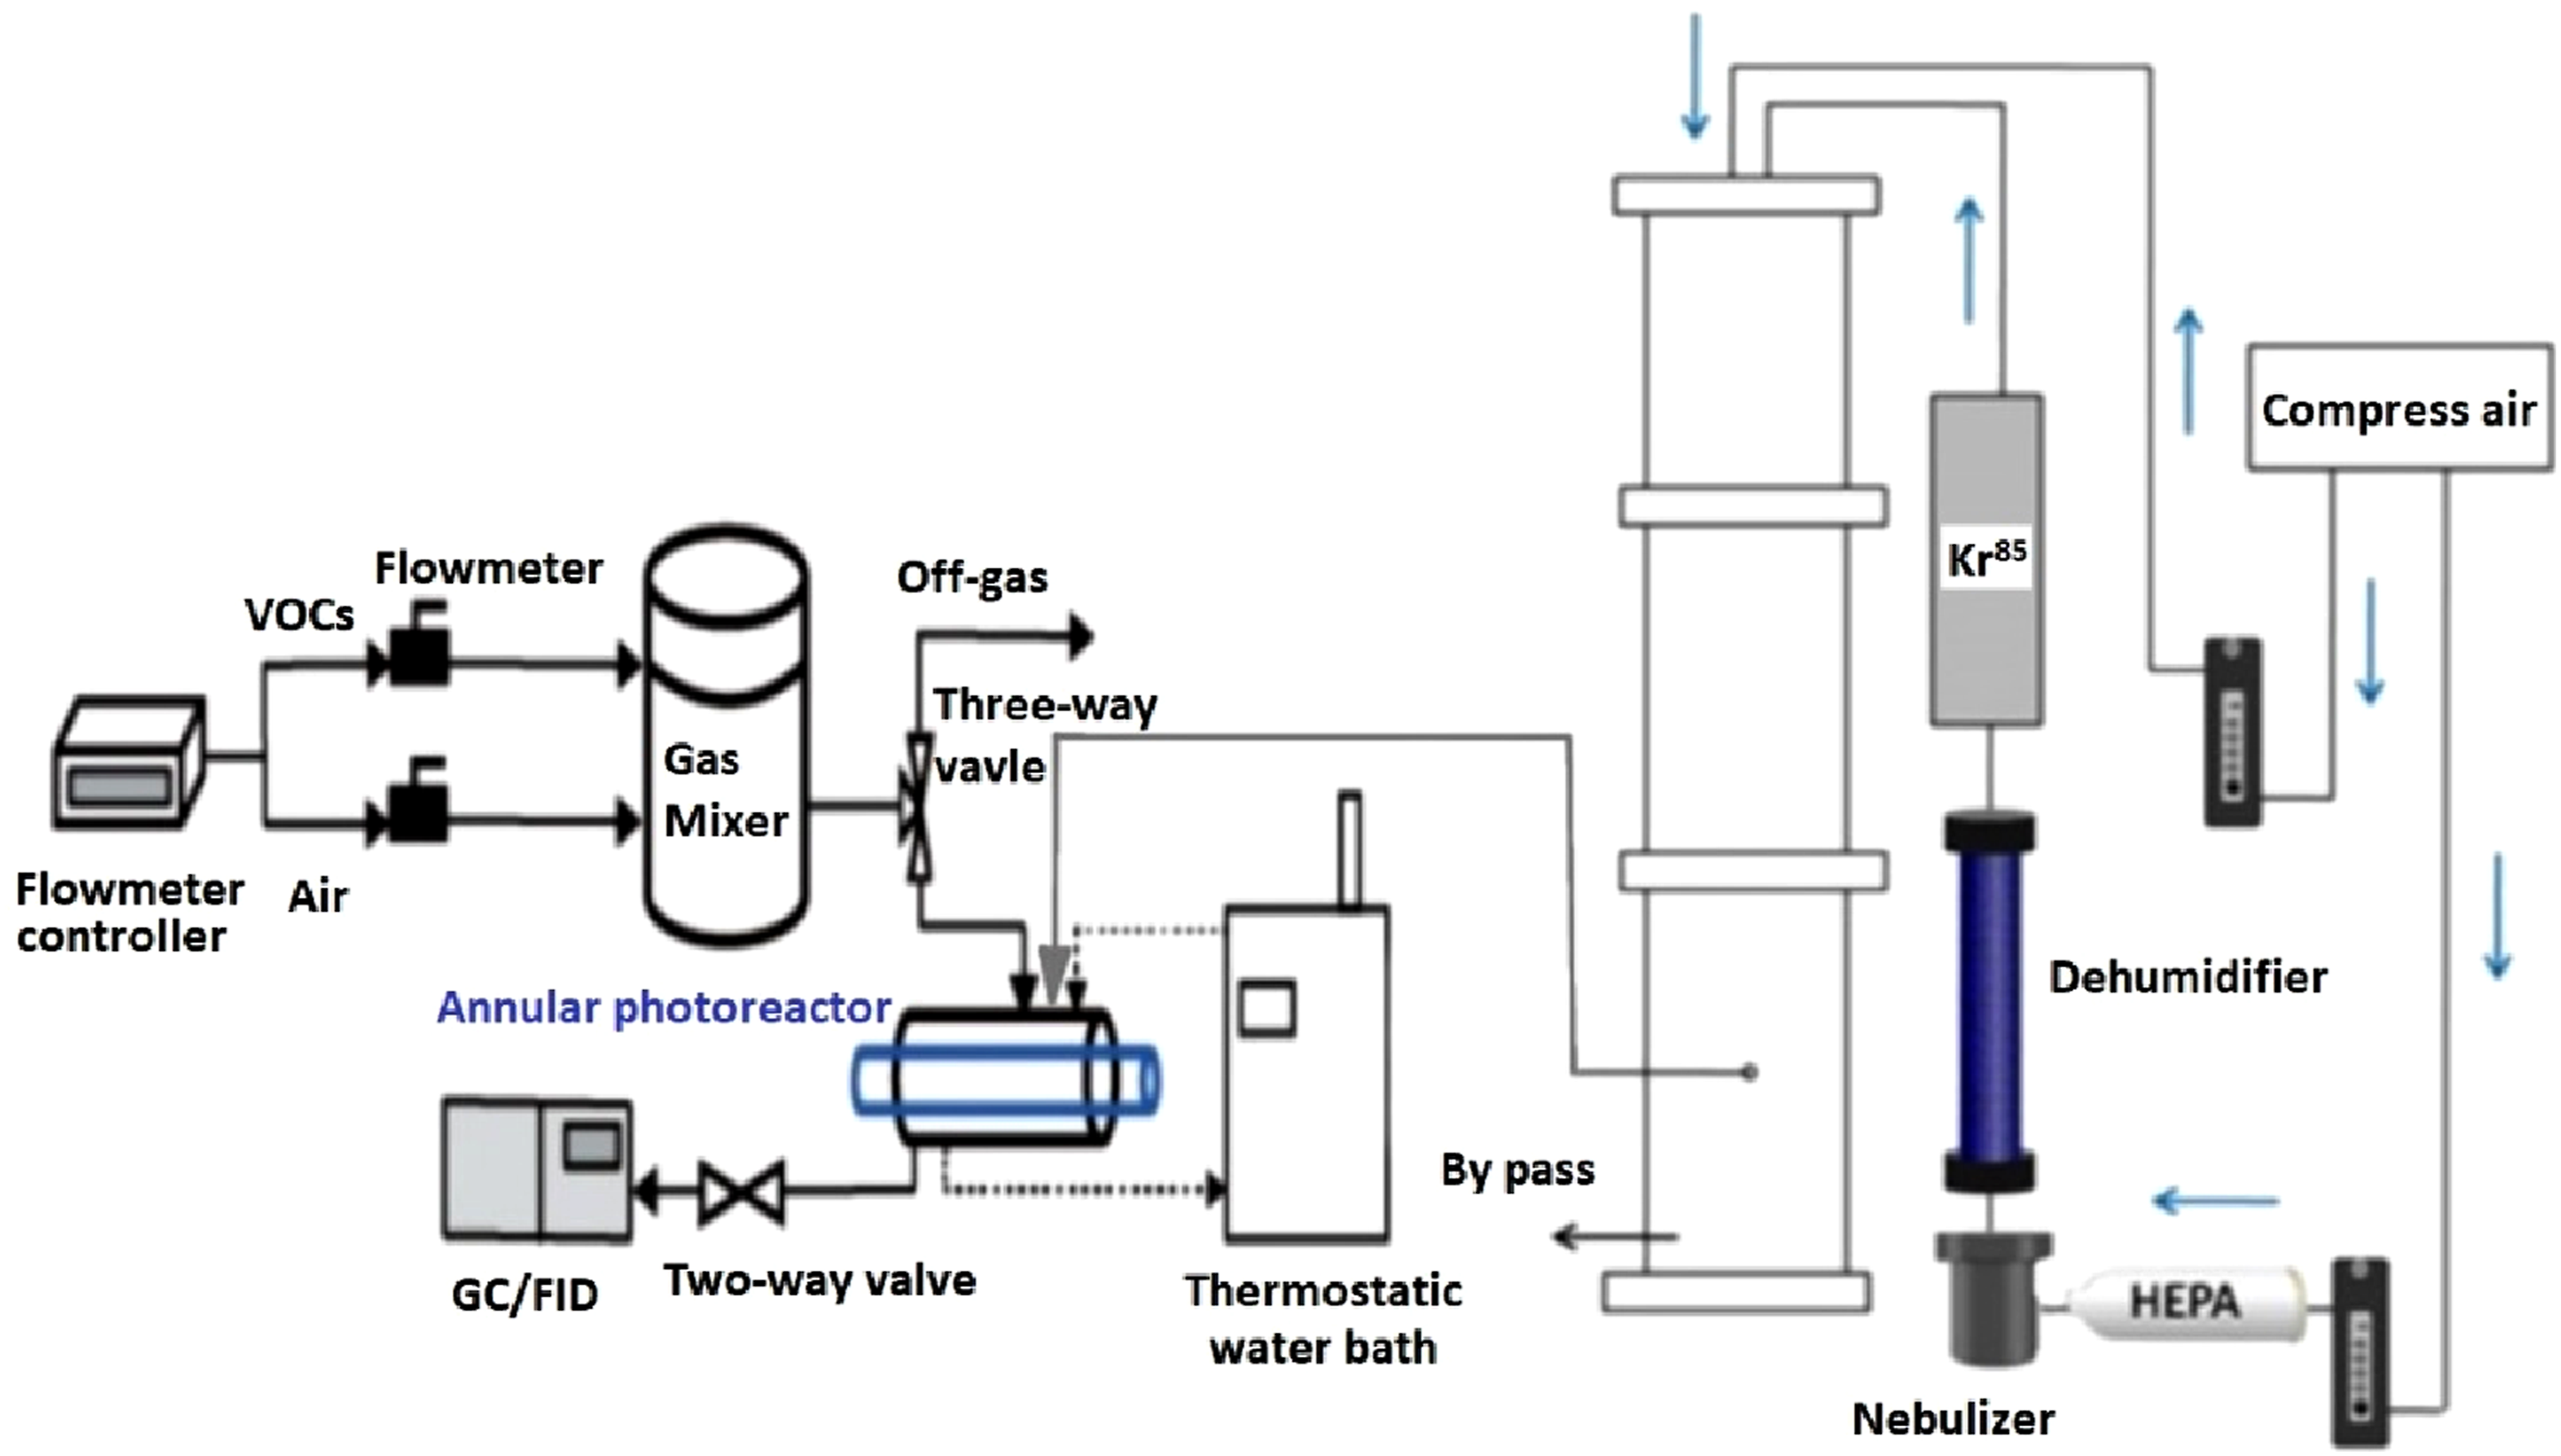
To assess the performance of the CNP@PI/PEI nanofibers as a potential material for medical masks, particle filtration efficiency (PFE) and differential pressure tests were conducted in accordance with ASTM F2299 and European Standard EN 14683, 42 respectively. The filtration quality of the 16 cm2 CNP@PI/PEI nanofibers was evaluated using differential pressure and penetration parameters.
Thermal calorimetry tests
On the basis of conventional thermoanalytical theory, DSC (Mettler TA8000 system) is a common method used to examine the decomposition excursion of a sample. The principle of DSC is to perform temperature-programmed screening experiments using a measuring cell that can withstand relatively high pressure of up to approximately 100 bar (DSC 821e). DSC and STARe software were used to obtain thermal curves. The optimal thermal equilibrium was acquired through DSC by four heating rates (β): 2.0, 4.0, 8.0, and 16.0°C min−1. Samples weighing 3.0–10.0 mg were used in the experiments. The temperature was increased from 30.0 to 350.0°C, a range that was previously determined during excursions under various preset conditions,27,43 and the programmed setting was used to perform dynamic scanning.
Thermogravimetry (TG) was widely employed to evaluate sample decomposition process with temperature variations. Pyris 1 TG analyzer (PerkinElmer Taiwan Corporation) was employed to measure the sample mass loss during decomposition excursion, while the operating conditions were adjusted as scanning rate of 20°C/min, temperature range of 30 to 800°C, and sample weight of 5.0–10.0 mg. Differential scanning calorimetry (DSC, Mettler TA8000) was commonly used to measure sample decomposition excursion. Temperature-programmed screening experiments were the specific traits of DSC, and the measuring cell could withstand relatively high pressure of up to approximately 100 bar (DSC 821e). STARe software was used to present thermal curves after a complete scanning process. The operating conditions were set as scanning rate of 20°C/min, temperature range of 30 to 500°C, and sample weight of 3.0–10.0 mg. 27
Results and discussion
Evaluation of photocatalytic activity at optimal experimental conditions by the Taguchi method
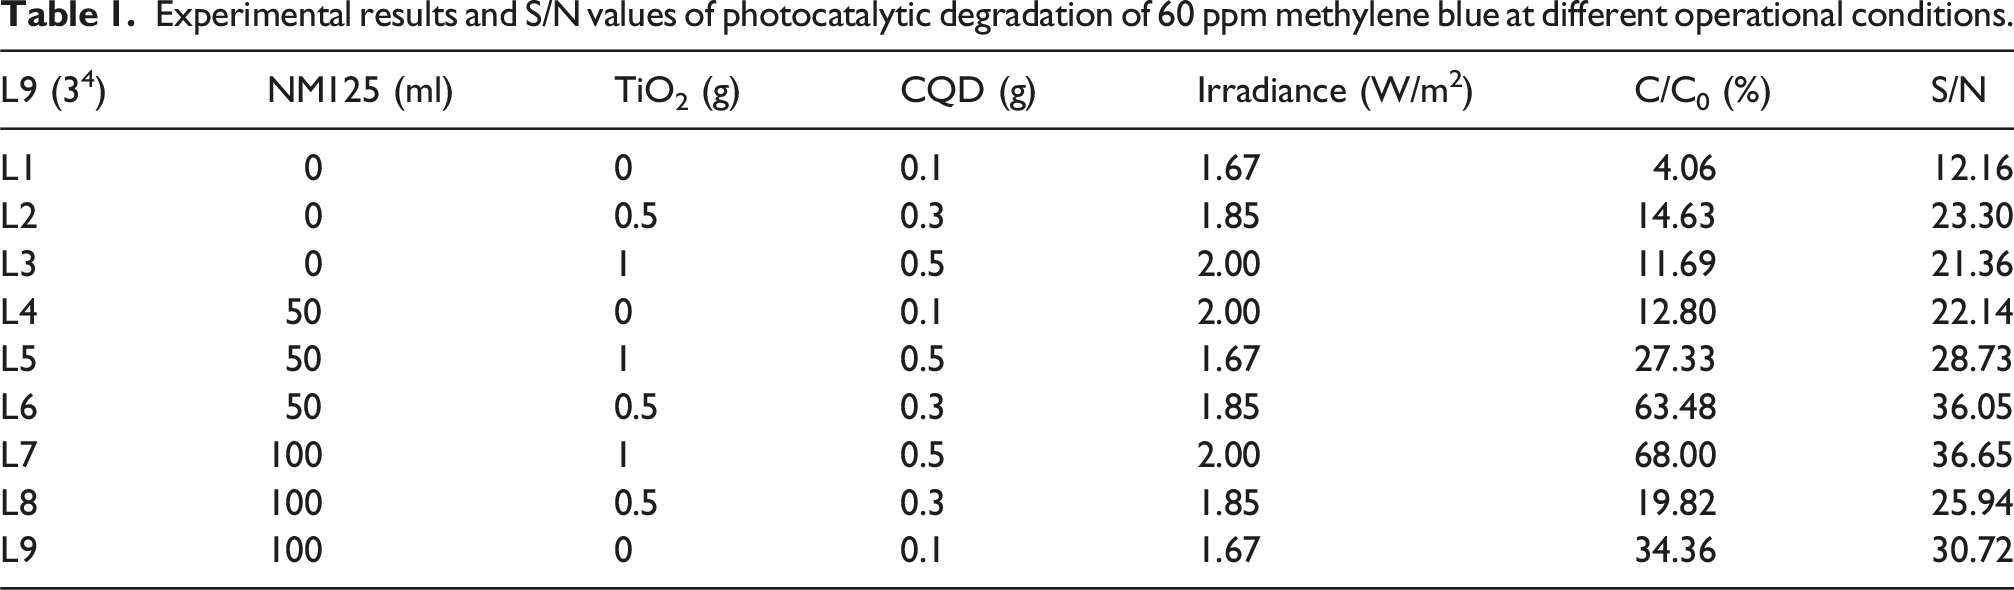
The photocatalytic degradation activity of a CNP@PI/PEI nanofiber membrane was analyzed using the Taguchi method (the larger, the better). This study evaluated four factors: NM125 loading on CNP@PI/PEI, TiO2 additions of CNP@PI/PEI, CQDs dosage in CNP@PI/PEI, and variation of irradiance to determine the optimal conditions for maximizing photocatalytic activity for methylene blue decomposition. Each factor was tested at three levels to assess how different factor combinations influenced photocatalytic activity.
The levels for each factor were defined as follows: NM125 loading on CNP at 0 ml, 50 ml, and 100 ml; TiO2 additions to CNP@PI/PEI at 0 g, 0.5 g, 1 g; CQDs dosage in CNP@PI/PEI at 0.1 g, 0.3 g, and 0.5 g; and variation of irradiance at 1.67 W/m2, 1.85 W/m2, and 2.00 W/m2. Photocatalytic activity was determined based on the signal-to-noise (S/N) ratio, where a higher S/N value indicated stronger photocatalytic performance. The variation in S/N values across different factor combinations highlighted the relative strength of photocatalytic activity.

Experimental results and S/N values of photocatalytic degradation of 60 ppm methylene blue at different operational conditions.
Factor influence order analysis of four experimental factors.

Besides photocatalytic degradation in liquid solution, this study used acetone as a gaseous sample to evaluate photocatalytic performance. Based on factors from previously published papers,24–28 this study adopted established parameters, including an operating voltage of 17 kV, a collection time of 2 h, a catalytic addition of 1 wt%, and a CNP ratio of 0.75 to produce a nanofiber membrane. Subsequently, the photocatalytic test of acetone was conducted at 20 ppm concentration and 365 nm irradiance, with the results shown in Figure 2. Photocatalytic received increased with higher irradiance, leading to enhanced degradation, and 82% of acetone was decomposed under conditions of 2.00 W/m2 irradiance and a 5-h operating time. Photocatalytic degradation of acetone at different irradiances. (Operating factors: operating voltage of 17 kV, collection time of 2 h, catalytic addition of 1 wt%, and CNP ratio of 0.75).
Under the operating conditions with acetone concentrations of 10 ppm, 20 ppm, 50 ppm, and 80 ppm, photocatalytic degradation was conducted at a wavelength of 365 nm to observe acetone degradation relative to its concentration. The degradation efficiency increased as the acetone concentration decreased, with 92% of acetone decomposed at 10 ppm within 3 h, as shown in Figure 3. Moreover, the degradation reached 100% after 4 h of operation. Therefore, this study developed the CNP@PI/PEI fiber membrane, demonstrating the photocatalytic ability for both liquid and gaseous pollutants. Photocatalytic degradation of different acetone concentrations. (Operating factors: operating voltage of 17 kV, collection time of 2 h, catalytic addition of 1 wt%, and CNP ratio of 0.75).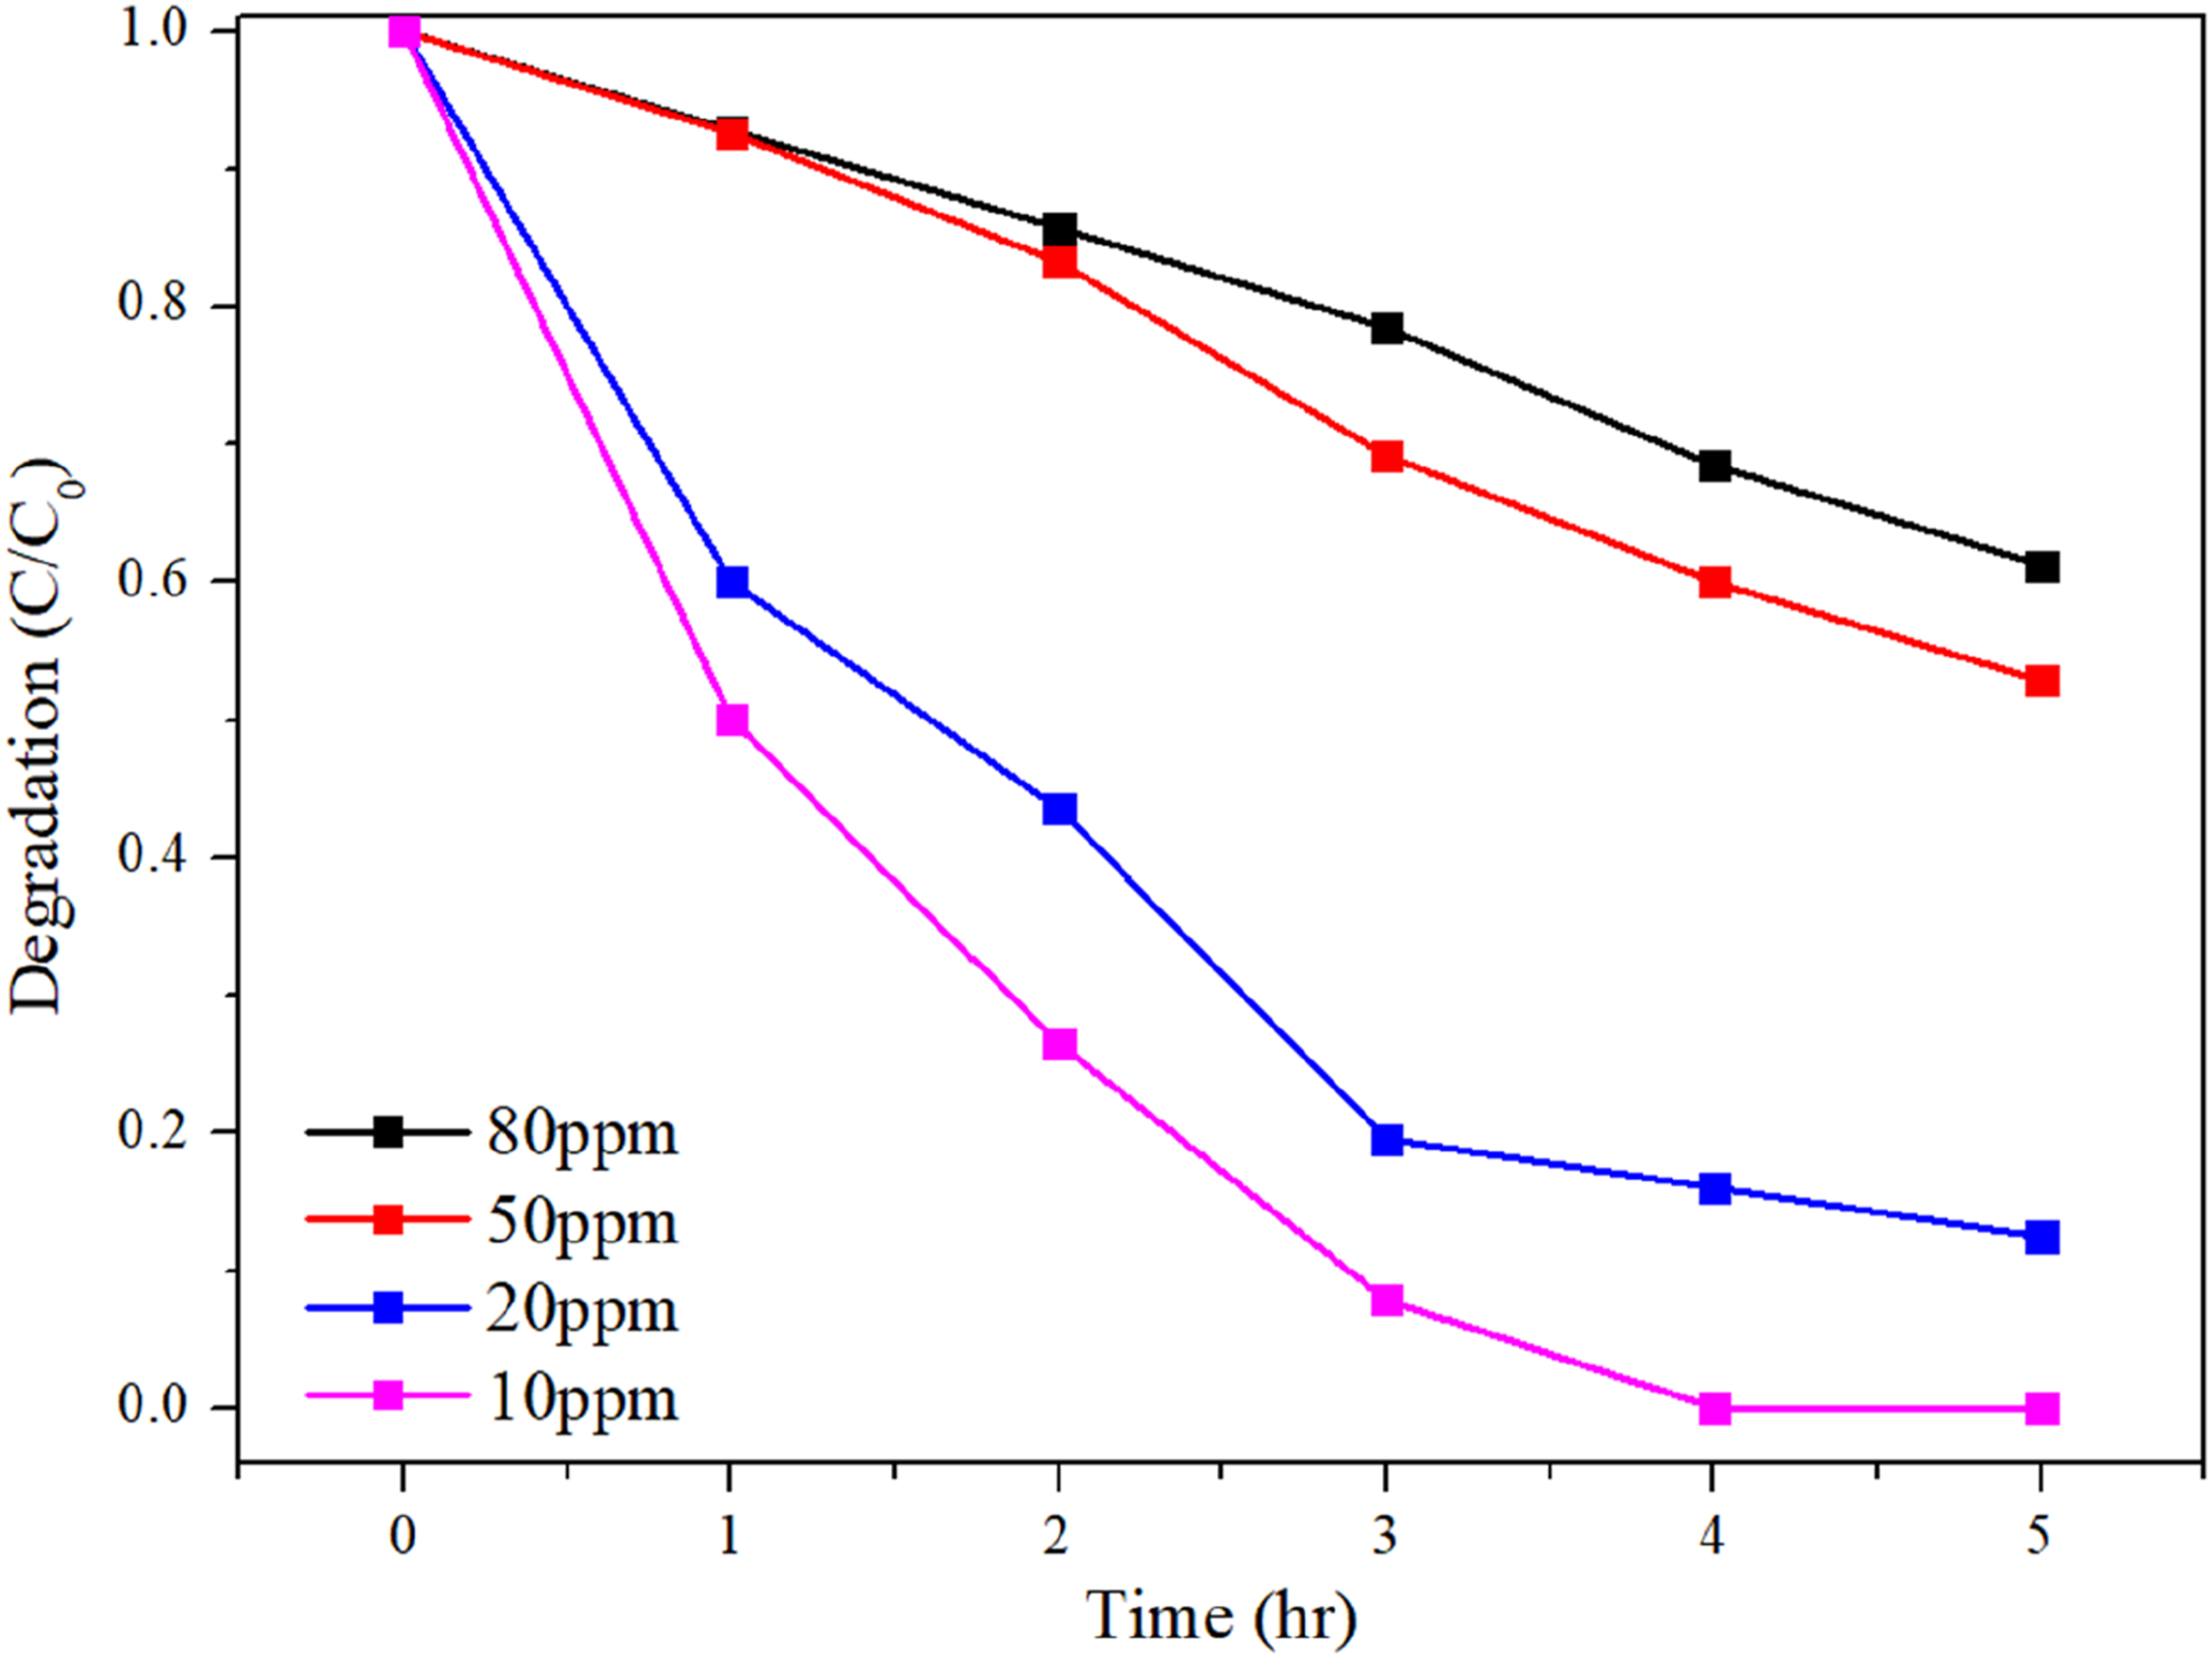
Thermal analysis of fiber membrane via thermogravimetry
Industrial plants typically exhaust high-temperature waste gases, so filter membranes must possess thermal resistance, which depends on their specific compositional morphology. Thermal analysis is widely used to evaluate the thermal stability of samples, which is crucial for ensuring long-term service life. Common techniques include thermogravimetry (TG) and differential scanning calorimetry (DSC). In this study, TG was performed under a nitrogen atmosphere with a heating rate of 10°C/min to assess the thermal resistance of fiber membranes with different PI/PEI ratios (0:10, 1:9, 2:8, 3:7, 10:0). Additionally, DSC measurements, also conducted at a heating rate of 10°C/min, were used to determine the glass transition temperature (Tg) of the membranes at various PI/PEI ratios (0:10, 1:9, 2:8, 3:7, 10:0). Figure 4 depicts weight loss curve for various PI/PEI ratios obtained via TG. Significant mass loss occurred at approximately 150°C and 500°C. The weight loss near 150°C was attributed to the decomposition of residual organic compounds and solvents, while the substantial weight loss at 500°C corresponded to the breakdown of the molecular chains. Figure 5 shows the heat flow variation versus temperature at different PI/PEI ratios via DSC measurement. The Tg values for PI/PEI ratios of 0:10, 1:9, 2:8, 3:7, and 10:0 were 208°C, 204°C, 236°C, 222°C, 263°C, respectively. The highest Tg (236°C) was observed at a PI/PEI ratio of 2:8, indicating that this composition’s PI/PEI fiber membrane exhibits enhanced thermal stability suitable for high-temperature industrial applications such as servers, steel mills, and ironworks. Weight loss curves of PI/PEI at different mixing ratios via TG test. Heat flow variations of PI/PEI at five mixing ratios via the DSC test: (a) 10:0, (b) 1:9, (c) 2:8, (d) 3:7, and (e) 0:10.

According to Harshavardhan et al., 44 the Tg of PEI was 208°C, as measured by calorimetry. Furthermore, Liaw et al. 45 reported that the Tg of PI varies depending on production conditions, and the Tg of PI presented as a non-constant value ranging from 320 to 370°C.
Tensile testing
During air pollution filtration procedures, several factors, such as fiber density, fiber thickness, and amount of air pollution, affected the filtration efficiency of the fiber membrane. Tensile testing was applied to calculate the force resistance of the fiber membrane and determine the proper mixing ratios of the fiber membrane’s composition. The content of PI/PEI was the dominant material in the electrospinning solution, so variations in different PI/PEI mixing ratios were conducted to measure the force resistance of the fiber membrane.
Then, tensile testing involved four parameters: maximum force, maximum stress, yield force, and yield stress. The toughness value was calculated by integrating the stress-strain curve. When an external force is applied to a material to induce deformation, the force is called yield stress. If the external force exceeds yield stress, the material will break. Moreover, the maximum stress was closely related to the shape of the material, reflecting the internal force of the material, and the energy absorbed before failure was referred to as toughness. It indicated disruption of the material from its original extension.
Results of tensile testing at different PI/PEI mixing ratios.

Characterization analysis results of FTIR and XPS
Figure 6 shows FTIR results of different CNP ratios, and there is one obvious absorption peak at the wavelength of 3450 cm-1, represented as O-H stretching due to effect of water absorption, in all samples with different CNP ratios. Moreover, NM125 displays a N-H bending vibration at the wavelength of 1402 cm-1, and there are other functional groups, such as C=C stretching, C-N stretching, C-O stretching, and Ti-O-Ti stretching, existed in at the wavelengths of 1555 cm−1, 1240 cm−1, 1163 cm−1, and 800 cm−1 respectively. CQD spectrum presents C=C stretching and C-H stretching at the wavelengths of 1556 cm−1 and 1394 cm−1, and CNP composite materials also depicts the same functional groups existed in the corresponding wavelengths as CQD spectrum. Accordingly, N-H bending vibration, C=C stretching, C-N stretching, C-O stretching, and Ti-O-Ti stretching exist in at the wavelengths of 1394 cm−1, 1555 cm−1, 1240 cm−1, 1163 cm−1, and 800 cm−1 respectively, and results of this study are similar with previous studies by Yang et al., Ma et al., Liang et al., and Cui et al.,46–48 while N-H bending vibration, O-H stretching, C=C stretching, C-N stretching, C-O stretching, and Ti-O-Ti stretching exist in the wavelengths of 1339 cm−1, 3423 cm−1, 1600 cm−1, 1260 cm−1, 1300–800 cm−1, and 800–500 cm−1 respectively. FTIR spectrums of different CNP ratios.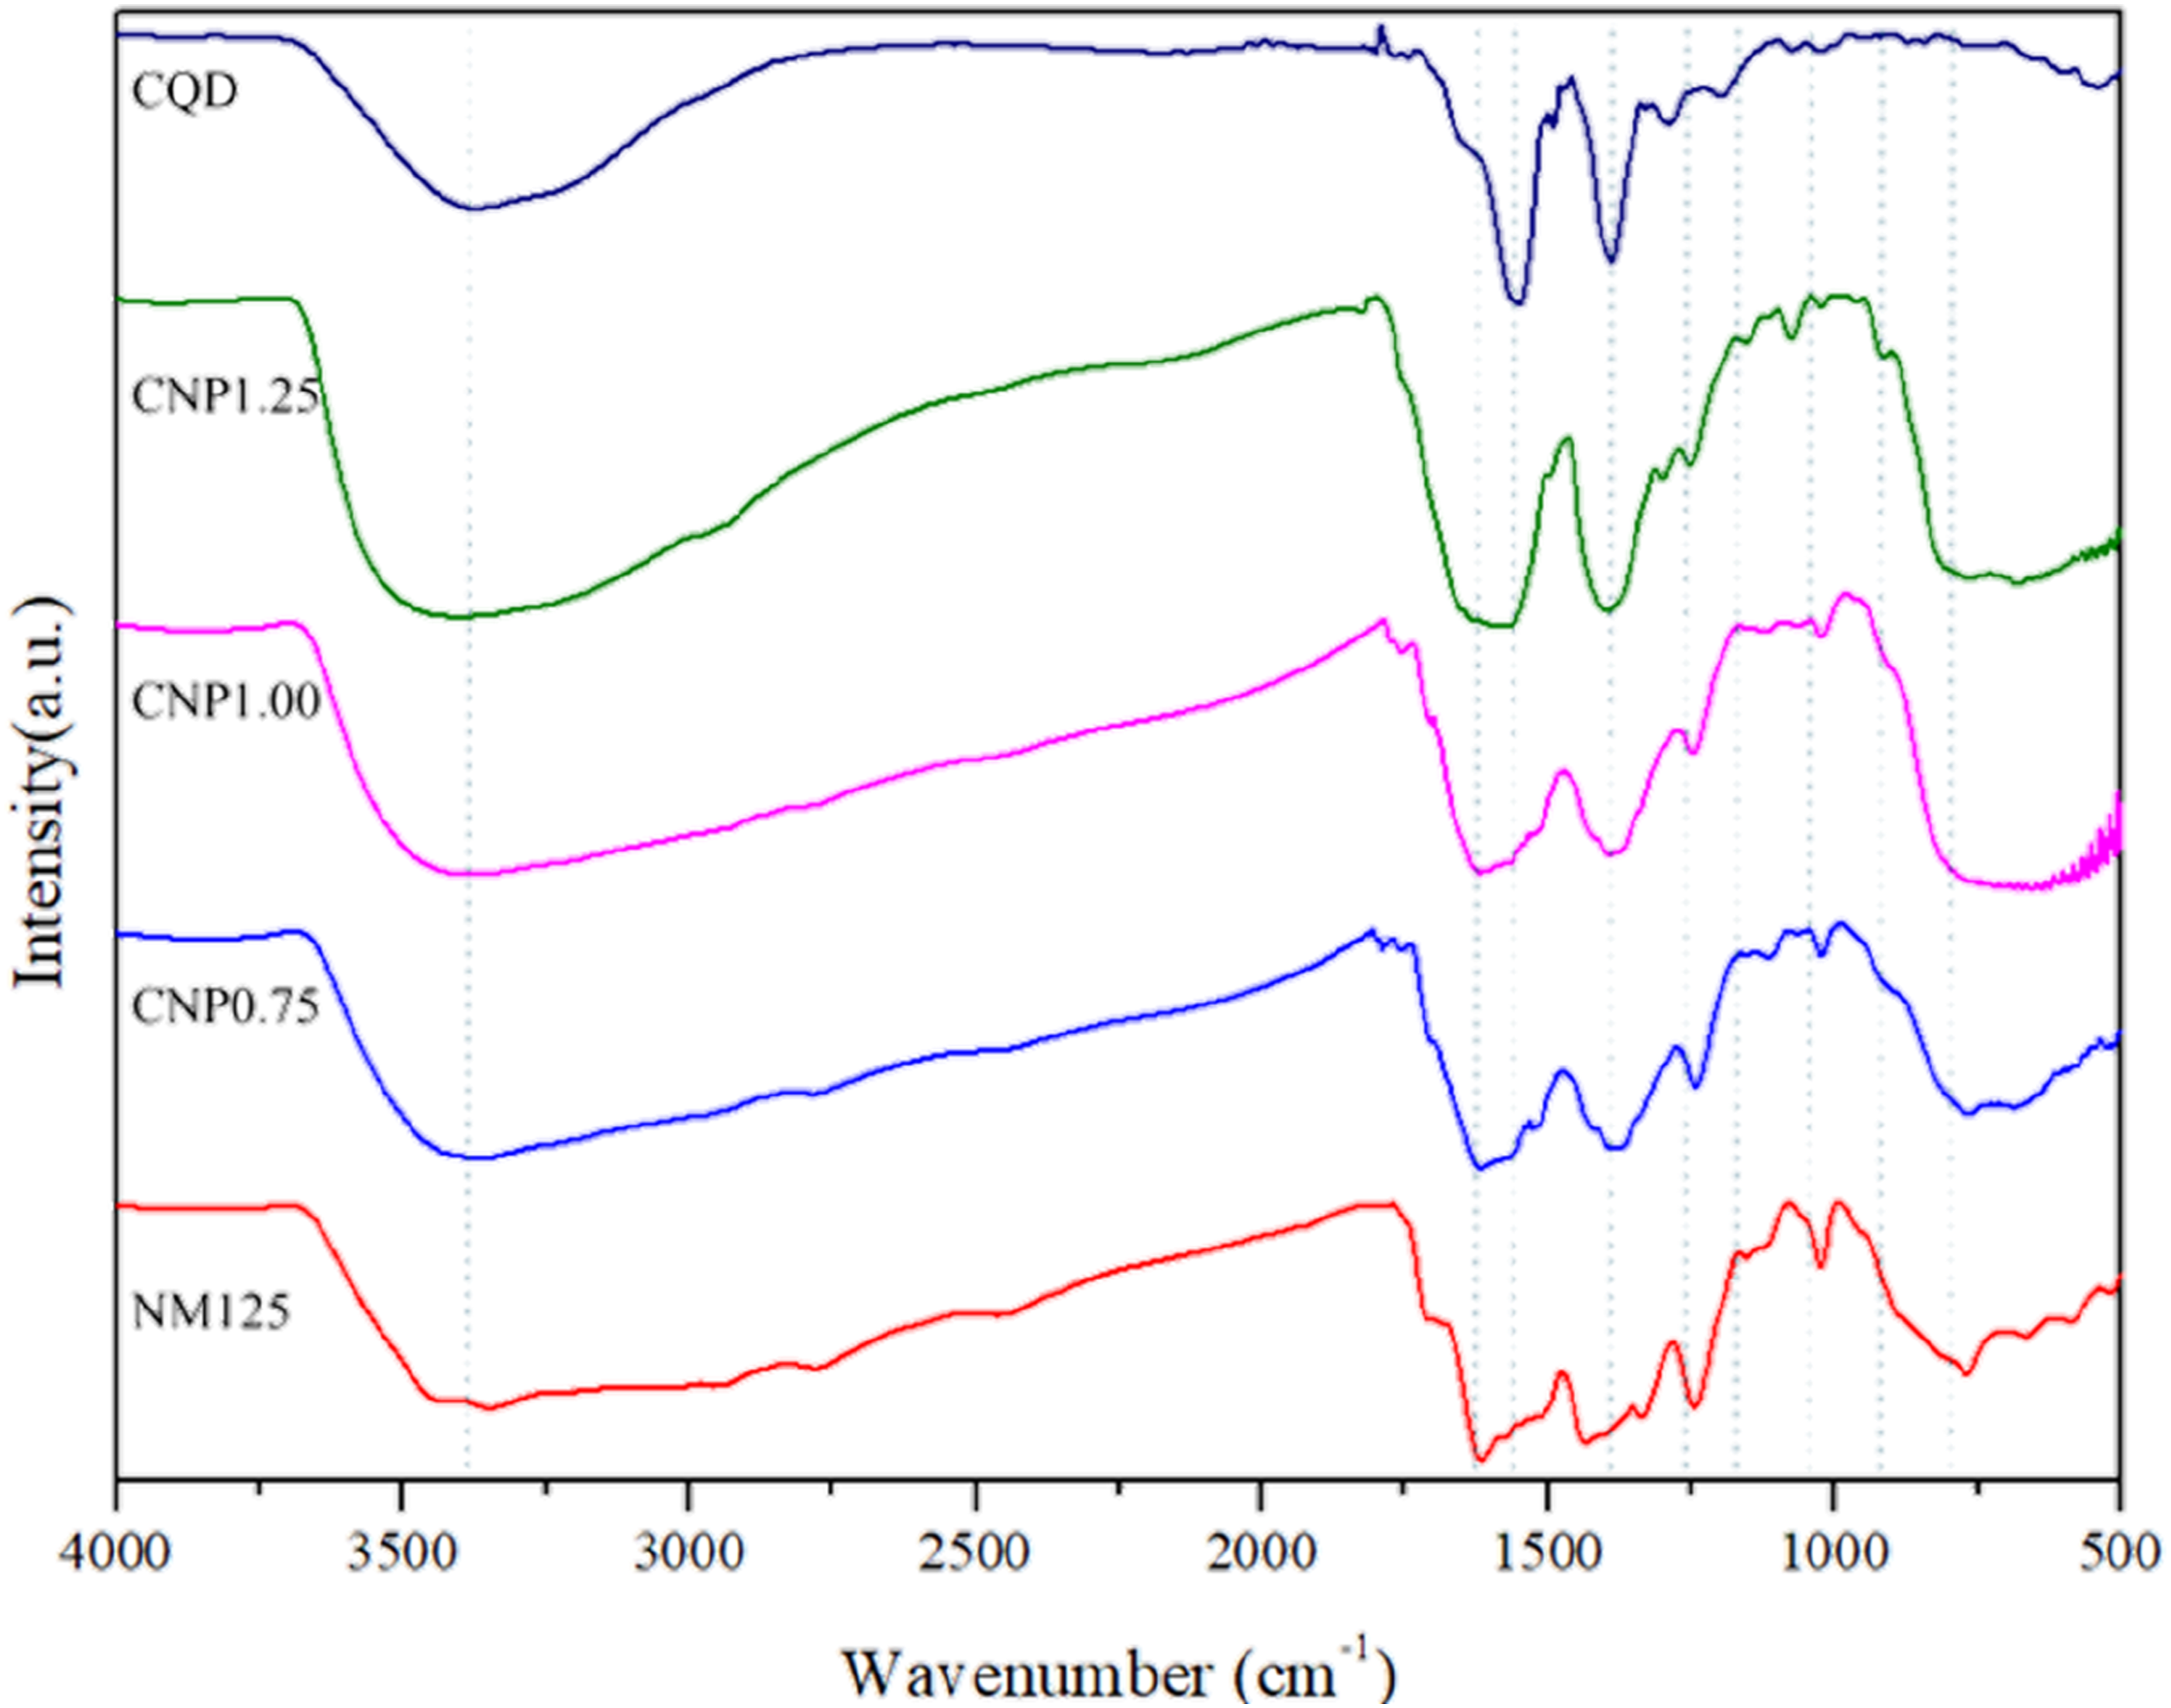
Figure 7 displays the Ti 2p spectrum with specific peaks at 465 eV and 458 eV, respectively, corresponding to Ti 2p1/2 and Ti 2p3/2. Moreover, previous studies49,50 have reported Ti 2p1/2 and Ti 2p3/2 peaks at binding energies of 464.4 eV and 458.7 eV and at 463.0 eV and 458.5 eV, correspondingly, which confirms the exitance of titanium in the composite materials. Ti2p XPS spectrums of various materials (a) CNP1.25 (b) CNP1.00 (c) CNP0.75 (d) NM125 (e) TiO2.
The Ti 2p1/2 specific peak of CNP0.75 acquired a higher NM125 loading to result in binding energy shift from 457.38 eV to 456.91 eV, and the specified peak of Ti 2p3/2 shifted from 463.15 eV to 462.92 eV. This shift was reasonable to the transfer of electrons from TiO2 to NM125 at the interface for the assemblage of the photogenerated hole on the TiO2 side. Accordingly, these results presented the formation of heterostructures and arose interfacial electron mobility.
Filtration quality calculation via Taguchi method analysis
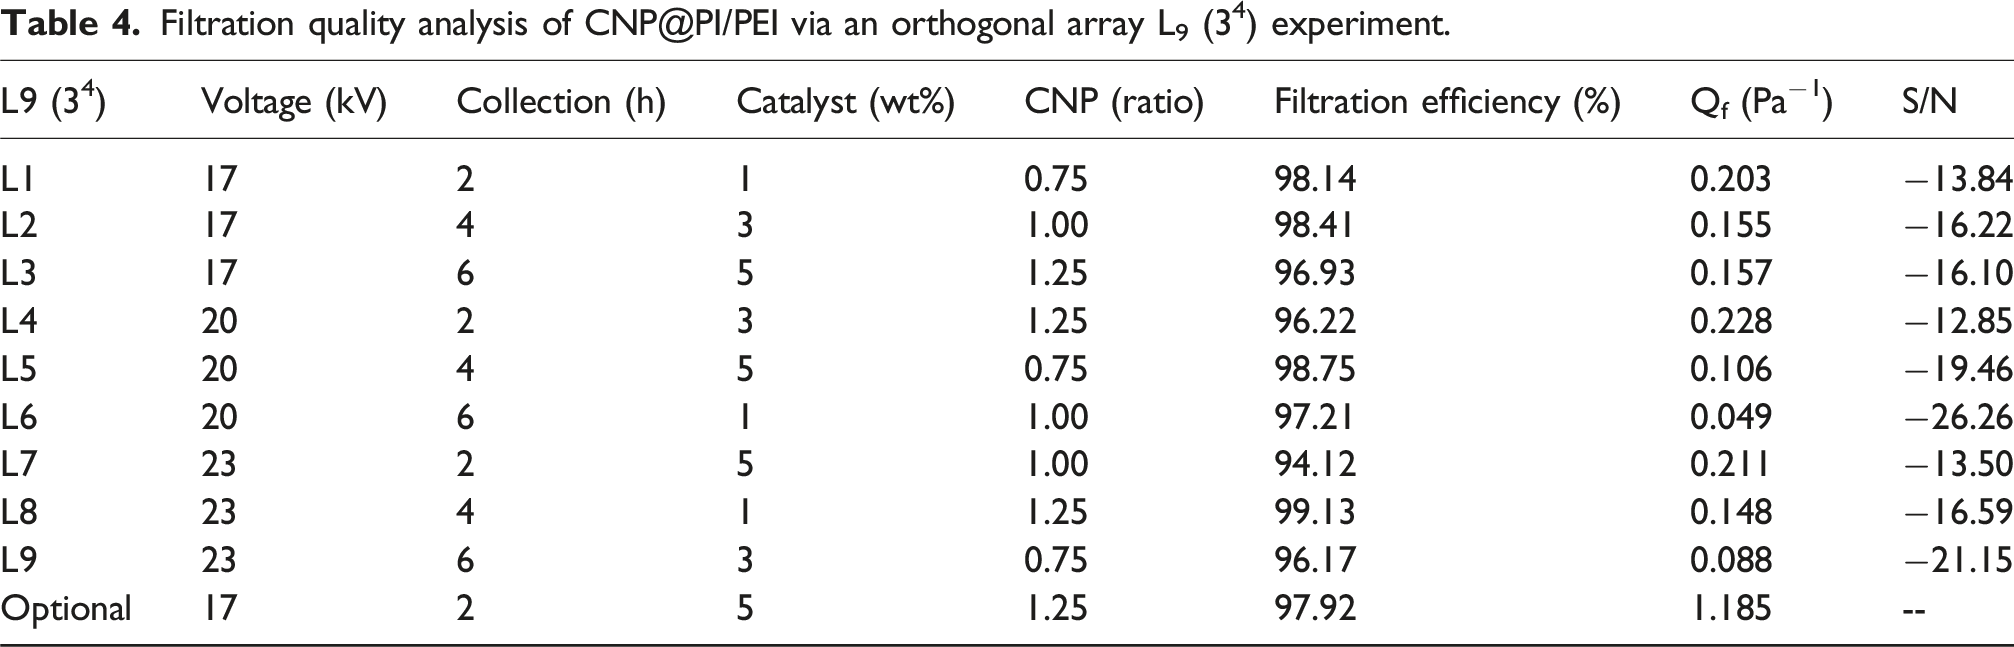
Filtration quality analysis of CNP@PI/PEI via an orthogonal array L9 (34) experiment.


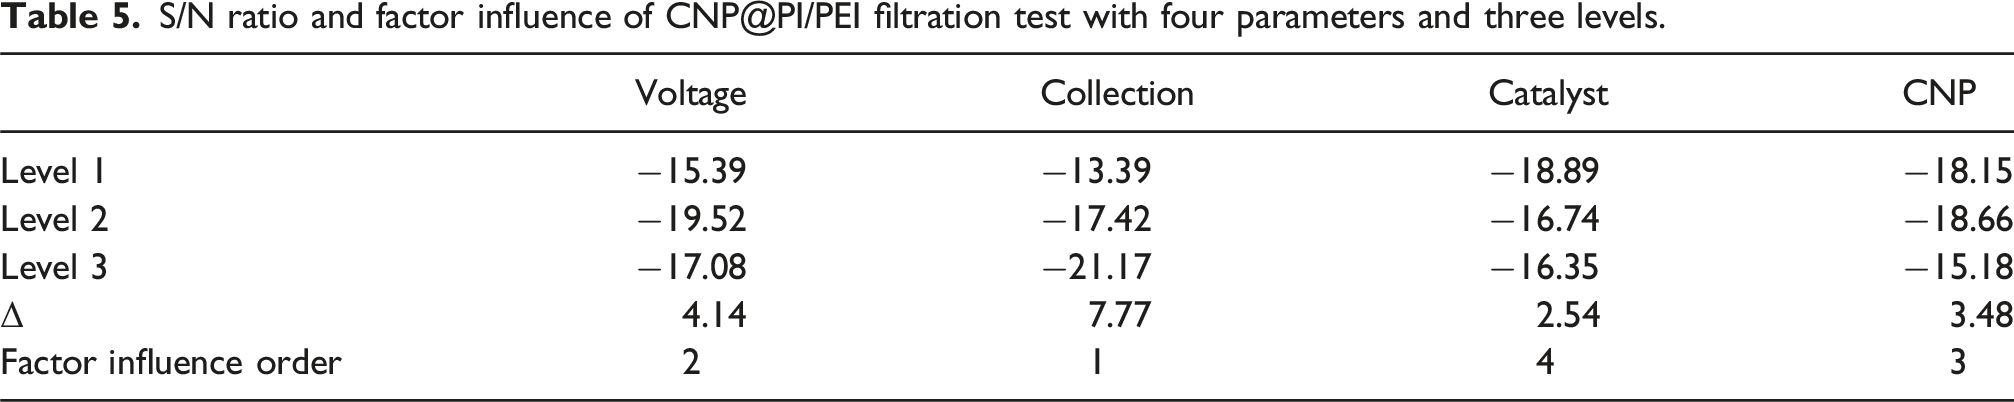
S/N ratio and factor influence of CNP@PI/PEI filtration test with four parameters and three levels.
Larger-the-better:
The S/N ratios and factor influences for the CNP@PI/PEI filtration test are summarized in Table 5. The optimal conditions were identified as voltage (17.0 kV), collection time (2 h), catalyst addition (5 wt%), and CNP ratio (1.25), while the best value of Qf was 1.185 Pa−1.
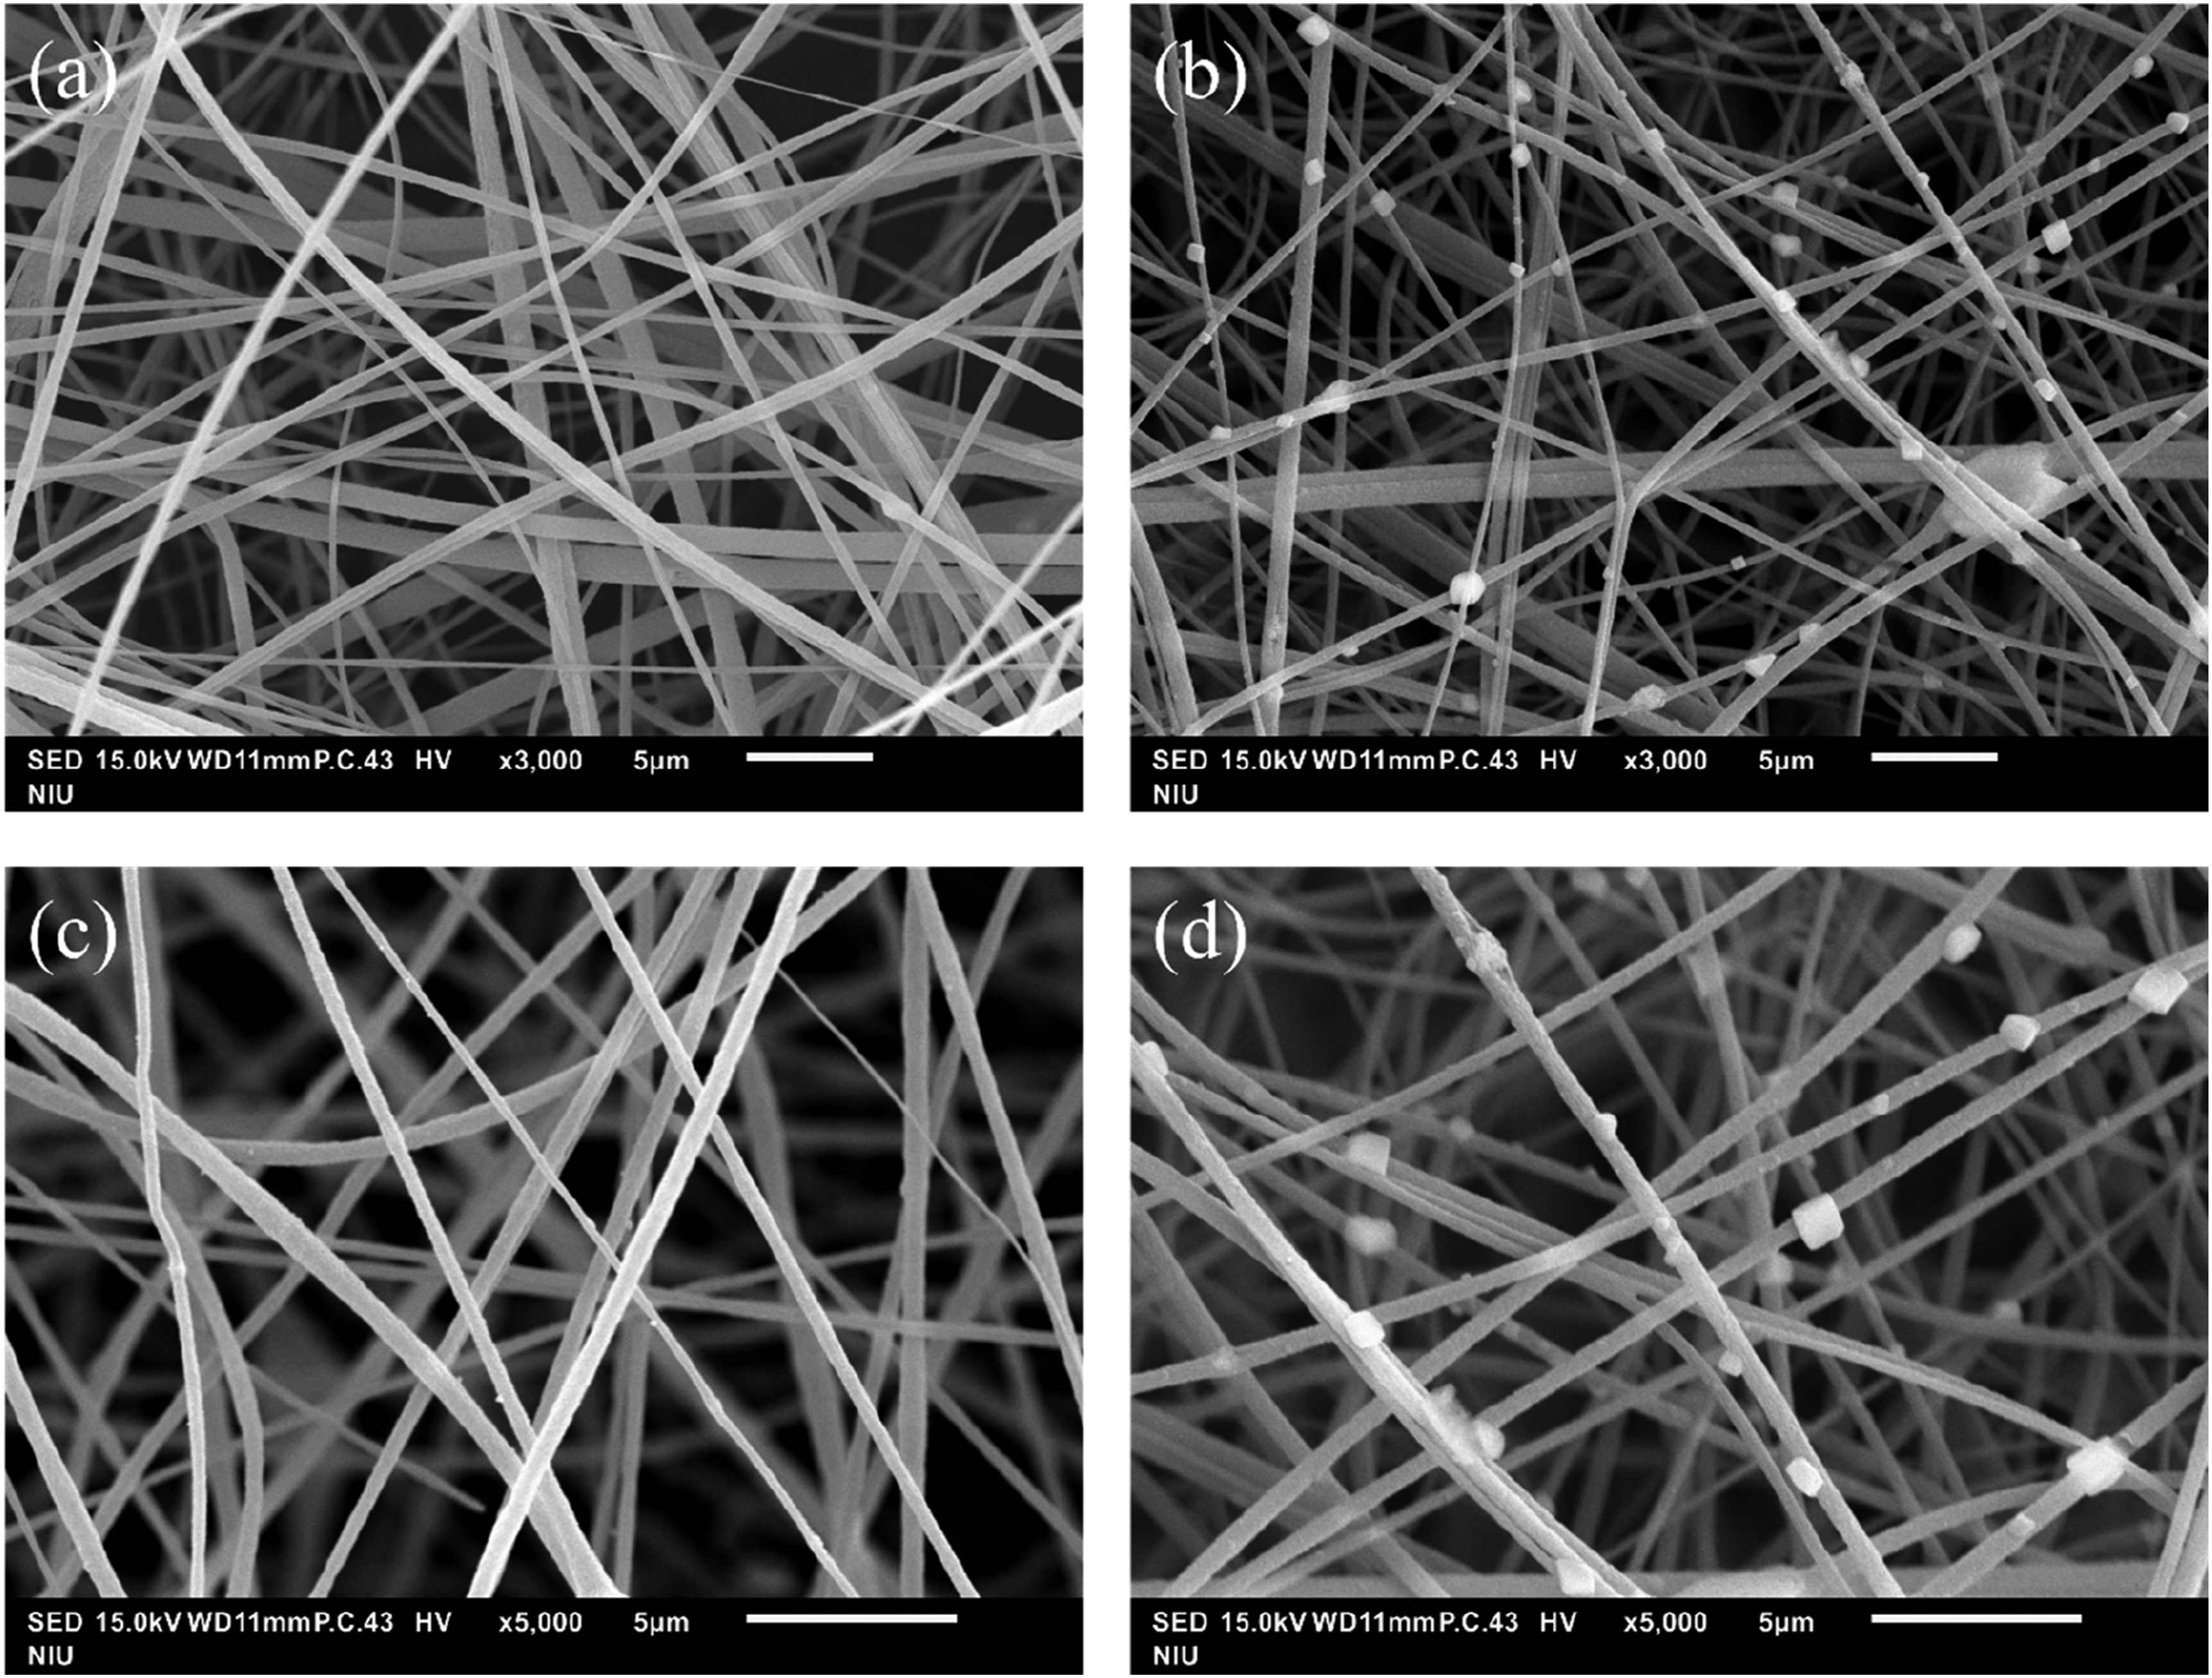
The filtration efficiency of the CNP@PI/PEI membrane at different operating parameters (as presented in Table 4) is illustrated in Figure 8, with particle sizes ranging from 30 to 500 nm adopted for penetration tests. Particles within this size were mostly filtrated by CNP@PI/PEI membrane under various operating parameters due to the low penetration efficiency. Accordingly, this study has successfully synthesized a CNP@PI/PEI membrane with high filtration efficiency of particle pollutant with particle sizes ranging from 30 to 500 nm. Moreover, SEM images before and after the filtration tests are shown in Figure 9. No particles were attached to the fiber membrane before the filtration test, while several particles were observed on the membrane surface after the test. According to the results in Table 4, the fiber membrane under the operating parameters of L8 exhibited a high filtration efficiency of 99.13% but a low filtration quality (0.148 Pa−1) due to a high-pressure loss (32 Pa). In contrast, the membrane under the operating parameters of L4 showed a filtration efficiency of 96.22% with a higher filtration quality (0.228 Pa−1), attributed to a lower pressure loss (14 Pa). Therefore, it is difficult to achieve both high filtration efficiency and filtration quality simultaneously, as the relationship between filtration efficiency and filtration quality is inversely correlated based on the governing equations. Filtration efficiency of CNP@PI/PEI membrane at different mixing ratios for particle size ranged from 30 to 500 nm. L1–L9 represent the different test conditions of Taguchi method in the Table 1. SEM result of CNP@PI/PEI fiber membrane before and after filtration test: (a) 3000× magnification before filtration, (b) 3000× magnification after filtration, (c) 5000× magnification before filtration, and (d) 5000× magnification after filtration.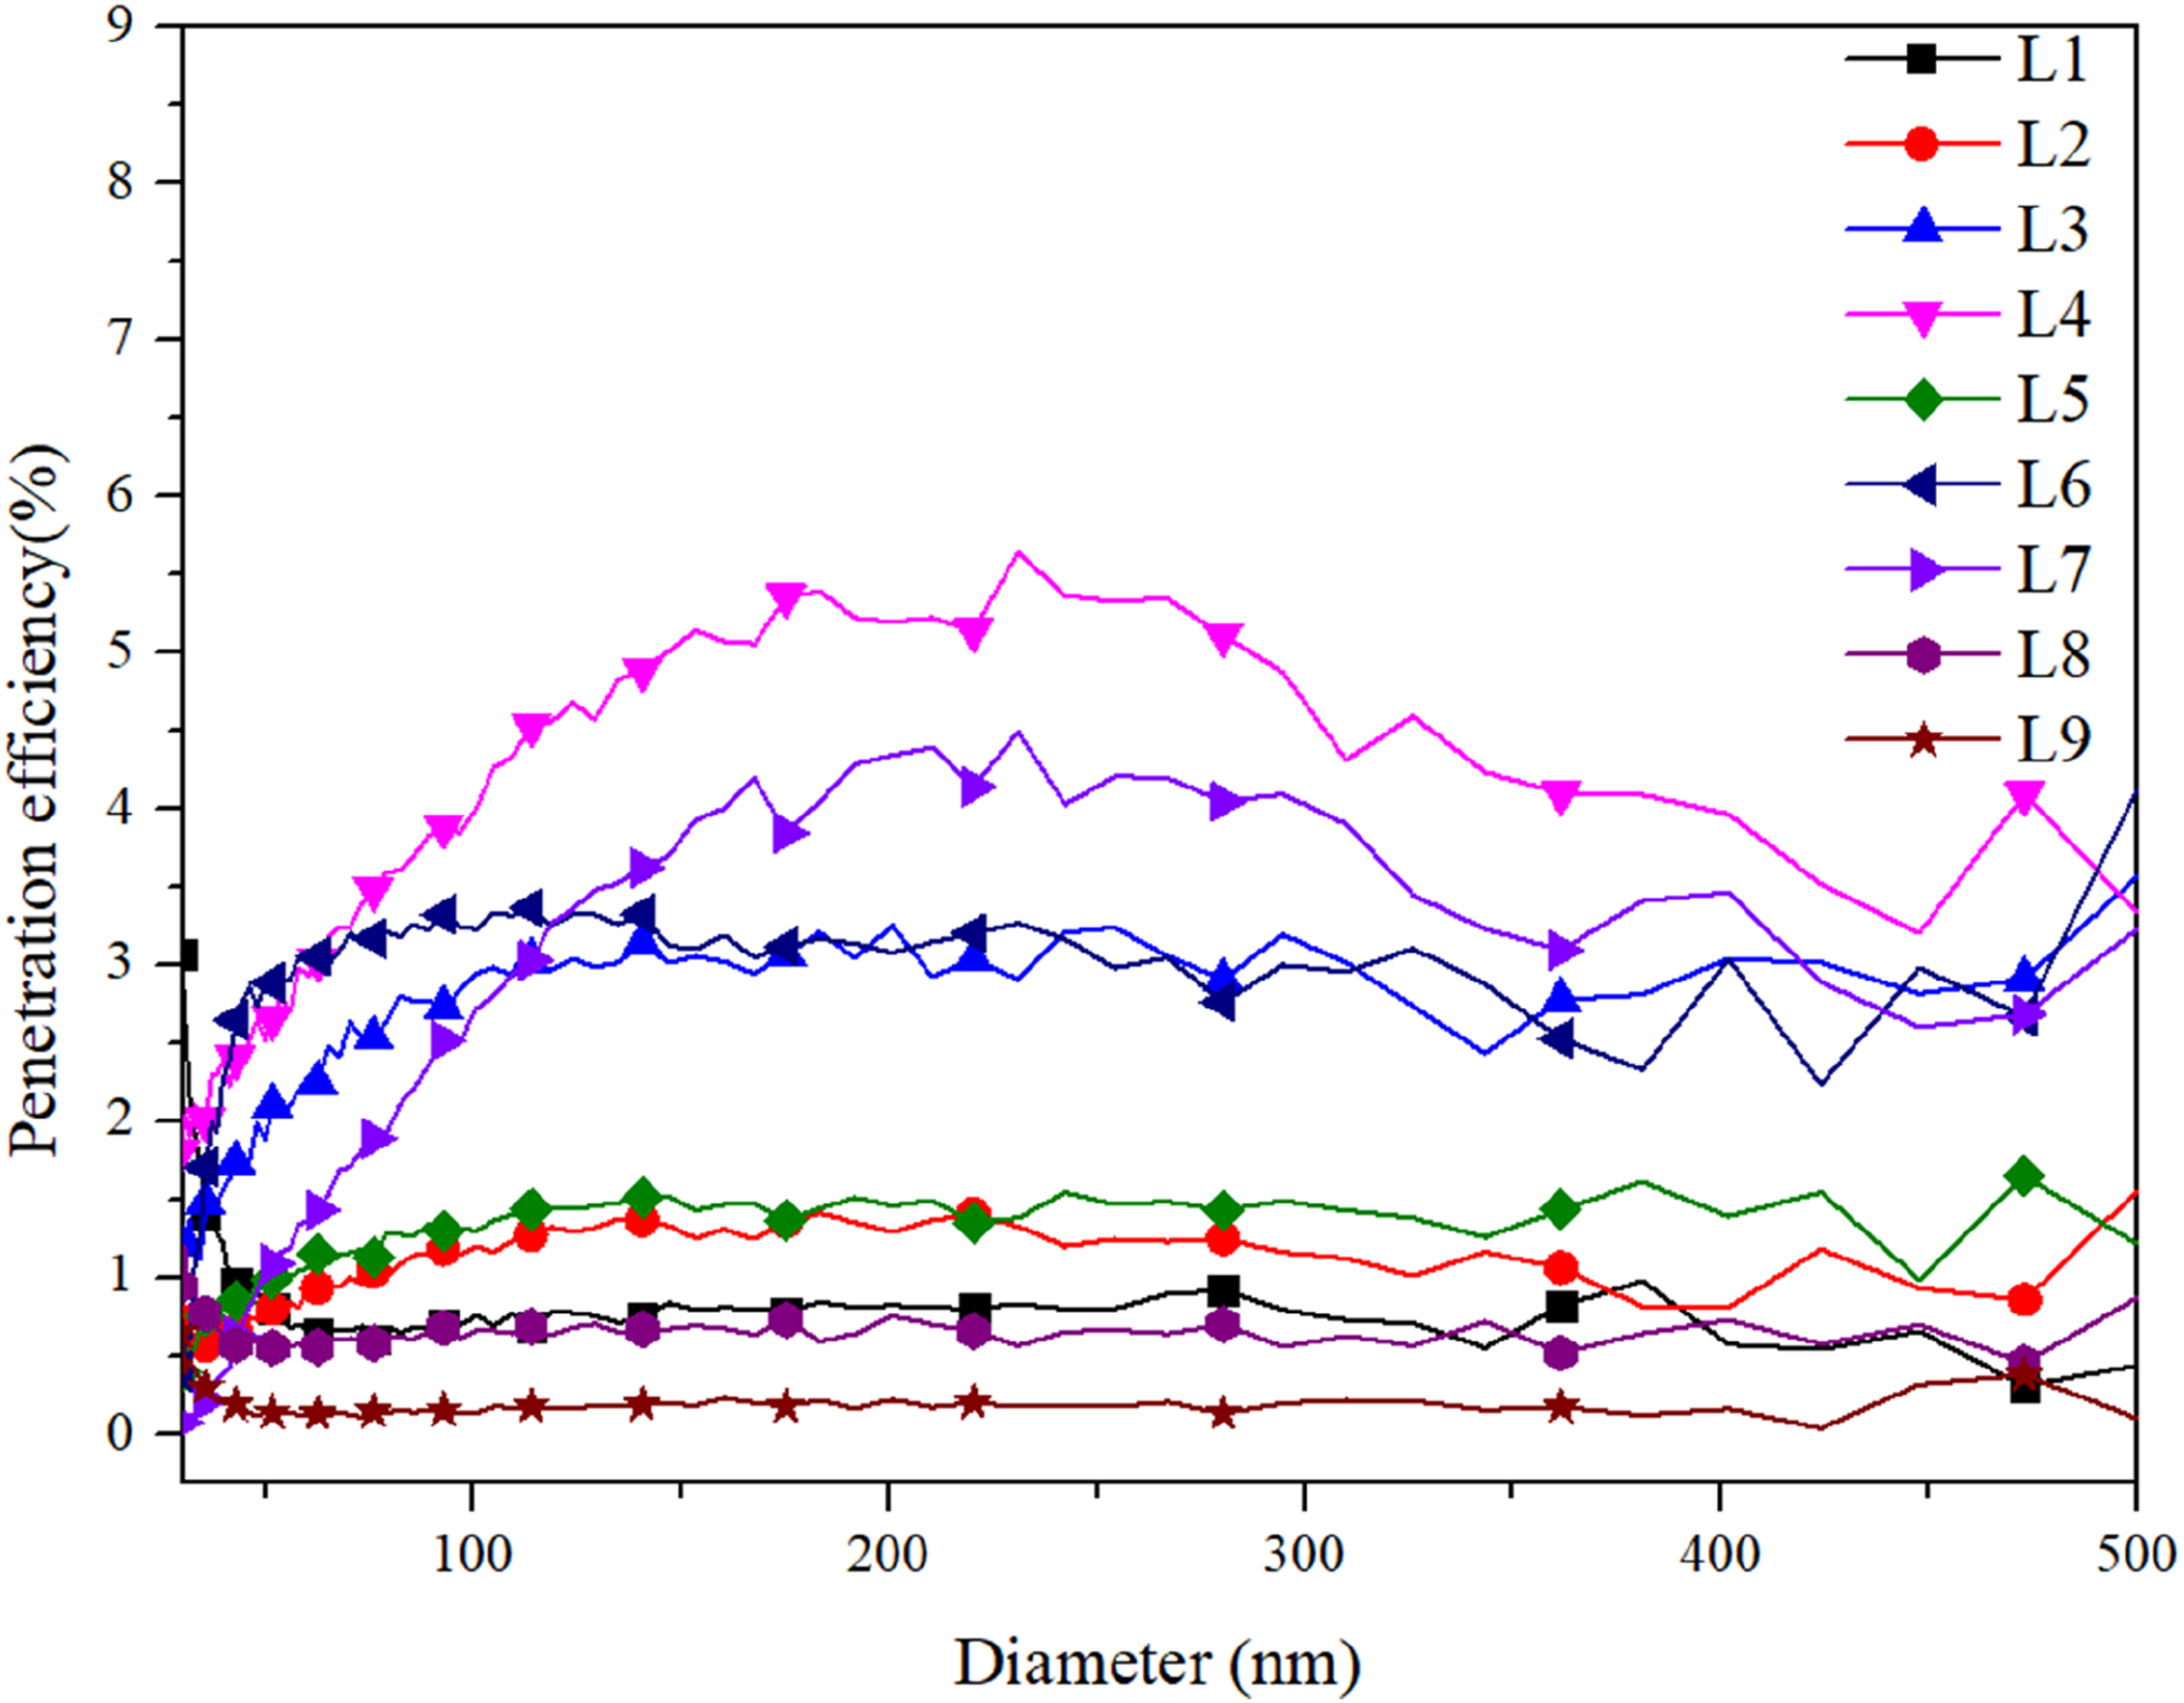
The proper parameters determination of fiber membrane on filtration quality
The proper parameter determination of collection time for filtration quality of CNP@PI/PEI membrane.

The proper parameter determination of operating voltage for filtration quality of CNP@PI/PEI membrane.

Filtration efficiency and filtration quality of CNP@PI/PEI fiber membrane at different ratios of PI/PEI.

Comparison of filtration performance at various filters.

Conclusion
This study successfully synthesized a fiber membrane (CNP@PI/PEI) derived from a MOF, which can simultaneously remove VOCs and particles. Based on the TG and DSC results, the thermal analysis indicated that the decomposition temperature and glass transition temperature of the fiber membrane were above 500°C and 236°C, respectively. The highest photocatalytic degradation reached 82% for 20 ppm acetone using CNP@PI/PEI under the operating conditions of 17 kV, a collection time of 2 h, a catalytic addition of 1 wt%, and a CNP ratio of 0.75.
The CNP@PI/PEI fiber membrane was produced using the following parameters: operating voltage (17.0 kV), collection time (2 h), catalyst addition (5 wt%), and CNP ratio (1.25). The corresponding filtration efficiency and filtration quality of the CNP@PI/PEI fiber membrane were 97.92% and 1.185 Pa−1, respectively. Although increasing the collection time to 6 h could raise the filtration efficiency to 99.90%, the filtration quality would decrease to 0.204 Pa−1 due to high-pressure loss, as filtration efficiency and filtration quality exhibit an inverse relationship.
Filtration efficiency decreased with increasing operating voltage, along with a decline in the blocking ability for different particle sizes. Accordingly, a PI/PEI mixing ratio of 2:8, with an operating voltage of 17.0 kV, 2-h collection time, 5 wt% catalyst addition, and a 1.25 CNP ratio, produced a fiber membrane with excellent thermal resistance, filtration capability, and photocatalytic activity.
Footnotes
Funding
The authors disclosed receipt of the following financial support for the research, authorship, and/or publication of this article: This research was supported in part by grant NSTC 113-2622-E-197-003 from the National Science and Technology Council, Republic of China.
Declaration of conflicting interests
The authors declared no potential conflicts of interest with respect to the research, authorship, and/or publication of this article.