
Abstract
Carbon fibre-reinforced polyethylene terephthalate-1,4-cyclohexanedimethanol ester (CF/PETG) material has found widespread applications in industries such as protective gear, lattice structures, and prosthesis manufacturing. Fused deposition modelling (FDM), a leading technology in additive manufacturing for fabricating complex geometrics, is widely employed in industrial production. However, improper selection of process parameters can result in reduced dimensional accuracy of components. Existing research primarily focuses on the dimensional accuracy of FDM-fabricated parts using conventional materials such as PLA and ABS, whereas CF/PETG composites remain relatively underexplored. This study investigates the influence of process parameters on the dimensional accuracy of CF/PETG components, with the objective of identifying optimised parameter settings to inform engineering applications. In this study, CF/PETG test specimens were fabricated using FDM technology to evaluate the effects of four critical processes, namely, parameters - nozzle temperature, heated bed temperature, layer thickness, and infill density, on dimensional accuracy. An L25 orthogonal experimental design was employed, incorporating dimensional measurements and error analysis of the test samples. Signal-to-noise ratio analysis was conducted to determine the relative influence of the primary and secondary order of the four factors' parameters in each XYZ direction, as well as to identify the optimal parameter combination of each direction. Additionally, grey relational analysis was employed to evaluate the overall dimensional accuracy, establishing the order of parameter influence as follows: heated bed temperature > infill density > layer thickness > nozzle temperature. The optimal set of process parameters was identified as a nozzle temperature of 245°C, heated bed temperature of 65°C, layer thickness of 0.16 mm, and infill density of 30%. A practical 3D printing case study involving an arm protective gear was carried out using optimised process parameters, and dimensional accuracy was assessed through reverse engineering analysis. The results validated that the optimised process parameters offer valuable reference data for enhancing the accuracy of CF/PETG components, thereby supporting practical applications in fields such as arm protective gear fabrication.
Keywords
Introduction
Fused deposition modelling (FDM) is a widely used additive manufacturing technique. 1 The process operates by heating a thermoplastic filament to its molten state within a nozzle, which then extrudes the material onto a build platform. The nozzle traces the cross-sectional geometry of the part, depositing material layer-by-layer to form the final structure.2–4 Owing to its comparatively low equipment and material costs, FDM has become one of the most extensively adopted processes. 5 FDM technology is employed across a range of fields, including aerospace, healthcare, education, and art. As manufacturing technologies continue to advance, the quality of FDM 3D-printed components has attracted considerable attention. The relationship between part-forming accuracy and factors such as material properties and processing parameters has emerged as a central focus of current research for many scholars. With the rapid development of FDM, a growing array of materials—such as PLA, ABS, PETG, TPU, and others—have been utilised in this process.6–9 In recent years, carbon fibre-reinforced polyethylene terephthalate glycol-1,4-cyclohexanedimethanol ester (CF/PETG) has emerged as a novel material for FDM applications. 10 This high-performance fibre-reinforced thermoplastic combines the advantages of PETG and carbon fibres, offering improved strength and stiffness compared to conventional materials. CF/PETG has found applications in areas such as protective gear, prosthetics manufacturing, aerospace, and lattice structures. For example, in the medical field, Steck et al. 11 utilised FDM technology with CF/PETG material to fabricate a customised ankle-foot orthosis, and Tyagi et al. 12 developed a prosthetic foot using CF/PETG, reporting superior fatigue life and damping properties. In aerospace applications, Palmer et al. 13 manufactured drone propellers using FDM printing, demonstrating that CF/PETG exhibited a 20% increase in strength compared to pure PETG, thereby highlighting the performance enhancement offered by carbon fibre reinforcement. In the context of energy-absorbing lattice structures, Sivakumar et al. 14 systematically investigated the effects of layer height and nozzle temperature on the compressive strength and dimensional accuracy of octagonal lattice CF/PETG thin-walled tubes. These findings provide a foundational basis for the application of automotive safety components.
In FDM technology, process parameters play a critical role in determining the dimensional accuracy of printed components.15,16 Owing to the variability in the physicochemical properties of materials, the influence of these parameters on part accuracy can vary significantly. 17 To date, most research in this area has focused on conventional materials, such as PLA and ABS.18,19 In contrast, studies specifically examining the impact of FDM process parameters on the dimensional accuracy of CF/PETG composite parts remain limited. Therefore, investigating the forming accuracy of CF/PETG components through the lens of process parameter optimisation is essential.
This study focused on four key process parameters that influence the dimensional accuracy of CF/PETG components. An orthogonal experiment design with four factors and five levels was employed to evaluate dimensional accuracy. Dimensional accuracy was analysed using signal-to-noise ratio (SNR) analysis and grey relational comprehensive analysis to identify the optimal combination of parameters. Finally, 3D printing of CF/PETG parts was conducted using the optimised parameters, and dimensional accuracy was assessed to validate the effectiveness of the refined process parameters.
Experimental procedure
Materials and sample preparation
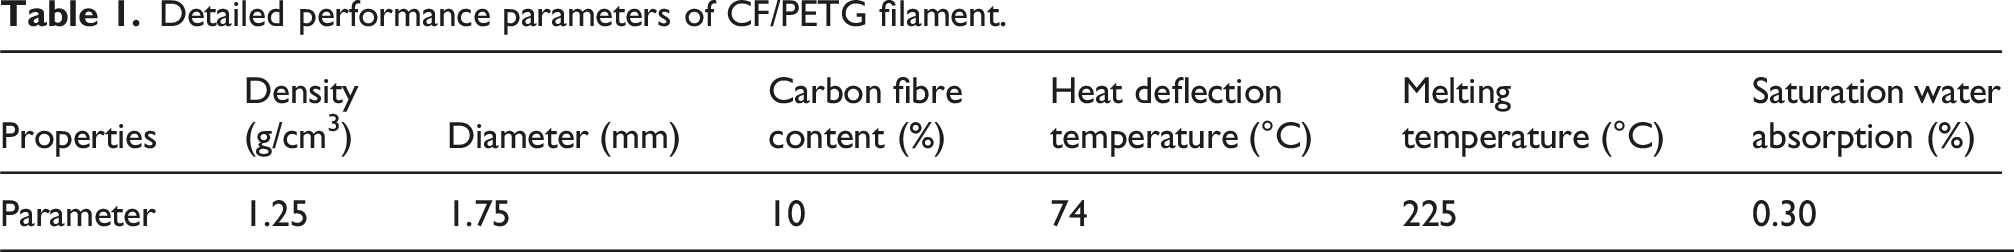
The raw material utilised in this study was CF/PETG filament (Bambu Lab Co., Ltd, Shenzhen, China). The microstructure of the filament’s cross-section was examined using scanning electron microscopy (SEM; Sigma 360, Zeiss, German), as shown in Figure 1. The image reveals that short fibres are uniformly dispersed throughout the polymer of the matrix. The detailed performance characteristics of the filament are presented in Table 1. SEM image of the cross-section of CF/PETG filament. Detailed performance parameters of CF/PETG filament.
Based on sample geometries and dimensional ranges in prior studies,20–23 a cuboid configuration with dimensions of 40 mm × 30 mm × 10 mm was selected as the test specimen. Figure 2 presents the sample used for dimensional accuracy evaluation. The cuboid sample model was assigned using the 3D software SolidWorks 2023, as illustrated in Figure 2(a). The model was then exported as an STL file and imported into a Bambu Lab P1S FDM 3D printer (Bambu Lab, Shenzhen, China) for fabrication via layer-by-layer deposition, yielding the sample shown in Figure 2(b). Sample used for dimensional accuracy measurement: (a) size of the sample and (b) sample prepared by FDM.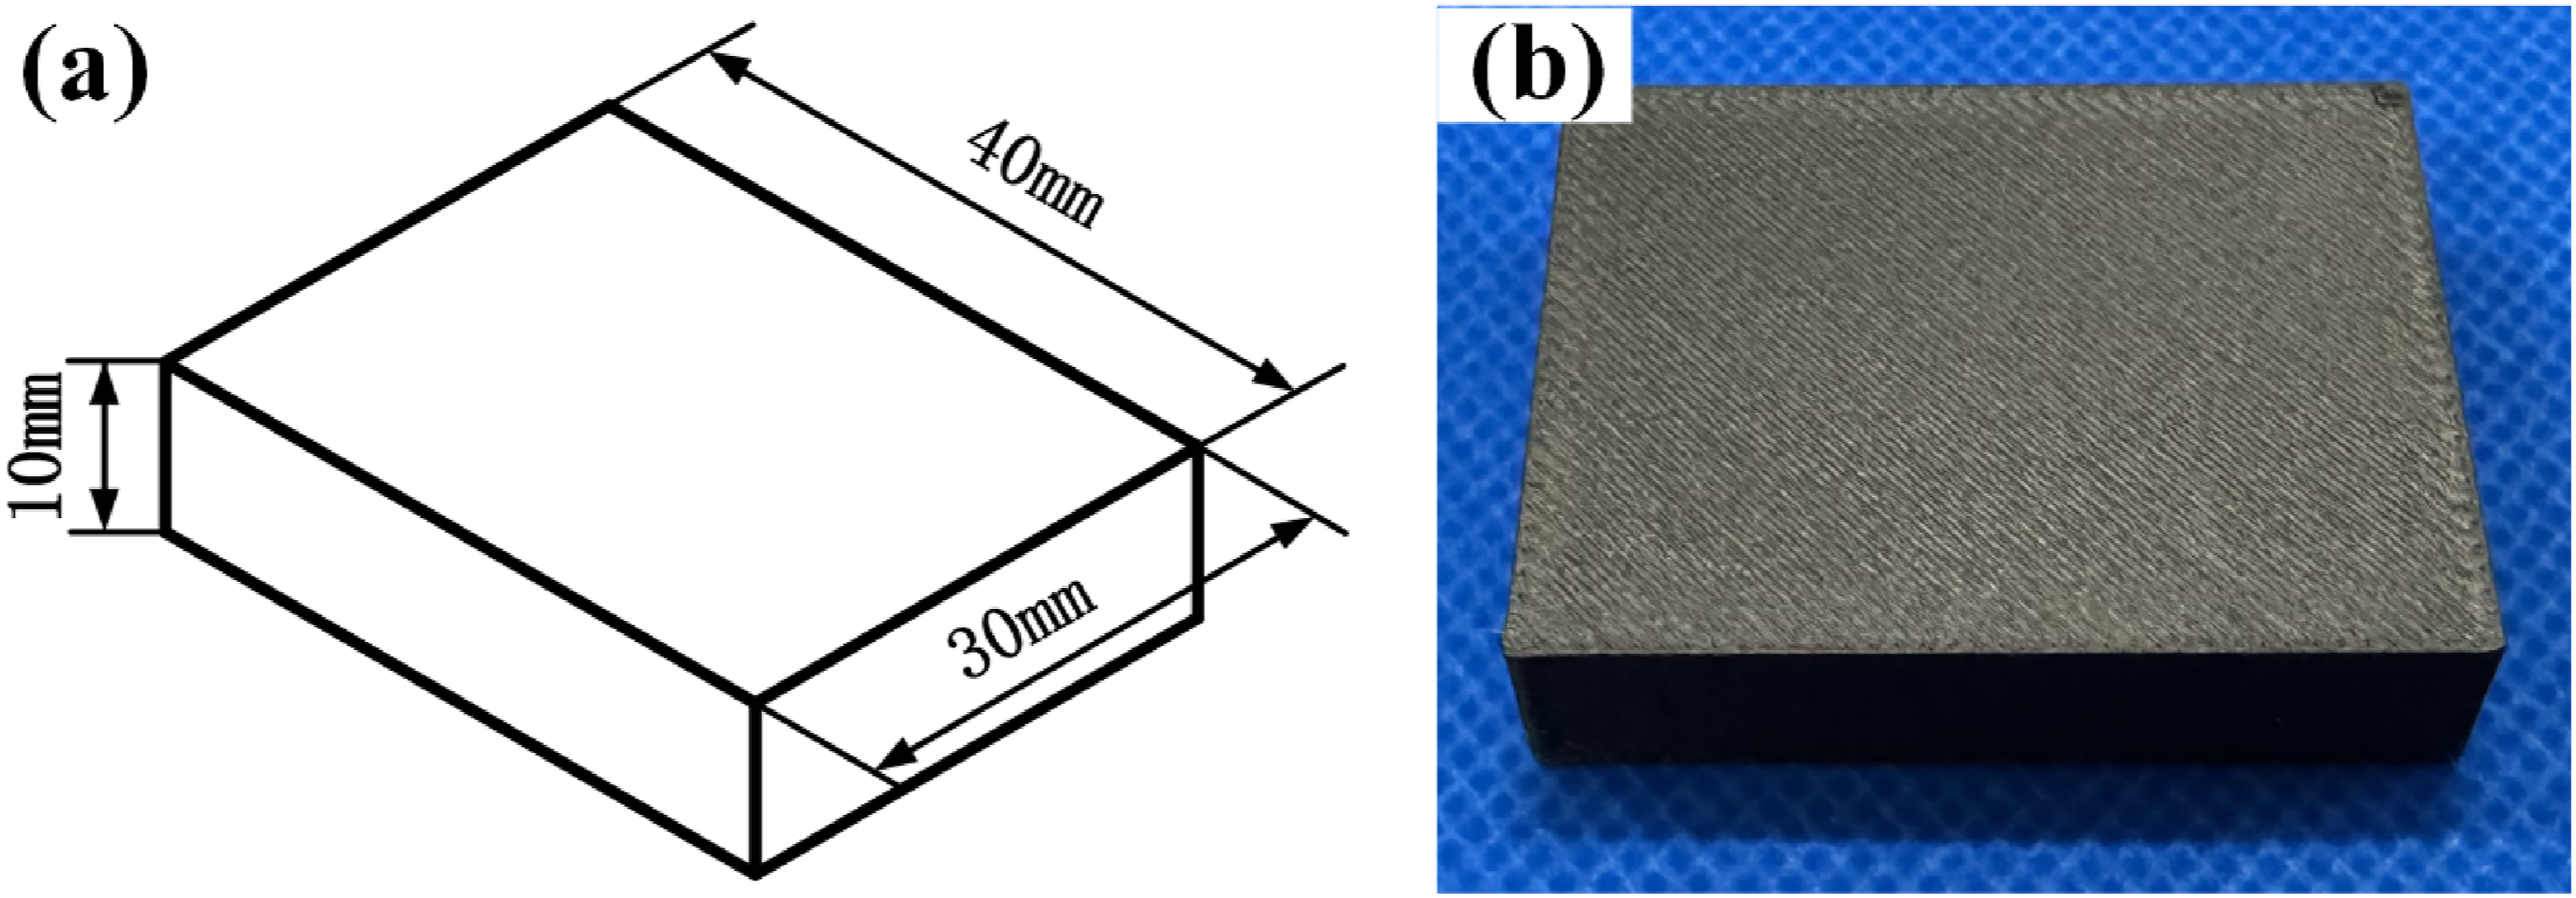
The appearance of the 3D printer is shown in Figure 3, and its key technical specifications are provided in Table 2. Bambu Lab P1S 3D printer. Main parameters of the Bambu Lab P1S 3D printer.

Design of experiments
Setting range of printing parameters for CF/PETG filament.

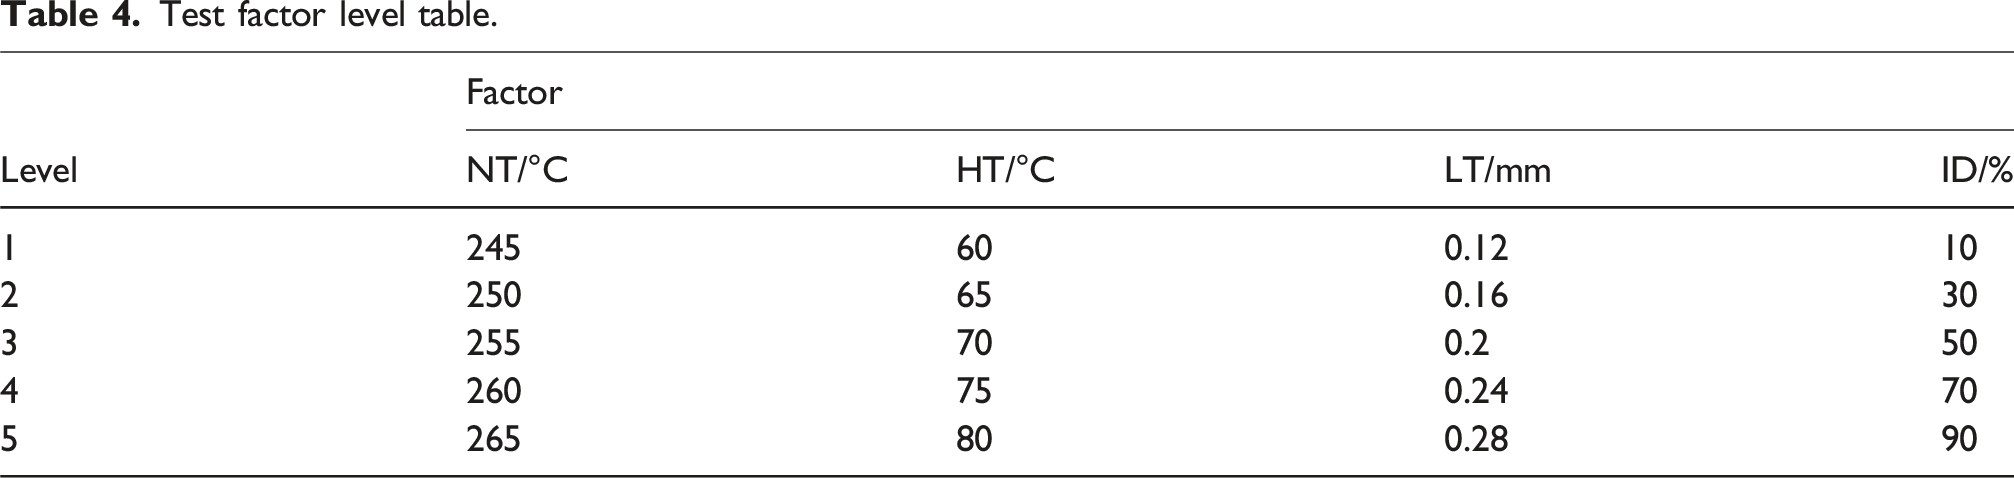
Test factor level table.
Orthogonal test result.

Dimensional error testing
The dimensional accuracy of the sample shown in Figure 2 was assessed by evaluating dimensional errors, with smaller errors indicating higher dimensional accuracy. A digital vernier calliper (K101301, Chengliang Tools Group Co., Ltd, Chengdu, China) were used to measure dimensions along the X-, Y-, and Z-directions. The calliper has a measuring range of 0-100 mm, resolution of 0.01 mm, and precision ±0.02 mm. For each test group, three samples were fabricated, and four measurements were taken along each orthogonal direction of every sample. The average of these measurements was then calculated. The procedure for performing four measurements along a single direction is illustrated in Figure 4. Process of four measurements in a single direction.
The absolute difference between the average measured value and the corresponding theoretical value was calculated, followed by the calculation of the relative error. This relative error quantifies the dimensional derivation in each of the three directions, as shown in equation (1).
Example part printing and dimensional analysis
After identifying the optimised process parameters that influence sample accuracy, these parameters were applied to fabricate a functional CF/PETG plastic component (an arm protective gear). Point cloud data of the plastic part were acquired using a hand-held optical scanner (KSCAN-Magic, SCANTECH Co., Ltd, Hangzhou, China). Subsequently, reverse accuracy analysis was conducted to evaluate the dimensional accuracy of the plastic parts, with the objective of validating the effectiveness of the optimised FDM process parameters in the fabrication of CF/PETG plastic parts.
Results and discussion
Orthogonal experimental results
The relative dimensional error rates in the X, Y, and Z direction, denoted as %ΔX, %ΔY, and %ΔZ, respectively, are summarised in Table 5. In the X-direction, the highest relative error rate was observed in Group 5 (0.617%), whereas the lowest occurred in Group 2 (0.300%). For the Y-direction, Group 19 exhibited the maximum relative error rate (0.828%), whereas Group 12 showed the minimum (0.328%). In the Z-direction, the highest relative error was recorded in Group 10 (0.912%) and the lowest in Group 2 (0.042%).
SNR ratio analysis
In experimental designs such as orthogonal experiments, SNR analysis is employed to assess the influence of experimental factors on target outcomes. By calculating the SNR, the relationship between signal and noise under different factor-level combinations can be analysed. This approach enhances the stability and reliability of the experimental results, reducing the impact of random errors and facilitating the identification of underlying patterns in factor-level effects.27,28 In this study, the SNRs corresponding to the relative dimensional error rates in the X-, Y-, and Z-directions were calculated for all 25 experimental groups in the orthogonal design. The SNR values for each group are presented in Table 5. Based on the SNR data in Table 5, main effect plots for the X-, Y-, and Z-directions were generated, as illustrated in Figures 5–7. (1) X-direction Main effect plot for signal-to-noise ratio in the X-direction. Main effect plot for signal-to-noise ratio in the Y-direction. Main effect plot for signal-to-noise ratio in the Z-direction.


The relative influence of the four factors on dimensional accuracy was determined to follow the order: heated bed temperature (HT) > infill density (ID) > layer thickness (LT) > nozzle temperature (NT). The optimal parameter combination identified was NT3-HT2-LT1-ID2, corresponding to a nozzle temperature of 255°C, heated bed temperature of 65°C, layer thickness of 0.12 mm, and infill density of 30%. (2) Y-direction
The influence of process parameters was ranked as follows: infill density (ID) > heated bed temperature (HT) > layer thickness (LT) > nozzle temperature (NT). The optimal parameter combination identified was NT1-HT2-LT1-ID1, corresponding to a nozzle temperature of 245°C, heated bed temperature of 65°C, layer thickness of 0.12 mm, and infill density of 10%. (3) Z-direction
The order of influence was determined to be layer thickness (LT) > nozzle temperature (NT) > heated bed temperature (HT) > infill density (ID). The optimal parameter combination was NT1-HT3-LT2-ID5, corresponding to a nozzle temperature of 245°C, heated bed temperature of 70°C, layer thickness of 0.16 mm, and infill density of 90%.
Notably, the SNR analysis across three directions, heated bed temperature and infill density exhibited a particularly significant influence on dimension accuracy in the X- and Y-directions. This can be attributed to thermal expansion and contraction effects that occur during the post-print cooling phase at room temperature. In contrast, the impact on the Z-direction was relatively small. This can be attributed to the use of a conventional grid structure, which promotes strong interlayer bonding of the filament. As a result, dimensional shrinkage along the Z-direction during the cooling phase was minimal.
Layer thickness has a pronounced effect on the Z-direction owing to the layer-by-layer deposition principle of FDM technology. Variations in layer thickness can lead to inconsistencies in material extrusion and temperature distribution, resulting in weak interlayer adhesion. These imperfections accumulate progressively with successive layers, ultimately exerting a significant impact on dimensional accuracy along the Z-direction.
Additionally, the SNR analysis for the Z-direction indicates that improved dimensional accuracy is achieved when the nozzle temperature is set as 245°C. This improvement is attributed to reduced thermal shrinkage of the filament during cooling at lower nozzle temperatures, which partially compensates for dimensional deviations. When the nozzle temperature reaches 255–260°C, the Z-direction accuracy improves again. This is attributed to the enhanced interlayer bonding quality achieved through sufficient melting of the CF/PETG filament as the nozzle temperature increases, thereby improving the Z-direction accuracy. However, when the nozzle temperature increases to the range of 260–265°C, further temperature elevation may induce the carbonisation phenomenon of the CF/PETG filament during the melting process. This will deteriorate the interlayer bonding quality, ultimately leading to a decline in dimensional accuracy along the Z-direction.
Grey relational comprehensive analysis
This study aims to investigate and evaluate the overall dimensional accuracy of CF/PETG parts by comprehensively considering dimensional errors in the X-, Y-, and Z-directions. Grey relational analysis is a multivariate statistical method used to identify the relationships among multiple performance characteristics with limited information. Unlike traditional statistical approaches, grey relational analysis does not require assumptions about data distribution or extensive hypothesis testing. It effectively utilises available information, minimises subjective assumptions regarding data behaviour and hypotheses, and offers greater objectivity and intuitiveness. Consequently, it has been widely applied in experimental studies aimed at optimising multiple performance indicators.29,30 In this study, grey relational analysis is introduced to assess and interpret the overall dimensional accuracy of CF/PETG parts. The computational procedure is outlined as follows:
Dimensionless processing
Dimensionless processing, also referred to as grey generation, involves the experimental data by defining reference and comparative sequences. This step ensures that all indicators share the same dimension or magnitudes. In the context of this study, grey relational analysis is applied to the SNR values associated with the dimensional accuracy of CF/PETG parts, where higher SNR values indicate better performance. Therefore, dimensionless processing is performed using the ‘larger-the-better’ formula, as presented in equation (2).
Grey relational coefficient
The normalised indicator values obtained through grey generation are scaled within the range of 0 and 1. A reference sequence is defined with all elements equal to 1, forming the reference sequence set 
Grey relational degree
After calculating the grey relational coefficients, the grey relational degree Γ is computed using equation (4).
Grey relational analysis results.

Grey relational analysis
A higher grey relational degree indicates a closer approximation to the optimal performance state. According to the calculated grey relational degrees presented in Table 6, the second experimental group exhibited the highest grey relational degree Γ 0.910, suggesting that this set of process parameters yielded the best comprehensive dimensional accuracy among the 25 orthogonal experimental groups. In contrast, the fifth experimental group yielded the lowest grey relational degree Γ value of 0.399, reflecting the poorest overall dimensional accuracy.
Grey relational range analysis results.
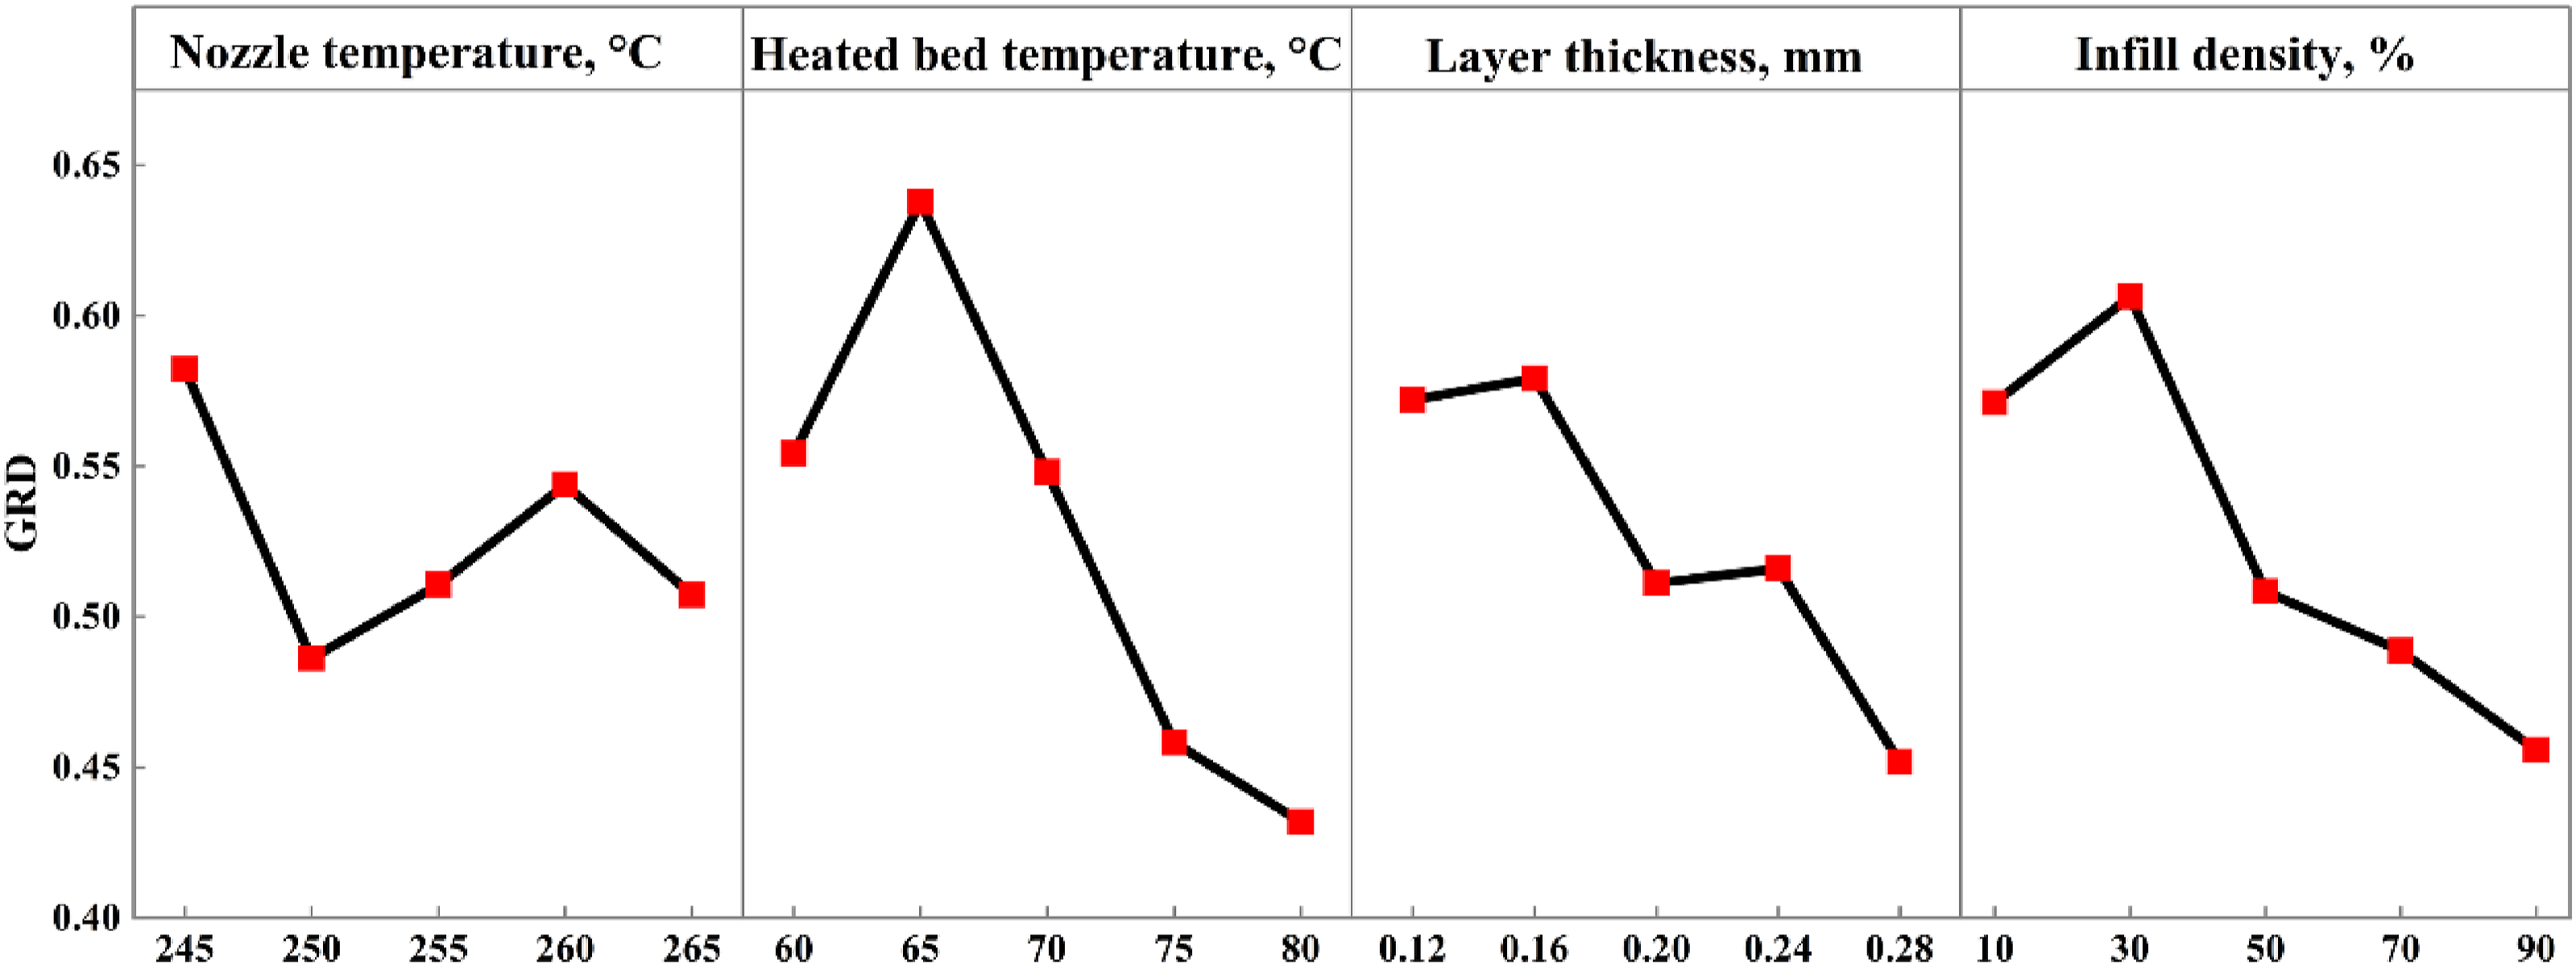
Range analysis plot of grey correlation degree.
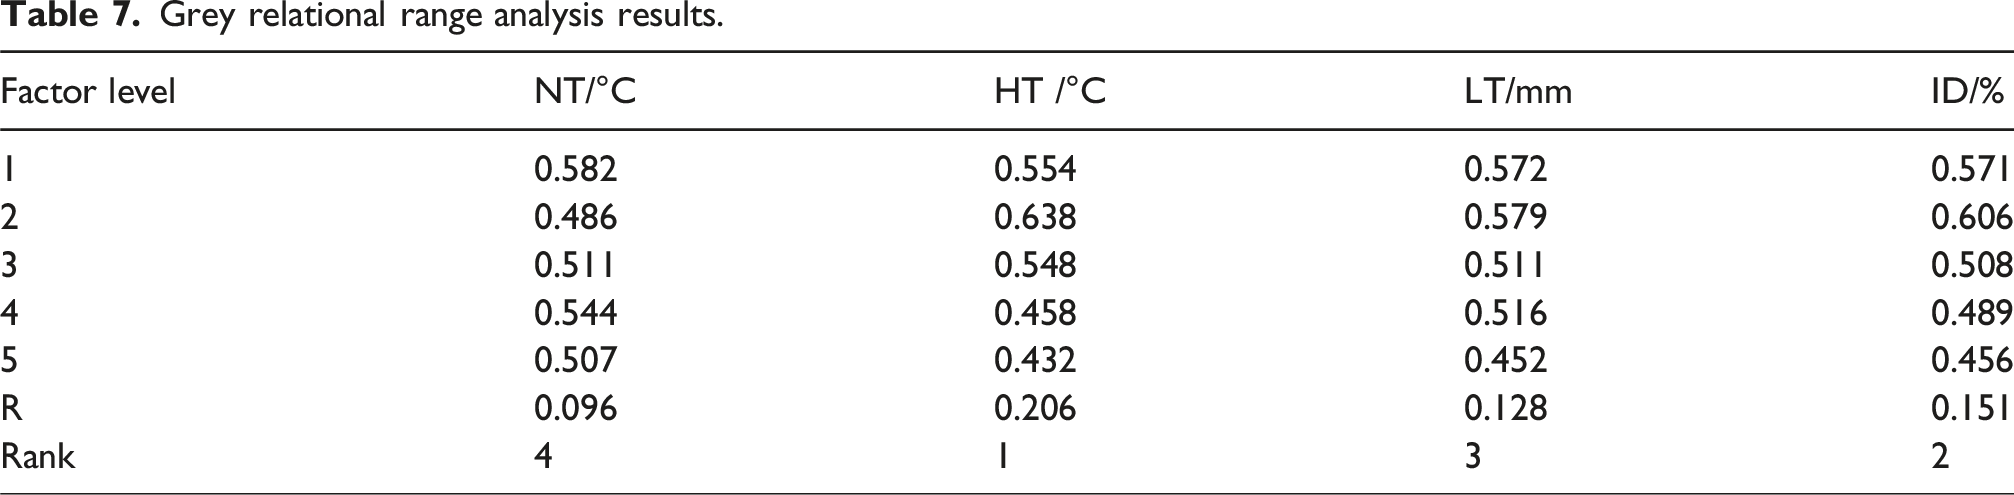
Based on the range analysis of the grey relational degree, the relative influence of the four factors on the dimensional accuracy of CF/PETG parts can be ranked as follows: heated bed temperature (HT) > infill density (ID) > layer thickness (LT) > nozzle temperature (NT). As shown in Figure 8, the grey relational degree of dimensional accuracy exhibits a decreasing trend in the nozzle temperature range of 245–250°C, followed by an increasing trend from 250–260°C and a subsequent decline at 260–265°C. Compared to the other three factors, the range variation for nozzle temperature was relatively small, although it exhibited overall fluctuations. This behaviour may be attributed to interaction effects between nozzle temperature and other parameters.
As the heated bed temperature increased from 60 to 65°C, the grey relational degree also increased. The lower dimensional accuracy observed at 60°C was attributed to warping at the base of the part during printing owing to insufficient bed temperature. However, a declining trend was noted as the temperature increased from 65 to 80°C. This is owing to thermal contraction during cooling under ambient conditions. Elevated bed temperatures intensified the temperature gradient between the part and the surroundings, thereby increasing shrinkage and reducing dimensional accuracy.
It is worth emphasizing that the heated bed temperature has the greatest impact on dimensional accuracy, primarily because it directly influences the structural stability of the part during printing and its shrinkage deformation during cooling. Both excessively low and excessively high heated bed temperatures can lead to significant deformation of the part. Firstly, the heated bed serves as the foundation for 3D printing. The adhesion of the first layer and the resulting deformation affect the stability of the entire structure. If the heated bed temperature is too low, the temperature difference between the bottom layer of the part and the heated bed becomes significant, generating substantial internal stress. This causes the corners at the bottom of the part to lift upward, resulting in warping deformation and consequently affecting the dimensional accuracy of the part. Secondly, when the heated bed temperature is too high, the temperature of the part differs significantly from the ambient room temperature. After the part is completed, it undergoes considerable cooling and shrinkage during the cooling process in room temperature conditions. This leads to a deviation between the actual dimensions of the part and those of the design model.
In the layer thickness range of 0.12–0.16 mm, the grey relational degree exhibited a slight increase, indicating an improvement in dimensional accuracy. This enhancement is closely associated with the extrusion behaviour of the filament during deposition, as illustrated in Figure 9. At a layer thickness of 0.12 mm (Figure 9(a)), excessive flattening and overlapping of extruded filaments led to rough upper surfaces and reduced dimensional accuracy. At 0.16 mm (Figure 9(b)), more optimal extrusion with minimal overlapping was achieved, resulting in smoother surfaces and improved dimensional accuracy. However, as the layer thickness increased from 0.16 mm to 0.28 mm, the grey relational degree exhibited a downward trend, reflecting a decline in dimensional accuracy. This phenomenon can be attributed to the reduction in extrusion pressure as layer thickness increases, which is accompanied by prolonged cooling times for the newly deposited layers. The resulting temperature gradient between the lower and upper regions of the deposited material leads to uneven material shrinkage, thereby increasing the warpage deformation and reducing printing precision. SEM image of the top surface of CF/PETG parts. Layer thickness of the part: (a) 0.12 mm and (b) 0.16 mm.
Similarly, the grey relational grade demonstrated a trend of initial increase followed by a decrease with increasing infill density. Low infill densities weaken structural support and can result in surface irregularities and compromised dimensional accuracy. Conversely, an excessively high infill density leads to greater internal heat retention, which promotes thermal contraction during post-printing cooling.
The grey relational grade demonstrated an initial increasing trend followed by a decline as infill density increased. This effect arises from the dual influence of infill density on structural support capacity, uneven printing surfaces, and reduced overall dimensional accuracy. In contrast, excessively high infill density results in greater internal heat retention within the printed part, which can exacerbate thermal contraction during post-printing cooling.
As indicated by the grey relational degree range analysis (Figure 8), the optimal combination of parameters for dimensional accuracy in CF/PETG parts was identified as NT1-HT2-LT2-ID2, corresponding to a nozzle temperature of 245°C, heated bed temperature of 65°C, layer thickness of 0.16 mm, and infill density of 30%.
It should be noted that current research hotspots in FDM process optimization involve comparative studies on multiple materials and multi-objective optimization targeting key performance characteristics of printed parts. For instance, Mohamad 31 investigated the influence of milling process parameters on the surface roughness and burr height of FDM parts using PLA, PETG, and CF/PETG materials to enhance their machinability. However, this study primarily focuses on the process parameters of a single CF/PETG material. The optimized combination of process parameters obtained is not applicable to other materials. Nevertheless, the research methodology employed—orthogonal experimental design combined with signal-to-noise ratio analysis and grey relational analysis—also exhibits good applicability for optimizing dimensional accuracy in other materials. Furthermore, this research concentrates on optimizing process parameters for the overall dimensional accuracy of FDM parts. In FDM printing, part forming accuracy encompasses not only dimensional accuracy but also surface roughness. 32 Future studies could incorporate surface roughness evaluation metrics to achieve multi-objective optimization of forming accuracy. However, the effects of process parameters on dimensional accuracy and surface roughness may differ, potentially leading to distinct optimal parameter sets. The use of comprehensive evaluation methods from mathematical statistics can facilitate multi-objective optimization, enabling the development of more holistic FDM printing processes that comprehensively improve part forming accuracy.
FDM printing and accuracy analysis results of the arm protective gear
Fabrication of the arm protective gear based on FDM
CF/PETG materials are widely utilised in fields such as medical rehabilitation, aerospace, and automotive, owing to their outstanding performance characteristics.33–35 To verify the feasibility of the optimised process parameters identified in this study, an arm protective gear was fabricated using the CF/PETG material, utilising the optimised parameters. The dimensional accuracy of the protective gear was evaluated to assess the effectiveness of the proposed parameter combination.
Figure 10 presents the 3D design model of the arm protective gear. The overall dimensions of the outer protective gear were 249.247 mm × 72.279 mm × 17.653 mm, whereas those of the inner protective gear were 251.164 mm × 78.247 mm × 16.590 mm. The thickness of both outer and inner protective gear was 3 mm. Design model of the arm protective gear: (a) outer arm protective gear and (b) inner arm protective gear.
The arm protective gear was fabricated using the CF/PETG material via 3D printing, utilising the optimised process parameters: nozzle temperature of 245°C, heated bed temperature of 65°C, layer thickness of 0.16 mm, and infill density of 30%. The physical printed object of the protective gear is shown in Figure 11. Physical object of the 3D-printed CF/PETG arm protective gear: (a) outer arm protective gear and (b) inner arm protective gear.
Accuracy evaluation of the arm protective gear
In the study of dimensional accuracy in the 3D printing field, to obtain universally applicable optimized processes, researchers typically apply the optimized process parameters derived from cuboid samples to the manufacturing of actual complex structural workpieces.36,37 These optimized parameters can effectively control the accuracy of printed workpieces, with minimal errors in indicators such as surface topology, curvature, and wall thickness. However, the specific error values cannot be directly reflected through experimental studies on cuboid samples alone. For the actual error values of each specific complex structural workpiece, additional advanced measurement methods—such as optical measurement, CT scanning, reverse accuracy analysis, and wall thickness measurement—can be introduced to evaluate and determine them. This research methodology has been widely adopted in the study of dimensional accuracy for 3D-printed cranial implants and ceramic molds used in aviation turbine blades.36,37
Reverse accuracy evaluation is widely employed in industrial production for the precision measurement of industrial products, particularly in the inspection of complex geometrics.36–38 Compared to traditional measurement techniques, it offers advantages in terms of higher accuracy and greater efficiency. This method involves the use of high-efficiency 3D scanning devices to capture the complete three-dimensional information of manufactured parts. By comparing the acquired scan data with the CAD model, the dimensional deviation of the manufactured component can be accurately assessed. The KSCAN Magic hand-held optical scanner was employed to perform optical scanning on the inner surface of the protective gear, which interfaces directly with the human arm. This process generated a digital model of the inner surface. The resulting STL file of the protective gear was imported into the 3D inspection software Geomagic Control X. By comparing the scanned digital model of the inner gear surface with the STL reference data, a detailed error analysis of the 3D-printed protective gear was conducted. The results are illustrated in Figure 12. According to the 3D error cloud map, the maximum positive/negative deviations of the outer arm protective gear were +0.766 mm/-0.799 mm, respectively, with average deviations of +0.216 mm/-0.149 mm. For the inner arm protective gear, the maximum deviations were +0.511 mm/-0.639 mm, with corresponding average deviations of +0.150 mm/-0.075 mm. Regarding the error distribution graph, 84.22% of the deviations for the outer protective gear fell within −0.300 mm to +0.500 mm, whereas 99.54% of deviations for the inner protective gear were within −0.200 mm and +0.400 mm. Accuracy analysis results of the arm protective gear fabricated with optimised process parameters: (a) 3D error cloud map of inner arm protective gear; (b) 3D error cloud map of outer arm protective gear; (c) error distribution graph inner arm protective gear; (d) error distribution graph of outer arm protective gear.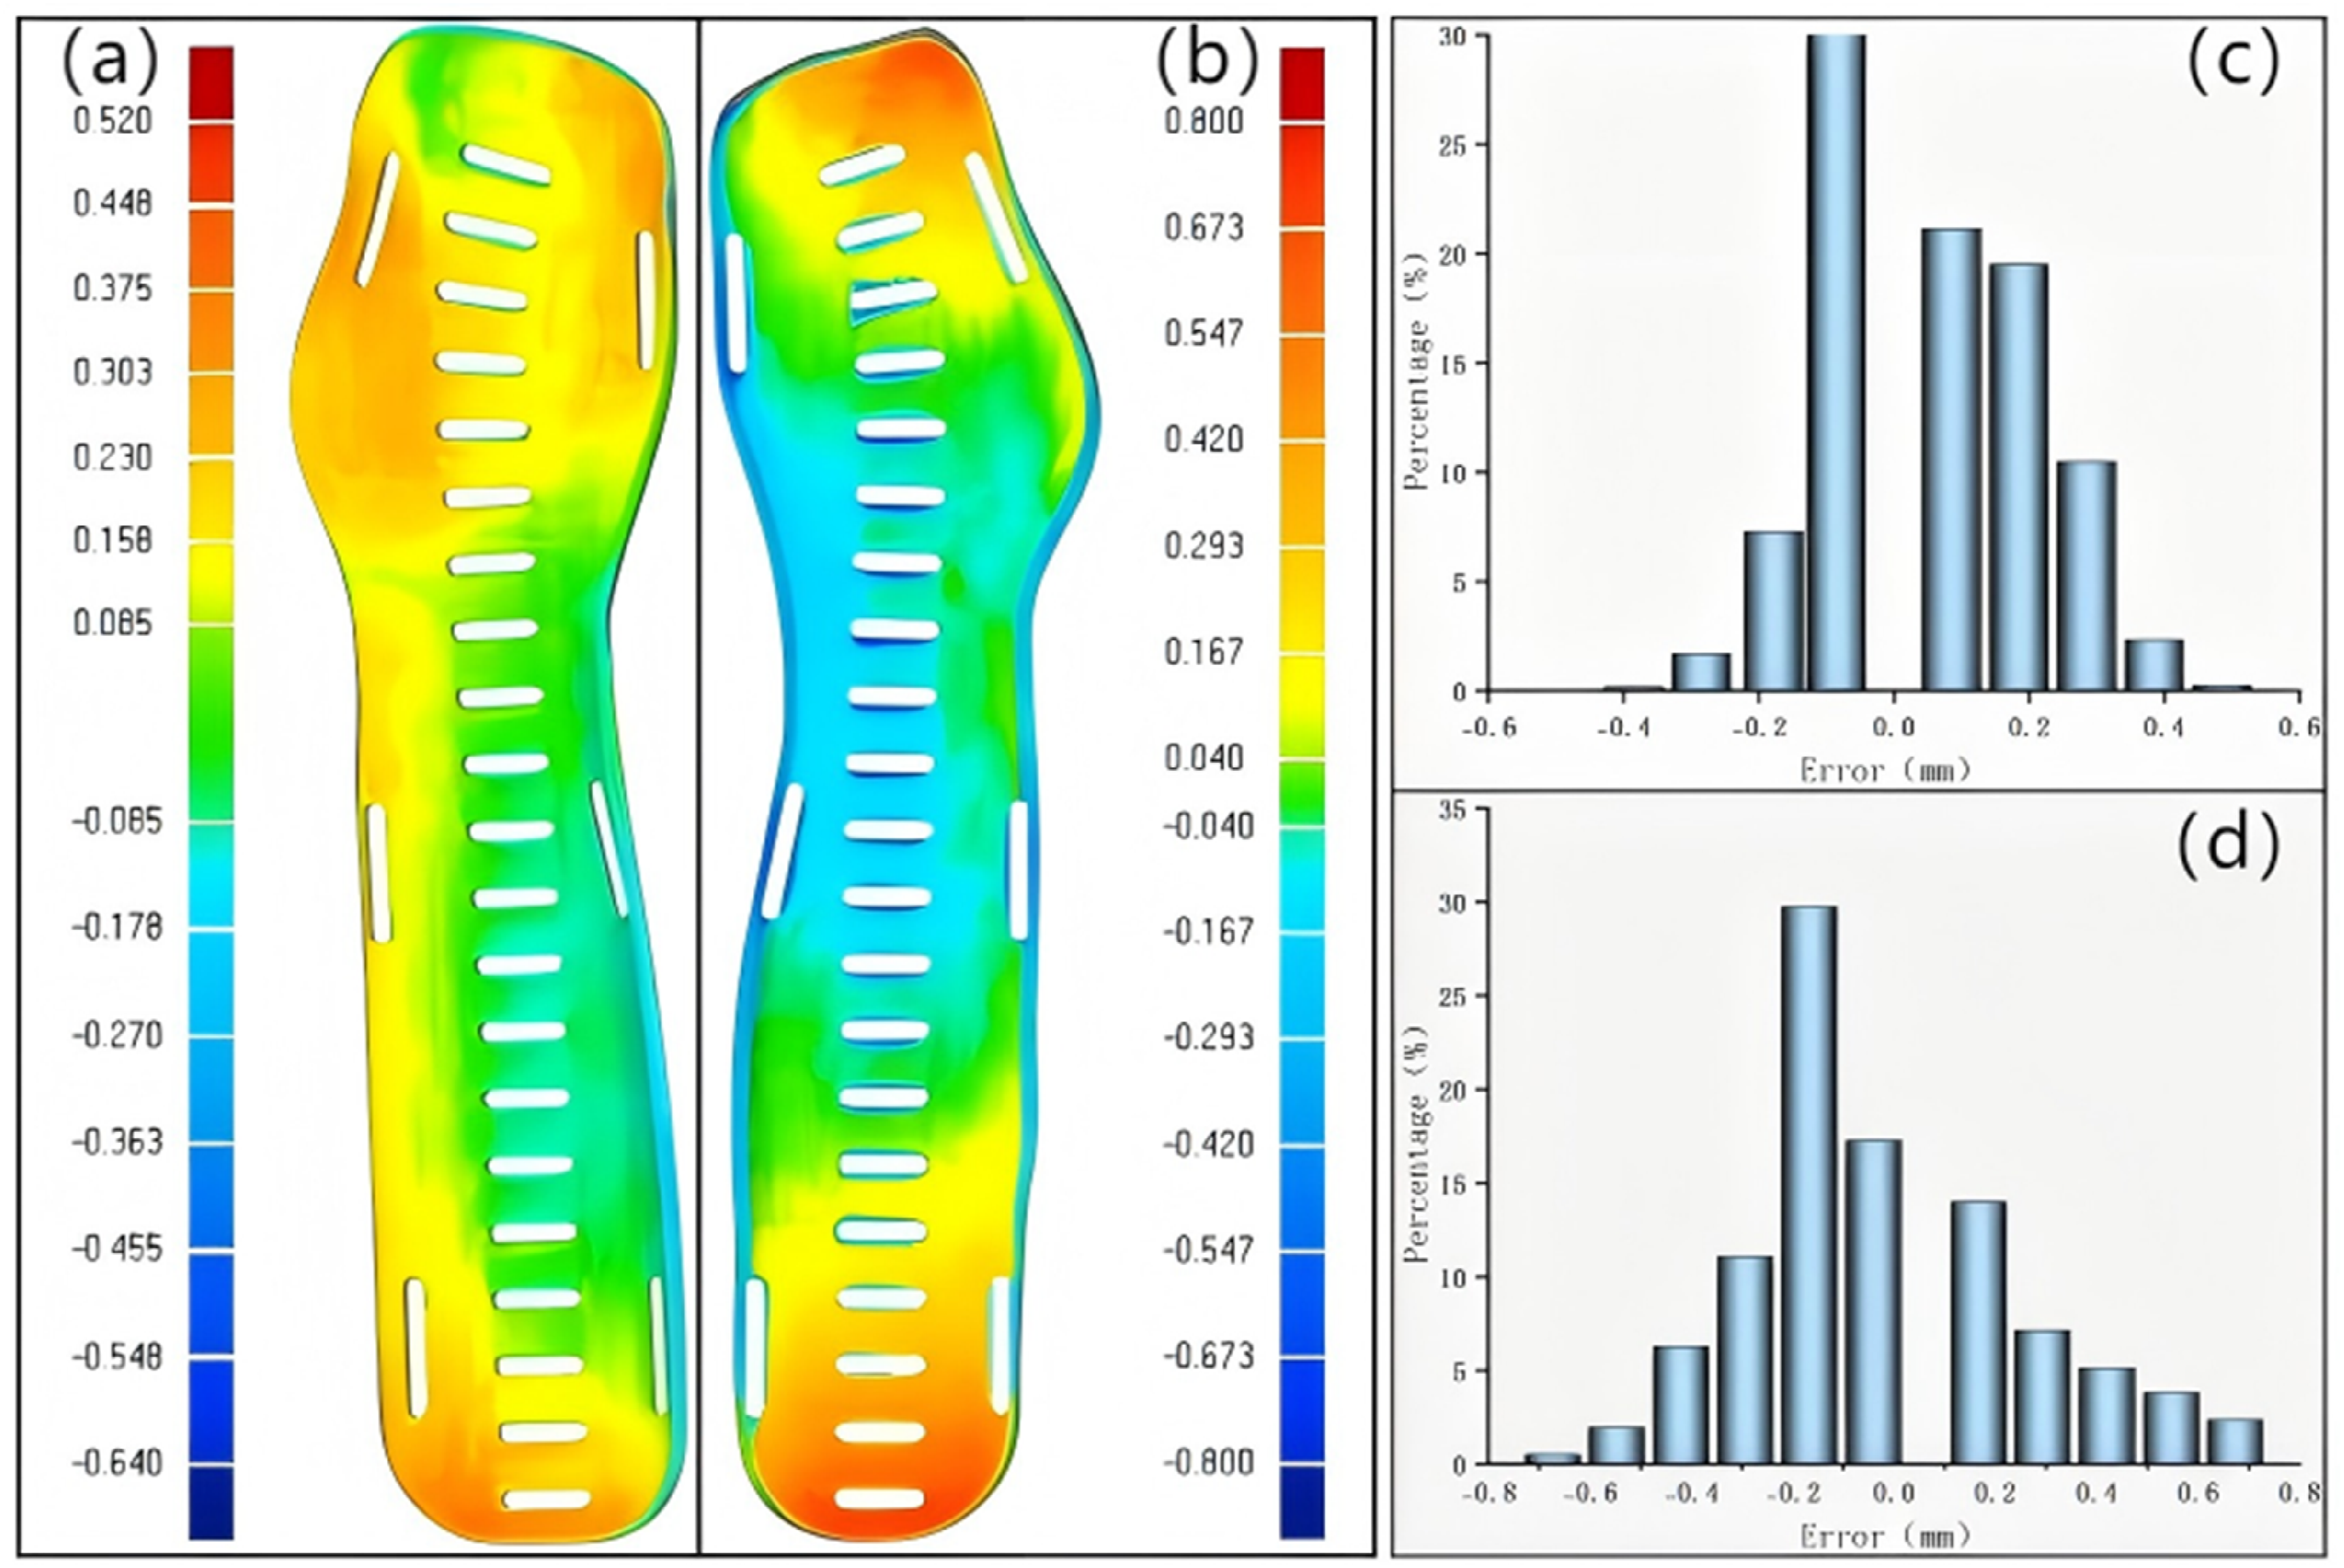
Additionally, another arm protective gear was fabricated using the 18th set of process parameters from the orthogonal experiment in Table 5 as a control group. The parameter values were: nozzle temperature of 260°C, heated bed temperature of 70°C, layer thickness of 0.12 mm, and infill density of 70%. Accuracy analysis of this protective gear is shown in Figure 13. The results indicate that the maximum positive/negative deviations of the outer arm protective gear were +0.845 mm/−0.830 mm, with average deviations of +0.224 mm/−0.202 mm. For the inner protective gear, the maximum positive/negative deviations were +0.974 mm/−0.994 mm, corresponding to average deviations of +0.159 mm/−0.131 mm. Furthermore, 97.42% of the deviations for the outer protective gear fell within −0.600 mm to +0.750 mm, while 98.50% of deviations for the inner protective gear were concentrated between −0.500 mm and +0.500 mm. Accuracy analysis results of the arm protective gear for the control group: (a) 3D error cloud map of inner arm protective gear; (b) 3D error cloud map of outer arm protective gear; (c) error distribution graph inner arm protective gear; (d) error distribution graph of outer arm protective gear.
A comparison between Figures 12 and 13 reveals that the arm protective gear fabricated using optimised process parameters exhibited lower deviation values than the control group, with a tighter distribution of deviations. These results indicate a high overall dimensional accuracy of the fabricated protective gear using optimised parameters. Therefore, the optimised process parameter combination developed in this study offers valuable reference data for enhancing the forming accuracy of CF/PETG plastic components.
Conclusions
This study investigated the dimensional accuracy of CF/PETG components fabricated using the FDM technology. By conducting orthogonal experiments and employing statistical analysis methods, the effects of four key process parameters, namely, heated bed temperature, infill density, layer thickness, and nozzle temperature, on dimensional accuracy were systematically evaluated. An optimised parameter combination was obtained based on experimental results. To validate the effectiveness of the optimised parameters, an arm protective gear was fabricated and assessed using reverse accuracy analysis, which confirmed high dimensional precision. The main findings of this study are summarised as follows: (1) A four-factor, five-level orthogonal experiment was conducted to investigate the dimensional accuracy of CF/PETG parts. Relative error rates in the XYZ directions were measured. SNR analysis was employed to identify the hierarchical influence of each process parameter on dimensional accuracy in the XYZ directions and to determine the optimal process parameter combinations for each direction. (2) Grey relational analysis was employed to evaluate the overall dimensional shrinkage behaviour of CF/PETG parts. The resulting hierarchy of process parameters influence was determined to be heated bed temperature > infill density > layer thickness > nozzle temperature. The optimal process parameter combination for achieving superior overall dimensional accuracy was identified as a nozzle temperature of 245°C, heated bed temperature of 65°C, layer thickness of 0.16 mm, and infill density of 30%. (3) The optimised process parameters identified in this study serve as a valuable data reference for enhancing the forming accuracy of future CF/PETG plastic components, thereby highlighting their significant engineering application value.
This study identified the influence of process parameters on the dimensional accuracy of CF/PETG parts and established an optimised process parameter combination; nevertheless, the interaction effects among parameters in multi-parameter optimisation scenarios also play a critical role in dimensional accuracy. 39 Therefore, subsequent experimental designs should incorporate the analysis of parameter interactions to more comprehensively assess their combined effects. This approach will enable a deeper understanding of the process mechanisms and provide more scientifically robust guidance for the engineering application of CF/PETG materials. Furthermore, while this research focuses on process parameter studies for CF/PETG materials, the methodology adopted demonstrates strong applicability for controlling the forming accuracy of other composite materials. Hence, future work could optimize FDM process parameters for other composite materials by applying the research methodology presented herein, thereby achieving effective control over the forming accuracy of those materials.
Footnotes
Funding
The authors disclosed receipt of the following financial support for the research, authorship, and/or publication of this article: This research was supported by the Ministry of Education Industry-University Cooperative Education Program (Grant No. 230907233094819), the Zhengzhou University of Aeronautics Research Team ‘Aviation Fundamental Components High-Performance Manufacturing Team’ (Grant No. 24ZHTD01003), and the Graduate Education Innovation Program Fund of Zhengzhou University of Aeronautics (Grant No. 2023CX60). The authors are grateful for the grants.
Declaration of conflicting interests
The authors declared no potential conflicts of interest with respect to the research, authorship, and/or publication of this article.