
Abstract
The study presents the synthesis and characterization of CdxZn1-xS-based nanocomposite materials, using the sonochemical and the Successive Ionic Layer Adsorption and Reaction (SILAR) approach. In the sonochemical approach, Cd0.4Zn0.6S nanoparticles were synthesized using three various stabilizers—polyvinyl alcohol (PVA), 3-mercaptopropionic acid (3-MPA), and styrene for analysis the effect of stabilizers on nanoparticle properties. CdxZn1-xS/PVA nanocomposites with varying cadmium-to-zinc ratios (x = 0.2, 0.4, and 1) were synthesized using the same sonochemical approach to study their structural, optical, and morphological properties. Meanwhile, CdxZn1-xS/PVA nanocomposites (x = 0.1, 0.2, 1) were prepared using the SILAR approach, as well as Cd0.2Zn0.8S nanocomposites at various synthesis temperatures (25°C, 45°C, and 65°C). From the comparison of nanocomposite materials with the same stoichiometric composition by both approaches, it was determined that CdxZn1-xS compound is formed in phase with hexagon in ternary compounds, regardless of the type of used stabilizer and particle size. In binary compounds, the formation of a hexagonal phase is observed using the SILAR approach, and a cubic phase is observed using the sonochemical approach. There are significant differences in the Eg value of CdxZn1-xS -based composite materials during the synthesis of the same composite material by two different approaches. Red shift by sonochemical approach and blue shift prevails during synthesis by SILAR approach. Certain shifts between the two approaches in the determination of chemical bonds are associated with differences in the metal-sulfide bonding environment, which may be affected by the different particle sizes produced by the different synthesis approaches.
Introduction
II-VI groups’ composite elements offer broad potential applications in optics and optoelectronics. Within these groups, CdS and ZnS stand out, possessing band gap values of 2.42 eV and 3.8 eV, respectively. 1 CdS and ZnS binary semiconductor compounds are among the most extensively studied materials for the degradation of organic pollutants and in photovoltaic applications.2,3 Subsequent research has revealed that CdS experiences destabilization due to radiation exposure, leading to photocatalyst degradation and the release of free toxic cadmium ions into the environment, as well as susceptibility to photo corrosion. 4 Although ZnS is regarded as a viable material in corrosive environments, its wide band gap limits its effectiveness as a photocatalyst under visible light. To address these limitations, there is a pressing need to develop binary sulfides as hybrid materials or to synthesize ternary semiconductor compounds. In this context, the formation of a ternary CdxZn1-xS solid solution, which spans the compositional range between CdS and ZnS for various values of x, has emerged as a critical area of investigation. Introducing dopants or ion-exchanging these compounds in various quantities produces a ternary solid solution, indicated as CdxZn1-xS. Ternary CdxZn1-xS solid solutions occupy an intermediate compositional range between CdS and ZnS, allowing for the manifestation of properties derived from both compounds in varying combinations. The differing electronegativities of the Cd2⁺ and Zn2⁺ cation sources, along with the S2⁻ anion source, contribute to uneven charge distributions. Additionally, the distinct ionic radii of the cation sources can lead to the formation of asymmetric structures within the material. This variability results in differences in electron density around the atoms, which subsequently induces polarization and the formation of dipoles. CdxZn1-xS nanomaterials are regarded as advantageous due to their enhanced stability and broader spectral absorption range compared to their binary counterparts. Moreover, these compounds have the potential to increase the short-circuit current in solar cells, attributable to their larger band gap.
Metal nanoparticles have a fundamentally unstable structure under normal conditions because of their high surface energy when dispersed. Stabilizers are used to prevent agglomeration in colloidal systems. The process involves exact interactions between the nanoparticle and the stabilizer. In this case, stabilizers successfully bind the nanoparticle surfaces, preventing coalescence. Various parameters, including concentration, temperature, pH value, reaction medium, and technological conditions, among others, have a significant impact on the structure and physicochemical properties of produced nanocomposites.
Polyvinyl alcohol (PVA), a water-soluble synthetic polymer, is used as a transparent material in the formulation of adhesives, thickening solutions, and stabilizers. 5 PVA has recently been discovered to be useful as a substrate in nanoparticle synthesis, where it plays a stabilizing role by preventing agglomerations via forming hydrogen bonds with the surface of nanoparticles. In this case, flexible chains of PVA provide steric hindrance, which helps maintain nanoparticles’ size and shape. 6
As a stabilizer, 3-Mercaptopropionic acid (3-MPA) is a transparent, oily chemical molecule that contains both carboxyl (-COOH) and thiol (-SH) groups. The -SH group has a strong affinity for metal ions, 7 allowing 3-MPA to form strong bonds with the CdxZn1-xS nanoparticles’ surface. This creates a dense stabilizing layer, which prevents agglomeration. Additionally, the -COOH group can modify the solubility of the nanoparticles in aqueous solutions, 8 leading to constant dispersion.
Styrene, generated from benzene, is a clear oily liquid with a high vapor pressure. 9 Styrene serves as a stabilizer in nanoparticle synthesis and can modify the optical and electronic properties of the CdxZn1-xS nanocomposite 10 which is important for optoelectronic applications, specifically when the band gap of the material needs to be controlled.
By choosing various stabilizers, we aimed to adjust the structural and physical characteristics of the synthesized nanoparticles, such as particle size, crystallinity, and optical properties (e.g., band gap). This is essential in applications such as optoelectronic devices, and sensors, where precise control over nanoparticle properties is required.
In recent years, the SILAR approach has gained significant traction for the fabrication of nanocomposite materials composed of various compounds. This approach is characterized by its simplicity, cost-effectiveness, and accessibility regarding the procurement of synthetic materials. 11 To achieve materials with desired properties, key parameters such as the concentration of primary reagents, sorption and washing durations, pH of the solutions, and other relevant conditions can be optimized. 12 The primary advantages of the SILAR approach include the absence of specialized conditions for sample preparation, the ability to control layer thickness through the manipulation of sorption and reaction times as well as the number of cycles, and the lack of stringent requirements for substrate materials. Additionally, ions can be absorbed from both cation and anion sources and organized in a layered configuration. The SILAR synthesis approach was initially developed by Nicolau and colleagues and has been successfully applied to the synthesis of group II-VI semiconductor compounds, including ZnS, CdS, and Zn1-xCdxS.13,14 Following the ion sorption process from both cation and anion sources, the substrate is typically rinsed with distilled water or a suitable detergent to ensure homogeneity. This approach can be characterized as a synthesis process that facilitates the interaction of one substance with another on a substrate. Central to the SILAR synthesis process is the adsorption of ions in a layered manner. This adsorption phenomenon is exothermic and occurs at the interface between the substrate and the ions in solution, characterized by various interaction forces, including attraction, Van der Waals forces, or chemical bonding.
The sonochemical synthesis approach has emerged as a widely utilized technique for the fabrication of various materials. This approach uses the effects of ultrasound waves for the synthesis and modification of certain compounds. The underlying mechanism of the sonochemical process is primarily attributed to cavitation, which facilitates the formation, growth, and subsequent collapse of bubbles within the solution. This phenomenon generates localized regions of high temperature and pressure, creating unique conditions conducive to chemical reactions. The sonochemical approach enables the rapid synthesis of smaller particles, particularly in metal nanoparticles. Ultrasound radiation is directed at a microenvironment filled with gas or vapor, leading to violent bubble formation and subsequent implosion. This breakdown of microbubbles occurs rapidly, resulting in the generation of extreme temperatures and pressures in the surrounding medium, which facilitates an adiabatic process. The energy released during the collapse of these microbubbles is sufficient to induce thermal homolysis of water molecules, generating highly reactive hydrogen and hydroxyl radicals. These radicals can either recombine or react with oxygen upon exposure to air, leading to the formation of various chemically active species.
The main purpose is the comparative study physical properties of CdxZn1-xS nanocompounds produced through sonochemical and SILAR approach. Employing same stabilizers (PVA) with different composite materials (Cd0.2Zn0.8S; Cd0.4Zn0.6S; CdS), at the same time different stabilizers such as PVA, 3-MPA, and styrene for the same combination - Cd0.4Zn0.6S (by sonochemical approach) and different composite materials (Cd0.1Zn0.9S; Cd0.2Zn0.8S; CdS) synthesis at room temperature and at different synthesis temperature (45°C and 65°C) for Cd0.2Zn0.8S/PVA composite materials (by SILAR approach). With that it could be studied to assess the impact of technological conditions (synthesis approach, temperature, capping agents) on the structure and physical characteristics of the synthesized binary and ternary CdxZn1-xS nanomaterials. The resulting compounds exhibit advantageous structure and physical properties, and their practical significance lies in the ability to manipulate these properties using different stabilizers and by changing reaction parameters.
In the present study, nanocomposite materials were used by these two different synthesis approaches which related to different physical processes. In this regard, the structures of the obtained nanomaterials during their formation, as well as the change of their physical properties depending on the formation mechanism, are also interesting issues. In the literature, there are separate studies of CdZnS nanomaterials using both the sonochemical15–19 and SILAR approaches.20–25 So, in the current study, the results obtained from our research on CdS, as well as the results of the literature review, were analyzed and discussed in the conclusion part. However, there are no studies on obtaining these structures by two different approaches and comparing their physical properties. From this point of view, the presented work is considered to be one of the interests of conducting a comparative analysis.
Experimental part
Materials and analysis methods
The following sections provide detailed information on the sonochemical and the SILAR approach for producing nanocomposite materials:
Production of CdxZn1-xS nanocompounds by the sonochemical approach
To synthesize nanocomposites, cadmium acetate dihydrate (Cd(CH3COO)2·2H2O) and zinc acetate dihydrate (Zn(CH3COO)2·2H2O) served as cation sources, while disodium sulfide nonahydrate (Na2S·9H2O) were used as anionic reagents. CdxZn1-xS nanoparticles (x = 0.2, 0.4, and 1) were produced using PVA as a stabilizer. For Cd0.2Zn0.8S nanocomposites (x = 0.2), 0.1 M 25 mL Cd(CH3COO)2·2H2O, 0.4 M 25 mL Zn(CH3COO)2·2H2O, and 0.1 M 50 mL Na2S·9H2O solutions were prepared. For Cd0.4Zn0.6S nanocomposites (x = 0.4), 0.2 M 25 mL Cd(CH3COO)2·2H2O, 0.3 M 25 mL Zn(CH3COO)2·2H2O, and 0.1 M 50 mL Na2S·9H2O solutions were prepared. 1 When x = 1, 0.1 M 50 mL Cd(CH3COO)2·2H2O and 0.1 M 50 mL Na2S·9H2O solutions were prepared for CdS nanocomposites. Distilled water is used as the solvent in each reaction.
Initially, cation sources are introduced into the reaction vessel and subjected to sonication for 15 minutes. Subsequently, PVA is added as a stabilizing agent, followed by an additional sonication period of 5 minutes. Thereafter, the anion source is incorporated into the reaction vessel, and the reaction is conducted at a frequency of 35 kHz for a total duration of 2 hours. To eliminate oxygen from the reaction medium, continuous nitrogen gas was applied to the reaction flask. The final solutions underwent three washes with distilled water through centrifugation at 3200 rpm, followed by additional washing with alcohol, and finally, drying at room temperature.
Production of Cd0.4Zn0.6S nanoparticles with different stabilizers through the sonochemical approach
Cd0.4Zn0.6S nanoparticles were produced using the sonochemical approach, employing three distinct stabilizers: PVA (Molecular Weight: 86.09), 3-MPA (Molecular Weight: 106.14), and styrene (Molecular Weight: 104,15). The objective is to determine the influence of these stabilizers on the properties of the nanoparticles. The synthesis of Cd0.4Zn0.6S nanocomposite materials with different stabilizers involves utilizing the specified initial reagents in the indicated proportions. The stabilizer concentration was selected as 7%.
Production of CdxZn1-xS/PVA ternary nanocomposite materials by SILAR approach
The CdxZn1-xS ternary nanocomposite (x = 0.1, 0.2, and 1) with diverse compositions were deposited onto a PVA polymer matrix substrate (substrate area: 3 *3 cm) using the SILAR approach. The objective was to explore the formation mechanism of CdxZn1-xS nanoparticles with varying x values within the sorption centers of the PVA polymer matrix and to examine how this mechanism evolves at different synthesis temperatures (T = 25°C, 45°C and 65°C).
Initially, nanocomposites were produced at room temperature at x = 0.1, 0.2, and 1. For x = 0.2, Cd(CH3COO)2·2H2O and Zn(CH3COO)2·2H2O were utilized as cation sources, with 0.01 M 25 mL Cd2+ and 0.01 M 25 mL Zn2+ serving as cationic sources, respectively. Na2S·9H2O was used as the anion source, and ethylene glycol (EG) solution was used as a washing agent and solvent. In the case of x = 0.1, 0.01 M 25 mL Cd2+ source, 0.09 M 25 mL Zn2+ source, and 0.1 M 50 mL S2− source were utilized. For x = 1, a 0.1 M 50 mL Cd2+ source and a 0.1 M 50 mL S2− anion source were used for all samples.
The PVA polymer matrix, initially employed for the preparation of nanocomposite materials, undergoes a sorption process with cation sources (Cd2⁺, Zn2⁺) for 40 minutes (Step 1). Following this, a washing procedure is performed twice consecutively in an ethylene glycol (EG) solution for 5 minutes to remove residual substances from the surface (Step 2). The layer is then exposed to the anion source (S2⁻) for a reaction period of 40 minutes (Step 3). In the final stage, the washing process is repeated twice to eliminate any remaining surface impurities, thereby completing one cycle (Step 4). Using this methodology, nanocomposite materials were synthesized over 5 cycles, resulting in the acquisition of final samples.
Analysis methods
Structural analysis of the samples was performed using X-ray diffraction (XRD) with a Rigaku Milinflex 600 X-ray diffractometer (k 1/4 1.54060 Å) using Ni-filtered Cu Ka radiation between 2θ = 10–80°. Diffraction techniques were used to determine the composition, crystallographic structure, and size of the crystallites in the produced nanocomposite material. Optical properties were examined using the UV-VIS Specord 250 Plus spectrophotometer between 250 and 1100 nm. The nanocomposites’ band gap values were determined based on their absorbance or transmittance spectrum. Bonding between elements was determined using FTIR spectrometer (Agilent Cary 630), while morphological studies were conducted with SEM using a Vegan Tesca instrument.
Results and discussion
XRD results
XRD was employed to conduct structural analysis on all samples, investigating the samples’ formation mechanism. Figure 1 displays the diffraction pattern of Cd0.2Zn0.8S/PVA (Figure 1(1a)), Cd0.4Zn0.6S/PVA (Figure 1(1b)) samples synthesized by the sonochemical approach and Cd0.1Zn0.9S/PVA (Figure 1(2a)), Cd0.2Zn0.8S/PVA (Figure 1(2b)) by SILAR approach. XRD pattern of 1 (a) Cd0.2Zn0.8S/PVA, (b) Cd0.4Zn0.6S/PVA by sonochemical; and 2 (a) Cd0.1Zn0.9S/PVA, (b) Cd0.2Zn0.8S by SILAR approaches.
Peaks observed below about 20° in the diffraction pattern of composite materials using PVA as a stabilizer or substrate are attributed to PVA.5,26 The XRD pattern of Cd0.2Zn0.8S and Cd0.4Zn0.6S nanocomposites reveals peaks at 2θ = 22.79°, 46.81°, and 55.76°, and at 2θ = 27.40°, 45.82°, and 54.12°, respectively. These peaks correspond to the crystal structure of CdxZn1-xS in the hexagonal phase, as evidenced by the Miller indices (101), (103), and (004), respectively (card number ICDD 00–049–1302). 1
Figure 1(2) shows the XRD patterns of CdxZn1–xS (x = 0.1 and 0.2) based composite materials. The peaks identified at 2θ ≤ 22° were determined to be characteristic peaks of the PVA matrix.5,26 Peaks observed at 2θ = 26.13° and 43.85° affirmed the existence of the CdxZn1–xS crystalline compound, referencing ICDD card number 00–049–1302. Additionally, the structural analysis indicated that the compound exhibits hexagonal symmetry, crystallizing on planes corresponding to the (002) and (110) Miller indices. The 26.27° and 44.05° peaks in Figure 3(a) and (b) were analyzed following the aforementioned quality analysis sequence, confirming their alignment with the hexagonal structure of the CdxZn1–xS compound. Notably, as the concentration of Cd2+ ions in the solution increased, the diffraction peaks shifted towards smaller angles. Existing literature reports indicate that diffraction angles tend to shift towards higher angles with increased density of Zn2+ ions. In the scientific literature, 27 it is noted that diffraction angles shift towards smaller angles as the concentration of Zn2+ ions increases and the concentration of Cd2+ ions decreases.
Generally, in the CdxZn1–xS structure, lattice constants increase with increasing value of x (a0 = 0.386, c0 = 0.630 when x = 0.16; a0 = 0.388, c0 = 0.632 when x = 0.24, a0 = 0.32 when x = 0.32 0.390, c0 = 0.634; a0 = 0.400, c0 = 0.653 when x = 0.49, a0 = 0.403, c0 = 0.657 when x = 0.84, a0 = 0.406, c0 = 0.660 when x = 0.65).28,29 The lattice constants of CdS in both the cubic (5.8320 Å) and hexagonal (a0 = 4.160 Å, c0 = 6.756 Å) phases are smaller than the lattice constants of ZnS (cubic – 5.420 Å, hexagonal – a0 = 3.82 Å, c0 = 6.26 Å).
Both the sonochemical and SILAR approaches produced CdxZn1-xS-based nanocomposite materials that, when obtained under normal conditions, formed in the hexagonal phase. This suggests that for the composite materials shown, less energy is required to form the hexagonal phase. Thus, when looking at the scientific literature, the formation of the hexagonal and cubic phase of CdZnS occurs due to the influence of temperature - by the chemical bath deposition approaches, the bath temperature is 70°C 30 or 80 ± 5°C, 21 by thermal annealing of CdxZn1-xS at temperatures of 200°C and 400°C. 31 It is believed that the hexagonal-cubic phase can be transformed by applying a temperature higher than the mentioned temperature. Thus, using a variety of synthesis techniques, this CdxZn1-xS solid solution is created in the hexagonal phase at room temperature and normal atmospheric pressure. At the same time, it was observed that the intensity of the nanocomposite materials obtained by the sonochemical approach in the diffraction pattern is higher than the intensity of the materials obtained by the SILAR approach. This allows us to mention that the compounds obtained by the sonochemical approach have a high degree of crystallinity.
The diffraction pattern of nanocomposite materials, achieved by employing distinct capping agents to stabilize Cd0.4Zn0.6S nanocomposites by the sonochemical approaches, is illustrated in Figure 2. XRD pattern of Cd0.4Zn0.6S with different capping agents: (a) PVA; (b) 3-MPA; (c) styrene by sonochemical approaches.
The primary peaks identified in this context are located at 2θ = 26.48°, 44.78°, and 52.47° for one set of nanocomposites, 2θ = 27.66°, 46.09°, and 54.44° for another set, and 2θ = 27.36°, 44.72°, and 53.13° for a third set synthesized using different stabilizers. These peaks align with the (101), (103), and (201) Miller indices, indicative of the CdxZn1–xS crystal lattice in the hexagonal phase. Weak intensity peaks observed at low angles (mainly Figure 2(b)) are estimated to be characteristic diffraction patterns related to the used stabilizer. In comparison with literature data, these nanocomposites were found to correspond to ICDD card number 00–049–1302. The particle sizes for these nanocomposites were calculated, revealing sizes of 7 nm for Cd0.4Zn0.6S /PVA, 9 nm for Cd0.4Zn0.6S /styrene, and 5 nm for Cd0.4Zn0.6S /3-MPA. Thus, using different stabilizers under the same synthesis conditions resulted in a consistent structure, but the particle sizes varied. These differences were attributed to alterations in free Gibbs energy values due to interactions with the particles, depending on the stabilizer type. Essentially, the stabilizers, aimed at impeding the agglomeration of nanoparticles, exhibited distinct interactions based on their physical parameters, leading to varied nanoparticle sizes. Simultaneously, the surface tension force caused shifts in the energetic state of nanoparticles and stabilizers, contributing to alterations in the dimensions of the formed nanoparticles.
The 2θ = 19.83° peak observed in the diffraction pattern of Cd0.2Zn0.8S/PVA nanocomposite materials obtained by SILAR approaches at room temperature (Figure 3(a)) is a characteristic peak related to PVA. At the same time, the predominant peak observed at 2θ = 28.6° is the peak attributed to the hexagonal phase of CdZnS and mathed with the (002) Miller index. The peak observed with a relatively weak intensity is the characteristic peak of hexagonal CdZnS at 2θ = 40.9° which corresponde to (110) Miller index. XRD pattern of Cd0.2Zn0.8S which synthesized different temperatures (a) T = 25°C; (b) T = 45°C; (c) T = 65°C by SILAR approaches.
In the diffraction pattern of the nanocomposite material obtained at a synthesis temperature of 45°C (Figure 3(b)), the characteristic peak belonging to PVA is 2θ = 19.82°, the predominant peak is 2θ = 26.90°, which belongs to the hexagonal phase of CdZnS, and relatively weak was observed at of 41.74° peak angles.
The band gap value of the samples (Eg, eV) / particle size from XRD (nm).

During the synthesis of Cd0.2Zn0.8S/PVA nanocomposites at 65°C, the formation of both binary and ternary compounds was further confirmed by the band gap value. Analysis of the spectra revealed the more intense peaks of ternary CdZnS nanocomposites at 45°C. As the synthesis temperature increased (65°C), the size of the crystallites decreased. Differences in the observed peaks at different temperatures, while maintaining constant density, were attributed to the particle nucleation process, increased density of sorption centers, and activated joining processes within the polymer matrix under specific temperature conditions. Subsequent temperature elevation weakened the aggregation process, resulting in a reduction in particle size. This phenomenon may be attributed to the influence of reaction speed on the formation process, as the higher temperature accelerates the chaotic movement of particles, hindering the creation of a stable environment for their combination. Consequently, it was determined that particle sizes decrease up to a certain limit with the temperature increase (T = 65°C).
A solid solution is characterized by the lattice constant. That is, CdZnS is determined by a constant lattice parameter despite the change in concentration. At the lower synthesis temperatures (25°C and 45°C), only one phase is formed (ternary hexagonal CdZnS). As the synthesis temperature increases (65°C), the dipole motion increases. At higher temperatures, the dipole’s motion does not allow it to be ordered (irregularity in the sequence of anion and cation). The growth of chaotic motion prevents orderly arrangement and separate phases (ternary CdZnS, binary CdS and ZnS) are formed. So, when PVA was annealed at a high temperature of 65°C, which produced the hexagonal phase of the CdZnS solid solution, the hexagonal phase of the CdS and ZnS compound were formed. This indicates that a mixed phase and a CdZnS solid solution were created here. Additionally, free Cd2+, Zn 2+, and S2−ions present in the PVA sorption centers developed independently into binary CdS and ZnS due to the temperature effect. So, here different reaction occurred altogether at the same time.
In the literature review, it was determined that the effects of temperature on the structure of CdZnS were studied after synthesis at room temperature. This means that after the formation of a stable structure (stable phase), the effect of temperature on their structure and physical properties was determined. In the literature, the structure of the ternary CdZnS nanocomposites is formed in the hexagonal phase by the chemical bath deposition method, 31 exploding wire technique, 34 chemically deposited, 35 chemical bath deposition 36 at room temperature, and the intensities of the diffraction peaks of its hexagonal phase increase even more when thermal annealing up to 200°C and 400°C. has been observed. In the literature, the effect of temperature during the grown stage has not been studied. This means that after the formation of a stable structure, the ternary CdZnS preserves its structure during the influence of temperature, but it was determined that, in the presented study, the binary CdS and ZnS phases are also formed due to the occurrence of defect structures during this process.
Figure 4 shows the XRD patterns of nanocomposites by sonochemical approach (Figure 4(a)) and SILAR approach (Figure 4(b)). In Figure 4(a), the main observed peaks in the XRD pattern of CdS/PVA nanocomposite are 25.87°, 43.10°, and 53.07°. This structure is the peaks belonging to the CdS nanocomposites formed in the cubic phase, which corresponded to the JCPDS card number 10–0454.
37
It was determined that the observed peaks correspond to (111), (220), and (311) Miller indices, respectively.38,39 It was observed that the XRD pattern of the CdS/PVA nanocomposite materials obtained by the SILAR approach (Figure 4(b)) corresponds to the JCPDS 41-1049 card number and the characteristic peaks are 2θ = 26.46°, 37.35°, 43.09° peaks. It was clear that the compound crystallized on the planes corresponding to (100), (102), and (110) Miller indices and the spatial symmetry was hexagonal. XRD pattern of CdS by (a) sonochemical approach; (b) SILAR approach.
Based on obtained results from XRD pattern, when binary compounds were generated using the sonochemical approach, cubic phase was formed in the production of CdS, while a hexagonal phase was formed when the SILAR approach was used. This suggests that the creation of the cubic phase requires a high temperature. On the other hand, most compounds generated at room temperature under typical conditions are hexagonal phase compounds.
For the crystal structure of the formed crystallite to change, the energy state in the center of formation needs to change. If the energy state changes, then the crystal structure will also change. Then, the particles may move from one crystal structure to another, for example, forming crystallites with a defect structure. This occurring mechanism depends on the interaction of the nanoparticle with the matrix as a result of the placement of the nanoparticle inside the matrix, as well as the effect of that temperature on the particles if they do not collapse at a certain temperature. Therefore, it isn’t easy to think about the formation of this single-valued phase. Because it is somewhat difficult to calculate the total energy of the formed particle since it is a multifunctional variable.
Based on the obtained results, it is evident that the hexagonal phase predominates during the formation of ternary compounds at room temperature, while the cubic phase is observed in binary compounds synthesized via the sonochemical approach. In contrast, the SILAR approach primarily yields the hexagonal phase. So, depending on the synthesis approach, since the grown conditions change, there is sufficient energy from the energetic point of view, where the developing of the formed phases (cubic or hexagonal) occurred. During the synthesis using the SILAR approach, the influence of temperature facilitates the formation of both binary and ternary compounds, with the hexagonal phase CdS and ZnS being identified. Consequently, in the synthesis of binary and ternary compounds via the SILAR approach, the formation of the hexagonal phase is predominantly noted. Conversely, the sonochemical approach predominantly results in the formation of the hexagonal phase for ternary compounds, while the cubic phase is observed in binary compounds. The results further indicate that the formation of the cubic phase through the SILAR approach necessitates a higher energy input.
SEM images
Depending on the technique used, SEM is recognized as a highly significant method for the comparative analysis of sample morphology. In this context, SEM images of Cd0.2Zn0.8S/PVA (Figure 5(a)), Cd0.4Zn0.6S/PVA (Figure 5(b)) nanocomposite materials by sonochemical approach and Cd0.1Zn0.9S/PVA (Figure 5(c)), Cd0.2Zn0.8S/PVA (Figure 5(d)) nanocomposite materials by SILAR approach are presented in Figure 5. SEM images of (a) Cd0.2Zn0.8S/PVA, (b) Cd0.4Zn0.6S/PVA nanocomposites by sonochemical approach and (c) Cd0.1Zn0.9S/PVA, (d) Cd0.2Zn0.8S/PVA by SILAR approach.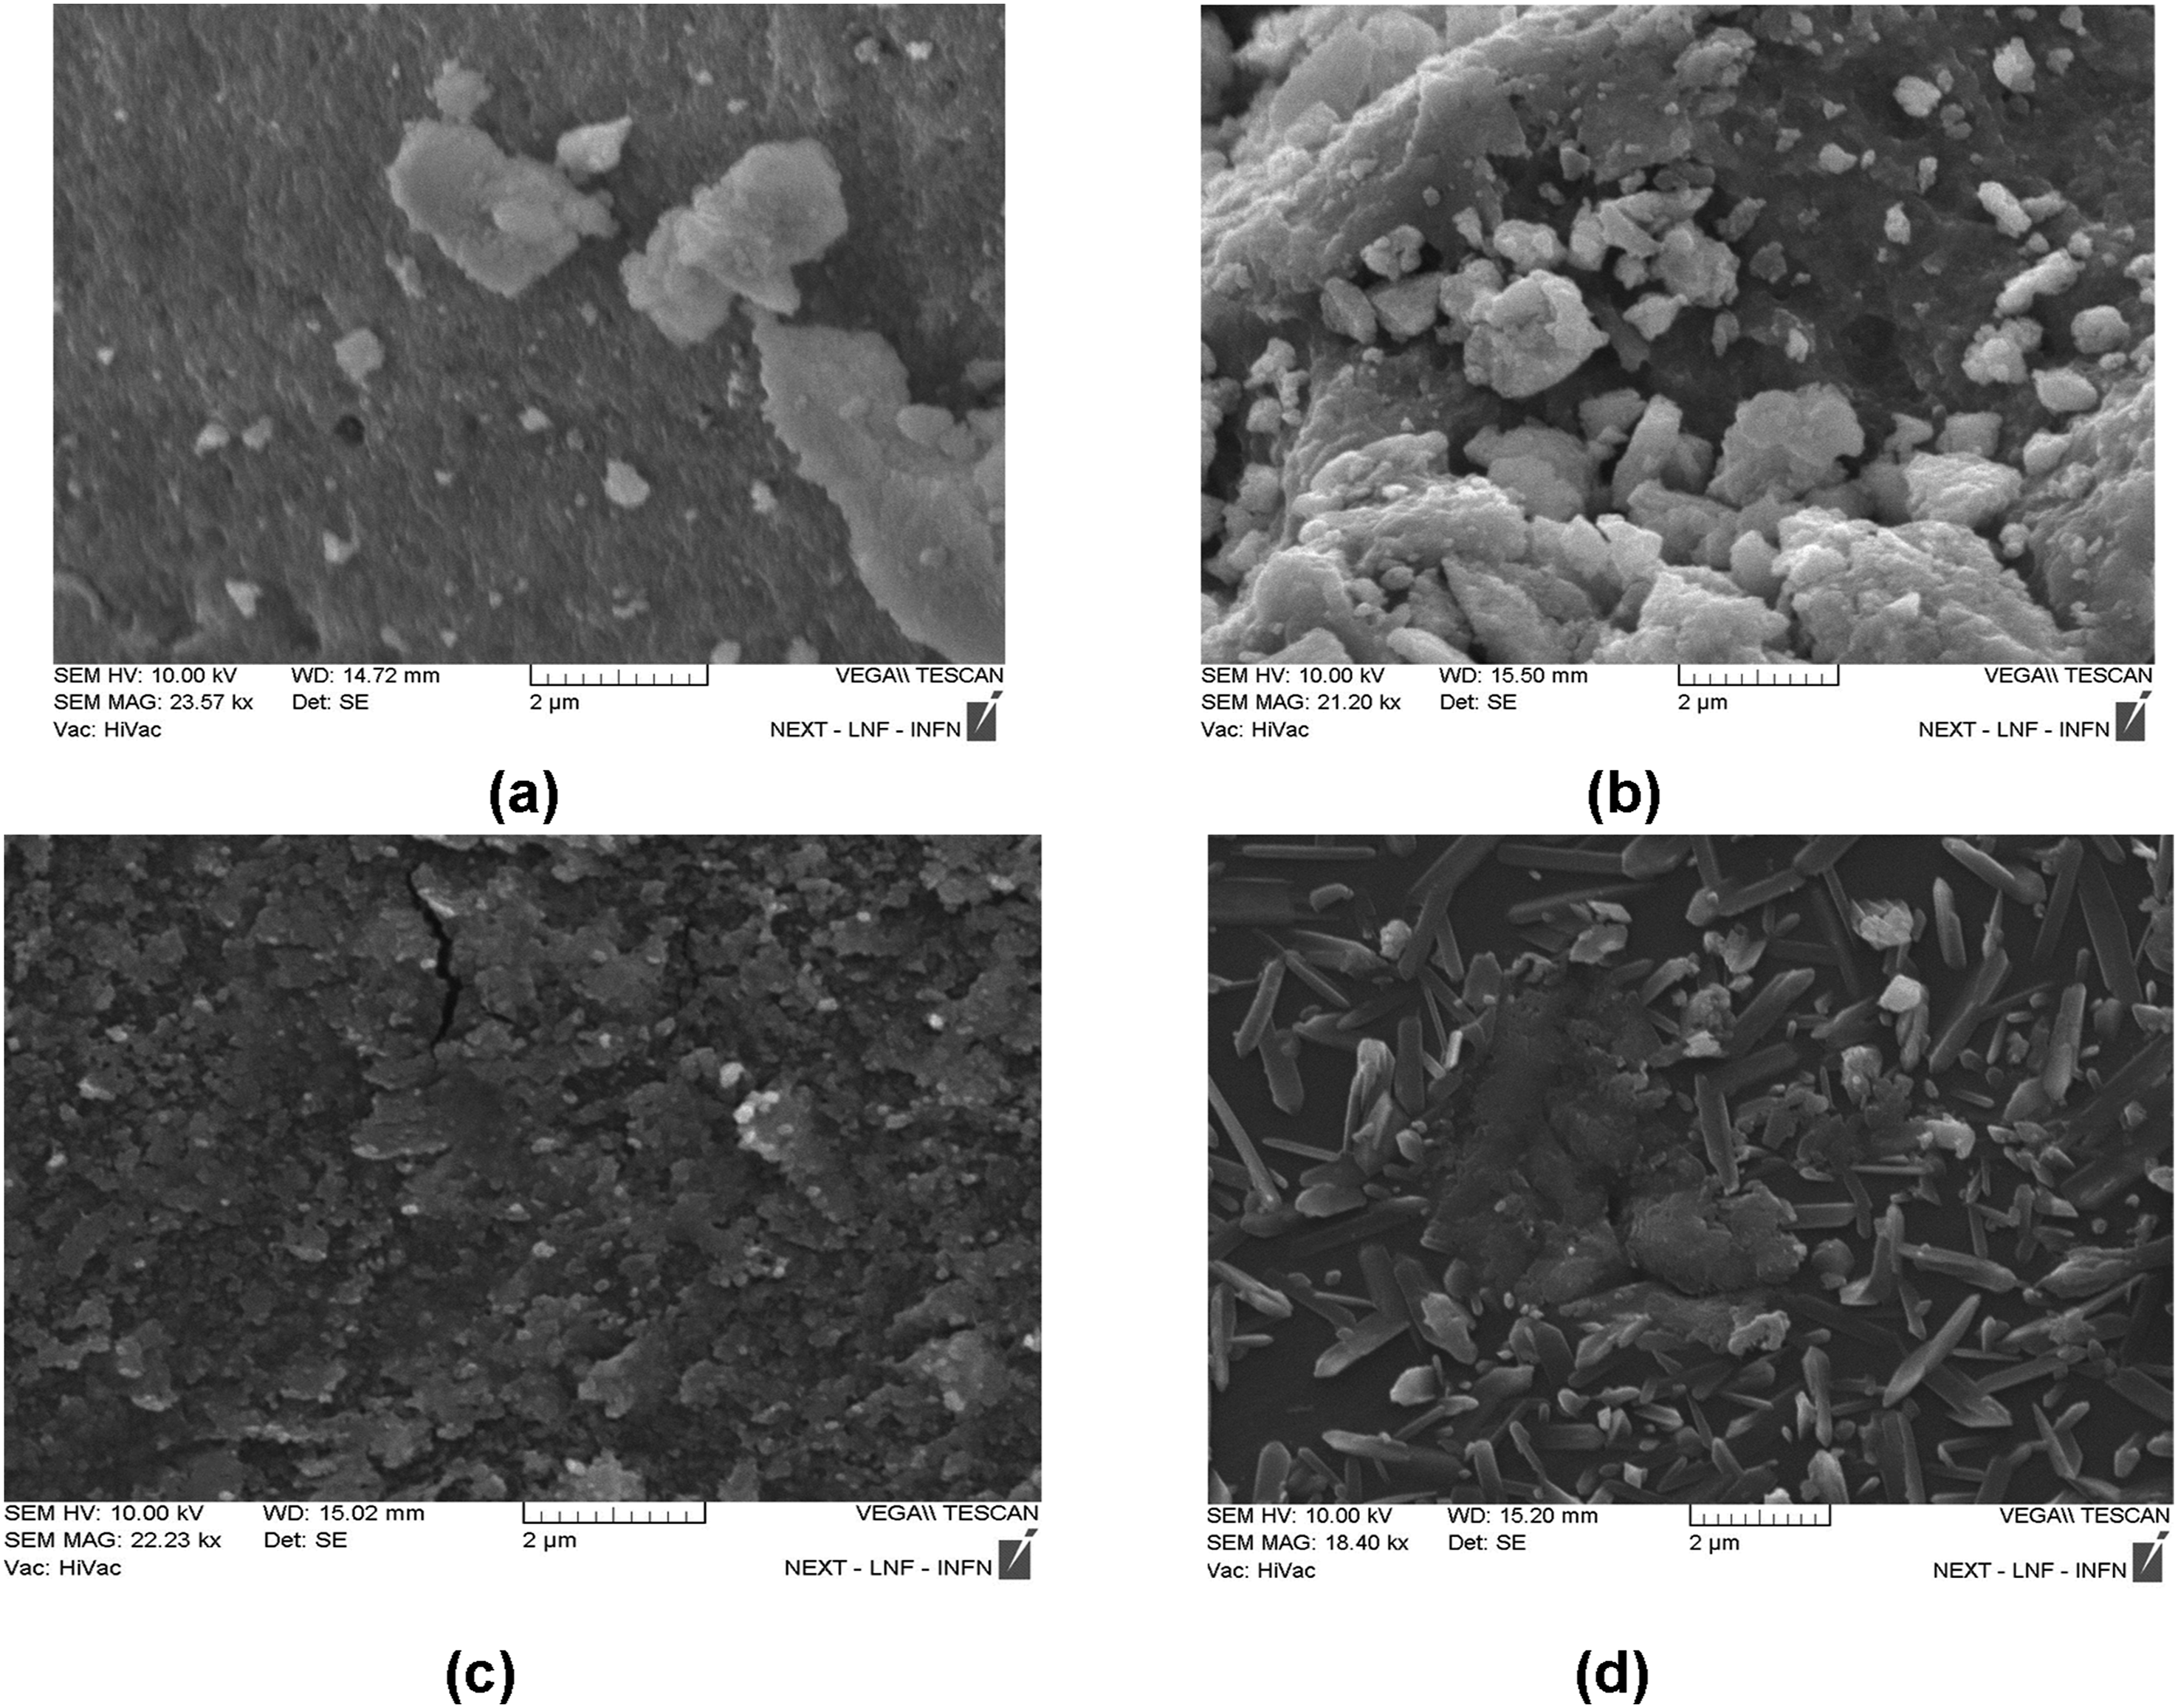
It can be seen from Figure 5, that the size of CdxZn1-xS nanocomposites obtained by the sonochemical approach increased with the increase of the amount of Cd2+ ions in the solid solution. In Figure 5(b), it is clear that large crystallites are formed. Thus, the ionic radius of Cd+, and Zn2+ is 0.95 Å and 0.79 Å, respectively. 2 So, the ionic radius of Cd2+ is larger than Zn2+. In this regard, the formation of larger particles with an increase in the amount of Cd2+ ions in the solid solution is related to the ionic radius of the particles.
SEM images of Cd0.1Zn0.9S/PVA (Figure 5(c)) and Cd0.2Zn0.8/PVA (Figure 5(d)) nanocomposites by the SILAR approach are shown in Figure 5, as well. As mentioned, since the SILAR approach is based on the formation of crystallites in layers, it is obvious that these structures are formed on the surface of PVA at small concentrations of Cd2+ ions. In the SEM image of the Cd0.2Zn0.8S/PVA nanocomposite, it is observed that these layered structures are separated from the surface of the PVA matrix and are formed in the form of free-layered crystallites.
SEM images of Cd0.4Zn0.6S with different capping agents are shown in Figure 6. SEM images of Cd0.4Zn0.6S with different capping agents: (a) PVA; (b) 3-MPA; (c) styrene by sonochemical approach.
Figure 6 shows SEM images of Cd0.4Zn0.6S nanoparticles stabilized with different capping agents. Here, in Figure 6(a), Cd0.4Zn0.6S /PVA nanocomposites are relatively larger, Cd0.4Zn0.6S /styrene (Figure 6(c)) is smaller than Cd0.4Zn0.6S /3-MPA (Figure 6(b)) we can observe the formation of smaller particles compared to other capping agents.
Figure 7 shows SEM images of Cd0.2Zn0.8S/PVA nanocomposite materials obtained by the SILAR approach at different synthesis temperatures. Cd0.2Zn0.8S/PVA obtained at T = 25°C (Figure 7(a)) consists of nanoparticles attached to the PVA matrix surface. Cd0.2Zn0.8S/PVA nanocomposites synthesized at temperature T = 45°C (Figure 7(b)) show that these crystallites are attached to the surface, and during the synthesis process at higher temperatures (T = 65°C-Figure 7(c)) these nanoparticles are completely attached to the surface of the PVA matrix. This leads to the softening of PVA due to the melting temperature, and as a result, the nanoparticles also undergo various modifications on their surface. SEM images of Cd0.2Zn0.8S which synthesized different temperature (a) T = 25°C; (b) T = 45°C; (c) T = 65°C by SILAR approach.
Figure 8 demonstrates CdS nanostructures obtained by sonochemical (Figure 8(a)) and SILAR approach (Figure 8(b)). SEM images of CdS by (a) sonochemical approach; (b) SILAR approach.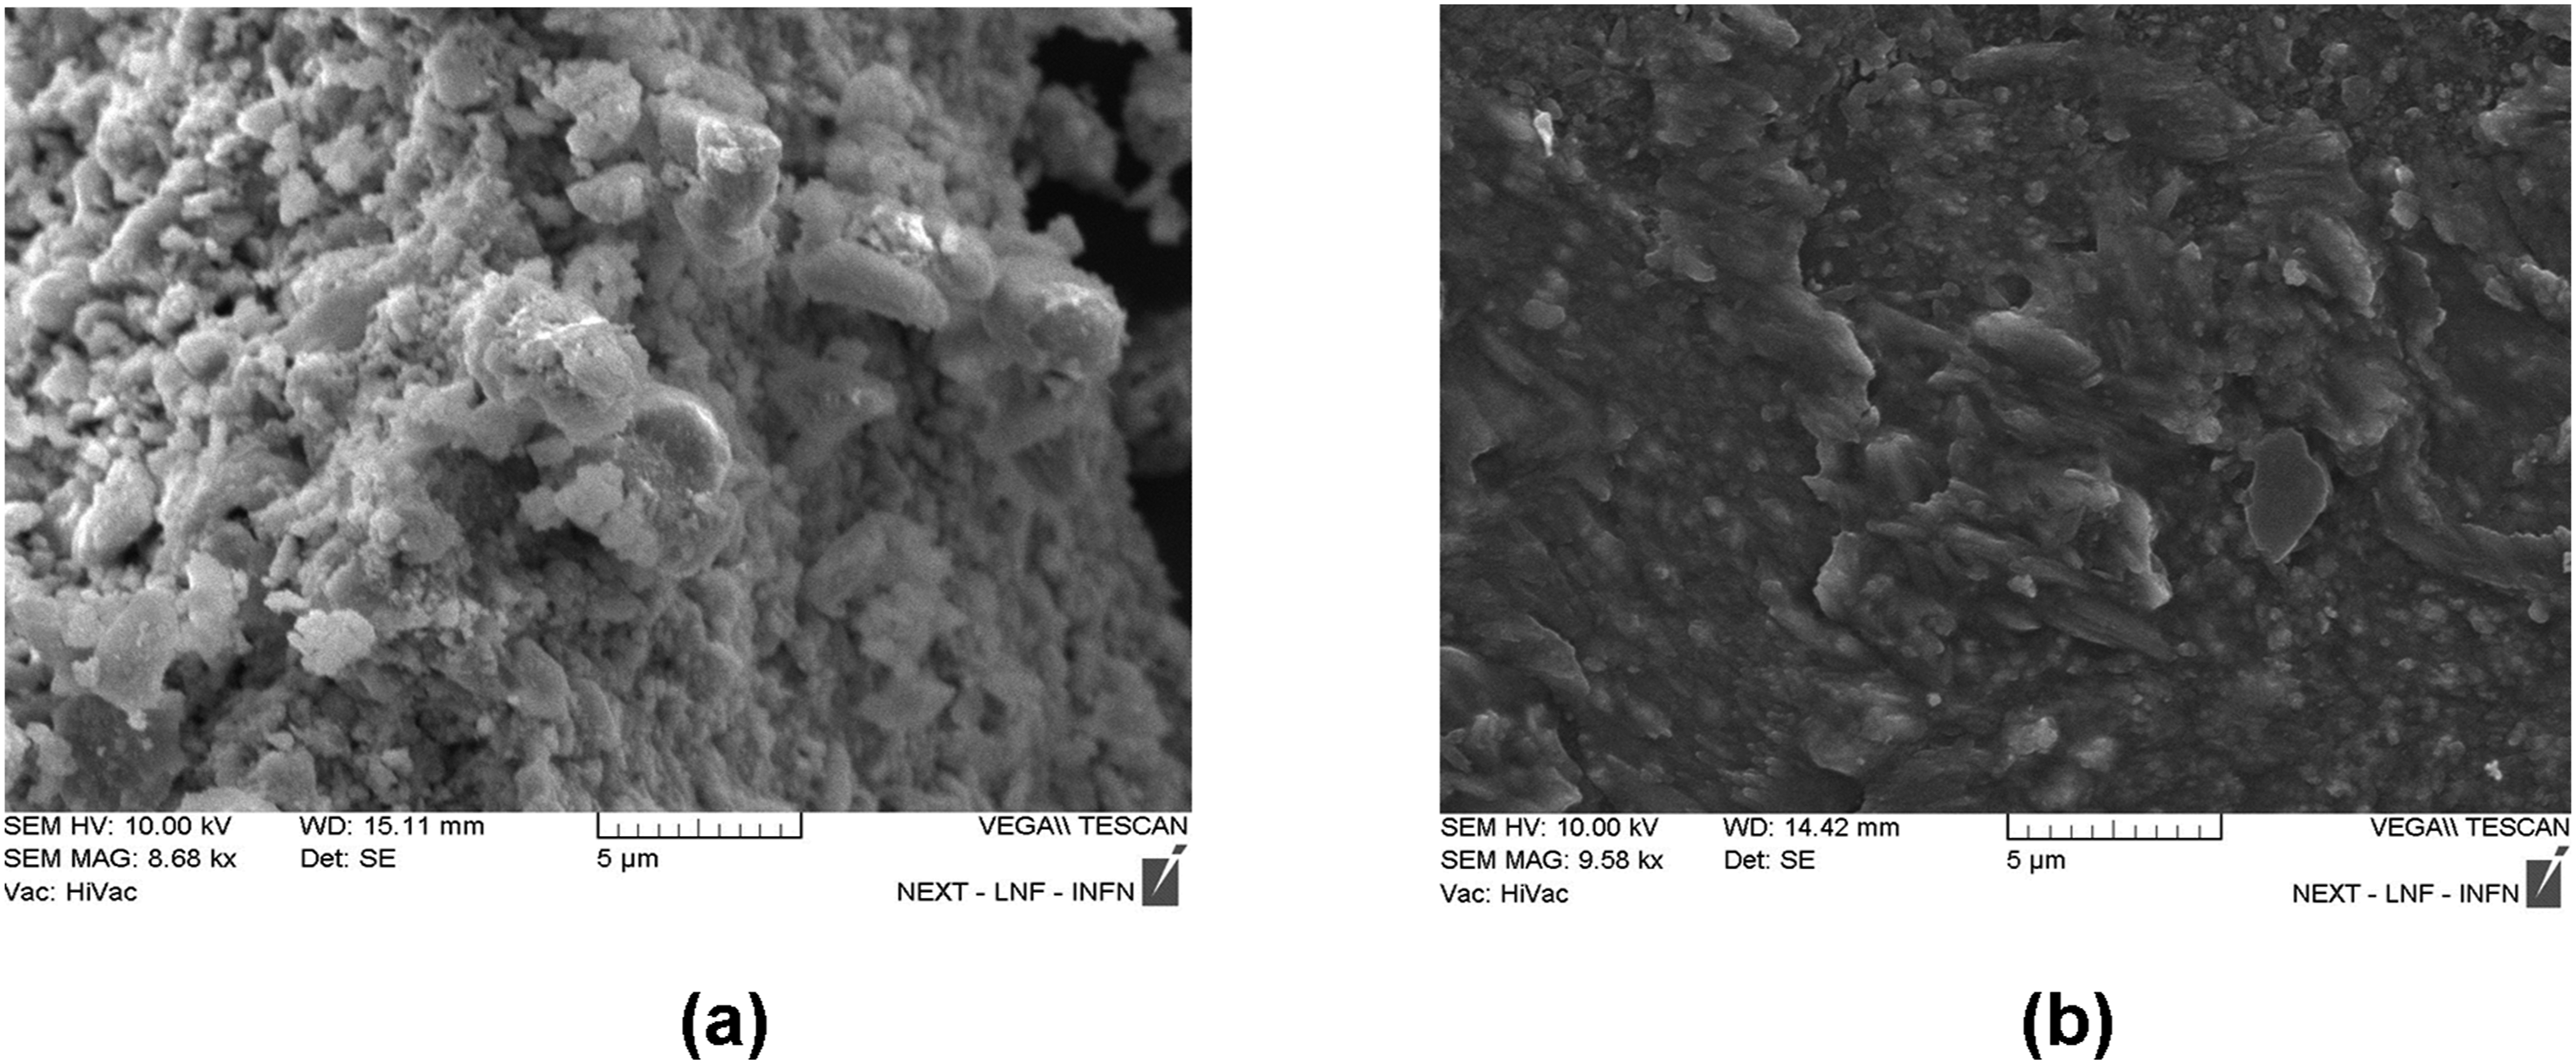
As mentioned above, since these two approaches are based on different physical properties, the size, distribution, and physical properties of nanocomposites, depending on the formation mechanism, are quite different from each other. Thus, with the sonochemical approach, it is possible to see that small-sized nanocomposites are formed freely, and with the SILAR approach, crystallites are formed in a layered form.
UV-Vis results
To determine the optical properties of the nanocomposite materials such as absorbance spectrum and band gap value, all samples were analyzed by UV-Vis spectroscopy. The absorbance spectrum (Figure 9(a)) and to determine band gap value (Figure 9(b)) by Tauc relation of CdxZn1-xS/PVA (x = 0.2, 0.4) nanocomposite materials by sonochemical approach and absorbance spectrum (Figure 9(c)) and band gap value (Figure 9(d)) of CdxZn1-xS/PVA (x = 0.1, 0.2) nanocomposite materials by SILAR approach are shown in Figures 9–12. Sonochemical approach: (a) Absorbance spectrum, (b) determination of band gap value of Cd0.2Zn0.8S/PVA and Cd0.4Zn0.6S/PVA and (c) absorbance spectrum, (d) determination of band gap value of Cd0.1Zn0.9S/PVA and Cd0.2Zn0.8S/PVA. Sonochemical approach: (a) Absorbance spectrum, (b) determination of band gap value of (a) Cd0.4Zn0.6S/PVA and (b) Cd0.4Zn0.6S/3-MPA. SILAR approach: (a) Absorbance spectrum and (b) determination of band gap value of (a) Cd0.2Zn0.8S/PVA at different synthesis temperatures. Sonochemical and SILAR approach: (a) Absorbance spectrum and (b) determination of band gap value of CdS.
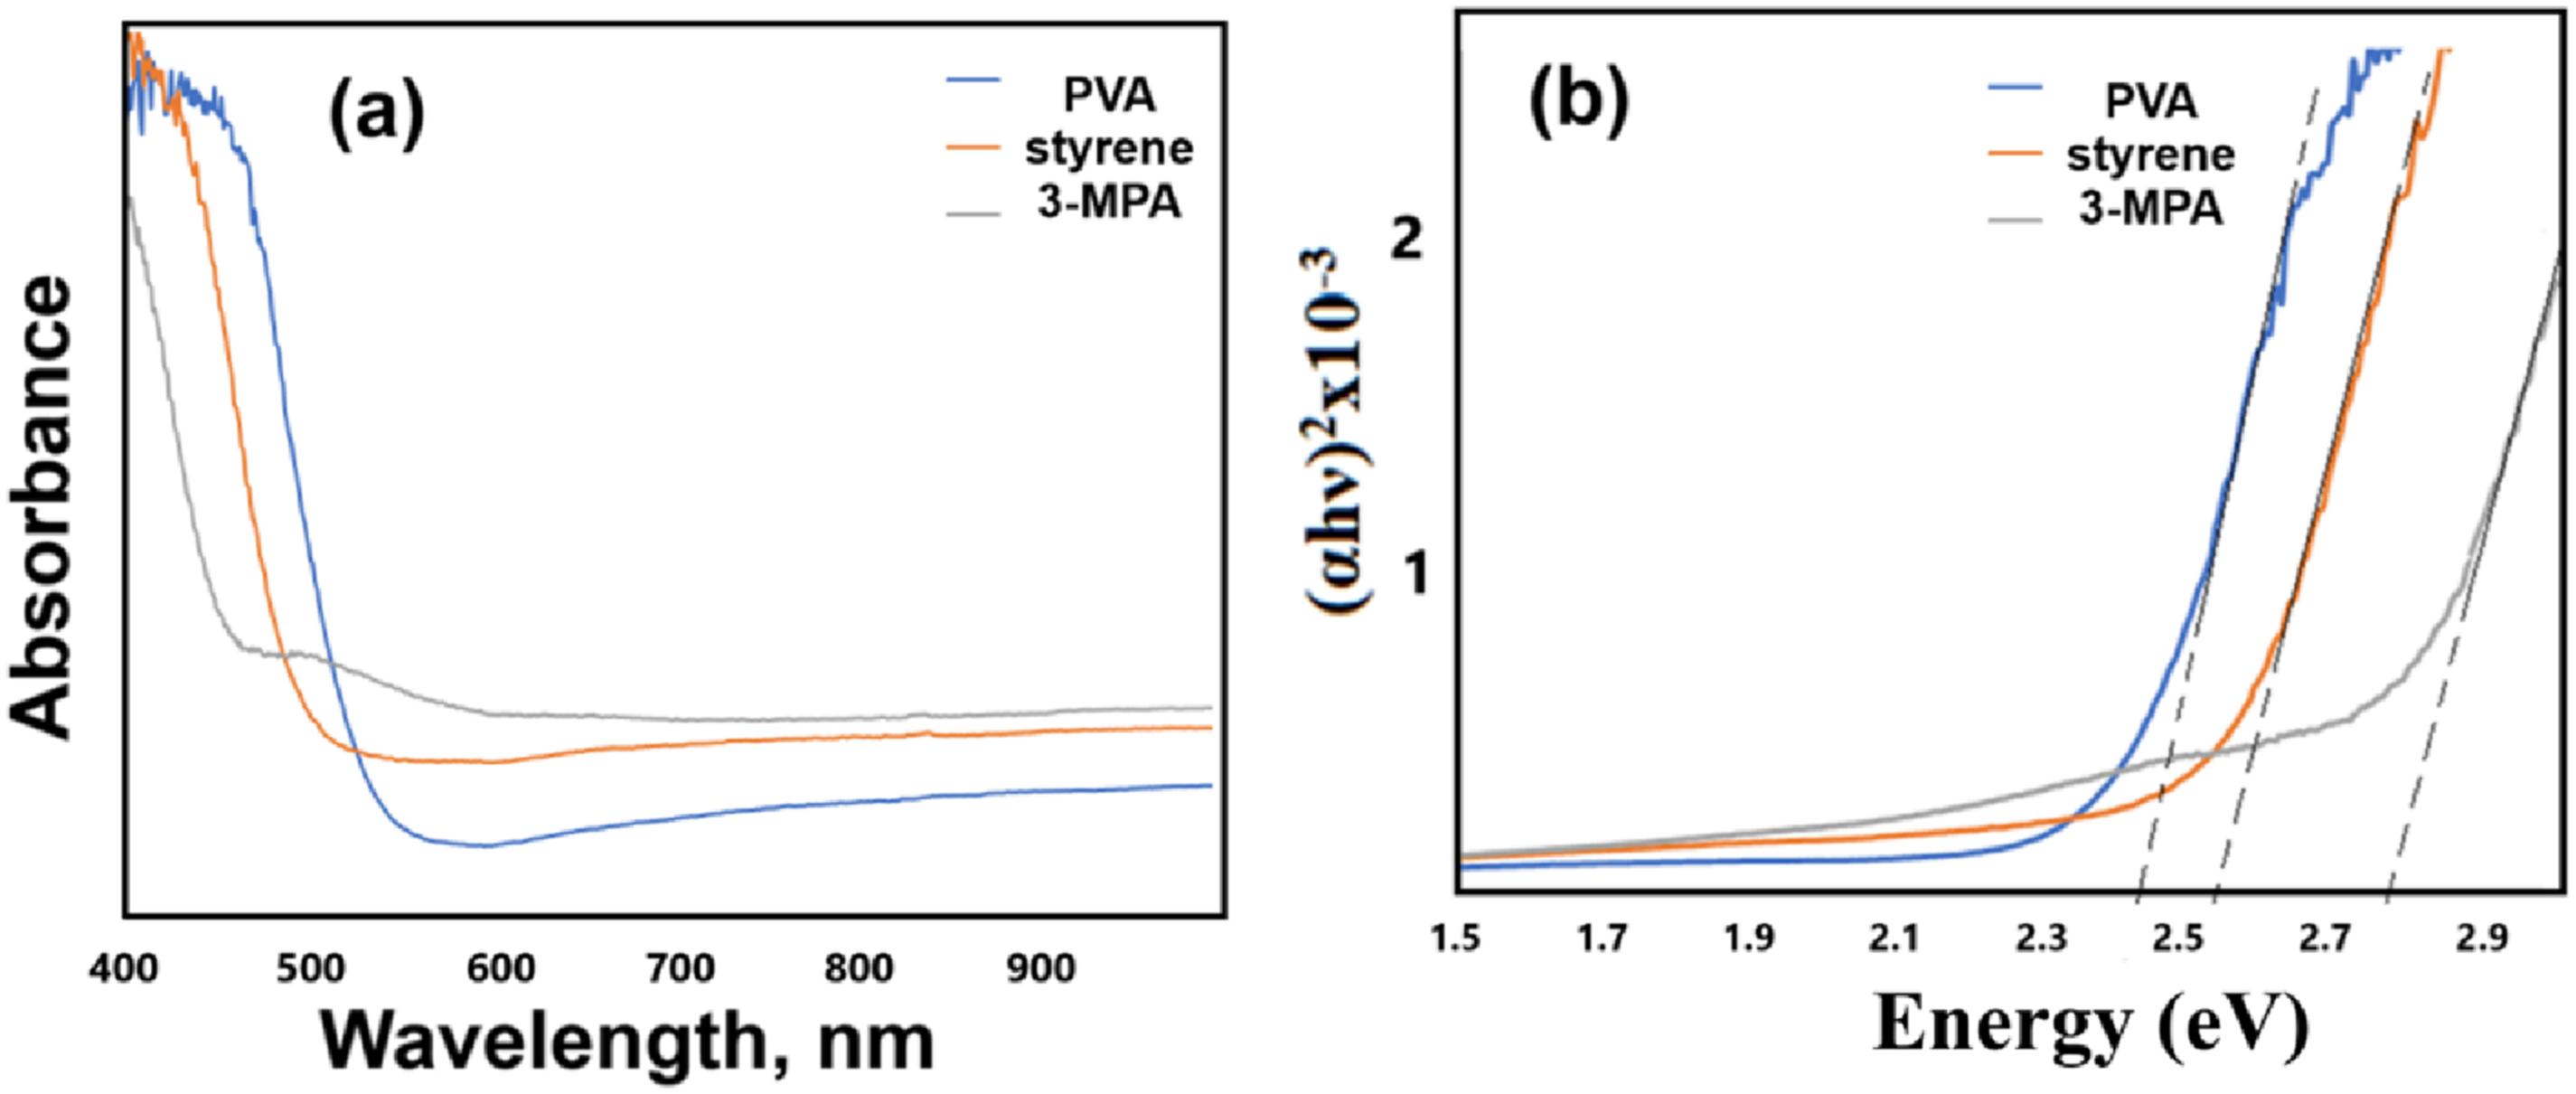


Table 1 displays the Eg values for all samples.
Table 1 shows that the band gap value of CdxZn1-xS/PVA (x = 0.2,0.4, 1) based nanocomposite materials produced by the sonochemical technique was 2.80 eV, 2.45 eV, and 2.25 eV as x increased. In a CdxZn1-xS-based solid solution, the Eg value is reduced as the amounts of Cd2+ ions increase. The measurements revealed that in some situations, the band gap value of the nanocomposites is less than that of the bulk materials (2.42 eV). 39 In the literature, 40 changes in the energy spectrum resulted in changes in the effective mass of charge carriers.
When nanoparticles are placed in an environment with a charged or dipole moment, more potential energy is produced, altering the E (k) dependency. This alteration has an impact on the effective mass. The effective mass is determined by the impulse-energy relationship (equation (1)).
41
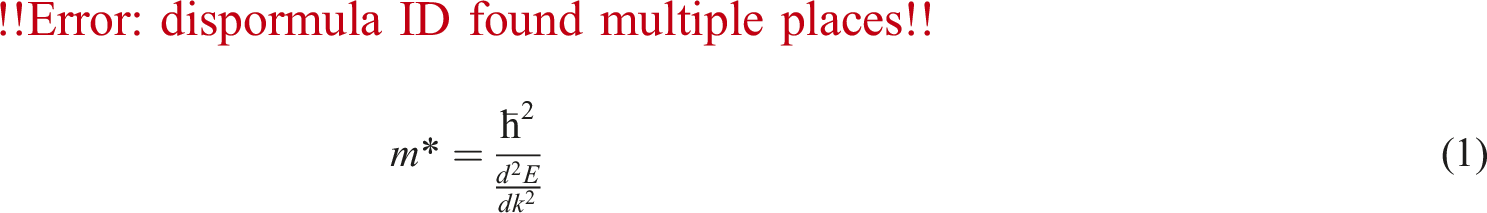
In this example, E (k) represents an electron’s energy in the specified band at wave vector k, with m∗ representing its effective mass and h/2 representing the dimensioned Planck constant. The change in effective mass is caused by a shift in the potential energy of the charge carriers in nanoparticles. 42 The derivative’s value will vary in response to the change in dependence on E (k). The potential energy of nanoparticles is determined by the potential of charge carriers interacting with ions and dipoles in solution. The energy spectrum is determined by the E(k) function.
Various interactions between charge carriers occur in the nanoparticles covered by the electrolyte solution: electron-ion, 43 dipole-electron, 44 ion-ion, 45 ion-dipole, 46 dipole-dipole, 47 etc.
Three stabilizers (PVA, 3-MPA, and styrene) were employed to analyze the influence of stabilizers on optical characteristics using a certain stoichiometric ratio. The values for Cd0.4Zn0.6S/PVA, Cd0.4Zn0.6S /3-MPA, and Cd0.4Zn0.6S /styrene were 2.45 eV, 2.80 eV, and 2.55 eV respectively. This change may be determined by the type of stabilizer used, whether it is polar or non-polar, depending on the properties of the interaction of various stabilizers with the nanoparticle (see Figure 13). FTIR spectra of Cd0.4Zn0.6S-based composite materials (a) Cd0.4Zn0.6S/PVA; (b) PVA; (c) Cd0.4Zn0.6S/3-MPA; (d) 3-MPA; (e) Cd0.4Zn0.6S/styrene; (f) styrene.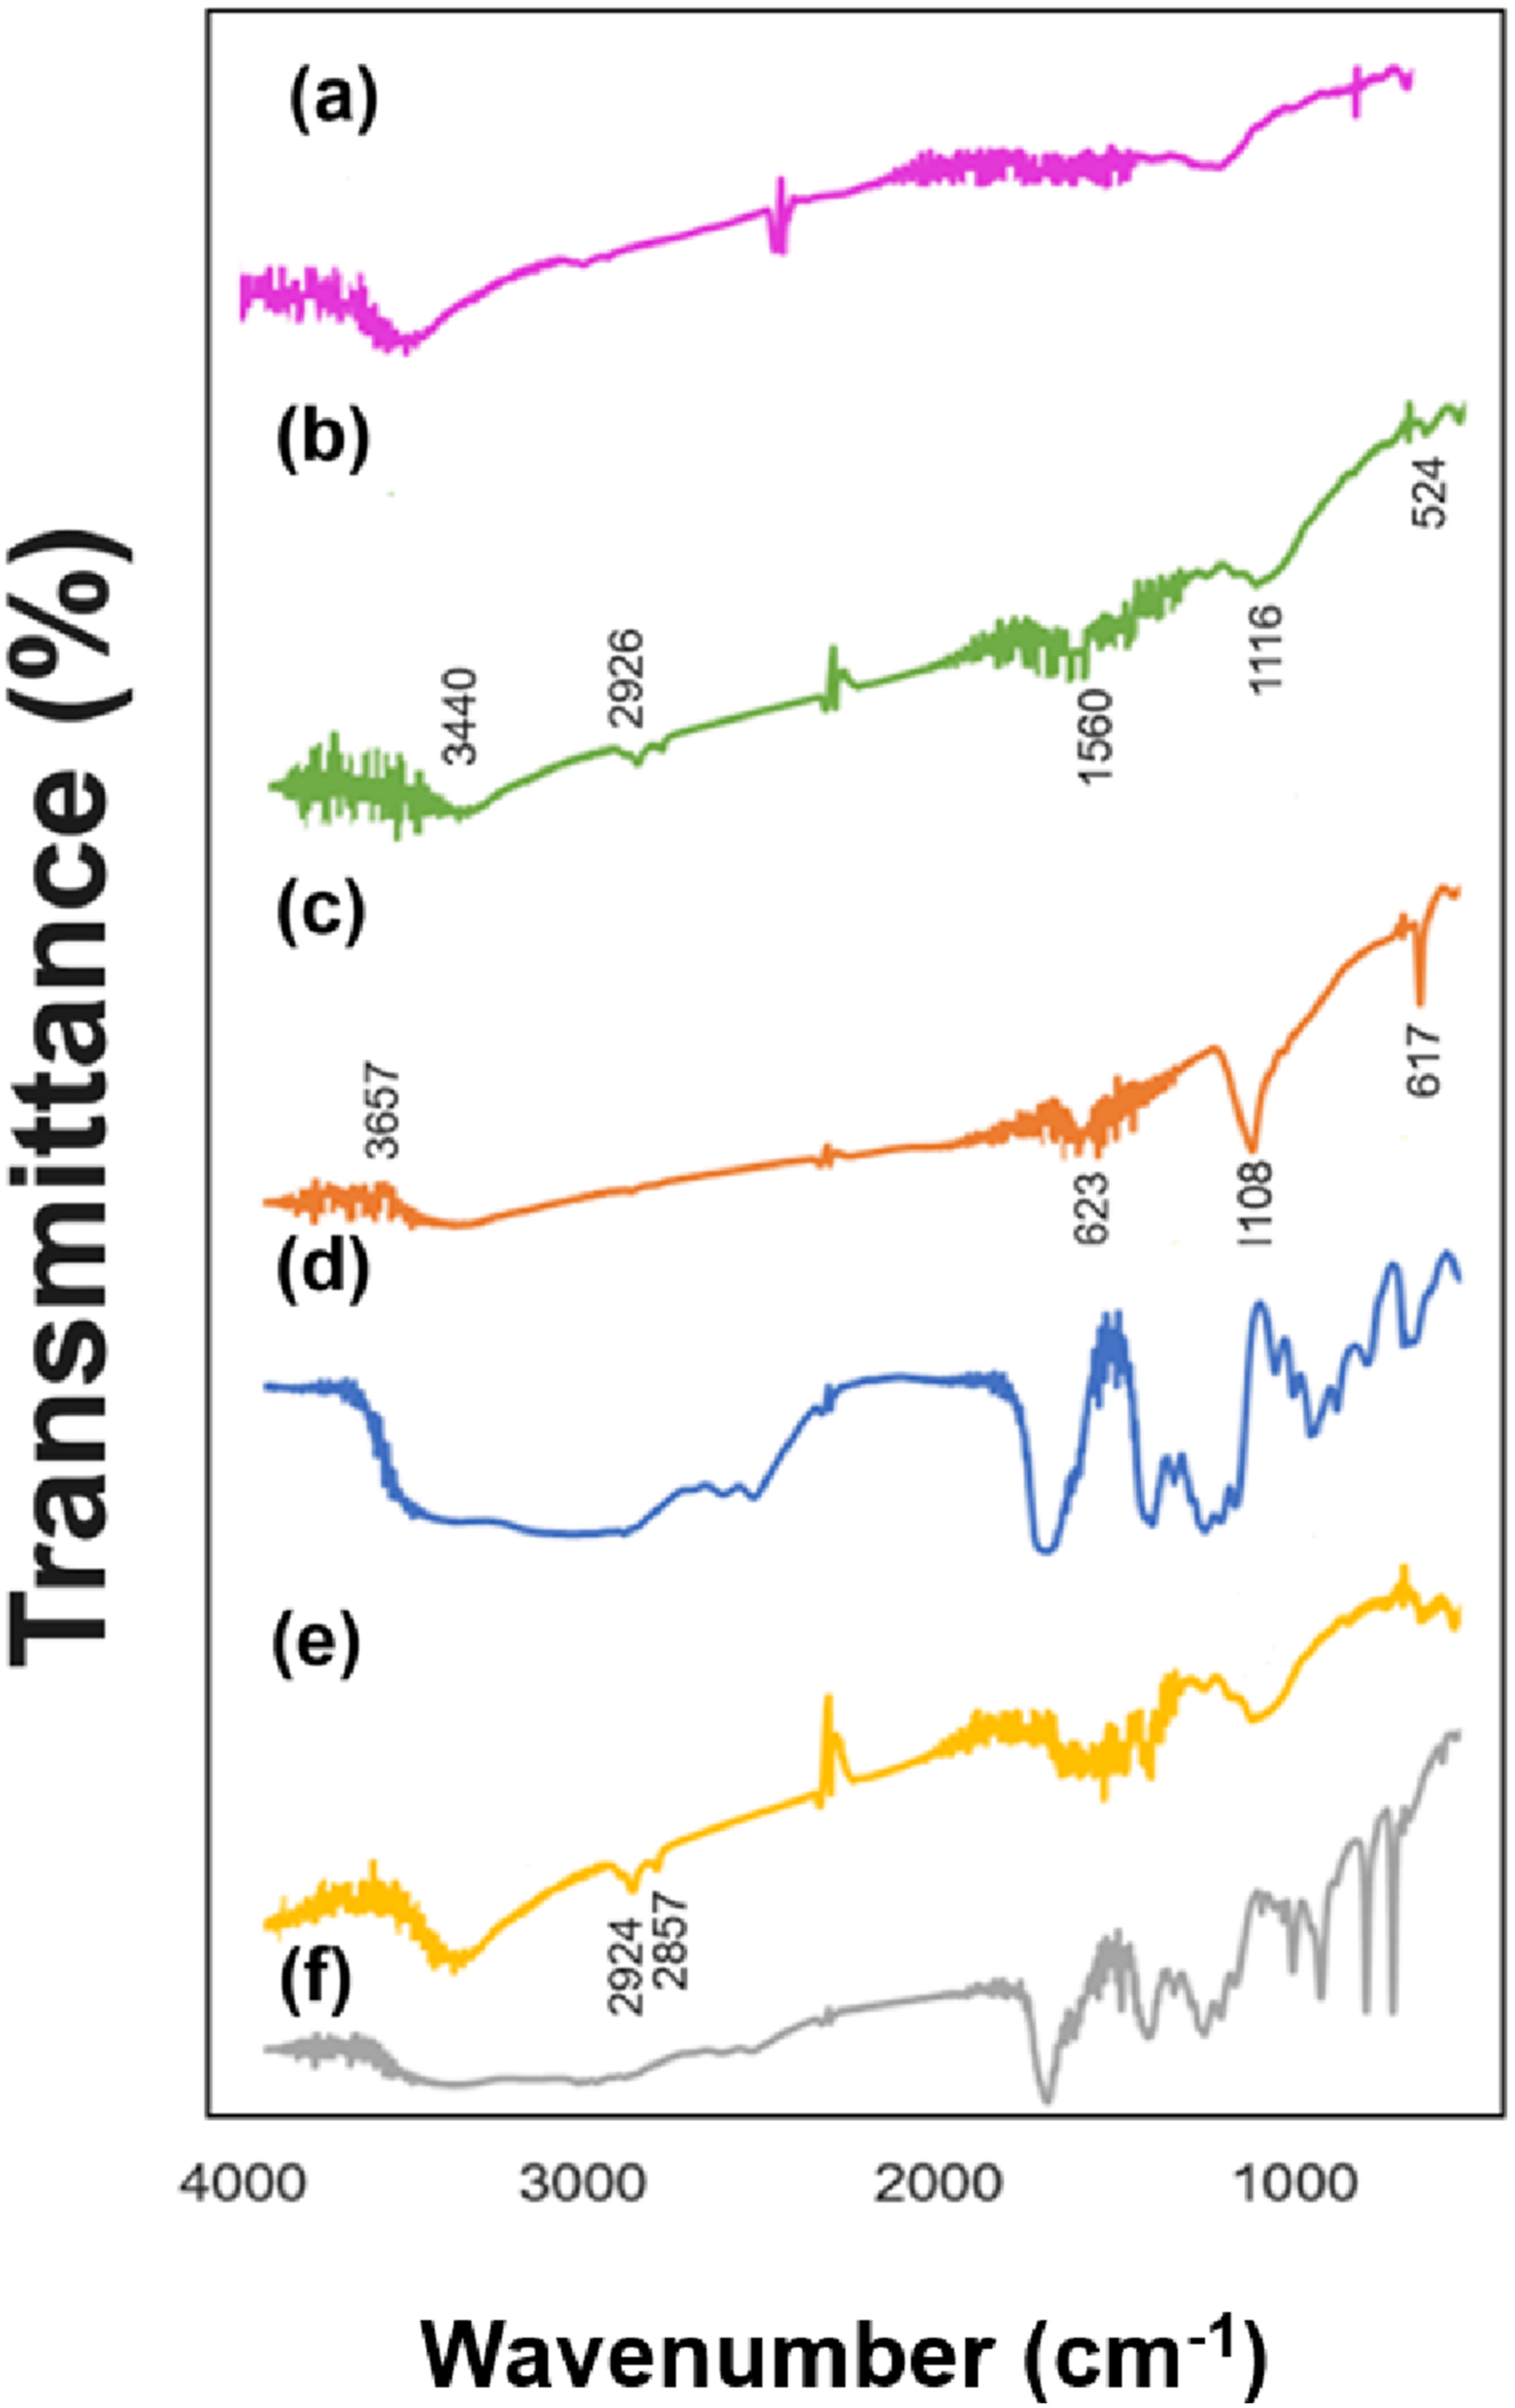
During the synthesis process of Cd0.2Zn0.8S/PVA nanocomposite materials obtained at room temperature, as well as, different synthesis temperatures by the SILAR approach at 45°C, the band gap values of nanocomposites slightly increased with increasing temperature (from 3.05 eV to 3.14 eV). Increasing the synthesis temperature to 65°C led to a decrease in the value of the band gap (from 3.14 eV to 2.37 eV). It should be noted that defects in the structure of nanocomposites, interactions with the environment, and dimensions affect the band gap value. 40 The pronounced reduction in the band gap value in the higher synthesis temperature, along with the partial disintegration of the hexagonal lattice structure in the CdxZn1-xS ternary solid solution and the separate formation of binary CdS and ZnS phases, indicates the emergence of structural defects (see Figure 3(c)).
Differences were also found in the Eg values of CdS produced using two different procedures. Thus, the Eg value of CdS/PVA nanocomposites obtained using the sonochemical approach is 2.25 eV, while the Eg value of CdS/PVA nanocomposites obtained by using the SILAR approach is 2.45 eV. This variation in Eg value is due to a difference in crystallographic structure (cubic phase by sonochemical approach, hexagonal phase by SILAR approach). Thus, structures with a high degree of crystallinity are generated by the sonochemical approach, while structures with a relatively low degree of crystallinity are formed by the SILAR approach.
In general, we can note that the value of band gap energy depends on many parameters. One of them is size dependence due to quantum size effects. Quantum confinement effects are related to the Bohr radius. For example, the Bohr radius of CdS is ∼ 3 nm. Given that the particle sizes are 3.06 nm and 5.42 nm for the sonochemical and SILAR approaches, respectively, quantum size effects are minimal and are likely to depend on other influencing factors. At the same time, it depends on the geometric dimensions of the particles and the environment surrounding the particles. 48 Thus, nanocomposites change the Eg value by interacting with charged particles and particles having a dipole moment. By the SILAR approach, CdS nanocomposites of 5.42 nm, while the sonochemical process yields CdS nanocomposites of 3.06 nm.
During the formation of particles, the interphase interaction also affects the physical properties of the particles. Crystal structure, interphase interactions, and particle sizes are parameters that affect physical properties. Depending on the type of stabilizer used, the formation of an additional layer (double electrical layer) can lead to a change in properties. In general, band gap value and other physical properties of particles depend not only on their size, but also on the environment surrounding it, the characteristics of the environment, the dipole moment, and the interaction mechanism of the charge carriers in the particle with the environment. So, these changes in the Eg value of the particles can vary depending on the thickness of the double electrical layer formed at the boundary of the two environments, depending on the nanocomposite material. At the same time, as a result of the interaction of the particle with the environment, defective structures can be formed and thus affect the potential energy of charge carriers. This can affect its Eg value and other physical properties.
Along with the obtained results, the research conducted in this direction in the literature was also reviewed and it was concluded that: -Comparative analysis of CdS samples obtained using SILAR49–76 and sonochemical approaches77–94 shows that there is a strong difference in the chemical composition of the obtained samples (i.e., the stoichiometric composition of the samples is more perfect). -Samples obtained by the sonochemical approach are more stoichiometric than those obtained by the SILAR approach. Another important characteristic of the obtained samples is the band gap: blue-shift is observed in SILAR samples, and red-shift is observed in samples that yield the sonochemical approach. Here, the red and blue shift is related to different changes in the potential energy of charge carriers in the defects, depending on the environment.
The changes determined during the literature review when the same composite materials were purchased by a different method coincided with our results. Thus, the value of Eg during the preparation of Cd0.2Zn0.8S nanoparticles by the sonochemical method is 2.8 eV, and during the synthesis by the SILAR method, this value is equal to 3.05 eV. By the same rule, when x = 1 (CdxZn1-xS), the Eg value during the synthesis of binary CdS by the sonochemical method value was 2.25 eV, 2.45 eV during synthesis by SILAR method. In comparison, a red shift in the value of Eg during the synthesis by the sonochemical method, and a blue shift in the value of Eg was observed during the synthesis by the SILAR method.
Depending on the method of synthesis, depending on the type of electrolyte solution, it results in a change in the value of the effective mass and band gap. 48 In another study, the effect of changing the synthesis method on the value of Eg was determined. 40 These effects are related to changes in electrical potential caused by interactions with defects, surfaces, broken bonds, form, and so on. The nature of charge carrier interaction with the crystal lattice alters as more electronic potential is formed. This results in a change in the effective mass of the charge carriers and the band gap. It can be observed that the band gap energy is influenced by multiple parameters. This size effect is also affected by the type of stabilizer employed, including its functional groups and optimal coverage, as well as the synthesis or annealing temperature.
FTIR spectrum
Figure 13 illustrates the FTIR spectra of nanocomposites derived from Cd0.4Zn0.6S-based nanocomposite materials using three different stabilizers through the sonochemical approach.
In Figure 13, demonstrated the FTIR spectrum of Cd0.4Zn0.6S/PVA nanocomposite (Figure 13(a)) and pure PVA (Figure 13(b)). From the FTIR spectrum of the Cd0.4Zn0.6S/PVA nanocomposite, the peak at 3442 cm−1 and for PVA, the peak at 3440 cm−1within the broad emission band is ascribed to –OH group while the low-intensity emission peak at 2926 cm−1 corresponds to the –CH2– bond. The 1056 cm−1 peak related to C–O stretching in pure PVA shifted to 1103 cm−1 due to surface interaction in the Cd0.4Zn0.6S/PVA sample. Slight changes below 600 cm⁻1, which are characteristic of metal-oxygen (M–O) bonds, representing interactions between the PVA and the surface of the nanoparticles.
The FTIR spectrum of the Cd0.4Zn0.6S/3-MPA nanocomposite is depicted in Figure 13(c) and for comparative analysis, Figure 13(d) shows the spectrum of pure 3-MPA polymer. In Figure 13(d), the 3587 cm−1 peak corresponding to the hydroxyl group (-OH) in the carboxylic acid (COOH) group of 3-MPA. In the nanocomposite sample, the intensity of this peak decreased and was observed at a wavenumber of 3657 cm−1. A strong peak related to C = O starching at 1705 cm−1 (Figure 13(d)) was observed at 1623 cm−1 in the nanocomposite sample. 95 Such a red shift can occur due to the interaction between the nanoparticle surface and the stabilizer. In the emission spectrum of pure 3-MPA, emissions at 2659 cm−1 and 2571 cm−1 are considered related to the S–H stretching peak. The absence of certain bands in the FTIR spectrum of the Cd0.4Zn0.6S/3-MPA nanocomposite is interpreted as being caused by the interaction of 3-MPA with the metal through the thiol (-SH) group. Instead, a new bond metal and S (M-S) is formed in 617 cm−1 in the FTIR spectrum of the nanocomposite. 96
The FTIR spectrum of the Cd0.4Zn0.6S /styrene nanocomposite is presented in Figure 13(e) and the spectrum of pure styrene (Figure 13(f)) is given for comparative analysis. A strong peak at 1708 cm⁻1, characteristic of the carbonyl group (-C = O) observed in Figure 13(f) decreased in intensity and shifted to 1712 cm−1 in the nanocomposite sample. Also, the intensity of the 1247 cm−1 band observed in the pure stabilizer spectrum and related to C–O stretching has decreased in the nanocomposite spectrum. Both changes occurred due to stabilization and interaction between nanoparticles. The changes occurring in Figure 13(e) in the range of 1400–1600 cm−1 are related to carboxyl groups with the Cd or Zn atoms on the nanoparticle surface. Weak peaks below 600 cm⁻1 due to the formation of bonds between the stabilization agent and the Cd0.4Zn0.6S nanoparticles.
While O-H stretching is dominant in the PVA-stabilized sample, C = O stretching is more prominent in the surface-stabilized samples with 3-MPA and styrene. The disappearance of the S-H band in the spectrum of the nanocomposite sample stabilized with 3-MPA shows a strong interaction between the thiol group and the CdZnS nanoparticles. Such a strong correlation was not observed in the spectra of the other two composite samples. Bands (M–O or M–S) indicating the interaction between the stabilizer and the nanoparticle surface were observed for all samples.
The optical characteristics of nanocomposites based on CdxZn1–xS/PVA, synthesized through the SILAR approach, were also investigated using FTIR spectroscopy. Figure 14 displays the FTIR spectra of both the pure PVA polymer matrix and the samples obtained through the SILAR approach at varying synthesis temperatures. FTIR spectra of Cd0.2Zn0.8S/PVA-based nanocomposites: 1- SILAR approach: (a) pure PVA; (b) synthesis at room temperature; (c) synthesis at T = 45°C; (d) synthesis at T = 65°C and 2- Sonochemical approach.
The FTIR spectra of the pure PVA polymer substrate are depicted in Figure 14(1a). The peaks observed in the range of 3609–3600 cm−1 in the spectra of all samples were attributed to the valence vibrations of –OH groups. This association was made in connection with the structure of the PVA polymer matrix and the inclusion of water molecules in the composition of the primary components used during sample synthesis. Peaks at 1637 cm−1, 1550 cm−1, 1407 cm−1, 1380 cm−1, and 1240 cm−1 observed in the PVA sample corresponded to the vibrations of C–O–Hδ groups. 97 The distinct peaks at 1682 cm−1 and 1641 cm−1 in the spectrum of the sample synthesized at 25°C (Figure 14(1b)) were attributed to the vibration movements of –C = O carbonyl groups. These peaks slightly shifted to the right and diminished in intensity in the samples synthesized at 45°C (Figure 14(1c)). Such alterations are linked to the formation of a solid solution in the polymer matrix, vibrational changes in chemical bonds, a decrease in energy, and consequently, a reduction in the frequency of oscillatory motion. These peaks were not observed with further increases in the synthesis temperature. This observation was explained by the visually observed degradation (softening) of the PVA matrix at elevated temperature values. In contrast to the pure PVA spectrum, peaks at 694 cm−1, 676 cm−1, and 692 cm−1 associated with CdxZn1–xS nanoparticles were evident in all three nanocomposite samples. In the sample with a synthesis temperature of T = 65°C (Figure 14(1d), multiple peaks were observed in the background of the 692 cm−1 peak. This phenomenon was attributed to the formation of CdS and ZnS compounds alongside the hybrid structure of CdxZn1–xS nanoparticles at these elevated temperatures. Shifts in inorganic compounds were associated with the elongation of chemical bonds.
Let’s compare the same nanocomposite materials (Cd0.2Zn0.8S/PVA) using SILAR (Figure 14(1b)) and sonochemical (Figure 14(2)) approaches. From 14(1b), the broad peak around 3600 cm⁻1 is indicative of the valence vibrations of –OH groups. This association was made in connection with the structure of the PVA polymer matrix and the inclusion of water molecules in the composition of the primary components used during sample synthesis. The distinct peaks at 1682 cm−1 and 1641 cm−1 in the sample spectrum can be attributed to C = O stretching vibrations, suggesting the presence of carbonyl groups. Peaks at 694 cm−1 and 692 cm⁻1 are related to metal-sulfide vibrations, characteristic of the Cd-Zn-S component in the composite. From 14(2), the peak at 2928 cm⁻1 represents C-H stretching vibrations due to PVA. The peak at 1701 cm−1 indicates the presence of C = O stretching, 98 according to the band in the sample obtained by the SILAR approach (1682 cm−1 and 1641 cm−1). But this band is slightly shifted here, which might indicate different interactions of nanoparticles within the PVA molecules. Peaks around 1560 cm⁻1 and 1516 cm−1 are related to C = C stretching modes in the organic matrix. The peak at 626 cm−1 represents metal-sulfide bonds, 99 similarly found in the nanocomposite spectrum obtained through the SILAR approach but at a different position (694 cm⁻1 and 692 cm⁻1). The shift in peak position between the two synthesis approaches could indicate differences in the metal-sulfide bonding environment, potentially influenced by the synthesis approaches affecting particle size.
Conclusion
CdxZn1-xS nanocomposites were obtained using both the sonochemical and SILAR approaches, with the aim of exploring the effects of composition and stabilizers on the properties of nanocomposites in sonochemical approach and by the SILAR approach, CdxZn1-xS ternary nanocomposite materials were obtained on a PVA polymer matrix, varying both x (0.1, 0.2, and 1) and the synthesis temperature (25°C, 45°C, and 65°C). In addition, the properties of composite materials synthesized in same composition were comparatively analyzed. From the XRD results, since PVA is used as a substrate in the samples obtained by the SILAR approach, the peak typical of PVA is more intense. In the sonochemical approach, weak intensity peaks characteristic of utilized stabilizers are observed in the diffraction pattern, and the main peaks are belonging to CdxZn1-xS. In addition, it was observed that the diffraction peaks are more intense in the sonochemical approach compared to the SILAR approach - particles with a high degree of crystallinity are formed. This is associated with fewer defective structures and, as a result, better crystallization through ultrasonic waves. During the use of both methods, ternary compounds - CdxZn1-xS were formed in the hexagonal phase. However, during the formation of the binary compound (at a value of x equal to 1), the hexagonal phase was formed by the SILAR approach, and cubic phase of CdS was formed by the sonochemical approach. That is, the energy provided by the ultrasound waves is sufficient for the formation of the cubic phase in the binary compounds by the sonochemical approach, by the SILAR approach formation of hexagonal phase of CdS is profitable as a point of view of energy. It is clear from the SEM images that the nanocomposites formed by the sonochemical method are formed in the form of small and large crystallites, and by the SILAR method, they are formed in the form of adhesion to the surface (in the form connected to the polymer surface) and in the form of fragments (layers). The value of Eg of nanocomposites with the same composition (Cd0.2Zn0.8/PVA and CdS/PVA) was smaller by the sonochemical method (2.80 eV and 2.25 eV), and by the SILAR method (3.05 eV and 3.45 eV), respectively. This was determined to be a red shift in the samples obtained by the soochemical method, and a blue shift in the samples obtained by the SILAR method. The change of the value of Eg depending on the synthesis method is related to the interaction mechanism of different types of electrolyte solution (surrounding) and nanoparticle. So, these effects are related to changes in electrical potential caused by interactions with defects, covers, broken bonds, form, and etc. From the FTIR spectrum, certain differences are observed in the absorbance of functional groups, which the shift in peak position between the two synthesis approaches could indicate differences in the metal-sulfide bonding environment, potentially influenced by the synthesis approaches affecting particle size.
Footnotes
Declaration of conflicting interests
The author(s) declared no potential conflicts of interest with respect to the research, authorship, and/or publication of this article.
Funding
The author(s) received no financial support for the research, authorship, and/or publication of this article.