
Abstract
With good mechanical and thermal properties, elastomers having appreciable electrical conductivity may potentially be developed as smart materials for applications such as strain sensors, artificial muscles or flexible biosensors. With such applications in mind, the purpose of this study was to investigate the structure-properties relationships of new vulcanised blends of a poly (epichlorohydrin) elastomer (PECH) and electrically-conducting polyaniline dodecylbenzenesulfonate salt (PAni.DBSA). PAni.DBSA, synthesised by a published method, was blended with PECH and vulcanised with a commercial sulfur cross-linking agent in an internal mixer. The morphological, mechanical, thermal and electrical properties were examined as a function of the amount of PAni.DBSA in the blends. The electrical conductivities increased with the proportion of polyaniline, showing a low percolation threshold of about 1 wt. % (1.07 vol %) PAni.DBSA (from about 10−12 to 10−10 S cm−1), and a second stage of percolation around 5 wt.%, ultimately reaching around 3 × 10⁻⁸ S cm−1. The results from microscopy and other techniques indicated that a mixture of micro- and nano-sized PAni.DBSA particles was dispersed in the elastomer matrix at compositions above 5 wt. % PAni.DBSA. The infrared spectra of vulcanised PECH-PAni.DBSA blends showed features of the pure polymers, with some notable peak shifts due to intermolecular interactions between the constituents. Thermal properties of the conductive blends were investigated using thermogravimetric analysis (TGA) and differential scanning calorimetry (DSC). The thermal stabilities of the blends were strongly dependent on the ratio of PAni.DBSA to PECH, and the two components inhibited the thermal decomposition of each other. The elastomer’s glass transition temperature (Tg) was determined by thermomechanical analysis (TMA); each blend showed only one such transition, at temperatures that increased monotonically with the proportion of PAni.DBSA present, indicating a significant degree of molecular interaction between the two polymers.
Introduction
Intrinsically conducting polymers (ICPs) have been the focus of intensive research and development activity for several decades because of their versatile properties and wide applications, 1 including secondary batteries, 2 electrorheological devices, 3 biosensors, 4 gas sensors 5 and photovoltaics. 6
It is well-known that some ICPs suffer from poor environmental stability, due to (photo)oxidation of their conjugated backbone and/or instability of their conductive (doped) state in the presence of moisture. 7 Polyaniline (PAni) is attractive for practical applications because of its easy and cheap synthesis, reasonable conductivity and good stability. The conductivity of PAni can be tailored by choosing a suitable dopant and degree of doping, and by controlling its structure during synthesis.8,9
On the other hand, the mechanical properties of most conducting polymers are not particularly good,7,10 partly because of their low-to-medium relative molecular masses (typically 103 – 105). Hence PAni has been combined with thermoplastic polymers11,12 or thermosetting resins 13 to produce structural polymer composites that combine improved mechanical strength with suitable levels of electronic conductivity for a range of applications.
Conductive elastomer blends and nanocomposites are important materials with potential and actual applications as antistatic rubbers, conductive gaskets, flexible electrical contacts, sensors and actuators; this field has been well reviewed in recent years.14–19 Blends or dispersions of ICPs such as PAni in elastomeric hosts have been successfully prepared by solution mixing, 20 thermo-mechanical mixing 21 or electrochemical methods. 22
The formation of stable and effective polyblends and dispersions of ICPs such as PAni with elastomers is favoured by a good match of their solubility parameters and the possibility of secondary attractions such as hydrogen bonds between the polymers. 20
Our previous work 23 reported the preparation and properties of novel unvulcanised blends of polyepichlorhydrin (PECH) and conductive polyaniline dodecylbenzenesulfonate (PAni.DBSA) by a solution-mixing method, using tetrahydrofuran as a common solvent. The electrical conductivities and thermal stabilities of the blends were satisfactory for potential applications, but their mechanical strength and toughness were too low to measure. The aim of the present work was therefore to investigate and understand the effects of structure and composition on the mechanical, electrical and thermal properties of vulcanised rubber blends comprising various proportions of these two polymers. It was decided to produce the vulcanised elastomer blends by thermo-mechanical mixing, using a temperature-controlled internal mixer, and a sulfur-vulcanizing system (using Zisnet F from Zeon Chemicals) was selected.
Characterisation of the resulting PECH-PAni.DBSA materials was done by using Fourier-transform infrared (FT-IR) spectroscopy, differential scanning calorimetry (DSC), electrical conductivity measurements and morphological study by optical and electron microscopy.
Experimental
Chemicals and raw materials
Aniline monomer (99 wt.%, Sigma-Aldrich), ammonium persulfate (APS) (98 wt.%, Sigma Aldrich), 36.5–38 wt.% HCl solution (GPR), 33 wt.% ammonia solution (GPR), 90 wt.% DBSA solution (GPR, Fluka), methanol (GPR), poly (epichlorohydrin) Hydrin H (Zeon Chemicals). Hydrin rubber was washed with methanol for 24 h using Soxhlet extraction in order to remove chemical additives. The curing system known as Zisnet F was kindly provided by Zeon Chemicals, Wales, and stearic acid powder was obtained from Sigma-Aldrich. (Stearic acid was used to control the degree of splitting and tearing of the Hydrin rubber during mill-mixing. Another advantage of using stearic acid was to reduce the degree of surface bloom in vulcanisates fabricated from the Hydrin mixes). The accelerator used in conjunction with Zisnet F was diphenylguanidine (DPG), supplied by Sigma-Aldrich. DPG was supplied under the trade name DPG 75; this was 75% active material in a PECH binder.
Preparation of PAni.DBSA conducting polymer
Polyaniline dodecylbenzenesulfonate (PAni.DBSA) was synthesised by the three-step method outlined below [full details in reference (24)].
The hydrochloride form of polyaniline “emeraldine salt” was synthesised by oxidative polymerisation of aniline monomer in 2 m HCl solution at 0°C, using (NH4)2S2O8 as an oxidant. 2 The product was washed with water and deprotonated to form “emeraldine base” (PAni base) by stirring with a large excess of aqueous ammonia. After thorough washing with distilled water, followed by acetone and drying in a vacuum oven at 50°C, the PAni was converted to PAni.DBSA by stirring with a 50% excess of dodecylbenzenesulfonic acid for 48 h, washed with water and again dried under vacuum. The product was a fine powder, <500 mesh (Yield: 85%).
Preparation of PECH-PAni.DBSA blends and addition of Zisnet F
Zisnet F (2,4,6-trimercapto-s-triazine) (Figure 1) was used as a vulcanizing agent which was suitable for epichlorohydrin rubber and effective in mixed materials of rubber and plastics, expected to provide fast curing speed, safe scorching capacity, short curing time and good mechanical properties of the cured rubber. Zisnet F structure.
Compositions of feed mixtures for the vulcanisates.

Vulcanisation behaviour of pure PECH rubber with different mass ratios of Zisnet F.

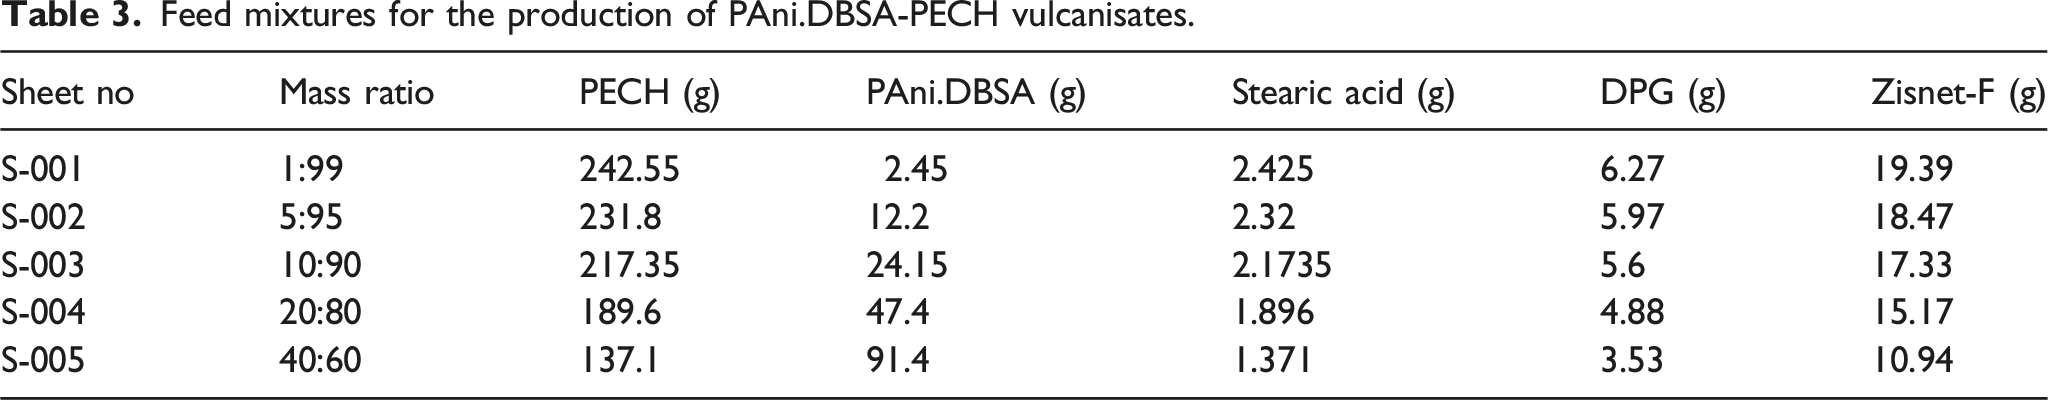
Feed mixtures for the production of PAni.DBSA-PECH vulcanisates.
Procedure for the preparation of blends.

Vulcanisation behaviour of blends with different mass ratios of PAni.DBSA.

It was found that all the rheometer curves (see Figure 2 for example) reached a maximum torque with slight recursion, and all the blends showed the same behaviour trend and reached their maximum vulcanisation level within the chosen test period. Rheometry curve of vulcanised blend with 1% w PAni.DBSA.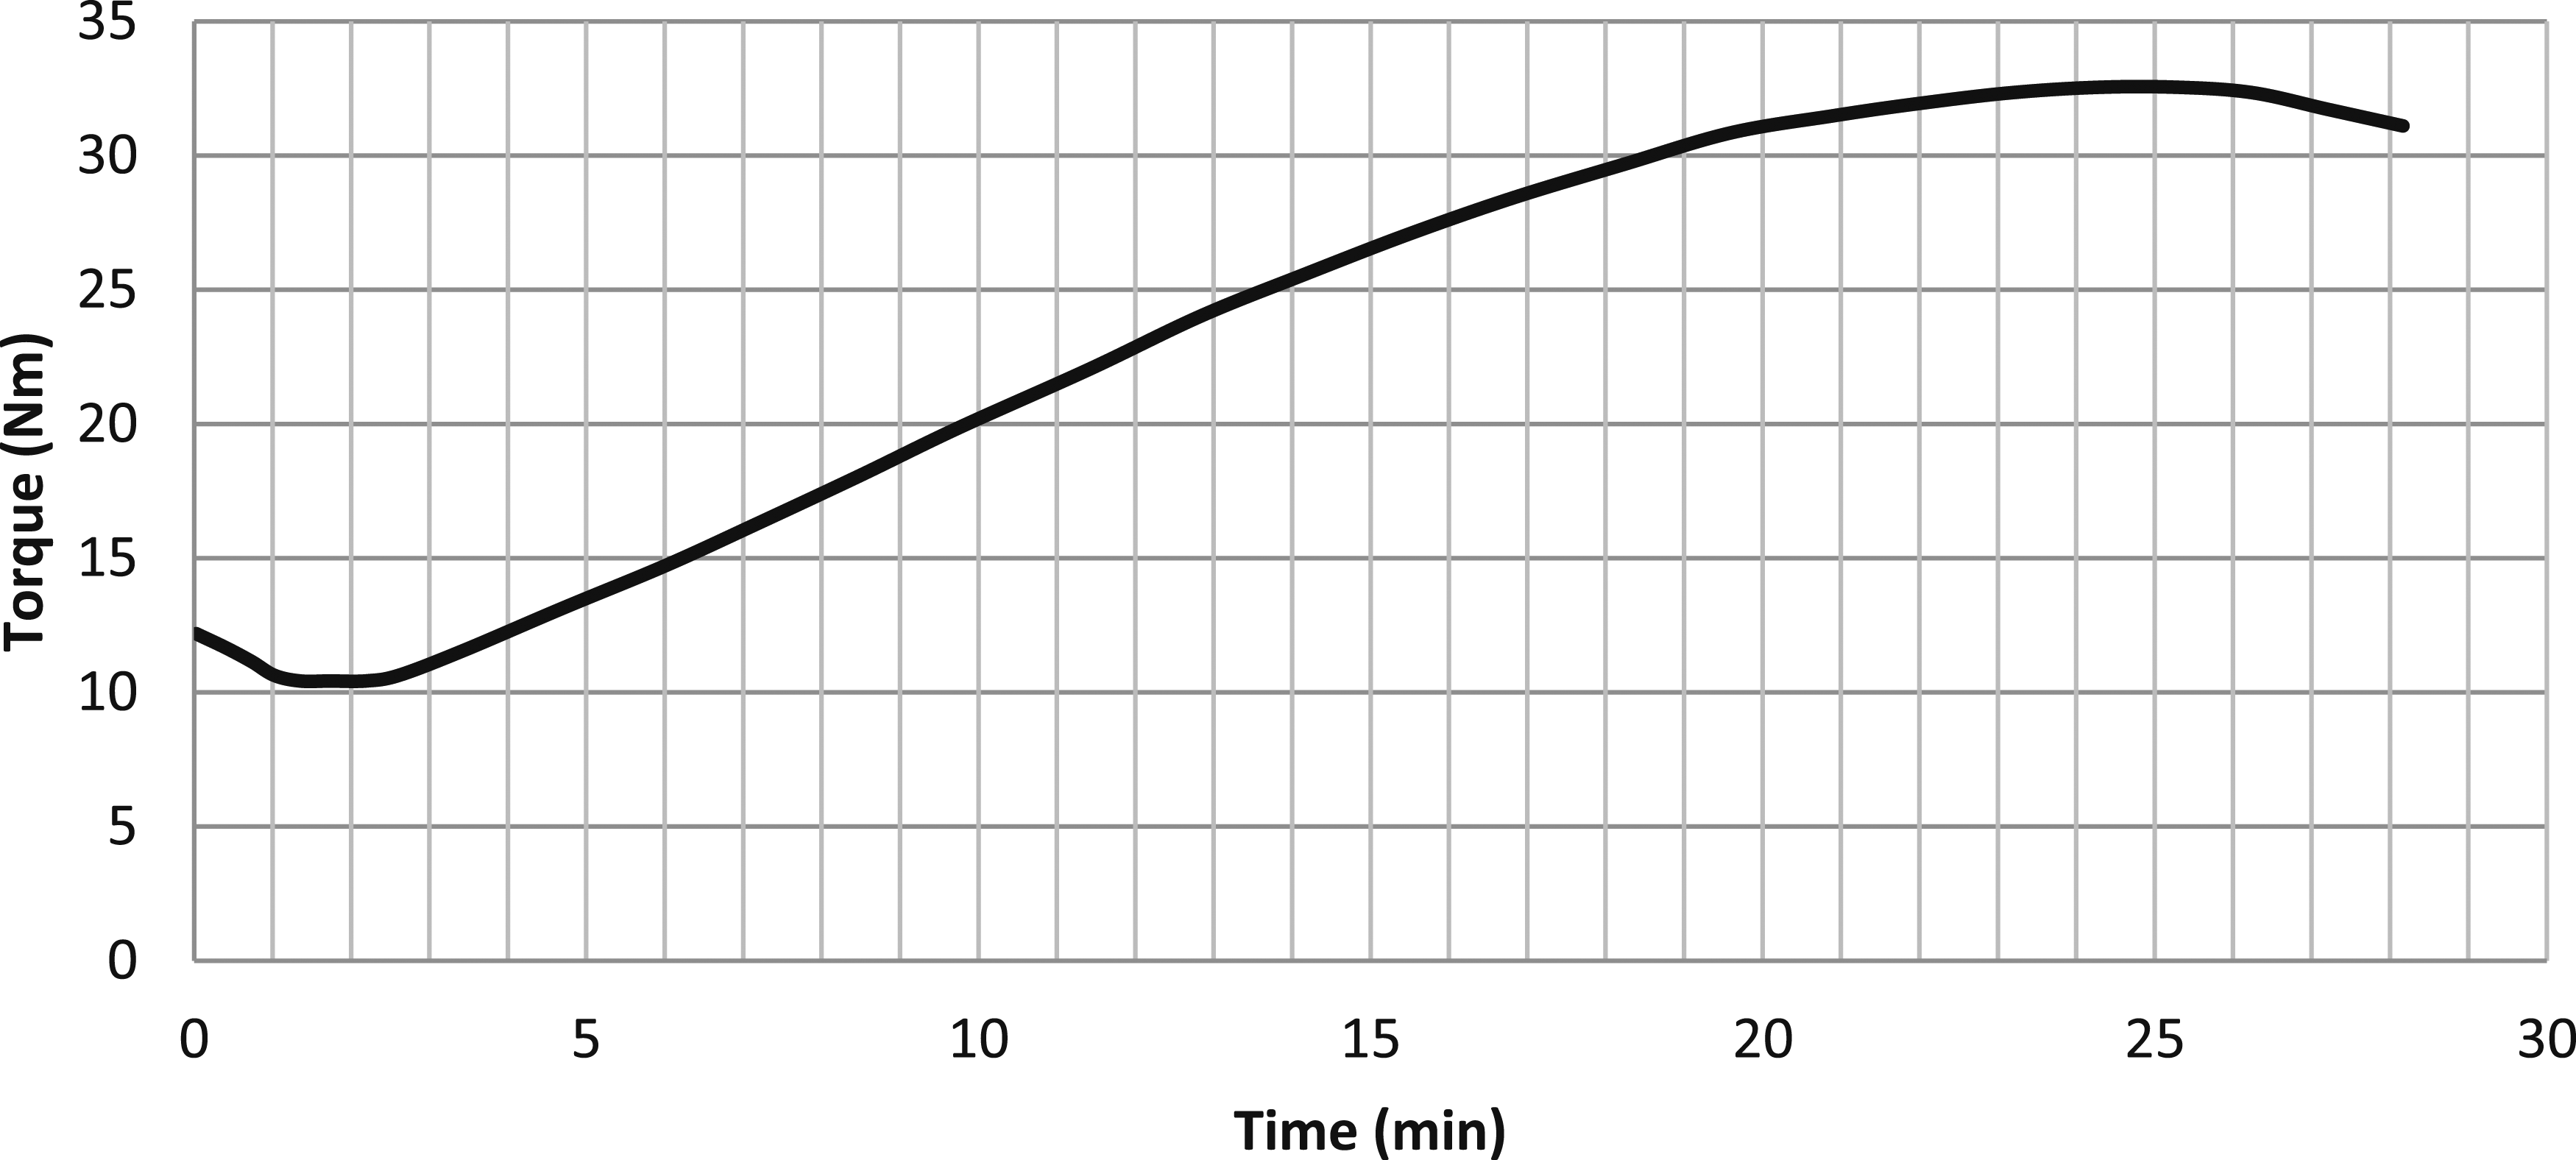
Morphological studies
All the vulcanised PECH and PECH-PAni.DBSA samples prepared in this work were studied with a Nikon OPTIPHOT-2 optical microscope (magnification × 100) linked to a computer by a video converter (LINKAM VTO 232) for digital image capture. Representative images were captured digitally.
FTIR spectroscopy
ATR-FTIR spectra of pure PAni.DBSA, vulcanised PECH and vulcanised PECH-PAni.DBSA blends were recorded on a Perkin-Elmer FTIR Paragon 100 Spectrometer. A small amount of each sample was placed on the diamond probe of the ATR instrument and held in place by the cover while the reflectance-mode IR spectra were recorded.
X-ray diffractometry (XRD) analysis
X-ray diffraction studies of PAni.DBSA, the vulcanised polyepichlorhydrin and PECH-PAni.DBSA blend with 10% of PAni-DBSA were performed on a Bruker-AXS D8 Advance diffractometer, operated at 40 kV, 25 mA. (Average scan speed 0.033°s−1). The XRD patterns were obtained with Ni-filtered CuKα radiation (1.542 Å or 0.1542 nm).
Thermal analysis
Thermal stabilities of the blends, pure PAni.DBSA and vulcanised PECH were investigated by thermogravimetric analysis (TGA) using a Mettler TG 50 thermobalance coupled with a Mettler analysis controller TC10 A, from 30 to 400°C (heating rate 10°C min−1), under nitrogen. Differential scanning calorimetry (DSC) measurements were performed on a Mettler Toledo 822e analyser, from 25 to 400°C (10°C.min−1), also under nitrogen atmosphere.
PAni.DBSA powder, pure PECH and all the PECH-PAni.DBSA blend cast films were characterised by differential scanning calorimetry, using a Mettler Toledo DSC822e (heating rate 10°C min−1). Each sample was placed in a 40 μL Al pan and analysed under N2 atmosphere. An empty pan was used as the reference.
Tensile properties measurements
Tensile testing was carried out according to British Standards Institution (BSI) procedure. The test was performed in a controlled atmosphere with room temperature 23 ± 2°C and relative humidity 50 ± 5%. Six test pieces of each material were used to repeat each test to define the final as the mean value of six measurements. A tensile tester (Tinius Olsen H10K-S) was used to measure tensile properties, tensile strength and elongation at break with constant strain rate (10 mm min−1). Test pieces in standard dumb-bell shape were used. Tensile strength was defined as the maximum tensile stress recorded in extending the test piece to breaking point, and elongation at break was defined as tensile strain (expressed as a percentage increase of the test length, produced by tensile stress) at the breaking point.
Electrical conductivity determination
The ambient-temperature dc electrical conductivities of pure PAni.DBSA, vulcanised PECH and vulcanised PECH-PAni.DBSA blends were calculated from electrical resistance values measured by two- or 4-probe techniques. The equipment used was a Keithley 617 programmable electrometer and a Keithley 224 programmable current source, both under computer control. A pressed pellet of pure PAni.DBSA (diameter 13 mm, thickness 1.5 mm) was placed in a PTFE holder with four spring-loaded metallic contacts in order to measure its electrical conductivity.
For the 4-probe van der Pauw conductivity measurements, 25 samples of each PECH-PAni.DBSA blend were cut and mounted onto PTFE sheets (100 × 100 mm2). Fine copper wires 50 mm long were attached to the four corners of the samples using small silver paint contacts (Acheson Electrodag 915). Guarded 2-probe electrical measurements were performed for less-conductive samples (conductivity <10−7 S cm−1).
For the 4-probe technique,
25
electrical conductivities were calculated from the mean resistance values using the standard van der Pauw equation, equation (1).

The effect of strain on samples’ dc electrical conductivities was determined. For each blend, two test pieces (strips with dimensions 80 × 30 × 1 mm3) were prepared using a hot press to obtain a mean value. Test pieces were strained manually. Each cycle of the process consisted of strain loading and unloading (i.e., with sample stretched to 100% elongation and then returned to 0%). The resistance measurements in this part of work used the 2-probe method, which was appropriate because the sample resistances were high. Both opposite faces and edges of each test piece were coated with a large area of quick-drying silver paint (Acheson Electrodag 915) to minimize the resistance of the electrical contacts (Figure 3). Measurement setup (2-probe method) for the study of strain effects on the electrical conductivities of vulcanised PECH-PAni.DBSA samples.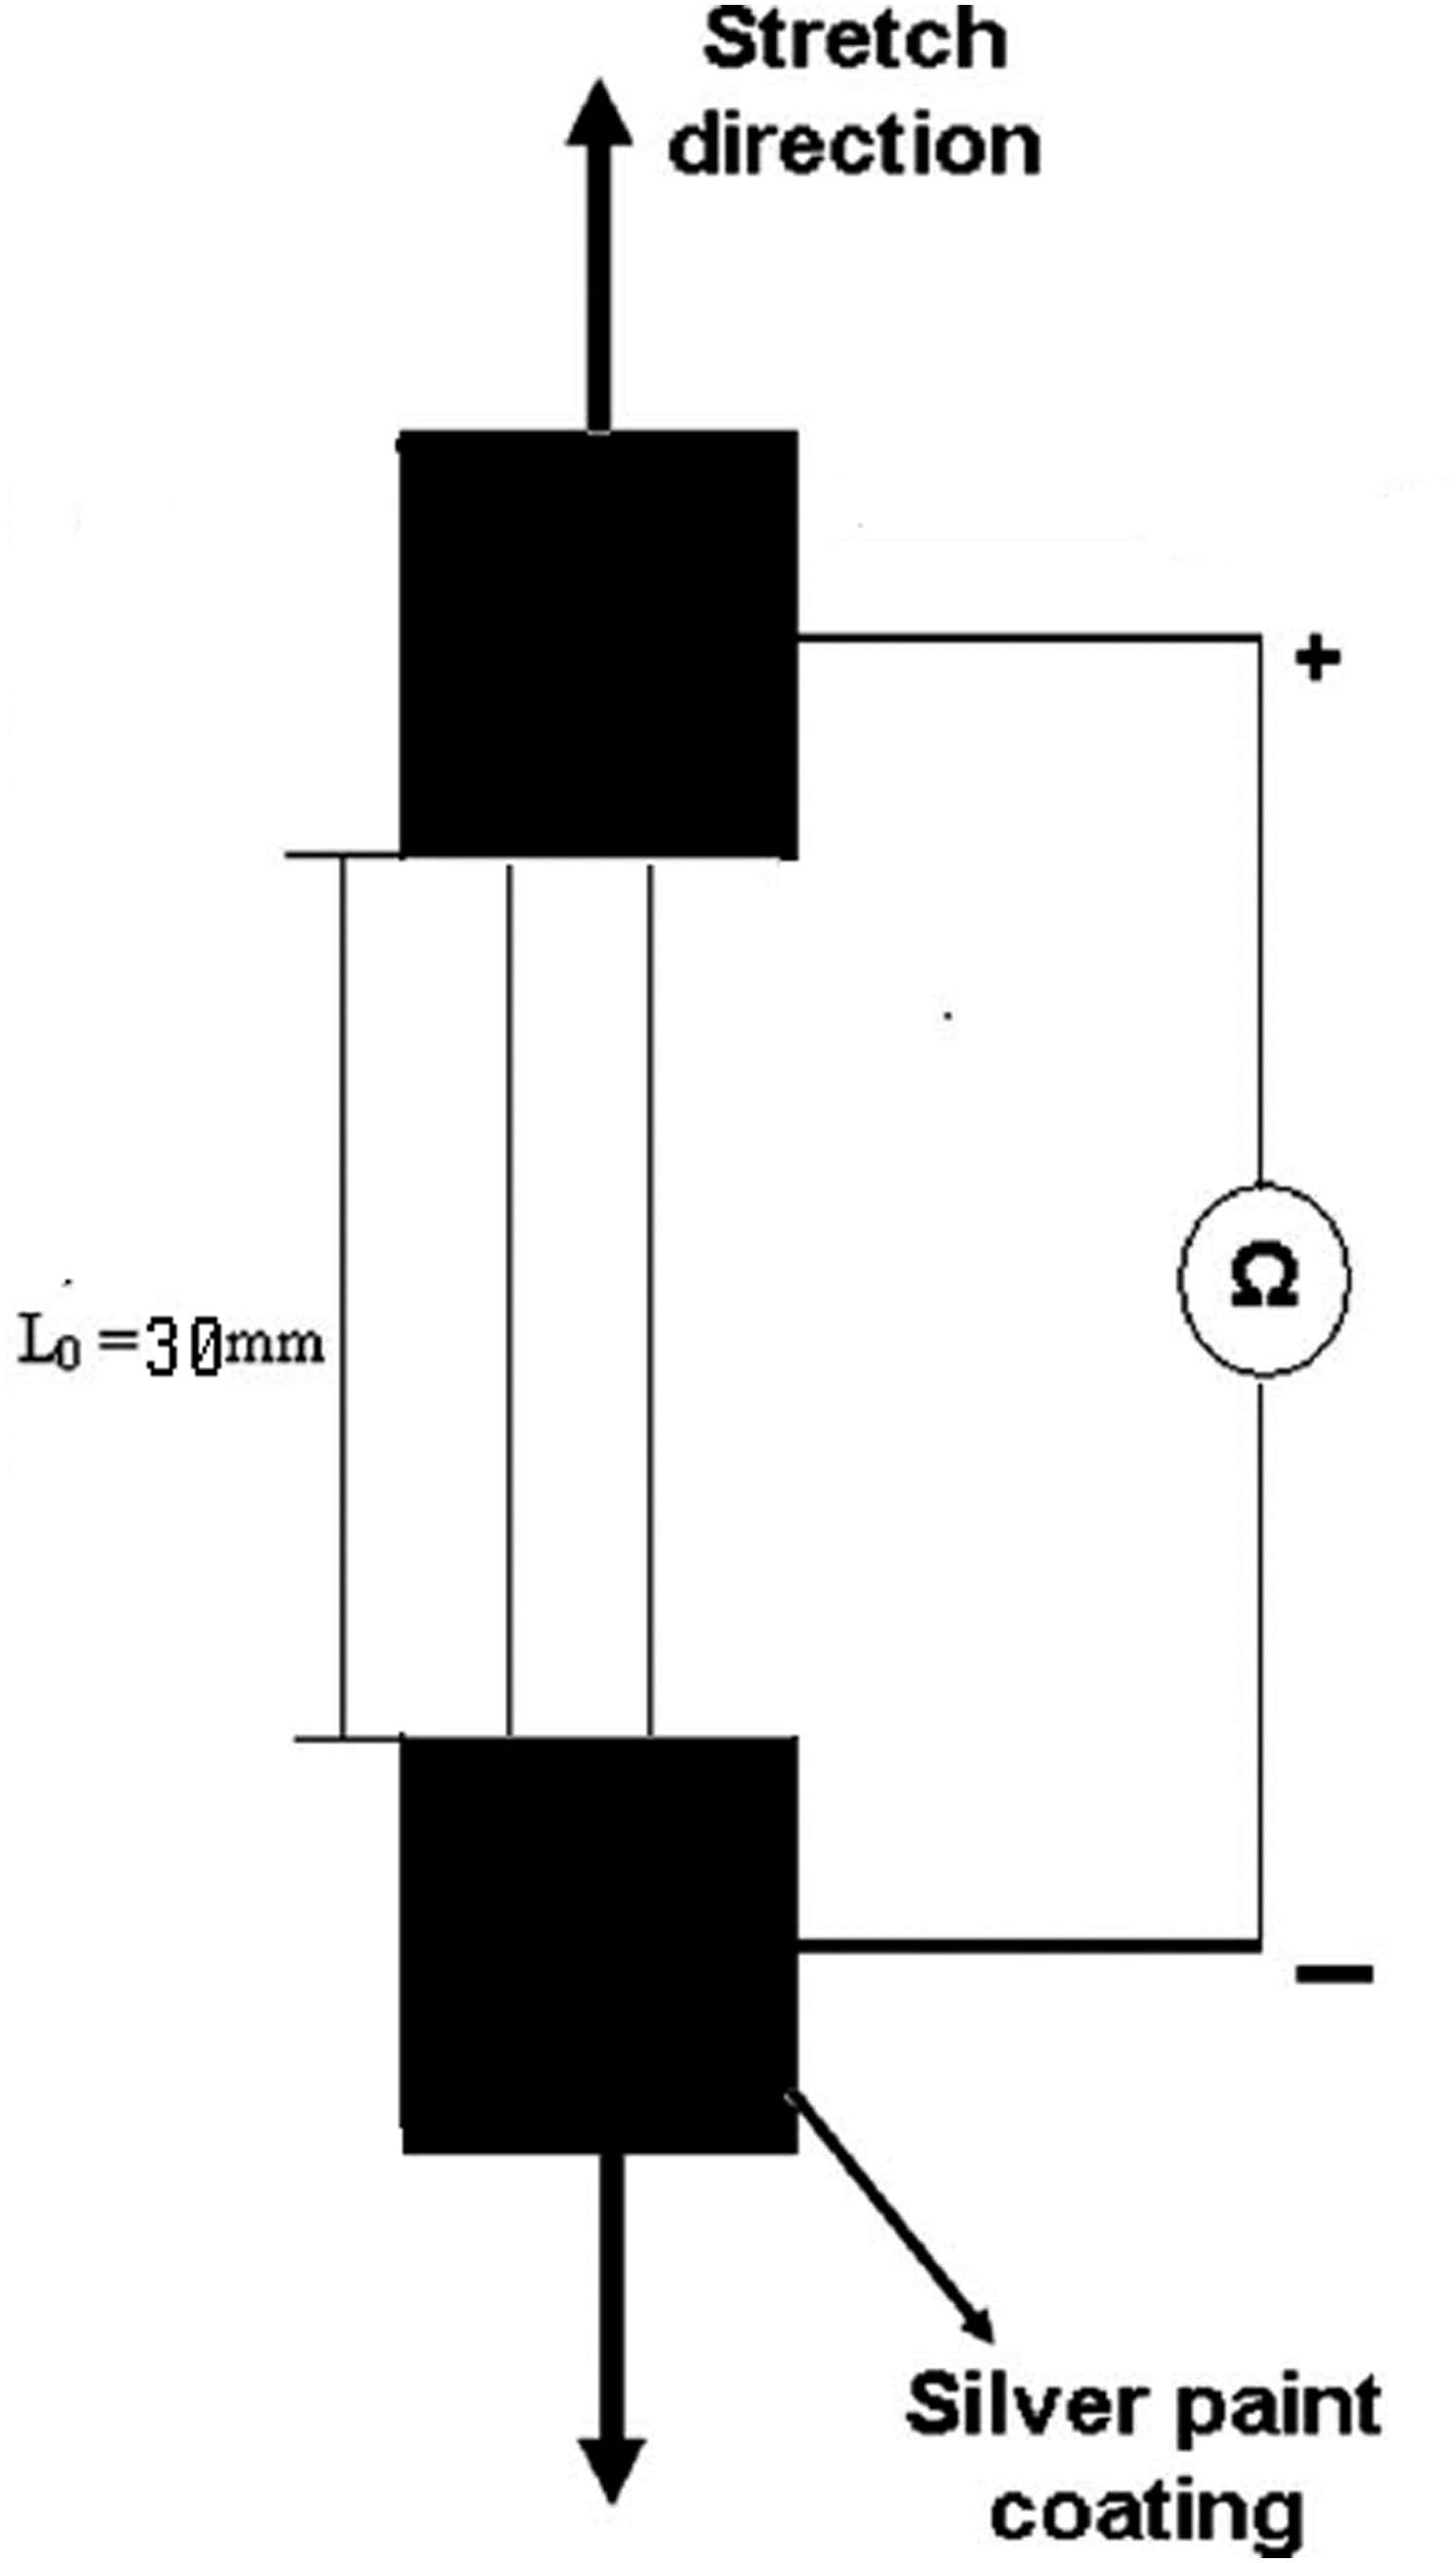
A fine copper wire with length 5 cm was attached to the middle of each side of these silver paint-coated areas for connection to the ohmmeter. All the contacting surfaces between the tensile tester and the test piece were appropriately insulated by a layer of PTFE sheet (1.0 mm thick). All readings were made 1 min after each elongation step to standardise the effect of stress relaxation. The length and thickness of samples were measured after each elongation step, in order to calculate the new conductivities correctly.
Results and discussion
Morphological structure (optical microscopy)
Optical microscopy was used to study microtomed thin film samples of all the vulcanised PECH-PAni.DBSA blends, but only images of blends containing 1, 5, 10 and 20 wt % of PAni.DBSA are shown in Figure 4. For all the micrographs, two distinct coloured regions were observed, viz. the pale yellow-green ones and the dark-coloured ones. Optical micrographs for the PECH-PAni.DBSA blends comprising (a) 99:1, (b) 95:5, (c) 90:10 and (d) 80:20 wt% PECH:PAni.DBSA. (Scale: Field width = 50 μm).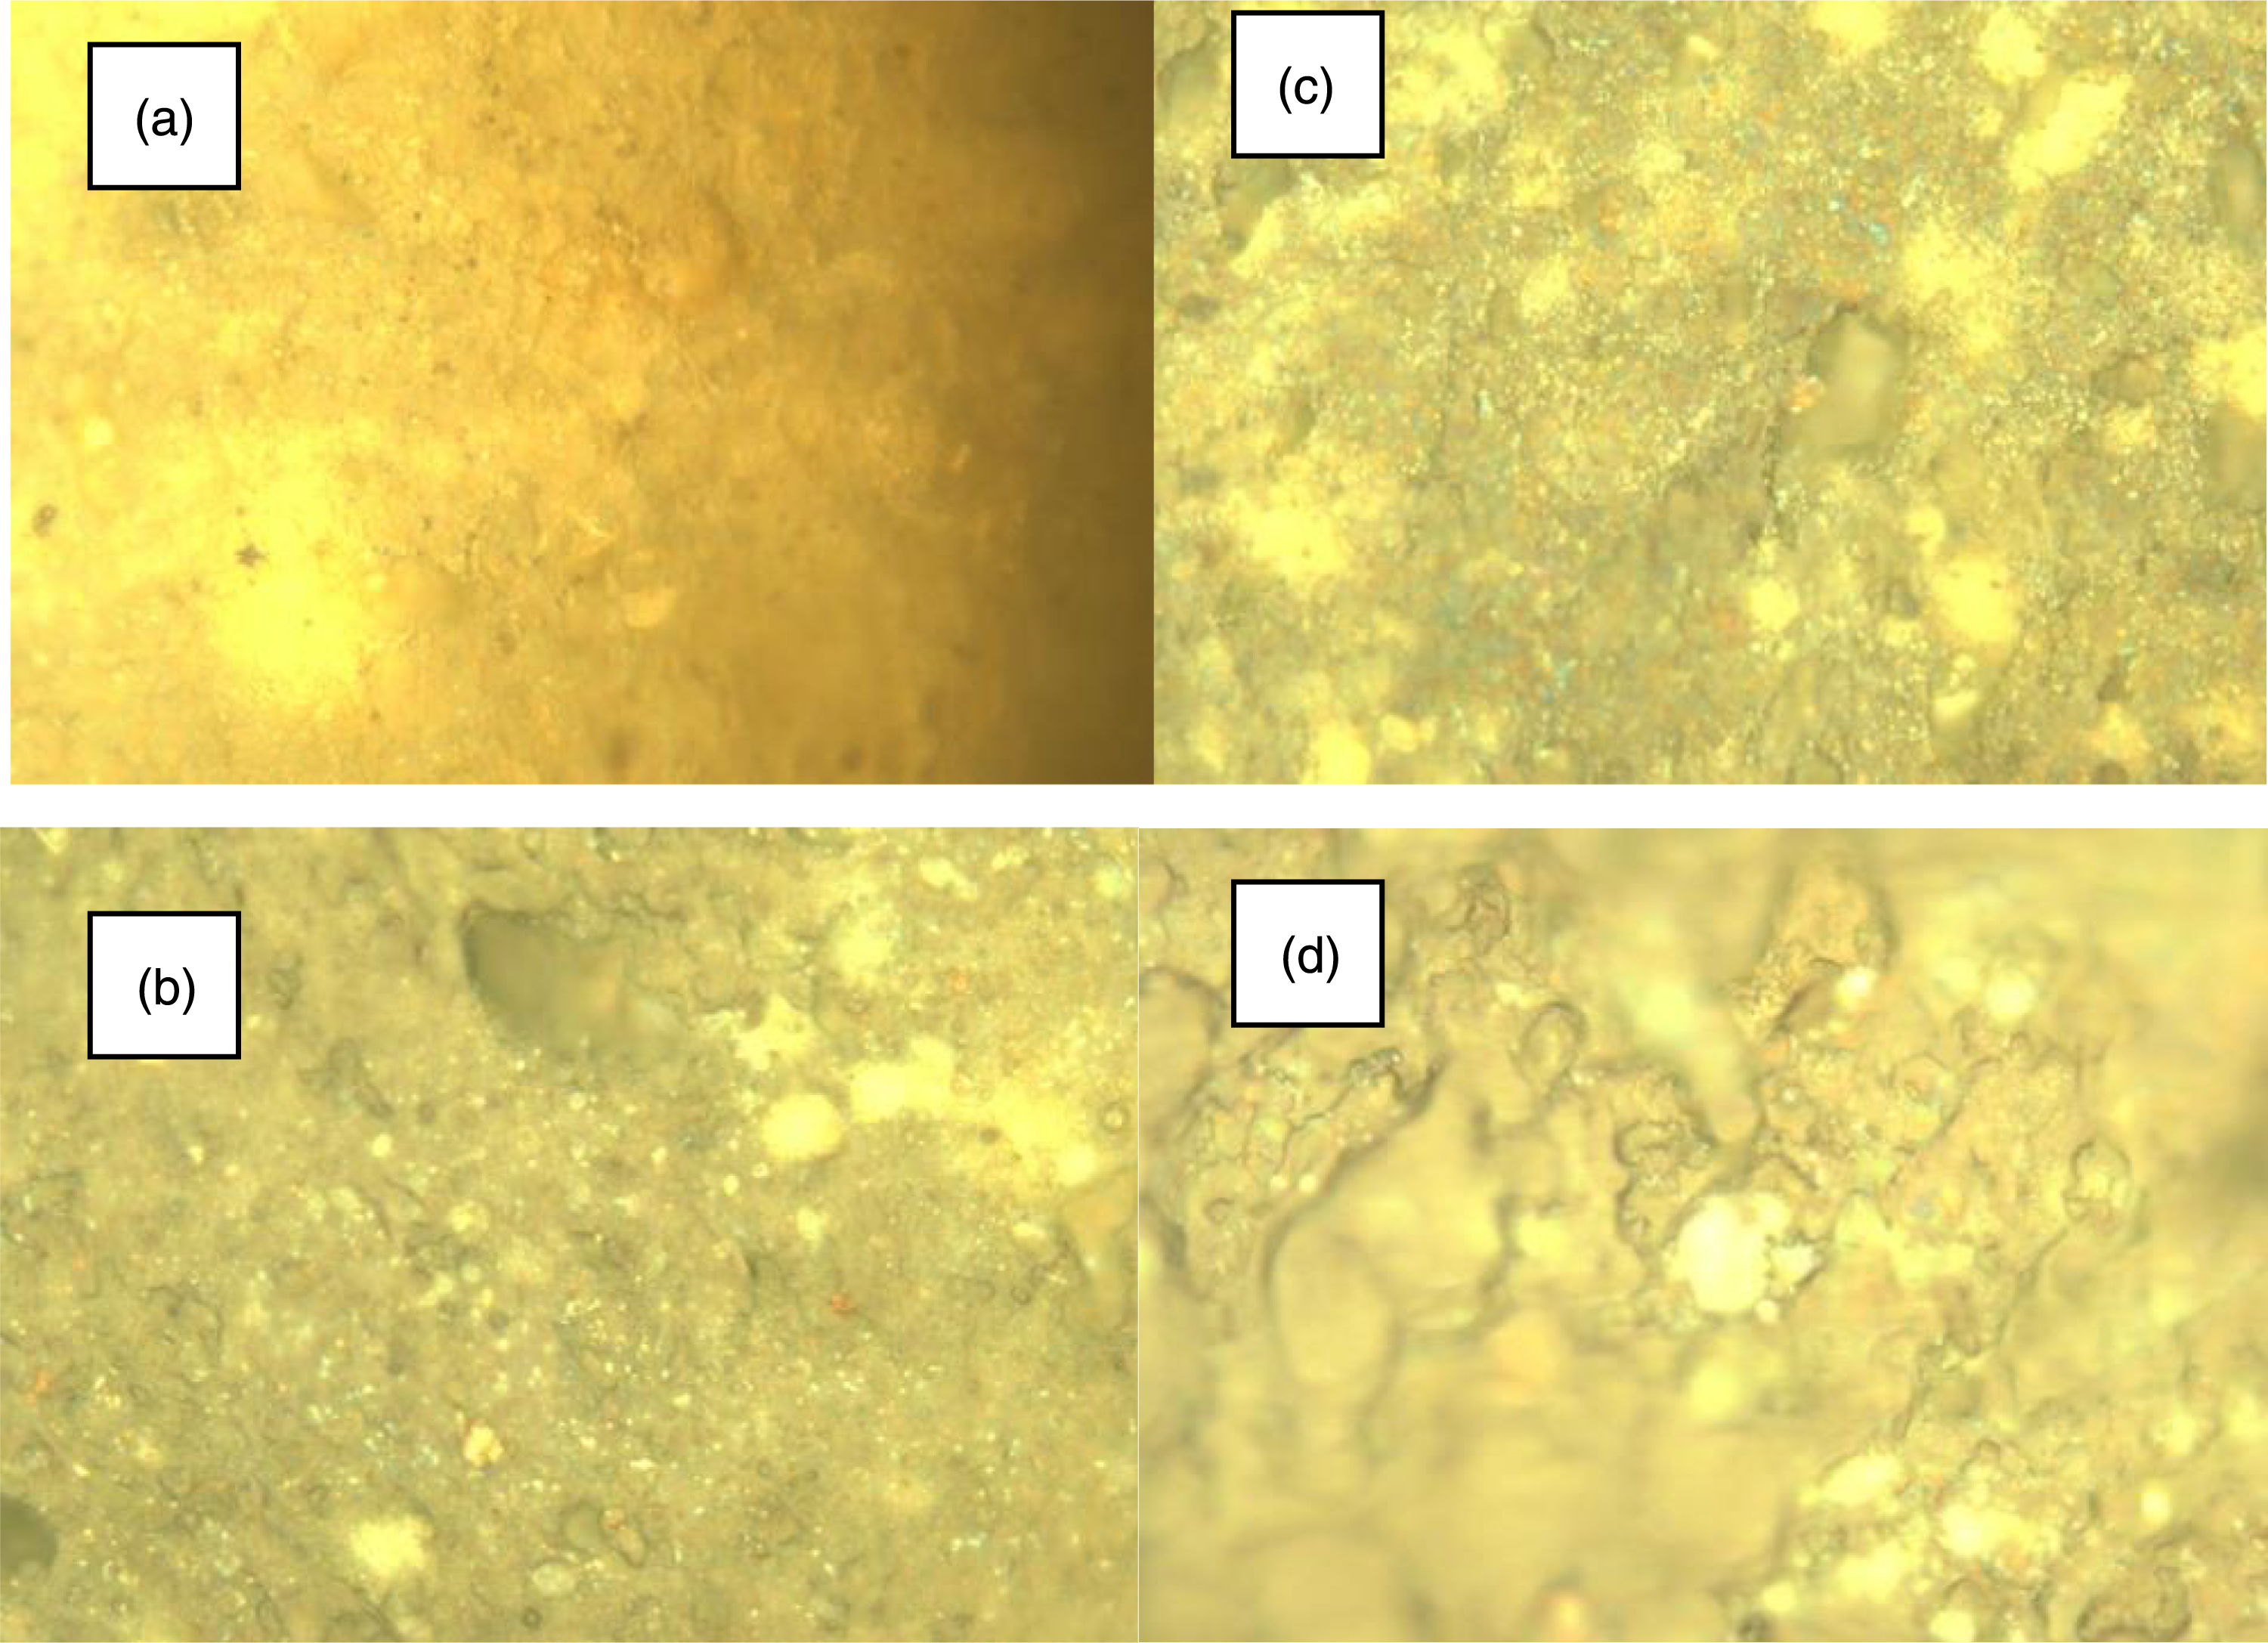
The globular regions (rich in PAni.DBSA) represent large conductive particles and their agglomerates, while the surrounding regions of PECH-PAni.DBSA are more homogeneous and richer in PECH); the discrete particles were observed to become more numerous and closely packed as the concentration of PAni.DBSA increased. Despite the presence of some larger, discrete particles in Figure 4(b), (c) and (d), it appeared that the two blended polymers were significantly compatible, and this observation is supported by the peak shifts observed in the FTIR spectra and the existence of a single Tg for each sample in the DSC thermal analysis [Infrared Spectroscopy and Differential scanning calorimetry]. The use of the internal mixer at high temperature produced numerous well-blended regions of PECH and PAni.DBSA, and it is thought likely that the electrical conductivity of the thermomechanically-mixed blends [DC Electrical Conductivity as a Function of PAni.DBSA Loading] was largely contributed by the conducting polymer in these well-blended regions.
Infrared spectroscopy
Infrared spectroscopy is a useful tool, not just for detecting chemical changes but also to reveal signs of possible interactions between different polymer molecules. Considering the chemical structures of polyaniline and polyepichlorohydrin, polar interactions and hydrogen bonding are likely to be observed (simply illustrated in Scheme 1). Simple illustration of possible hydrogen-bonding interactions (shown as orange lines) between the polymer components in a PECH-PAni.DBSA blend.
ATR-FTIR spectra for PAni.DBSA, vulcanised PECH and vulcanised blends with 5, 10, 20 and 40 wt % of PAni.DBSA are shown in Figure 5. Infrared spectra of (a) pure vulcanised PECH rubber; PECH-PAni.DBSA blends with (b) 5%, (c) 10%, (d) 20%, (e) 40% PAni-DBSA and (f) pure PAni.DBSA.
The spectra obtained from pure polyepichlorhydrin and pure PAni-DBSA are shown in Figure 5(a) and (f). The spectrum of pure PAni.DBSA cast film has characteristic absorptions at 3447 cm−1 (aromatic N-H stretching), 1559 cm−1 (N=quinoid=N), 1478 cm−1 (N_benzoid_N), 1295 cm−1 (quinoid=N_benzoid), 1240 cm−1 (C aromatic_N stretching) and 1030 cm−1 (S=O stretching). The FT-IR spectra of PECH-PAni.DBSA blends looked like a combination of the spectra of the pure materials, but with significant peak shifts due to changing intermolecular interactions between the polymers. The comparable presence of quinoid and benzoid vibrations indicates the emeraldine state of PAni. The band at 790 cm−1 was attributed to the out-of-plane bending mode of C-H, and the 878 cm−1 band was due to the para-linked polyaniline. The band at 2112 cm−1 may be assigned to the overtones of C-H (out of plane) bending. The peak at 2910 cm−1 corresponds to aliphatic stretching, and those in the region of 3212 and 3408 cm−1 are related to = N-H stretching.
The IR spectrum of pure vulcanised polyepichlorhydrin in Figure 5(a) shows a band at 750 cm−1 due to C-Cl stretching. The band at 1062 cm−1 was assigned to C-O-C stretching, and peaks at 1284, 1347, 1458 cm−1 correspond to aliphatic -CH2- bending. The band at 2906, 2973 cm−1 is due to aliphatic -CH- stretching.
As can be seen from the spectra in Figure 5(d) the intensity of the C-Cl band decreased when the percentage of PAni-DBSA increased (744 – 745) and it was shifted to higher wavenumber. The S = O stretching bands occurring at 1010 and 1030 cm−1, which are characteristic of PAni-DBSA, obviously intensified as the percentage of PAni-DBSA increased in the polymer blend. The –CH- stretching vibrations for the rubber were observed at 2900 and 2975 cm−1. It is clear from the spectra that as the PAni-DBSA content increased, the intensity of the S = O band at 1030 cm−1 increased and became more distinct, while the intensity of the N-H band at 3266-3285 cm−1 decreased.
X-ray diffraction analysis
The X-ray diffractograms of polyaniline dodecylbenzenesulfonate, pure vulcanised PECH and the PECH-PAni.DBSA blend with 10% of PAni-DBSA are shown in Figure 6. PAni.DBSA was found to have a partially-crystalline structure, and the strong diffraction peak at 2θ = 3° (corresponding to a large d-spacing of about 30 Å) relates to the lamellar structure of PAni.DBSA, in which the conjugated PAni backbones are packed into layers while the alkyl side-groups of DBSA act as spacers between the layers.26,27 As well as the crystalline phase, an amorphous component in PAni.DBSA is revealed by the broad peak at 2θ = 15–27°. XRD patterns of (a) PAni-DBSA, (b) PECH/PAni-DBSA containing 10 wt% of PAni-DBSA and (c) vulcanised PECH.
Figure 6(b) shows that the distinctive crystalline peaks of vulcanised polyepichlorhydrin were not retained in the blends, indicating that even a small concentration of PAni.DBSA strongly disrupted the molecular organisation of PECH.
The peak at 2θ = 3° due to the layered structure of PAni.DBSA is weaker and broader in PECH-PAni.DBSA, implying that much of the PAni.DBSA was well-distributed as smaller particles in the PECH matrix. The PAni.DBSA aggregates probably also contain some PECH. 20
Thermal analysis
Thermogravimetric analysis (TG)
Figure 7 compares the thermogravimetric traces under N2 atmosphere for PAni.DBSA, pure vulcanised polyepichlorhydrin rubber and their blends. The PAni.DBSA curve shows a large mass loss at 220–400°C, attributable to dopant vaporisation and the start of some main-chain degradation.
23
At 400°C, typically for aromatic polymers, PAni.DBSA left a residue, probably corresponding to carbon-rich char products.
23
Thermogravimetric curves of (a) PAni.DBSA, vulcanised blends containing (b) 40%, (c) 20%, (d) 10% PAni.DBSA, and (e) pure vulcanised PECH.
The curve for vulcanised polyepichlorhydrin reveals a large mass loss, mainly in the range 330–350°C, corresponding to dehydrochlorination and loss of -CH2Cl units. 28 Comparing the thermograms of the blends with that of pure PECH, one can observe delayed mass-losses for polyepichlorhydrin chain degradation 28 mainly in the range 350–385°C. It is noteworthy that the presence of each polymer in the blends retards the decomposition of the other polymer; it may be proposed that the degradation of PECH is retarded by the radical-scavenging ability of the amine groups in polyaniline, while the PAni.DBSA may be stabilised by the PECH matrix hindering the loss of DBSA dopant by vaporisation.
Differential scanning calorimetry
Figure 8 shows the DSC thermograms for PAni.DBSA, pure vulcanised PECH and their blends. Again, the blend thermograms show combinations of features observed for pure vulcanised PECH and PAni.DBSA, with some temperature shifts with respect to the corresponding processes in the pure polymers. DSC thermograms for PAni.DBSA, pure vulcanised PECH and their blends of various compositions (wt.% PECH: PAni.DBSA).
Pure PAni.DBSA shows a glass-transition at around 120°C, 11 and a broad endotherm at 270–400°C corresponding to the dedoping (DBSA loss) observed in the TG data. This strong feature makes it difficult to analyse the thermal events in the vulcanized blends, especially since pure PECH shows a series of two endothermic peaks and one exotherm between 250 and 350°C. All the polymer samples were stable until at least 250°C.
The mean onset temperature values of the major exotherm in the above-ambient temperature DSC thermograms of pure vulcanised PECH and PECH-PAni.DBSA blends.

Thermomechanical analysis (TMA)
Glass transition temperatures (Tg) of pure PECH elastomer and the blends.
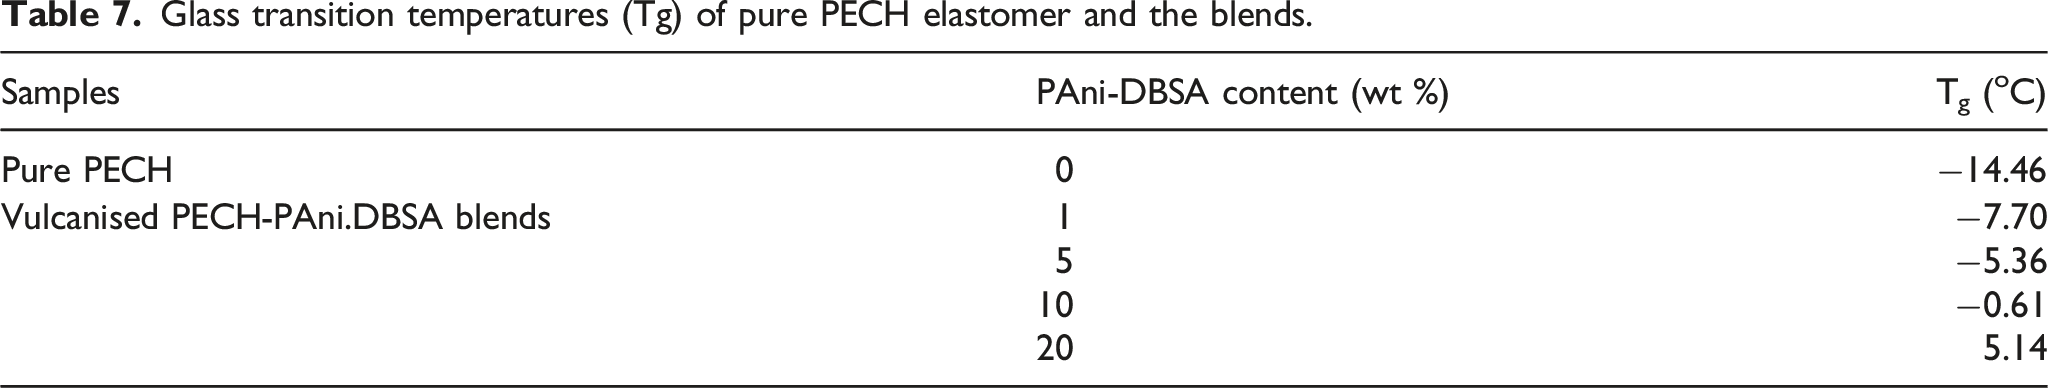
Only a single glass transition was observed for each blend, and the Tg values of the various blends were shifted monotonically to higher temperatures with increasing PAni-DBSA content. This glass transition temperature trend indicates good compatibility between PAni.DBSA and PECH in the vulcanised blends.
Tensile properties
Force-displacement cycling and energy loss
Figure 9 illustrates the results of the stress-strain tests in terms of the Young’s modulus (E) of vulcanised PECH and PECH-PAni.DBSA blends. Young’s modulus of pure vulcanised PECH and PECH-PAni.DBSA blends.
Pure PAni.DBSA is a relatively inflexible polymer because of the conjugated PAni backbone and its strong electrostatic interactions with the DBSA dopant.
The initial Young’s modulus values undergo a slight decrease between 1 and 5 wt% PAni.DBSA, and a monotonic increase between 5 and 20 wt%. This is attributed to partial miscibility and plasticisation of PECH at low PAni.DBSA concentration, followed by the rigid PAni.DBSA particles acting as a reinforcing filler above 5 wt.% loading.
Mechanical energy storage and loss measurement
When a rubber is stretched and released, some mechanical energy is lost as heat, and the region between the tensile testing curves for extension and release is the energy lost per unit volume. A tensile testing machine was used to determine energy loss over one cycle, using standard dogbone-shaped test specimens cut from the vulcanised materials. The maximum cycle load (Fc) was Fc = 0.85(Fmax) where Fmax is the breaking force, obtained from previous tensile tests. The data presented in Figure 10(a) were used to calculate the energy loss values shown in Figure 10(b). (a) Comparison of load-displacement curves for vulcanisates with various proportions of PAni.DBSA, (b) Heat energy loss of blends with different %wt. PAni.DBSA.
Figure 10(b) shows that, as the proportion of PAni.DBSA increased, the energy loss of the materials increased. The onset of significant loss appeared to occur at about 4–5 wt.%.
Elongation of vulcanised samples under tension
The elongation of the tensile samples at break (Figure 11) shows a slight decrease up to 1 wt.% of PAni.DBSA and a sudden increase between 5 and 10 wt.%, followed by a rapid decrease up to 20 wt.% and a slow decline to a slightly lower value at 40 wt%. This has been observed in other blends of PAni.DBSA with elastomers,
21
and was attributed to initial plasticisation followed by reinforcement and then weakening due to the presence of larger PAni.DBSA aggregates acting as stress-raisers. Elongation at break values for samples with different proportions of PAni.DBSA.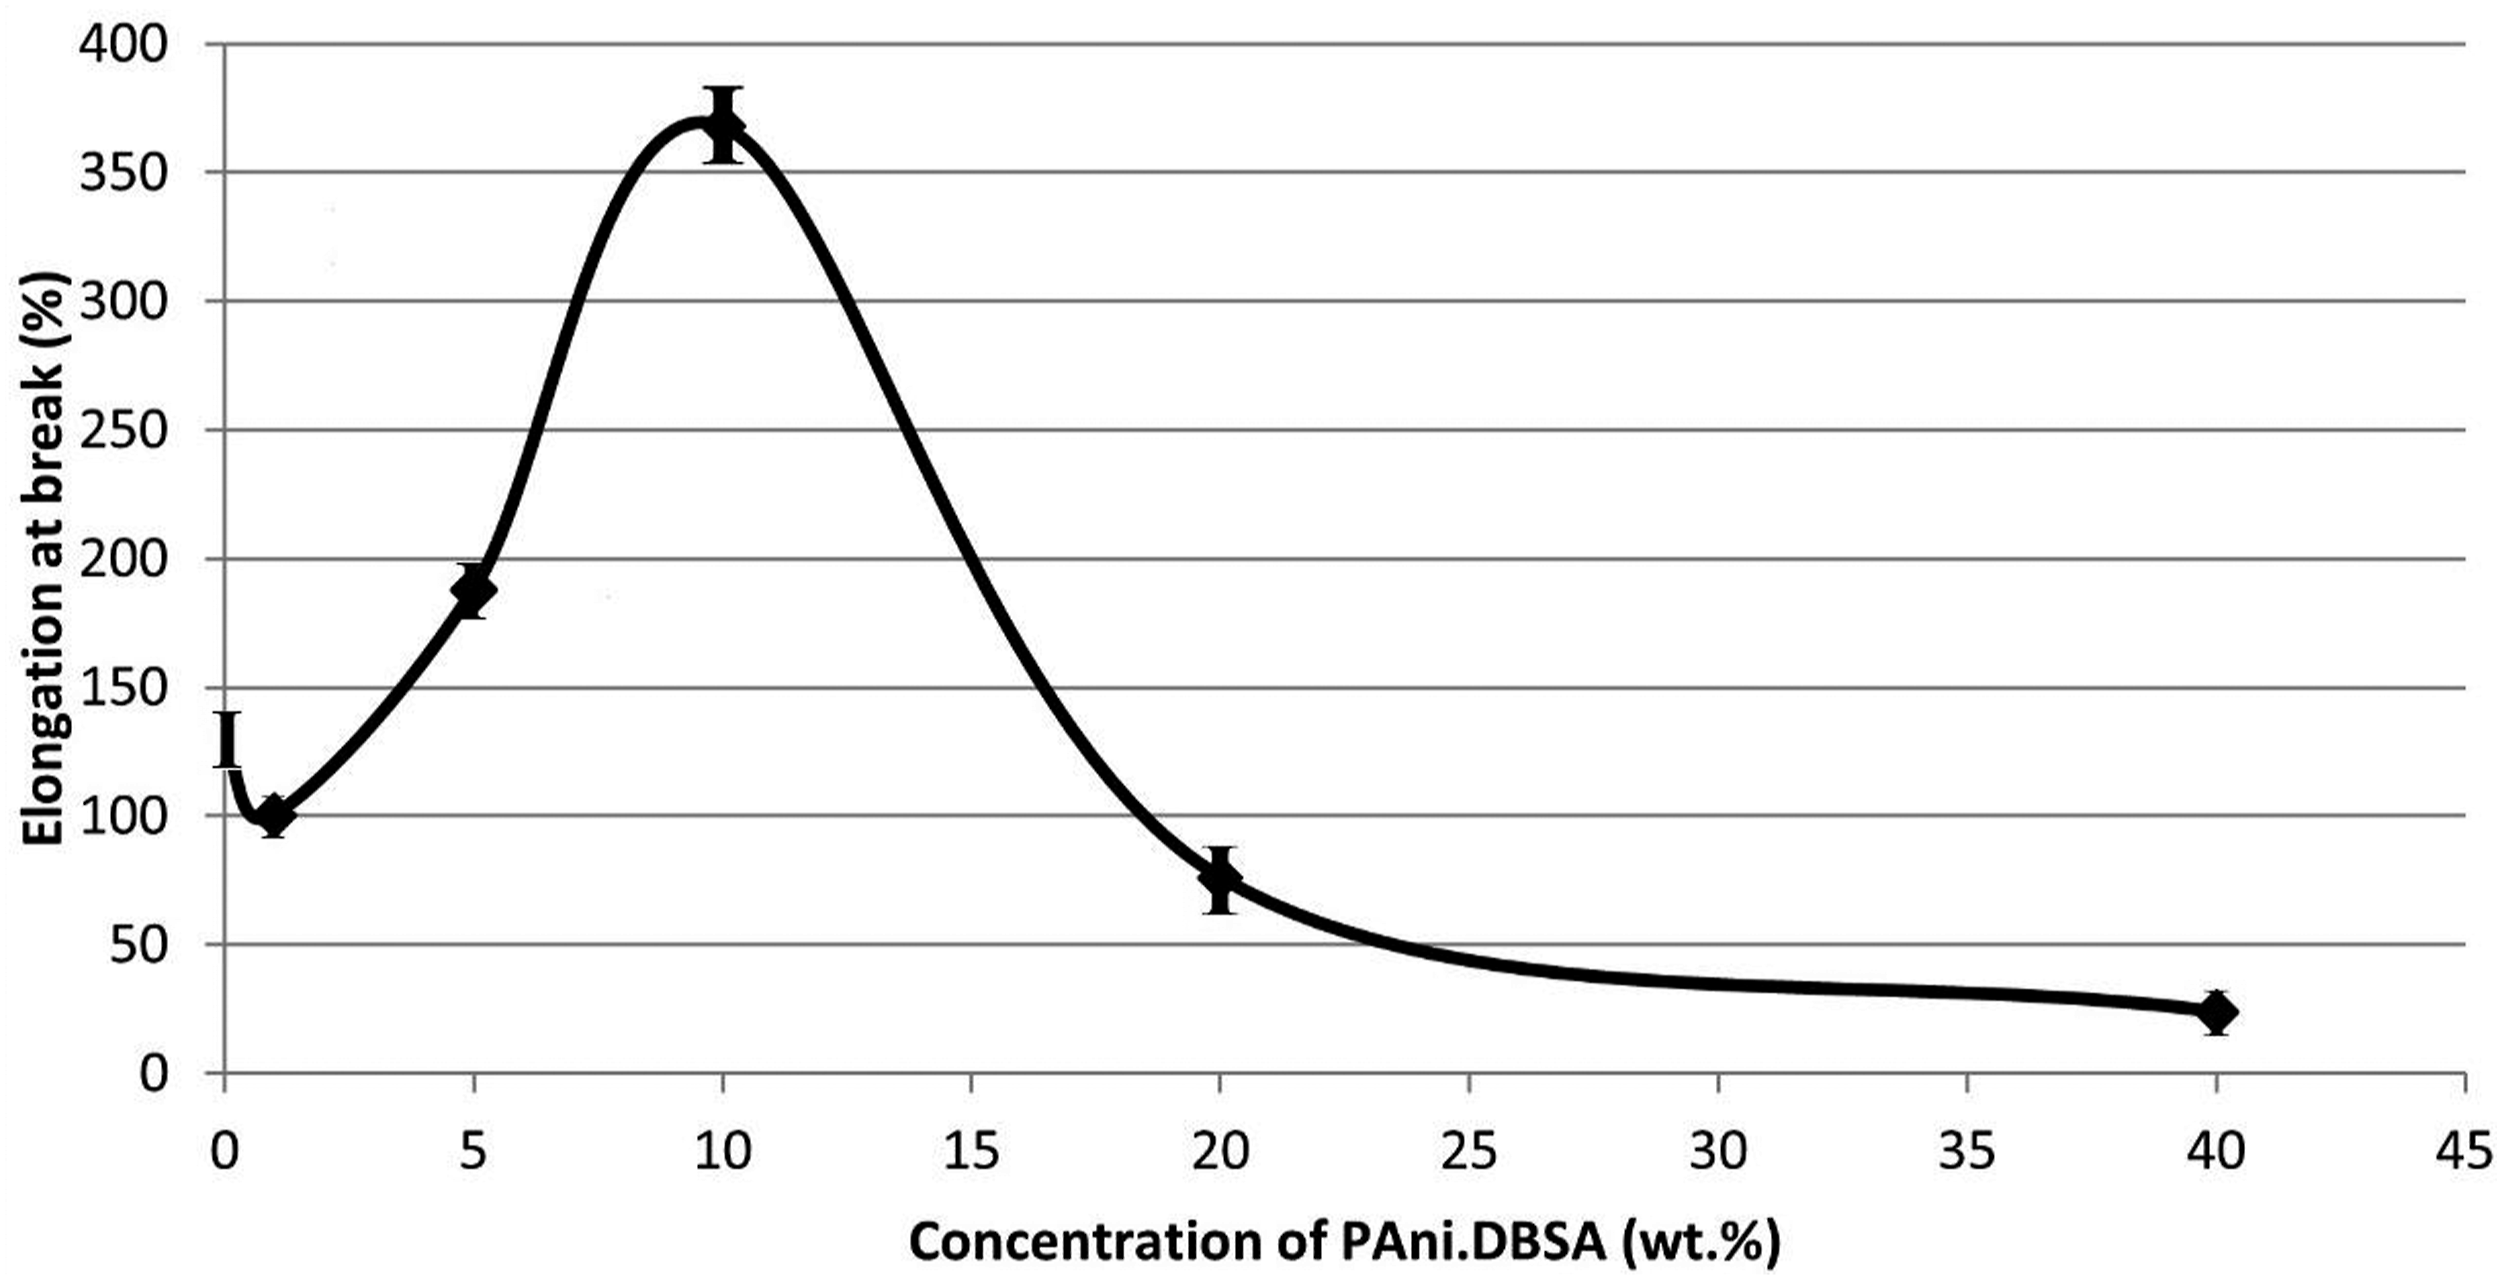
Electrical conductivity determination
DC electrical conductivity as a function of PAni.DBSA loading
Figure 12(a) shows the electrical conductivities of unvulcanised PECH and unvulcanised PECH-PAni.DBSA blends. The calculated electrical conductivities of vulcanised samples are shown in Figure 12(b). (a) DC electrical conductivities of unvulcanised PECH-PAni.DBSA blends as a function of PAni.DBSA contents (Data from Ref. (23).), (b) Electrical conductivities of vulcanised PECH-PAni.DBSA blends as a function of PAni.DBSA contents in this work.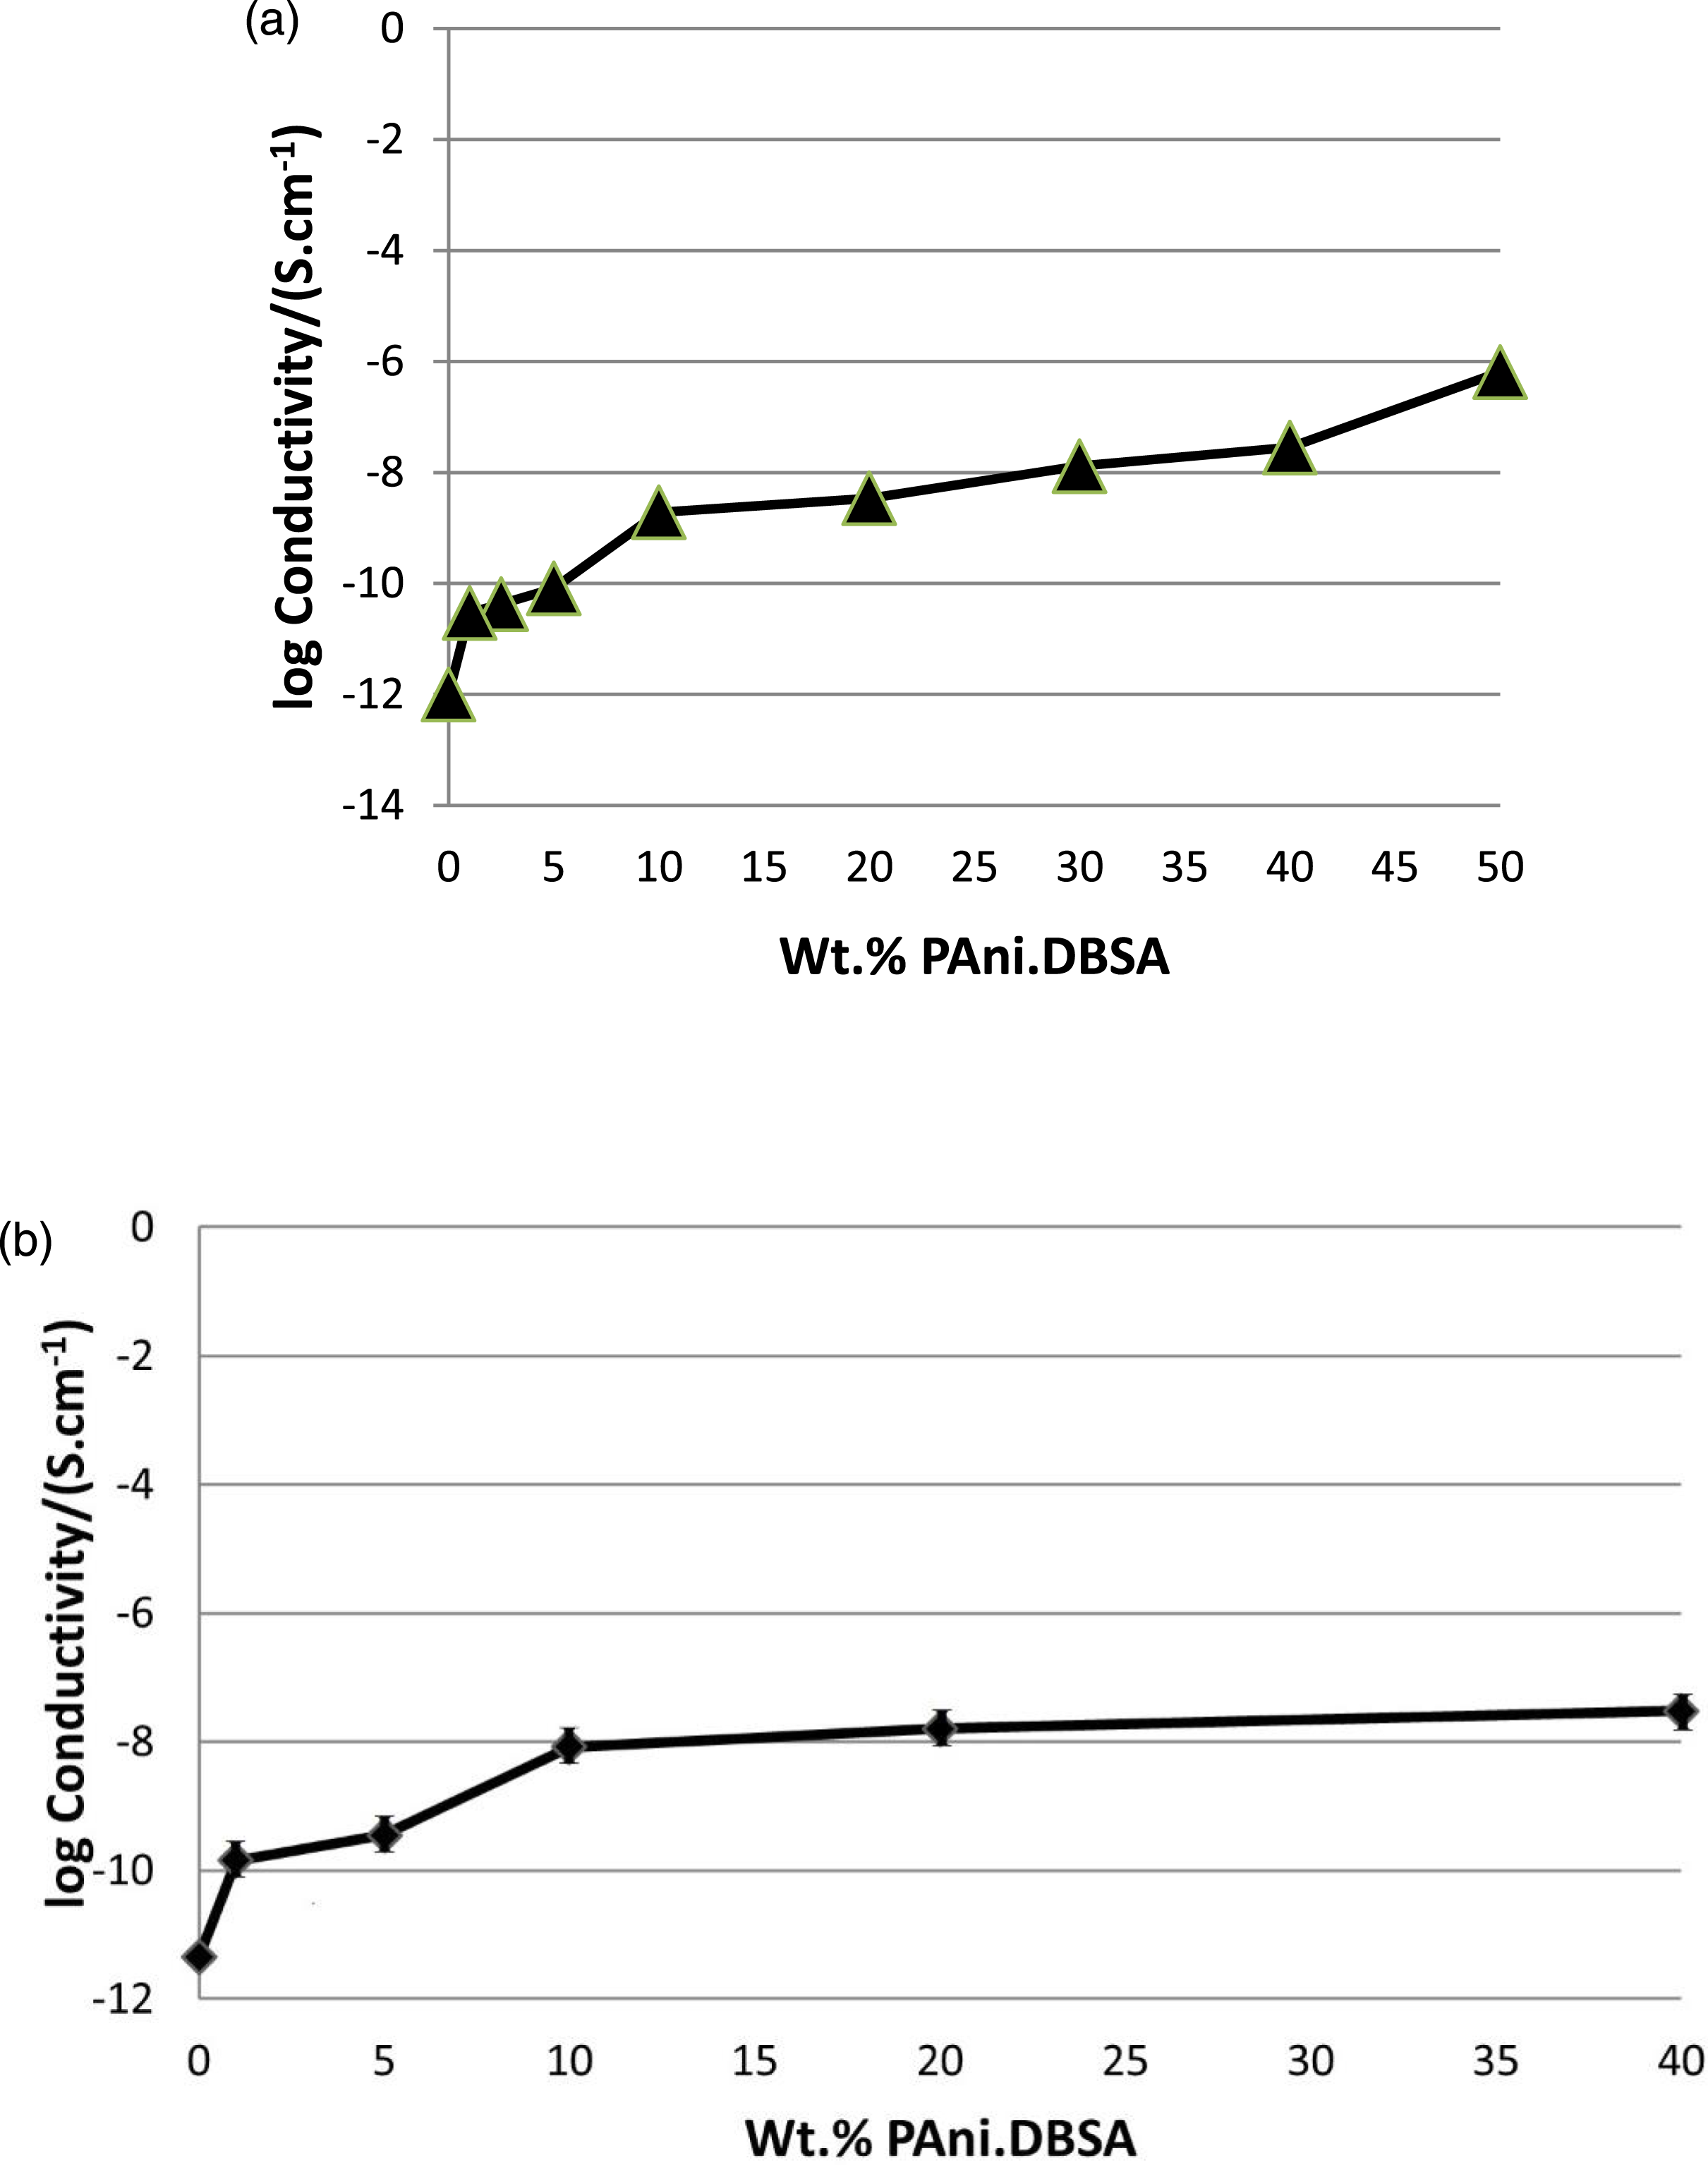
Both unvulcanised and vulcanised pure PECH showed electrical conductivities of the order of 10−12 S cm−1 and are considered as insulators. Pure PAni.DBSA (cold-pressed pellet) had a much higher conductivity of 1.2 S cm−1, but no comparable value was achieved in the blends. The modest electrical conductivities of all the blends (both vulcanised and unvulcanised) increased with the proportion of PAni.DBSA, as observed in several previous studies of PAni.DBSA blends.20–23 Both vulcanised and unvulcanised blends reached electrical conductivities of the order of 10−8 S cm−1 with about 20 wt.% PAni.DBSA. The data from Figure 12(a) were fitted to a simple percolation model as defined by equation (3) to estimate the conductivity percolation threshold for the unvulcanised blends. A plot of log electrical conductivity (σ) versus log (fp) was used to estimate the values of critical exponent (t) and correlation coefficient (R). The estimated electrical conductivity percolation threshold for the unvulcanised blends was 1.0 wt % (or 1.3 vol %) of PAni.DBSA (with t = 2.21 and R = 0.95).
The conductivity percolation threshold for vulcanised PECH-PAni.DBSA blends was estimated by fitting the data from Figure 12(b) to the same percolation model. The estimated electrical conductivity percolation threshold for the vulcanised PECH-PAni.DBSA blends was 1.0 wt % (or 1.07 vol %) of PAni.DBSA (with t = 0.41 and R = 0.90).
It is also noticeable that the conductivities of the PECH-PAni.DBSA blends were not adversely affected by using Zisnet-F as vulcanizing agent since the unvulcanised and vulcanised blends had very similar conductivity values at the same compositions.
Effect of strain on dc electrical conductivities
The electrical conductivities of the vulcanised elastomer blends were measured in situ after stretching them. Graphs of log conductivity versus strain for the blends with 1, 5 and 10 wt.% PAni.DBSA are shown in Figure 13, and the results show a reversible increase in conductivity as the strain increases. Plots of log electrical conductivity versus strain for vulcanised PECH/PAni.DBSA blends, containing (a) 1 wt.%, (b) 5 wt.% and (c) 10 wt% of PAni.DBSA.
Yamaguchi et al.
29
proposed that the alignment and electrical properties of a particulate carbon-rubber composite may be described by a theory considering the shape and dispersion of conductive particle aggregates. If the aggregates are all spherical and equally spaced, under a uniform strain field they will deform ideally as in Figure 14(a). Consequently the electrical conductivity will decrease with extension in the direction of strain as the conductive aggregates become more separated. In this case, there should be a concomitant increase in the conductivity of the elastomer in the perpendicular direction as all the conductive particles drew nearer together; this is not in accord with the work of Deeprasertkul
30
who observed an initial decrease in conductivity in the direction perpendicular to the strain vector. Schematics of the movement of particle aggregates and their orientation under load: (a) spherical aggregates evenly spaced, (b) spherical aggregates randomly spaced, and (c) anisotropic aggregates, randomly spaced. (Reproduced from ref. 29, with permission. © 2003 Wiley Periodicals, Inc.).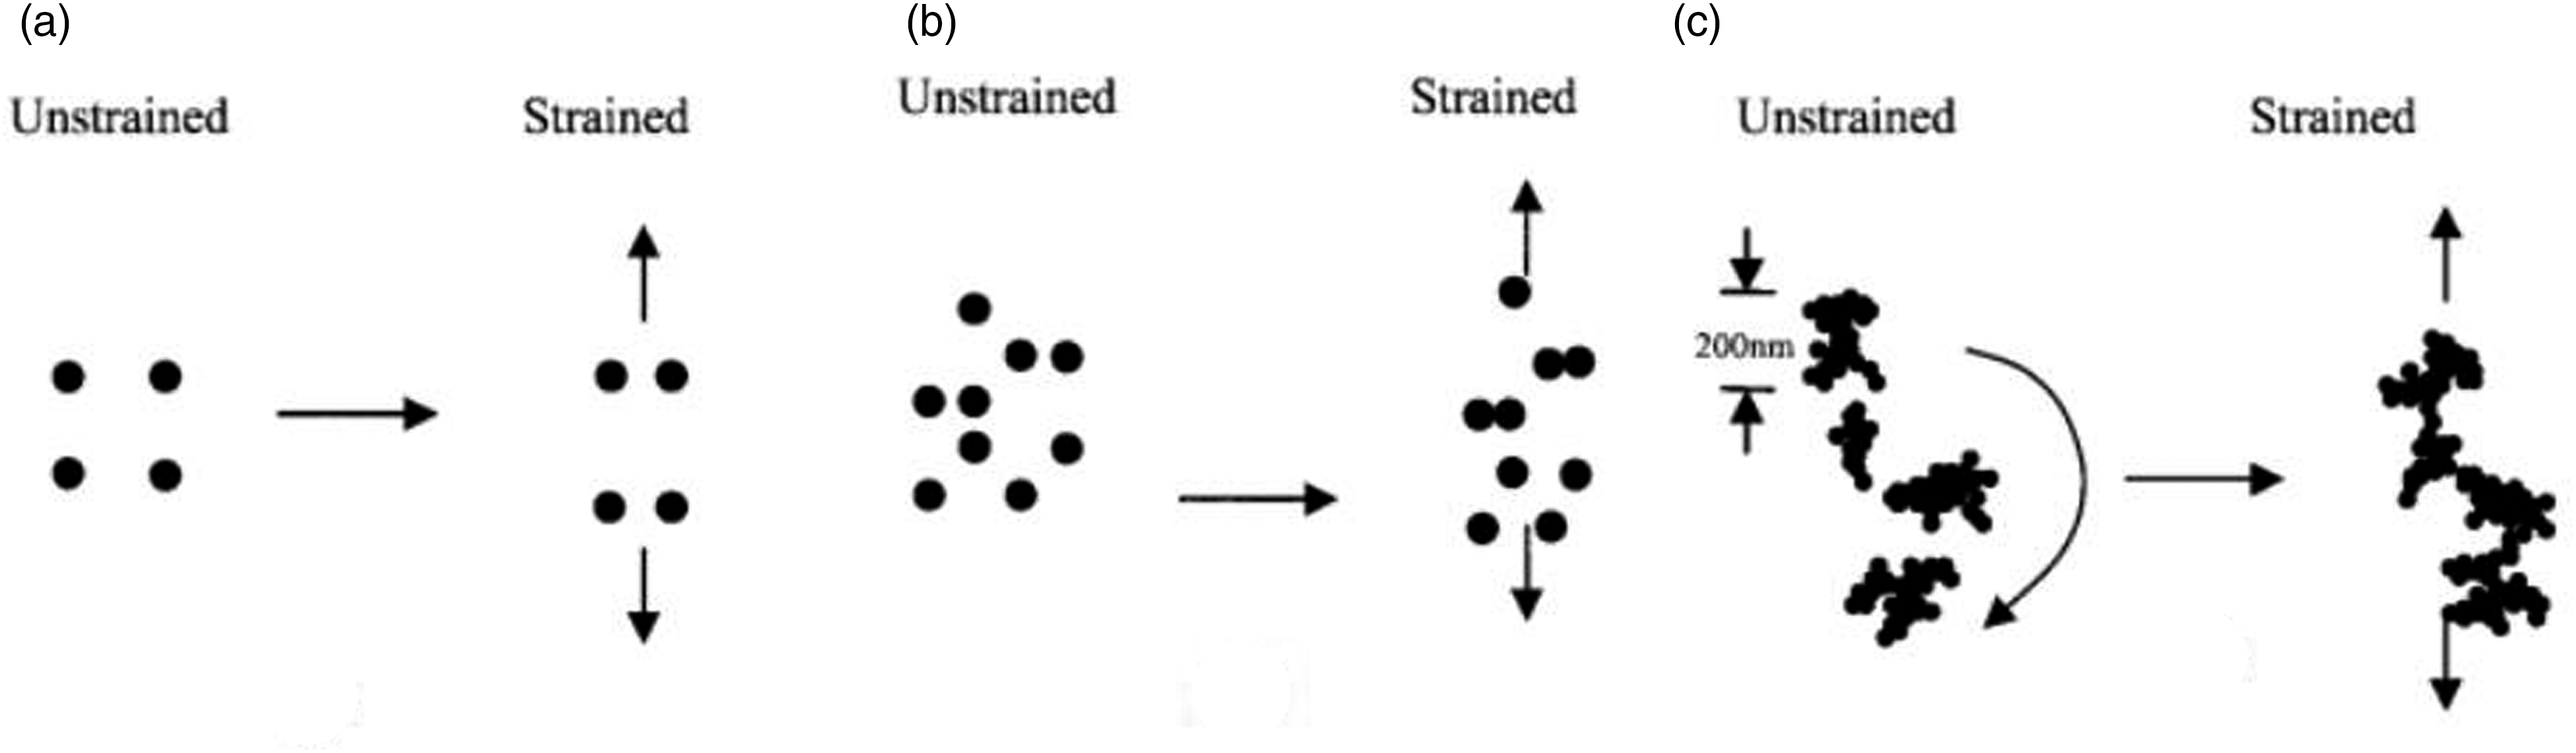
A possible alternative model with spherical but randomly-distributed aggregate particles is predicted to behave differently to an ordered and regular lattice structure under strain, as the random clustering of the aggregates would lead to varying stresses throughout the polymer matrix under tension (Figure 14(b)).
This type of deformation would still result in decreased conductivity with strain, as measured in the direction of the extension, due to the greater levels of phase separation among the two constituent materials. However, if the aggregates are not approximately spherical, the branching of particles creates an assembly with a series of dimensions in various directions.31,32
A probable consequence of this is that the shape of the particles effects a net movement of the particle aggregates under strain and causes them to undergo some rotation. These rotations may result in a significant alignment of the conductive particle aggregates, as displayed in Figure 14(c), which could lead to increased bulk conductivity under tension.
In the present work, it is possible that the realignment of discrete PAni.DBSA particles in the phase-separated areas gave rise to the results shown in Figure 13. At a strain value of 0.5, the conductivities of the blends with 1, 5 and 10 wt.% PAni.DBSA increased by factors of 2.3, 2.8 and 11.2, respectively. The 10 wt.% sample is above the percolation threshold, and it is proposed that a major part of the conductivity comes from the phase-separated regions rich in PAni.DBSA; hence its greater sensitivity to the effects of strain. For the 1 and 5 wt.% samples, more of the conducting polymer is homogeneously dispersed in the elastomer matrix, so the conductivity is only weakly affected by the applied strain.
The effects of alignment and the increase of connections and interactions amongst conductive filler particles in phase-separated regions have also been discussed in refs.33,34,35
Determination of crosslinking density
The force versus extension data for PECH and PECH-PAni.DBSA vulcanisates were analysed in order to make a preliminary estimate of the crosslinking density in each blend formulation. Details of the analysis are given in the Supplementary Information for this article, but the results are also summarised here in Figure 15. It is noticeable that the calculated crosslink densities decreased remarkably with increasing proportion of PAni.DBSA, and this is again thought to be attributable to the -N-H hydrogens of polyaniline tending to react with the free-radicals involved in crosslinking. Surprisingly, the loss of crosslinking density did not cause a loss of rigidity in the polymer blends (we have seen in Force-Displacement Cycling and Energy Loss that the modulus actually increases due to the reinforcing effects of the PAni.DBSA particles at higher concentration), but it may well be contributing to the drastic decline in elongation at break above 10% PAni.DBSA (Elongation of Vulcanised Samples Under Tension). Crosslink densities of vulcanized PECH and PECH-PAni.DBSA blends as a function of PAni.DBSA content.
Conclusion
In this work, new elastomeric blends of PECH and PAni.DBSA were prepared by thermomechanical mixing and it was found that the use of Zisnet F as the crosslinking agent did not deteriorate the electrical properties of PECH-PAni.DBSA blends in comparison with unvulcanised blends previously produced by solution mixing. The vulcanised blends reached a conductivity of the order of 10−8 S cm−1 with about 10 wt.% PAni.DBSA. Although too low for use in prime conductors, this conductivity is sufficient for applications in flexible sensors or actuators, antistatic seals, strain gauges and some medical electronic devices.7,18,36,37
The estimated conductivity percolation threshold for vulcanised PECH-PAni.DBSA blends was 1 wt % (or 1.07 vol %) of PAni.DBSA, but another stage of percolation was observed at about 5 wt.%, above which a significant amount of the polyaniline was present as a separate phase. This is consistent with previous results on unvulcanised PAni.DBSA blends.20,21,23
Low-temperature TMA data for the polymer blends showed a single glass-transition for each blend, indicating homogeneous behaviour in the rubber-rich phase. The structure and morphology of the blends were studied by using ATR-IR spectroscopy and optical microscopy. The IR data indicated changing intermolecular interactions with concentration, evidenced by a shift of the N-H stretching peak of PAni.DBSA to a higher wavenumber.
The polyaniline concentration affected mechanical and conductive properties of the blends. The initial modulus shows a slight decline up to 5 wt.% PAni.DBSA due to intimate mixing of the two polymers, and a monotonic increase between 5 and 20 wt% PAni.DBSA, attributed to reinforcement of the PECH by discrete particles of PAni.DBSA. The mechanical energy loss of the materials increased strongly above a threshold of about 5%. The proportion of PAni.DBSA also had a significant influence on the crosslinking density of the elastomeric products, which was ascribed to radical scavenging by the amine groups in the conducting polymer.
Future work on the novel blends in this article should certainly include further, high-resolution microscopic analysis and dynamic thermomechanical analysis. Dielectric thermal analysis and electron paramagnetic resonance spectroscopy would also be powerful techniques to probe the state of the conducting polymer component in the blends.
Supplemental Material
Supplemental Material - A mechanical, thermal and electrical properties study of novel vulcanised blends of poly(epichlorohydrin) elastomer with polyaniline dodecylbenzenesulfonate
Supplemental Material for A mechanical, thermal and electrical properties study of novel vulcanised blends of poly(epichlorohydrin) elastomer with polyaniline dodecylbenzenesulfonate by Elaheh Bakhtiarian and Peter JS Foot in Polymers and Polymer Composites
Footnotes
Acknowledgements
We thank the Islamic Azad University for supporting the work of E.B. We are also very grateful to Dr Ahmed Farid (Artis Consulting, Melksham, and formerly at London Metropolitan University) for providing valuable advice and some facilities for this work.
Declaration of conflicting interests
The author(s) declared no potential conflicts of interest with respect to the research, authorship, and/or publication of this article.
Funding
The author(s) received no financial support for the research, authorship, and/or publication of this article.
Supplemental Material
The Supplementary Material for this article is available online.
References
Supplementary Material
Please find the following supplemental material available below.
For Open Access articles published under a Creative Commons License, all supplemental material carries the same license as the article it is associated with.
For non-Open Access articles published, all supplemental material carries a non-exclusive license, and permission requests for re-use of supplemental material or any part of supplemental material shall be sent directly to the copyright owner as specified in the copyright notice associated with the article.