
Abstract
To achieve short cycle times, CF/PEEK tape preforms are laid up quickly in ATL, thus tape preforms are only partially consolidated. Different gas volume flows are set to vary the energy input during tape laying at 1 m/s. The tape preforms are characterized by means of thickness measurements, microsection analysis, peel-test, compression thermal analysis and flexural test to assess the degree of consolidation. Subsequently to ATL, tape preforms are processed in stamp forming at different pressure settings in a rapid-closing downstroke press. The resulting laminates are analyzed to assess the influence of tape preform consolidation and molding pressure. The results reveal a dependency between gas volume flow during automated tape laying and consolidation of the correspondent tape preforms. Laminate quality of specimen after stamp forming is independent to the tape preform consolidation according to the results of this investigation.
Keywords
Introduction
To increase manufacturing efficiency of carbon fiber reinforced polymers (CFRP), it is key to shorten cycle times. Research is undertaken to replace well established thermoset polymers by thermoplastic polymers. 1 Unlike thermosets, thermoplastics do not need to undergo time and energy consuming crosslink processes in order to build up strength. Processing thermoplastics requires heating above glass transition temperature in case of amorphous structures or respectively heating above melt temperature in case of semi crystalline structures in order to mobilize polymer chains, induce the consolidation process and build up strength. Consolidation of thermoplastics comprises intimate contact development and autohesion plus subsequent cooling under pressure in shorter time compared to thermoset processing.2,3
From a manufacturing point of view with regards on efficiency, the nature of thermoplastics is exploited with so-called fusion bonding processes in isothermal temperature control such as automated tape laying (ATL) and stamp forming. Fast heating and high cooling rates lead to high production rates by employing the thermoplastics’ unique feature of weldability and formability. Time and energy consuming autoclave processing becomes obsolete.4–6
Both processes ATL and stamp forming individually are well established, e.g. in aircraft industry, to manufacture parts for primary structure. ATL is mainly used to manufacture tape preforms to be processed in subsequent molding processes respectively autoclave consolidation.6–10 In-situ tape preform consolidation during ATL processing is considered to be state of research.11–14 Various studies proved consolidation of pre-consolidated thermoplastic tape preforms in the stamp forming process.15–17 More recent investigations focus on the stamp forming of tape preforms without pre-consolidation, meaning processing non-fully consolidated tape preforms. In-situ consolidation in ATL is not considered, since process efficiency is low due to slow layup speeds.14,18,19
Slange et al.9,20 investigated the combination of CF/PEEK tape preform manufacturing by means of press consolidation, ultrasound spot welding and automated fiber placement in isothermal stamp forming. Results reveal a promising mechanical performance after stamp-forming besides intralaminar voids that are related to initial tape quality and cannot be removed entirely. Zenker et al.10,21 reported similar results for CF/PA6 respectively CF/PPS tape preforms consolidated in isothermal stamp forming. Tape preforms were processed at maximum layup speeds of 0.2 m/s 9 respectively 0.4 m/s. 10
In this study, CF/PEEK tape preforms manufacturing at high speed (1 m/s) is addressed in order to tackle and increase process efficiency. Objectives are producing tape preforms with distinct, differentiable degree of consolidation that is determined by macro-, micro- and mechanical analysis. Tape preforms showing the highest and lowest consolidation are stamp-formed by means of isothermal thermoforming at different pressure settings in order to reveal potential influence of tape preform consolidation and pressure setting on part quality of stamp forming laminates.
Consolidation of thermoplastics requires intimate contact of the surfaces to start autohesion at the interface.3,22,23 The intention in this study is to change the degree of intimate contact
Two-dimensional tape preforms are produced in ATL at different gas volume flows, meaning various heat energy inputs to fusion bond tape on tape. Tape preforms are characterized on a qualitative level by means of thickness measurements, microsection analysis, flexural test and compression thermal analysis (CTA) in order to assess the degree of consolidation. Subsequently, tape preforms are processed in an isothermal stamp forming by using a plate tool. Laminates are characterized by means of thickness measurements, microsection analysis and flexural test to describe the correlation between tape preform consolidation and part quality after stamp forming.
Material and experimental
Tape preform manufacturing
Tape preforms are manufactured with the F2-compositor gantry system from Automation Steeg und Hoffmeyer GmbH, Budenheim, Germany. The heat source is a hot gas torch being operated with the gases hydrogen and oxygen. The energy of the heat source is set by the gas volume flow in standard liters per minute (slpm; 1 slpm = 1,68875 Pa m³/s). The material used in this investigation is a polyether-ether-kethone (PEEK) with an AS4 C-fiber. The fiber volume content according to data sheet is
Unidirectional (UD) tape preforms comprising 14 layers ([0]14) have been evaluated. The tape preform geometries are 350 mm × 140 mm × 1.96 mm (nominal thickness). Fixed parameters are the roller’s temperature at 25°C room temperature, the roller’s force of 150 N and the layup speed of 1 m/s. The roller’s material is aluminum with a width of 25 mm and a diameter of 45 mm. First layer parameters are set independent to specimen configuration being 1 m/s lay-up speed, 25 slpm of gas volume flow and 150 N of consolidation force. Tape preforms are placed on carbon fiber reinforced polyphenylene sulfide (CF/PPS) organo sheets. Following layers are manufactured at specimen characteristic gas volume flows of 30 slpm, 35 slpm, 40 slpm, 45 slpm, 50 slpm and respectively 55 slpm.
Stamp forming setup
Figure 1 illustrates the manufacturing of stamp forming laminates (SFL) in isothermal stamp forming. The laboratory press has a maximum press force of 800 kN, a table size of 1000 mm × 1200 mm and a maximum closing speed of 850 mm/s. The plate tool used for tape preform consolidation is 220 mm in length and 120 mm in width. Tool temperature is kept at 200°C throughout consolidation of the tape preform. The downstroke press closes rapidly in the beginning and then force related until tool pressure is reached. Tool pressure on the laminate is set to 7.5 bar respectively 30 bar. Stamp forming process and idealized temperature curves during molding.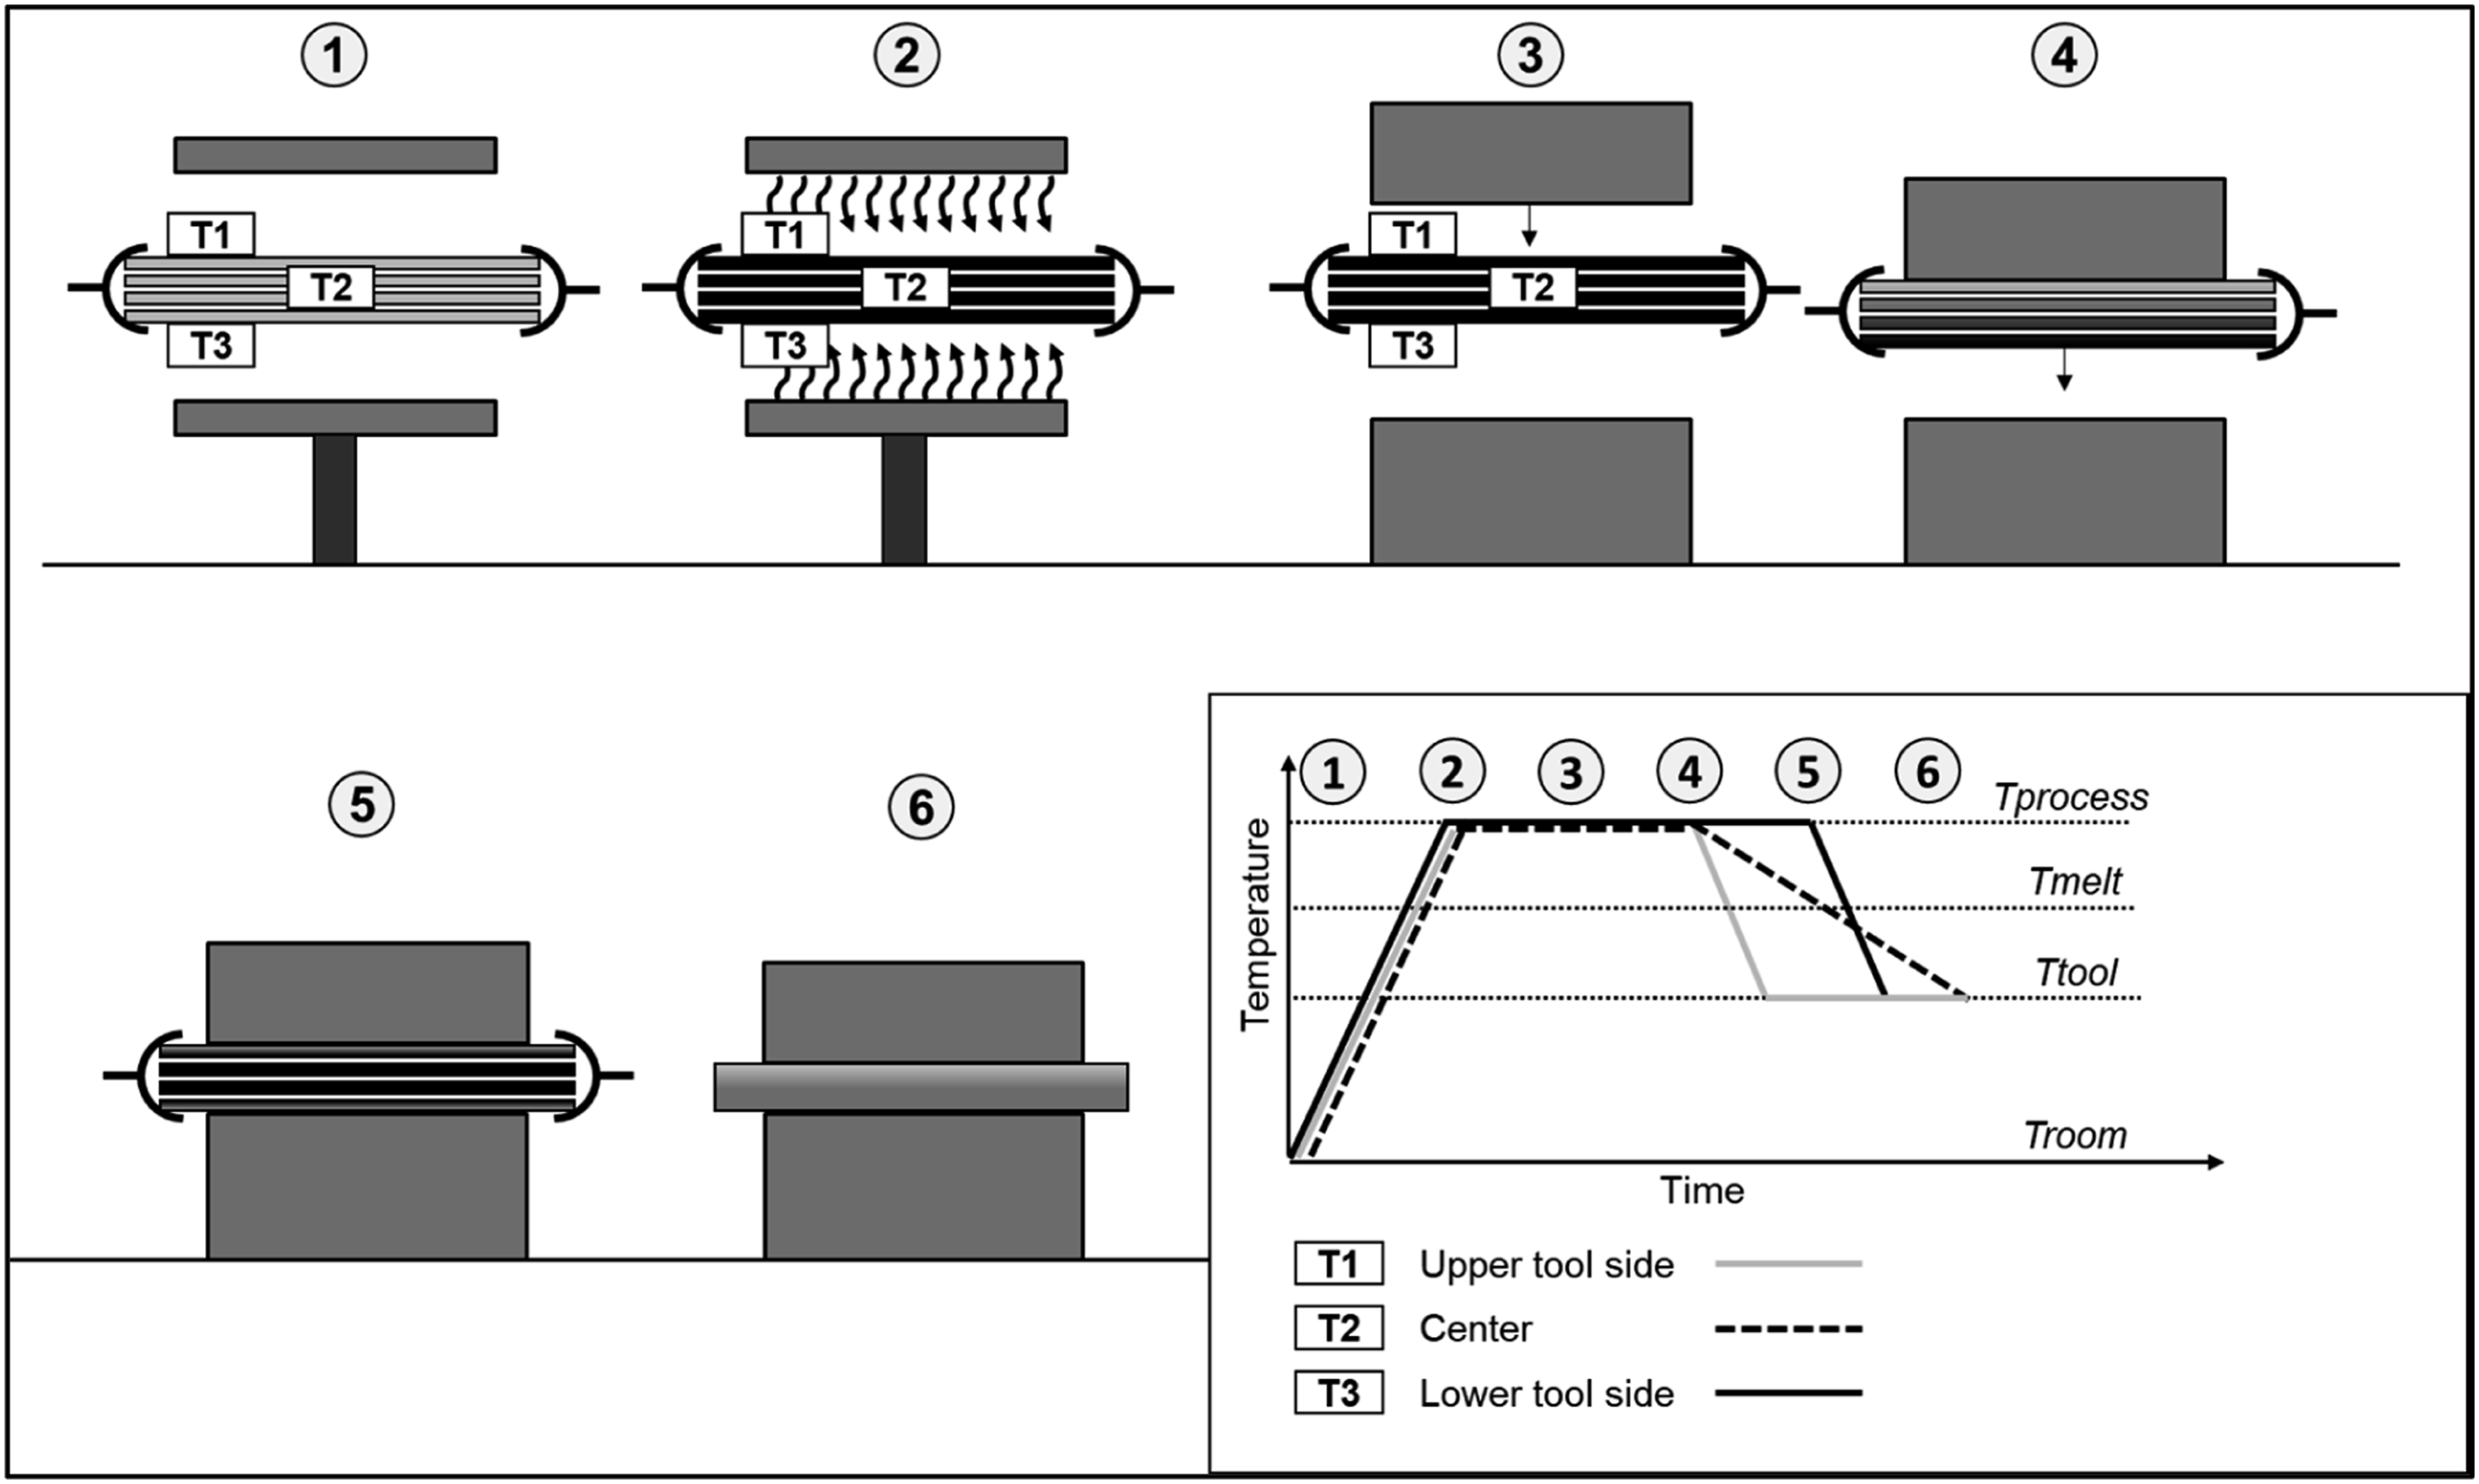
Tape preforms are clamped between stainless-steel sheets and attached to springs. The springs allow the tape preform to travel vertically without tension, when the mold is closing. Thermocouples (type K) are mounted on the top side and bottom side of the tape preform as well as on the inside during tape laying. Heating trials are undertaken to estimate time and power of the IR-panel to heat the polymer to the process temperature of 400°C, well above melting temperature of 345°C.
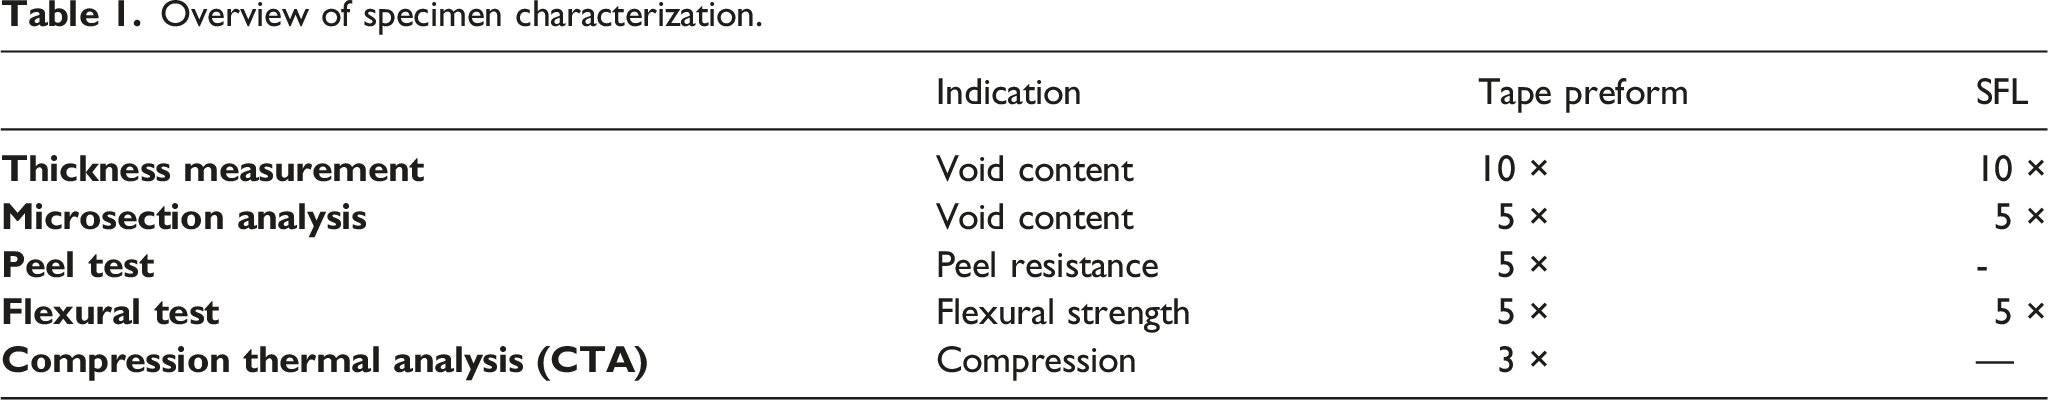
Specimen characterization
Overview of specimen characterization.
Thickness measurement
Specimen thickness is being determined by means of mechanical testing using a digital caliper for both tape preform and SFL.
Microsection analysis
The analysis of microsections by means of gray scale analysis is used to validate the void content of the laminates. The corresponding specimens are embedded in an epoxy resin, ground and polished after curing at room temperature and under atmospheric pressure. The preparation of the micrograph specimens is performed with a Leica DM6 reflected light microscope at ×100 magnification. ImageJ software is used for gray scale analysis. Specimen porosity comprises intralaminar voids due to potential poor tape impregnation as well as interlaminar voids due to poor fusion bonding in ATL. Microsection analysis does not distinguish between intralaminar and interlaminar voids. Roving impregnation in the tapes is considered to be statistically equal for all specimen. Exclusively intimate contact, but no degree of autohesion can be assessed by means of microsection analysis. Void content of SFL samples is validated with respect to void distribution at three positions: upper tool side, center and lower tool side (compare S1).
Peel resistance determination of two-layer tape preform
The peel resistance between two layers of a tape preform is being determined by means of peel testing. The peel resistance represents the degree of consolidation in a qualitative manner. The resistance is at maximum, if the entire surface of both joining partners is fusion bonded and the interlaminar strength corresponds with the bulk material strength. A correlation is to be established between the amount of energy in ATL and the consolidation, expressed as peel resistance. In contrast to the microsection analysis, data of the peel test indicates the degree of autohesion in the framework of consolidation. A specimen consists of two CF/PEEK tapes placed on a CF/PPS organo sheet, with the upper tape being peeled from the lower tape. A crack initiator at one end of the specimen ensures the peeling process to take place between the two tape layers. The specimen and the test setup are shown schematically in S2. The specimen moves horizontally in x-direction, when the upper tape is peeled in z-direction around a roller and pulled by an electric drive. A force measuring system detects the required force.
Flexural test
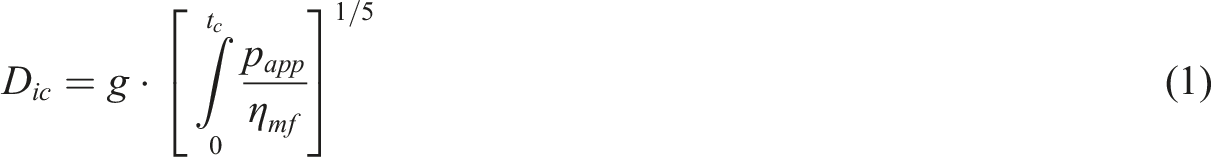
Flexural tests are carried out to evaluate the mechanical properties of the tape preform and the laminates after stamp forming. The geometry of the specimens and the test rig as well as the procedure parameters of the quasi-static test are based on ASTM D-7264. The support span width L is 20 times the specimen thickness h. The length of the specimen is 1.2 times L and the specimen width b is 13 mm. A load cell with a maximum force of 10 kN records the force P at a test speed of 1 mm/min. The maximum strength σ is determined by applying formula (2).
Compression thermal analysis
The compression thermal analysis (CTA) 25 represents an isobaric pressing of a plate specimen at steadily increasing tool temperature, while cavity height is being detected. The purpose of this investigation is to determine the compression of semi-crystalline thermoplastics, which is considered to be a relation to the degree of consolidation. The study is based on the consideration of consolidation as a superposition of the three distinct mechanisms of void volume reduction, fiber displacement and autohesion. The strain rate of consolidation, i.e. the time derivative of compression due to consolidation, qualitatively describes the viscoelastic behavior that occurs during consolidation. It is assumed, that this viscoelastic behavior occurs when the glass transition is exceeded and - as a result - entrapped air is compressed. The deformation behavior of the specimens is divided into three areas. Area I occurs when the glass transition temperature is exceeded and subsequently the pores in the sample are compressed - the more void, the more compression. Area II describes the behavior above the melting temperature of the material at which fiber deformation occurs. Area III represents the thermal expansion and crystallization processes and is determined during cooling after areas I and II. In this study, exclusively area I is considered. The experimental setup comprises an electrically tempered, flat plate die, a load cell and a displacement transducer that detects the die movement. The press movement is electrical. The specimens are square with an edge length of 50 mm and a thickness of 14 layers of CF/PEEK. The specimen to be tested is placed in the center of the open mold at room temperature and subjected to a constant pressure of 5 bar by force-regulated closing of the mold. Tempering is then started at a rate of 8 K/min at room temperature until the target temperature of 250°C is reached. The path of the platen tool is measured with a sampling rate of 1 Hz and an accuracy of 0.001 mm. To determine the compression, the instantaneous tool path is plotted on the y-axis in relation to the maximum tool path and the tool temperature is plotted on the x-axis. A typical measurement curve is given in S3. The compression corresponds to the difference of the two local extrema, i.e. a change from a negative to a positive strain and vice versa. The plotted curve shows the relative displacement of the heated plates as the temperature increases. Initially, the sample expands as the temperature increases, which explains the positive path of the plates. When the glass transition temperature is reached, the viscoelastic material behavior of the semi-crystalline thermoplastic begins and the voids present in the material are compressed. This results in the drop of the curve. Once all the pores are compressed, the curve rises again as the sample continues to expand thermally. Based on the maxima and minima when the glass transition temperature is exceeded, a comparative value for the degree of consolidation of different samples is determined.
Results
Tape preform characterization
In the following, results of tape preform characterization are given to reveal potential difference in tape preform consolidation in terms of gas volume flow in ATL.
Tape preform thickness measurement
Data of tape preform thickness measurement of 14-layered UD tape preforms is given in Figure 2. No correlation between gas volume flow and tape preform thickness is evident according to the considered specimen. Thickness measurement of tape preform in terms of gas volume flow in ATL.
Tape preform microsection analysis
The extent of interlaminar voids decreases by increasing energy input through gas volume flow between lowest and highest setting being 35 slpm and 55 slpm. Lowest porosity was measured at samples, that were manufactured at 45 slpm and 55 slpm. Large standard deviations are related to material inhomogeneity causing irregular energy input and to inaccurate analysis caused by specimen preparation or human inaccuracy in running the analysis (compare Figure 3). S4 shows typical microsections of tape preform manufactured at 35 slpm, 40 slpm 45 slpm, 50 slpm and 55 slpm. Observation of the microsections reveals high inhomogeneity of the void distribution. Both, intralaminar and interlaminar voids exist, whereas intralaminar voids are due to the fiber impregnation characteristic of the tape material. Porosity of tape preform determined by means of microsection analysis.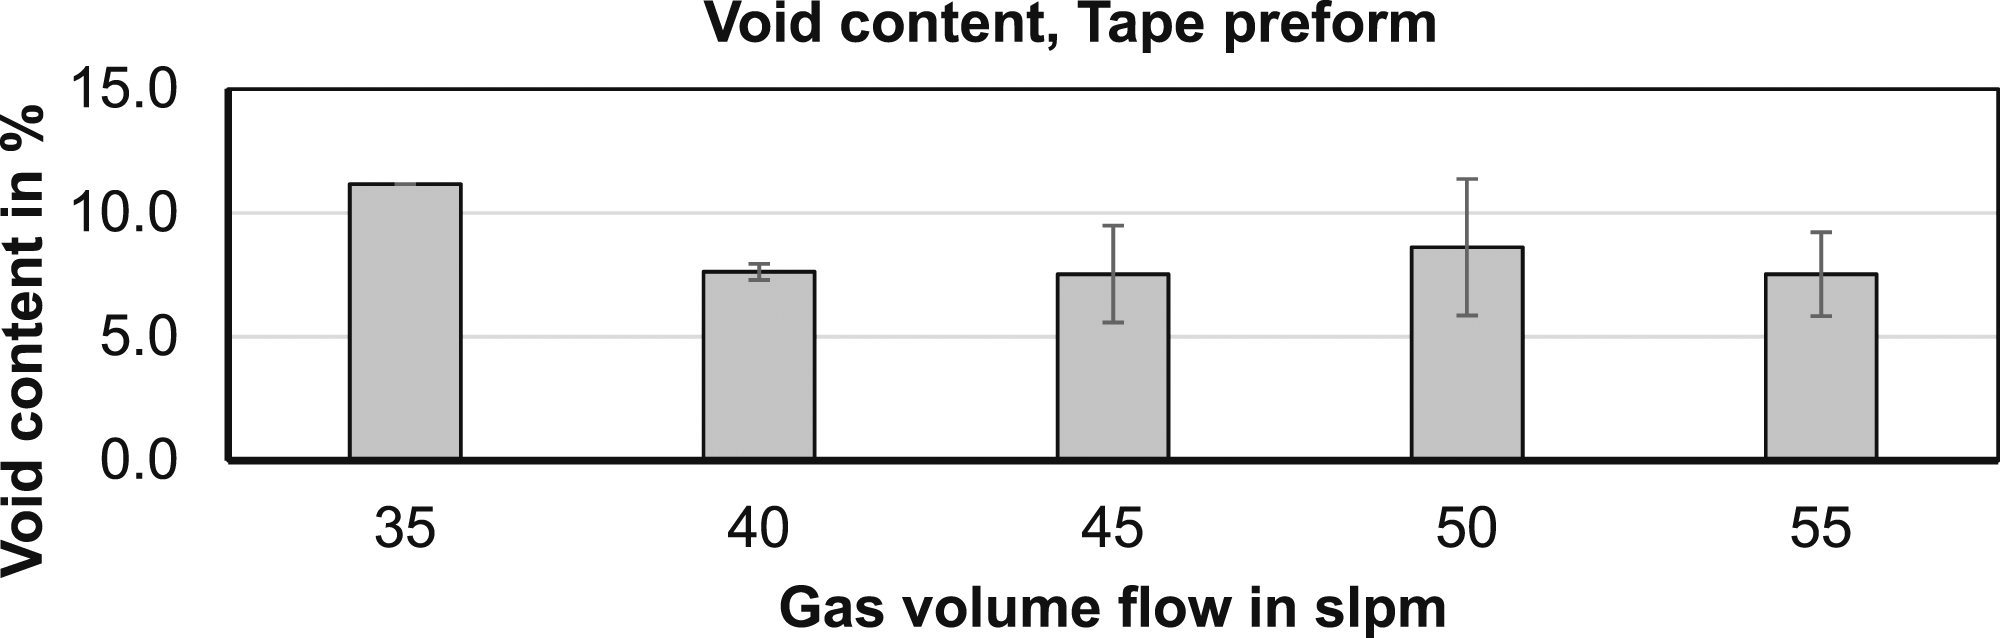
Peel resistance of tape preform in peel test
The average peel resistance between two 20 mm wide tapes measured in peel test is shown in Figure 4. According to the recorded data, peel resistance is proportional to the gas volume flow in ATL. Microsections of two-layer tape preform, perpendicular to fiber direction reveal the increase of degree of intimate contact ( Peel resistance in relation to gas volume flow.
Flexural strength of tape preform
The results of flexural strength measurement of tape preform are given in Figure 5. According to the tested specimen, the flexural strength increases when gas volume flow is increased. The increase of flexural strength is interpreted as an increase of autohesion at the interface of two layers. Flexural strength of tape preform in flexural test.
Consolidation determined in CTA
Results of CTA-measurements reveal higher compression when exceeding the glass transition for tape preform being manufactured at low gas volume flow and lower compression for tape preform being manufactured at high gas volume flow. Correlation between compression and gas volume flow in ATL is discrete for specimens being manufactured between 35 slpm and 50 slpm. Specimen of 55 slpm exhibits higher compression than specimen at 50 slpm, indicating higher porosity and less consolidation (compare Figure 6). Compression of tape preforms in CTA.
Post-CTA microsections (see S6) proof change in void content through CTA at different degrees of tape preform consolidation. The measured porosity by means of gray scale analysis is 3.2%, 3.2% and 4.3% for samples of 35 slpm, 45 slpm, and 55 slpm.
Characterization of SFL
SFL are characterized by means of thickness measurement, void content determination and flexural strength measurement in a flexural test. Results are given in relation to gas volume flow of tape preform being manufacturing in ATL, respectively autoclave processing as the reference process.
Thickness of SFL
In Figure 7, laminate thickness for SFL being processed at different tooling pressures and different tape preform manufacturing parameters being 35 slpm, 55 slpm as well as autoclave consolidation is given. Nominal thickness is 1.96 mm. Deviation between measurements and nominal thickness is less than 1.0%, applicable for tape preform being manufactured at 35 slpm and 55 slpm and processed at 7.5 bar and 30 bar. A maximum deviation of 6.0% for autoclave specimen being processed at 30 bar in stamp forming is measured. No influence of specimens being manufactured at different gas volume flows in ATL on SFL thickness processed at 7.5 bar and 30 bar is evident. A difference in laminate thickness between tape preform being manufactured in ATL (35 slpm and 55 slpm) and tape preform being manufactured in autoclave processing is evident. The influence of tooling pressure is detectable for tape preform being manufactured in autoclave: higher tool pressures result in less thickness of SFL. Thickness of SFL at different tooling pressures.
Void content of SFL
In Figure 8, SFL void distribution in thickness direction is shown for different tape preform manufacturing settings and different tool pressures. Analysis reveals agglomeration of voids at the upper and lower tool side. Accordingly, lowest void content is measured at specimen center, applicable for all considered constellations. SFL void content, void distribution; left: 7.5 bar tool pressure; right: 30 bar tool pressure.
Void content determination of SFL being manufactured at 7.5 bar tool pressure shows high standard deviations compared to measurements of SFL being manufactured at 30 bar tool pressure, indicating higher consolidation inhomogeneity at 7.5 bar tool pressure.
In S7, microsections of SFLs are given. The observation of voids gives information about the location of entrapped air within rovings. No interlaminar voids are noticeable, applicable for all considered constellations. Autoclave processed tape preform show little amount of voids having passed stamp forming. Average void content of SFL being manufactured at 7.5 bar and 30 bar is compared with tape preform void content in Figure 9. Data does not reveal distinct correlations between tape preform void content and SFL void content. Tape preform processed at 30 bar tool pressure in stamp forming show void content less than 2.5% for both settings at 35 slpm and 55 slpm. Tape preform being manufactured at 35 slpm and processed at 7.5 bar in stamp forming show highest void content of all considered SFL. Autoclave laminates show little void content in tape preform and little void content after stamp forming. No influence of tool pressure is evident. Void content of SFL in relation to tape preform manufacturing.
Flexural strength of SFL
The flexural strength of SFL in terms of tape preform manufacturing setting and different tool pressures, is given in Figure 10. Flexural strength of tape preform is given to compare mechanical performance of tape preform with SFLs. Flexural strength of SFL in relation to tape preform manufacturing.
Differences in flexural strength of tape preforms being manufactured at 35 slpm and 55 slpm are eliminated by stamp forming process. Considering the magnitude of the measured standard deviations, the flexural strength of SFL is independent to tape preform flexural strength and tool pressure. Autoclave processed SFL reveal higher flexural strength for both tool pressures, 7.5 bar and 30 bar, compared to SFL with tape preforms manufactured at 35 slpm, respecitely 55 slpm in ATL.
Discussion
Influence of neat tape characteristics
Fiber impregnation of the neat tape is characterized by a void content of 9.3 % (standard deviation 2.8 %) and inhomogeneously distributed fibers based on microsection analysis (compare S8). Tape surfaces are rough and dry fibers can be located by visual inspection on tape surfaces. Fusion bonding can only take place, if intimate contact is developed - which is hindered by high tape surface roughness. Dry fibers at the interface might affect autohesion mechanism, since polymer chain movement can only take place at polymer-polymer interfaces. From a manufacturing point of view, energy input through hot gas torch is assumed to profit from rough tape surfaces, since overall surface is greater compared to an entirely flat surface of the same tape width. Heat transfer between hot gas torch is proportional to the area of the tape and the heat transfer coefficient.
Influence of gas volume flow on degree of tape preform consolidation
Interlaminar bonding is highly inhomogeneous in tape preform specimen width, being related to local heating, respectively heat spots of the hot gas torch. This assumption is supported by microsections in S4. This phenomena contributes to high standard deviations in measured data. Settings for gas volume flow were chosen with the premise of feasibility, application of methods for analysis and limitations of used ATL machinery. Tape preform being manufactured at less than 35 slpm gas volume flow delaminated during demolding from the substrate and cutting samples for analysis was not possible without destruction of the laminate. Maximum setting of 55 slpm gas volume flow was restricted by the hot gas torch system.
Influence of specimen preparation on void content determination
In gray scale analysis, voids being filled with resin during embedding are not considered, falsifying porosity values, since voids are process related. Furthermore, the selection of gray scale threshold to distinguish between fibers, specimen polymer, embedding resin and voids, is done manually and can be considered as subjective to some extent. Artefacts from grinding and polishing can show similar gray scale as voids. To exclude influence on measured void content, a minimum void size, orientated towards the smallest entrapped void per specimen chosen via observation, is set.
Influence of stamp forming process on SFL consolidation
Void content determination reveals agglomeration of voids at the upper and lower tool side. Temperature measurements during heating and stamp forming of SFL at the specimen upper side, at the specimen center and at the specimen lower side were undertaken to reveal temperature distribution during processing (compare S9). Data reveals homogeneous temperature distribution during heating of the tape preform at the upper side, center and at the lower side. No overheating at the surfaces can be detected. Cooling of the tape preform begins when upper tool contacts the tape preform at the upper side followed by a temperature drop at the lower tool side. Temperature at the specimen center drops with delay, remaining at higher temperature during compaction.Relating to the measured temperatures, rapid increase in polymer viscosity at the upper tool side and lower tool side is assumed when mold is closing. Consequently, void movement is hindered resulting in void agglomeration at the upper and lower tool side.
Performance of autoclave processed tape preform in stamp forming
Comparing tape preform data and SFL data, autoclave-processed tape preform do not show great difference in consolidation. To the contrary, ATL-processed tape preform increase in consolidation and mainly interlaminar bonding is being enhanced through stamp forming. The volume of intralaminar voids is decreased but cannot be eliminated entirely according to the considered samples. Autoclave-processed specimen show almost no intralaminar voids, since variothermal process setting in autoclave facilitates fiber impregnation and void elimination in order to achieve fully consolidation prior to isothermal stamp forming.
Conclusion and outlook
In this study, the relation between tape preform consolidation and consolidation of laminates after stamp forming was investigated. Analysis of SFL reveals no influence of the consolidation of tape preform, nevertheless quality of autoclave-processed tape preform consolidated in stamp forming cannot be achieved. To conclude, it is to mention that the stamp forming process eliminates the difference in consolidation of tape preform at investigated process parameters.
To increase the quality of SFL in terms of consolidation, intralaminar voids are to be eliminated. Using tape material with a lower void content is assumed to be the next step to be investigated to increase consolidation quality of SFL.
Supplemental Material
Supplemental Material - Stamp forming of partially consolidated CF/PEEK tape preforms produced in a high-speed automated tape laying process
Supplemental Material for Stamp forming of partially consolidated CF/PEEK tape preforms produced in a high-speed automated tape laying process by J Weber and J Schlimbach in Polymers and Polymer Composites
Footnotes
Declaration of conflicting interests
The author(s) declared no potential conflicts of interest with respect to the research, authorship, and/or publication of this article.
Funding
The author(s) disclosed receipt of the following financial support for the research, authorship, and/or publication of this article: The project “OSFIT - One-Shot Fully Integrated Thermoplastic-Frame” was funded by the Federal Ministry of Economic Affairs and Energy (BMWi) on the basis of a decision by the German Bundestag (funding reference 20W1706 C).
Disclosure statement
No potential conflict of interest was reported by the authors.
Supplemental Material
Supplemental material for this article is available online.
References
Supplementary Material
Please find the following supplemental material available below.
For Open Access articles published under a Creative Commons License, all supplemental material carries the same license as the article it is associated with.
For non-Open Access articles published, all supplemental material carries a non-exclusive license, and permission requests for re-use of supplemental material or any part of supplemental material shall be sent directly to the copyright owner as specified in the copyright notice associated with the article.