
Abstract
The high chemical resistance of the advanced thermoplastic polymers, such as polyether ether ketone (PEEK), polystyrene (PS), or polyamide (PA), makes methods of the composites’ composition evaluation based on chemical etching difficult and tedious. Wider application of the composites with thermoplastic matrix creates a need to find more capable, faster, and easier method of fiber and void content determination. Thermogravimetric analysis (TGA) is known to be one of the most promising candidates. Numerous reports have shown that TGA could be successfully applied for glass-reinforced composites. In this study, carbon fiber/PEEK composite was investigated. Initial tests showed that a simple method based on total burn-up of the matrix cannot be used for such advanced composites due to the high thermal resistance of PEEK. Tests carried with various parameters and microscopic investigation of the degradation process allowed to propose an analysis method that can give a satisfactory outcome. Results obtained with carbon fiber/PEEK composite using TGA-based method matched those obtained by chemical etching. Supplementary investigation of PA-based and epoxy resin composites showed the applicability of the method to a wider group of both thermoplastics- and thermoset-based carbon fiber–reinforced composites.
Keywords
Introduction
Carbon fiber–reinforced polymers (CFRP) are state-of-the-art material in the modern aviation industry. Carbon fiber composites are widely used for both structural and nonstructural components of aircraft. To date, thermoset (TS) resins have been exclusively applied in aircraft composite parts. Composites with a matrix composed of TS polymer, for example, epoxy resin, show high strength; also the TS processing technology is well-known among engineers, and equipment in the factories is designed to work with TS-based composites.
However, from designer’s standpoint, high-performance thermoplastic (TP) polymers have many advantages over TS resins—high strength, good toughness, 1,2 chemical resistance, good performance at elevated temperature, 3 weldability, 4,5 and ability to recycle, 6 thus it is not surprising that TP-based composites attract much of the academia 7 –10 and aerospace industry’s attention. 11 Airbus has successfully employed TP composites on the leading edges of A300-series aircraft and Gulfstream 650 has an elevator and vertical tail rudder made with carbon fiber/polyphenylene sulfide composite. 12 Since TP-based composites started to be the material of choice in the design process of critical control surfaces and structural components, a strong need to effectively control composites’ structure arose. One of the methods widely applied to TS-based composites is chemical dissolution of matrix in strong acids. The process is described in ASTM D3171 standard. 13 The method allows estimating the content of resin, fibers, and voids in the specimen. However, this method is less suitable for TP-based composites due to their high resistance to chemical agents. 14 Chemical dissolution of TP composites requires hot strong acids, such as boiling (337°C) concentrated sulfuric acid, which is both hazardous for laboratory staff and environmentally dangerous. Thermogravimetric analysis (TGA) was proposed as an alternative to chemical dissolution for tests of plastics with glass fiber reinforcement. The method has been recognized as reliable and is described in standards. 15,16 Application of TGA for CFRP is more troublesome due to oxidation and thermal degradation of carbon fibers. 17 –19 Several researchers developed methods based on TGA to estimate constituents content in the epoxy composites. 18,20 –24 Some of them are not straightforward and require two-step analysis with separate measurement of reference fiber only 20 or matrix only 24 sample. Limited number of reports showed attempts at the application of thermogravimetry to characterize TP materials with moderate thermal resistance. 25 TGA was successfully applied for determination of alumina reinforcement within the polyether ether ketone (PEEK)/aluminum oxide composite. 26 The composite was heated in air atmosphere up to 1000°C, during heating, PEEK was degraded and finally completely burned up at 700°C. The remaining residue was composed of aluminum oxide, resistant to further oxidation. However, at the temperature of 700°C, oxidation of carbon fiber in oxidative atmosphere takes place, 22 which makes the determination of fiber content difficult.
However, to the best of authors’ knowledge, there is no study showing the application of TGA to characterize modern high-performance thermoplastic composite materials, such as carbon/PEEK composite. The aim of this study is to develop a simple and straightforward method of testing constituent content in carbon fiber/high-performance thermoplastic materials.
Materials and experiment
In this study, carbon fiber–reinforced PEEK composite was tested. The material was delivered as a tape, and the composite panels were fabricated using automated fiber placement method. According to the supplier’s data, the tape consists of 59 ± 3 vol% (66.5 ± 2.8 wt%) of carbon fibers. The typical panel had a thickness of around 1.5 mm. The test was conducted over several panels that were manufactured in several AFP runs, thus the panels showed various quality (mainly void content). The versatility of the method was tested by applying it to composites with other than PEEK matrices. These were two composite panels consisted of polyamide (PA-6 and PA-12) thermoplastic matrices and carbon fabric reinforcement. Other tested composites were two carbon fiber–epoxy resin composites with IM7 12 K unidirectional and fabric reinforcements.
For TGA testing, small cylinder-shaped specimens were cut out of the panels using a hole saw drill bits with a diameter of 8 mm. During cutting, the drill and specimen were intensively water cooled to prevent the specimen overheating, which may alter thermal properties of the composite. After cutting, the specimens were dried at 65°C for 4 h to remove the extent of moisture. Before the test, each specimen was refined into chips, what was expected to improve even heating of the specimens and ease escape of gaseous products of degradation. In one TGA run, the total mass of 30-40 mg of the sample was tested, such mass is believed to provide both accurate and representative results for the panel. At least three specimens were tested for each panel. TGA test was carried in the TGA5500 device (TA Instruments, New Castle, DE, USA) using platinum pans, which could operate up to 1000°C. The balance and thermocouples in the TGA device were regularly checked between the tests. The TGA runs were driven in two modes—continuous heating up to predefined temperature (usually 700°C) with the constant heating rate of 10°C min−1 and isothermal annealing at a given temperature. In the latter case, rapid heating with rates of 100 and 50°C min−1 was used to restrain specimen degradation at temperature other than intended. Unless the experiment was investigating the effect of test atmosphere, the test was conducted in an atmosphere of dry air with flow of 0.04 slm (standard liters per minute).
To validate the thermogravimetric method, samples for chemical etching were also prepared from the same panels as respective TGA samples. The etching procedure was based on ASTM D3171, but due to the high chemical resistance of TP polymers, it was more severe—the larger volume of etching agents and higher than recommended temperature were used. The three specimens with dimensions of 25.4 × 25.4 mm2 were milled out of each tested panel. Before further actions, specimens were dried at 65°C and then weighted. The etching agent in the first step was boiling 96% sulfuric acid. After dissolution of the matrix 30% hydrogen peroxide was added until the solution became transparent. Finally, the mixture was filtered and the remaining dry fibers were weighted. Void volume in the composite panels was determined by weighing samples in air and in water according to the standard ASTM D792.
To find out the degradation process of the composite, some TGA runs had been stopped, and partially burned specimens were examined by scanning electron microscopy (SEM). The microscope used for observations was Hitachi SU8000 (Hitachi High Technologies, Tokyo, Japan), operating at an accelerating voltage of 1 kV. Prior to observations, thin layer of molybdenum (Mo) was sputtered onto specimens to avoid electrical charging of the composite.
Results and discussion
Evaluation of PEEK-based composite
Study of the thermal degradation of the composite was started with heating up with a constant rate to 700°C. Figures 1 and 3 show TGA curves showing a weight loss of the specimens heated in air and under nitrogen atmospheres, respectively. Plots also show a derivative of the weight loss curve, which allows identifying stages of the degradation process. At a temperature of about 510°C onset of the degradation in the oxidizing atmosphere was noticed. At higher temperatures, the degradation became more rapid. The SEM observations were carried out using specimens heated up to the interruption point marked on the curve by red marks. Figure 2 shows consecutive stages of degradation. Figure 2(a) and (b) corresponds to the point “A” in Figure 1 and showing one chip of untested composite specimen. Higher magnification reveals polymer covering carbon fibers. The specimen after reaching a temperature of 610°C (point “B”) is shown in Figure 2(c) and (d). Images reveal fibers; however, large areas of polymer residues are visible (one of such area is enveloped by a white circle). After heating up to 650°C (point “C”), the specimen had a form of loosely connected fibers, the SEM images (Figure 2(e) and (f)) show bundles of fibers with no visible polymer reach areas left. Since the weight of the specimen did not reach the level of expected fiber content (gray band in Figure 1), some polymer residue is believed to be still present. The residue may be located on the surface of the fibers or inside the bundle between several fibers. Figure 2(g) and (h) shows specimen after the full test (point “D”), that is, reaching 700°C. A stack of scattered fibers is visible (Figure 2(g)), the surface of the individual fibers is coved with multiple crater-like defects, which would indicate the onset of carbon fiber degradation.
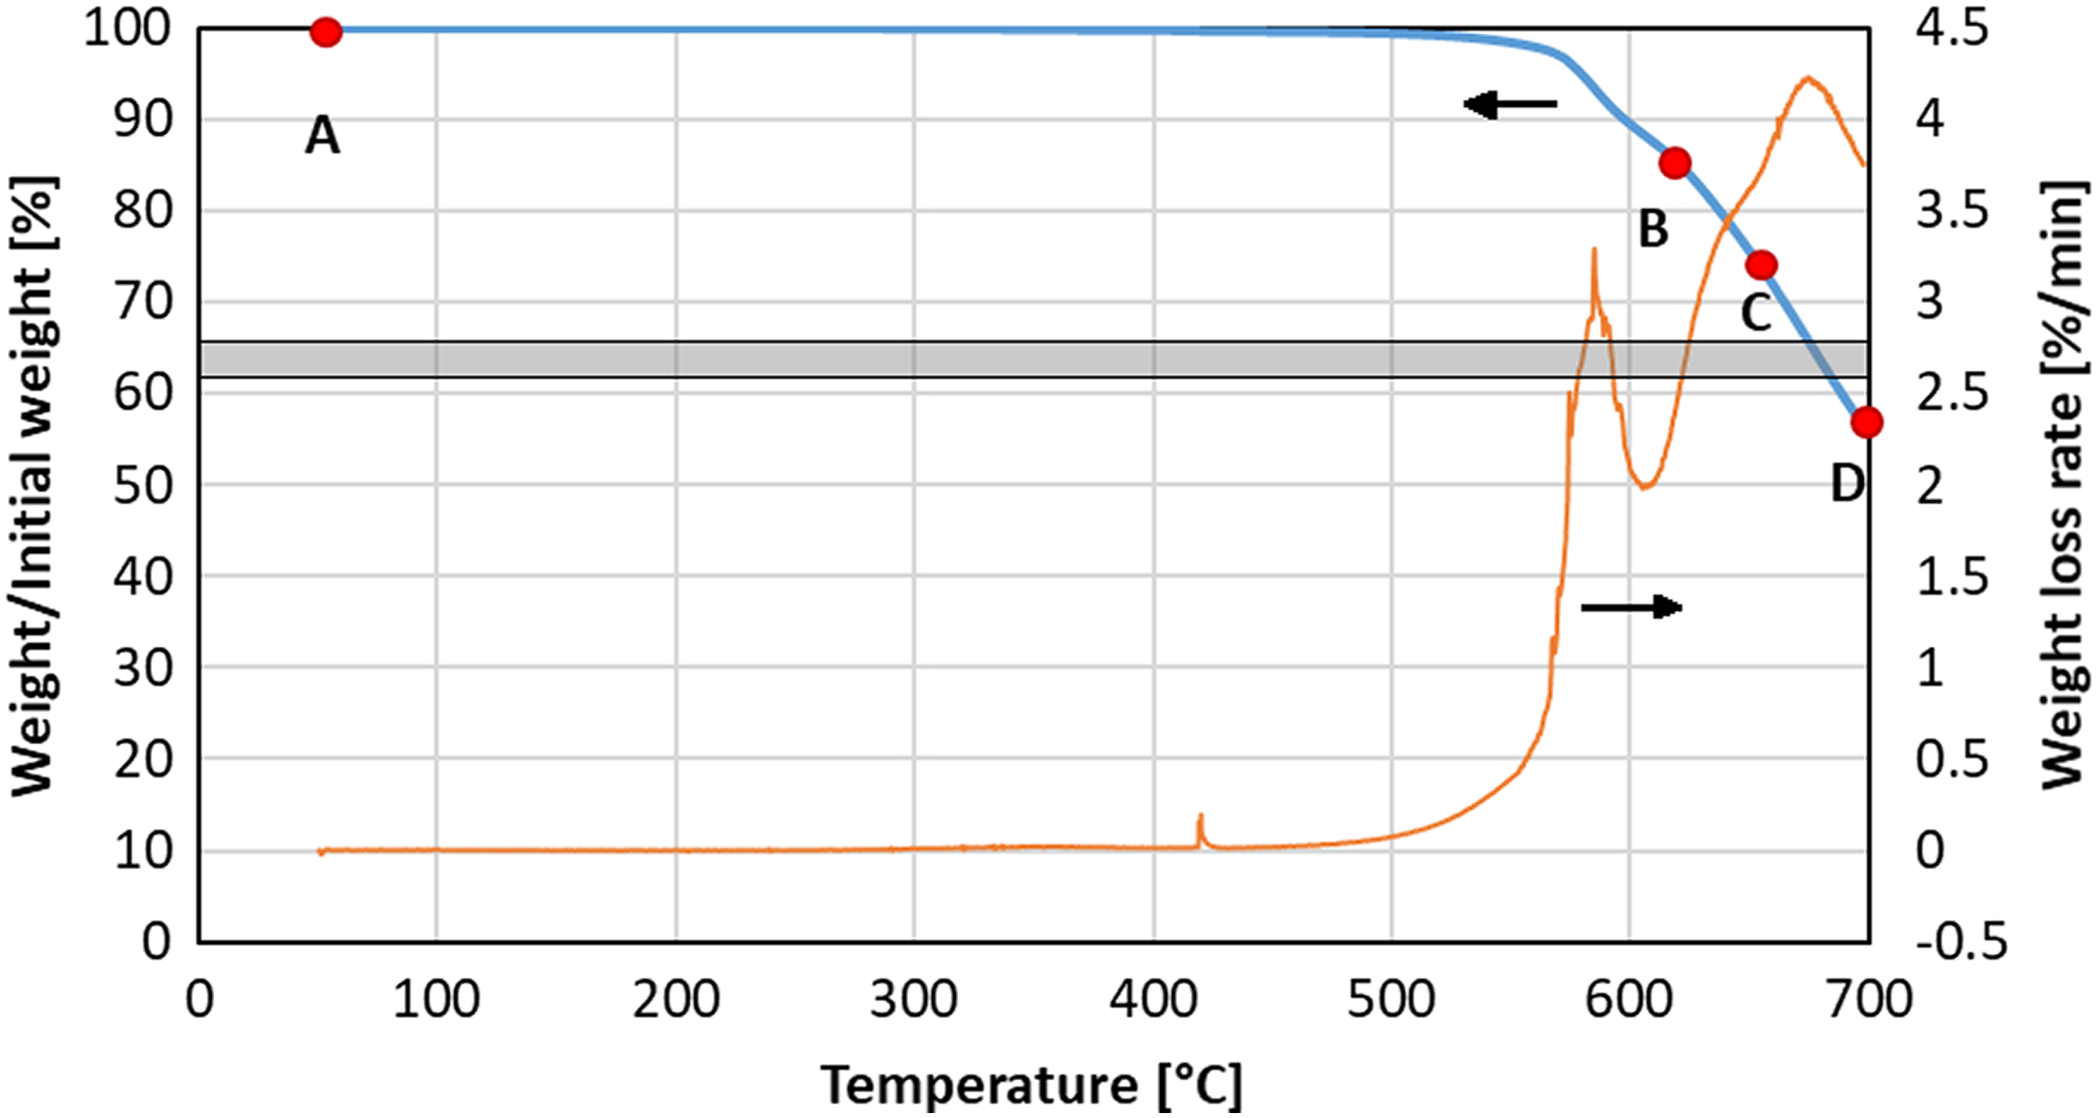
Weight loss (blue bold line) and weight loss rate (orange line) during continuous heating up to 700°C in air atmosphere with a heating rate of 10°C min−1. Marks show maximum temperature reached by specimens examined by SEM. The gray band corresponds to the fiber mass content in the tested panel—value based on the chemical etching method.
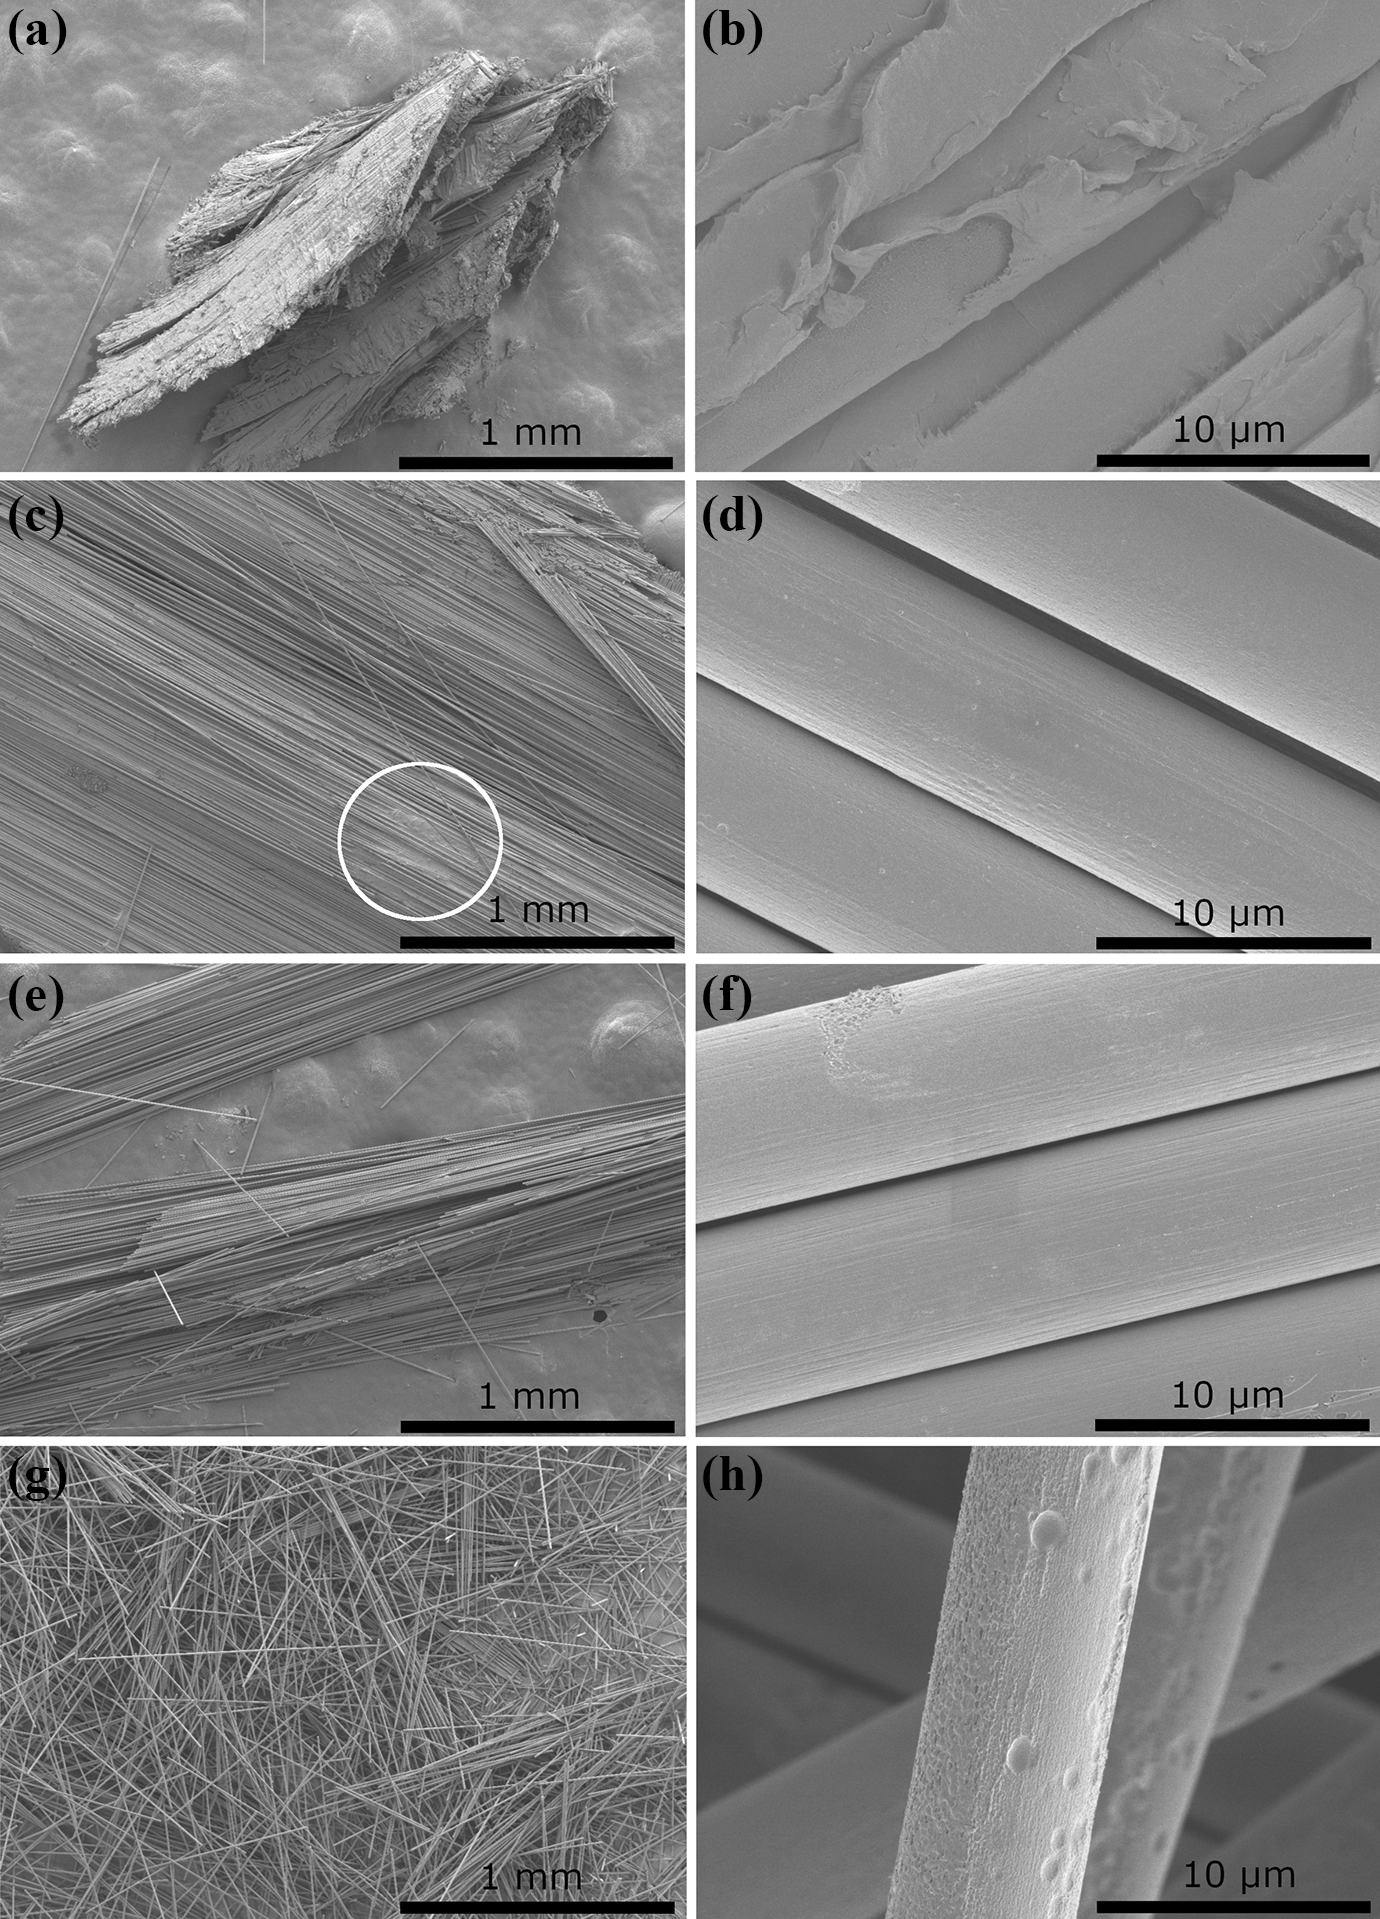
SEM images of specimens continuously heated in air atmosphere. (a and b) Piece of the specimen before test, (c and d) specimen after reaching a temperature of 610°C (Δm = 12.5%), (e and f) the residue left after heating specimen to 650°C (Δm = 22%), and (g and h) up to 700°C (Δm = 45%). SEM: scanning electron microscopy.
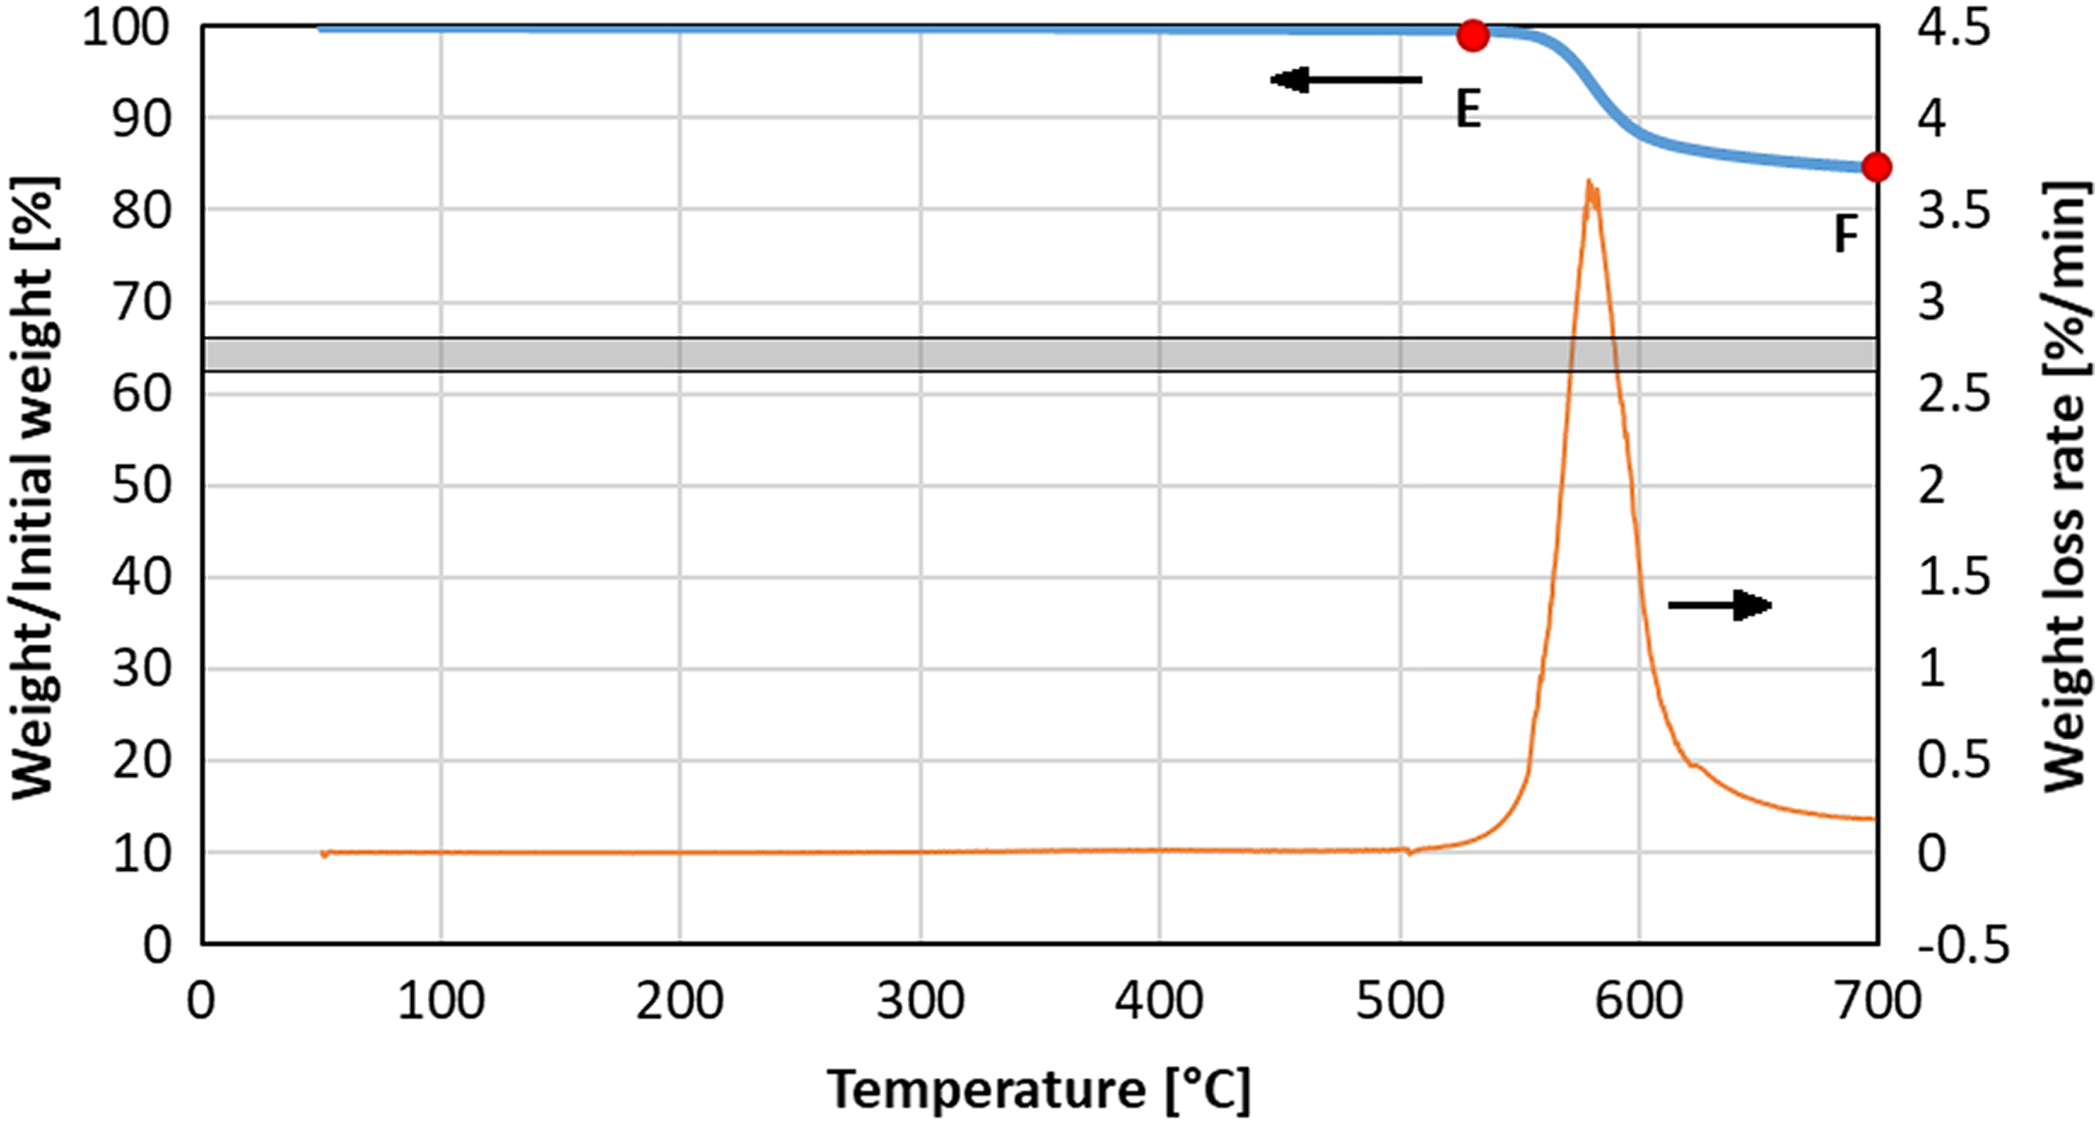
Weight loss (blue bold line) and weight loss rate (orange line) during continuous heating up to 700°C under nitrogen atmosphere with a heating rate of 10°C min−1. Marks show maximum temperature reached by specimens examined by SEM. SEM: scanning electron microscopy.
Based on the obtained results and other reports such as 22 the following degradation steps of degradation are likely to occur:
PEEK polymer degradation at a temperature range from 510°C to about 610°C, the process corresponding to the first peak on the derivative curve, at this step, PEEK degrades into char and gaseous products of reactions are released.
Char burning, at temperatures from 610°C to about 660°C, which agree with the rise of the weight loss curve and its second peak. At this stage, the polymer residue burns up, so fibers are no longer bonded each other and start to form a chaotic pile.
Degradation of carbon fibers, which starts around 650°C.
Temperature ranges established here may not be valid if the test parameters will change; however, stages of the degradation likely stay the same.
Figure 3 shows the weight loss curve of the composite specimen tested under nitrogen atmosphere. The initial stage of degradation resembles the polymer degradation step observed in the previous experiment. At a temperature higher than 610°C weight loss was less intense than during test in air atmosphere. SEM images (Figure 4) show a significant volume of PEEK polymer or its residue even after heating to 700°C (point “F”). It seems that under nitrogen atmosphere the polymer decomposes and gaseous products escape from the specimen, but char burning steps and fiber degradation do not take place due to lack of oxygen available.
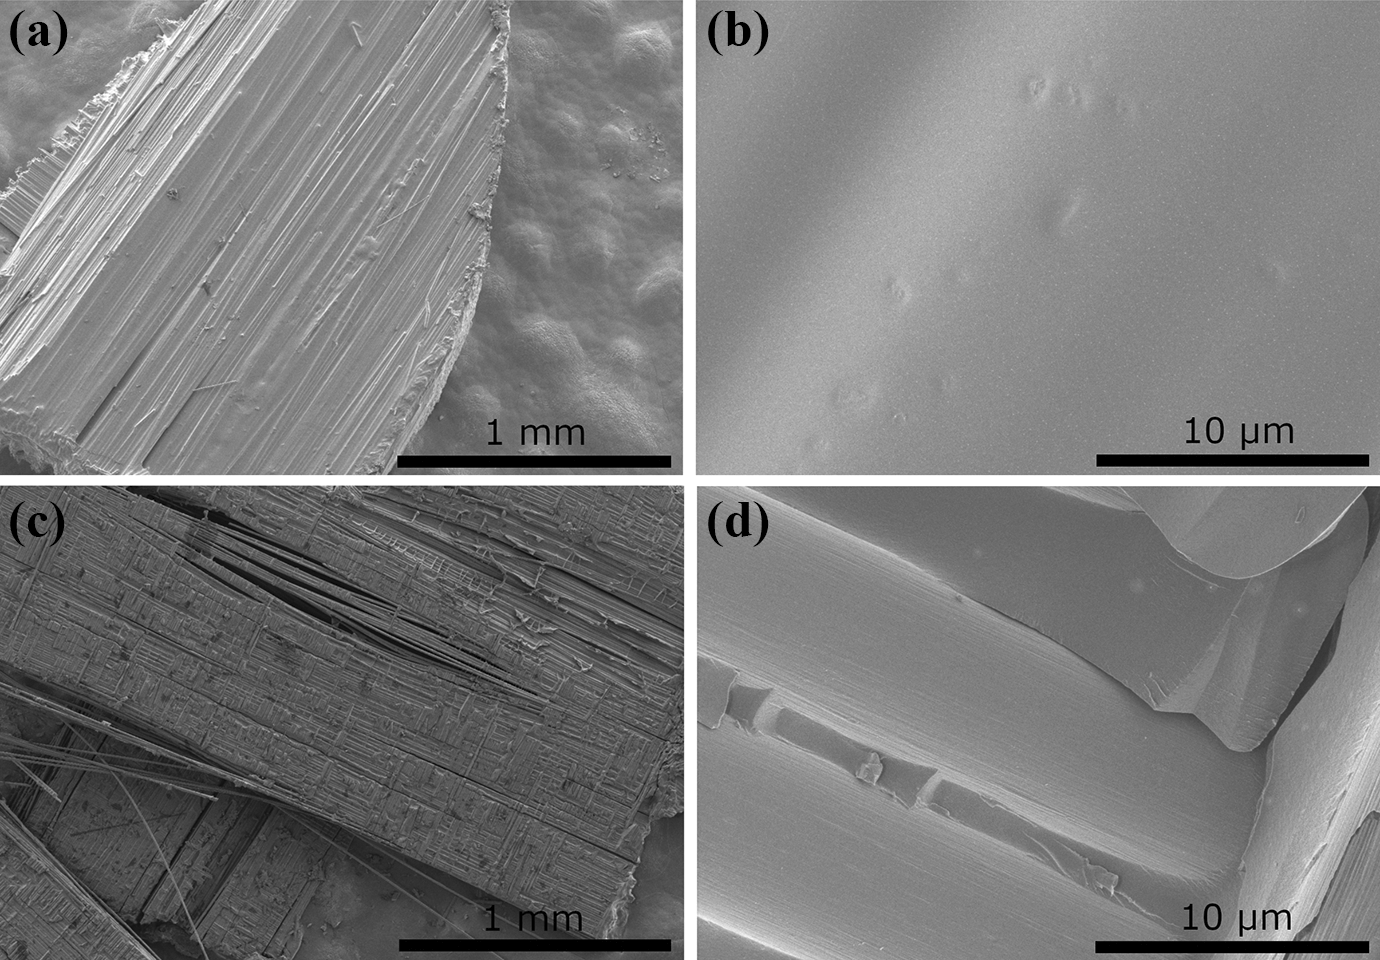
SEM images of specimens continuously heated under nitrogen. (a and b) Specimen after reaching a temperature of 530°C (Δm = 0.6%), (c and d) the residue left after heating specimen to 700°C (Δm = 18%). SEM: scanning electron microscopy.
One of the proposed methods of composite fiber content determination is isothermal annealing in ambient atmosphere. 18 After some time, the sample mass should reach a plateau which allows finding fiber mass fraction. This method was applied in this study, the mass loss curves for various exposure temperatures are presented in Figure 5. The curve for the test conducted at 530°C shows a very slow loss mass of the specimen, despite dwell time over 5 h, less than one-third of resin decomposed. At testing temperatures from 580°C to 720°C curves dropped significantly below the expected fiber weight, also plateau was not reached even though dwell times at target temperature was as long as 5 h or more. At the highest temperature of 750°C plateau below 5% of the initial mass was reached, so it was meaningless in terms of constituent content determination.
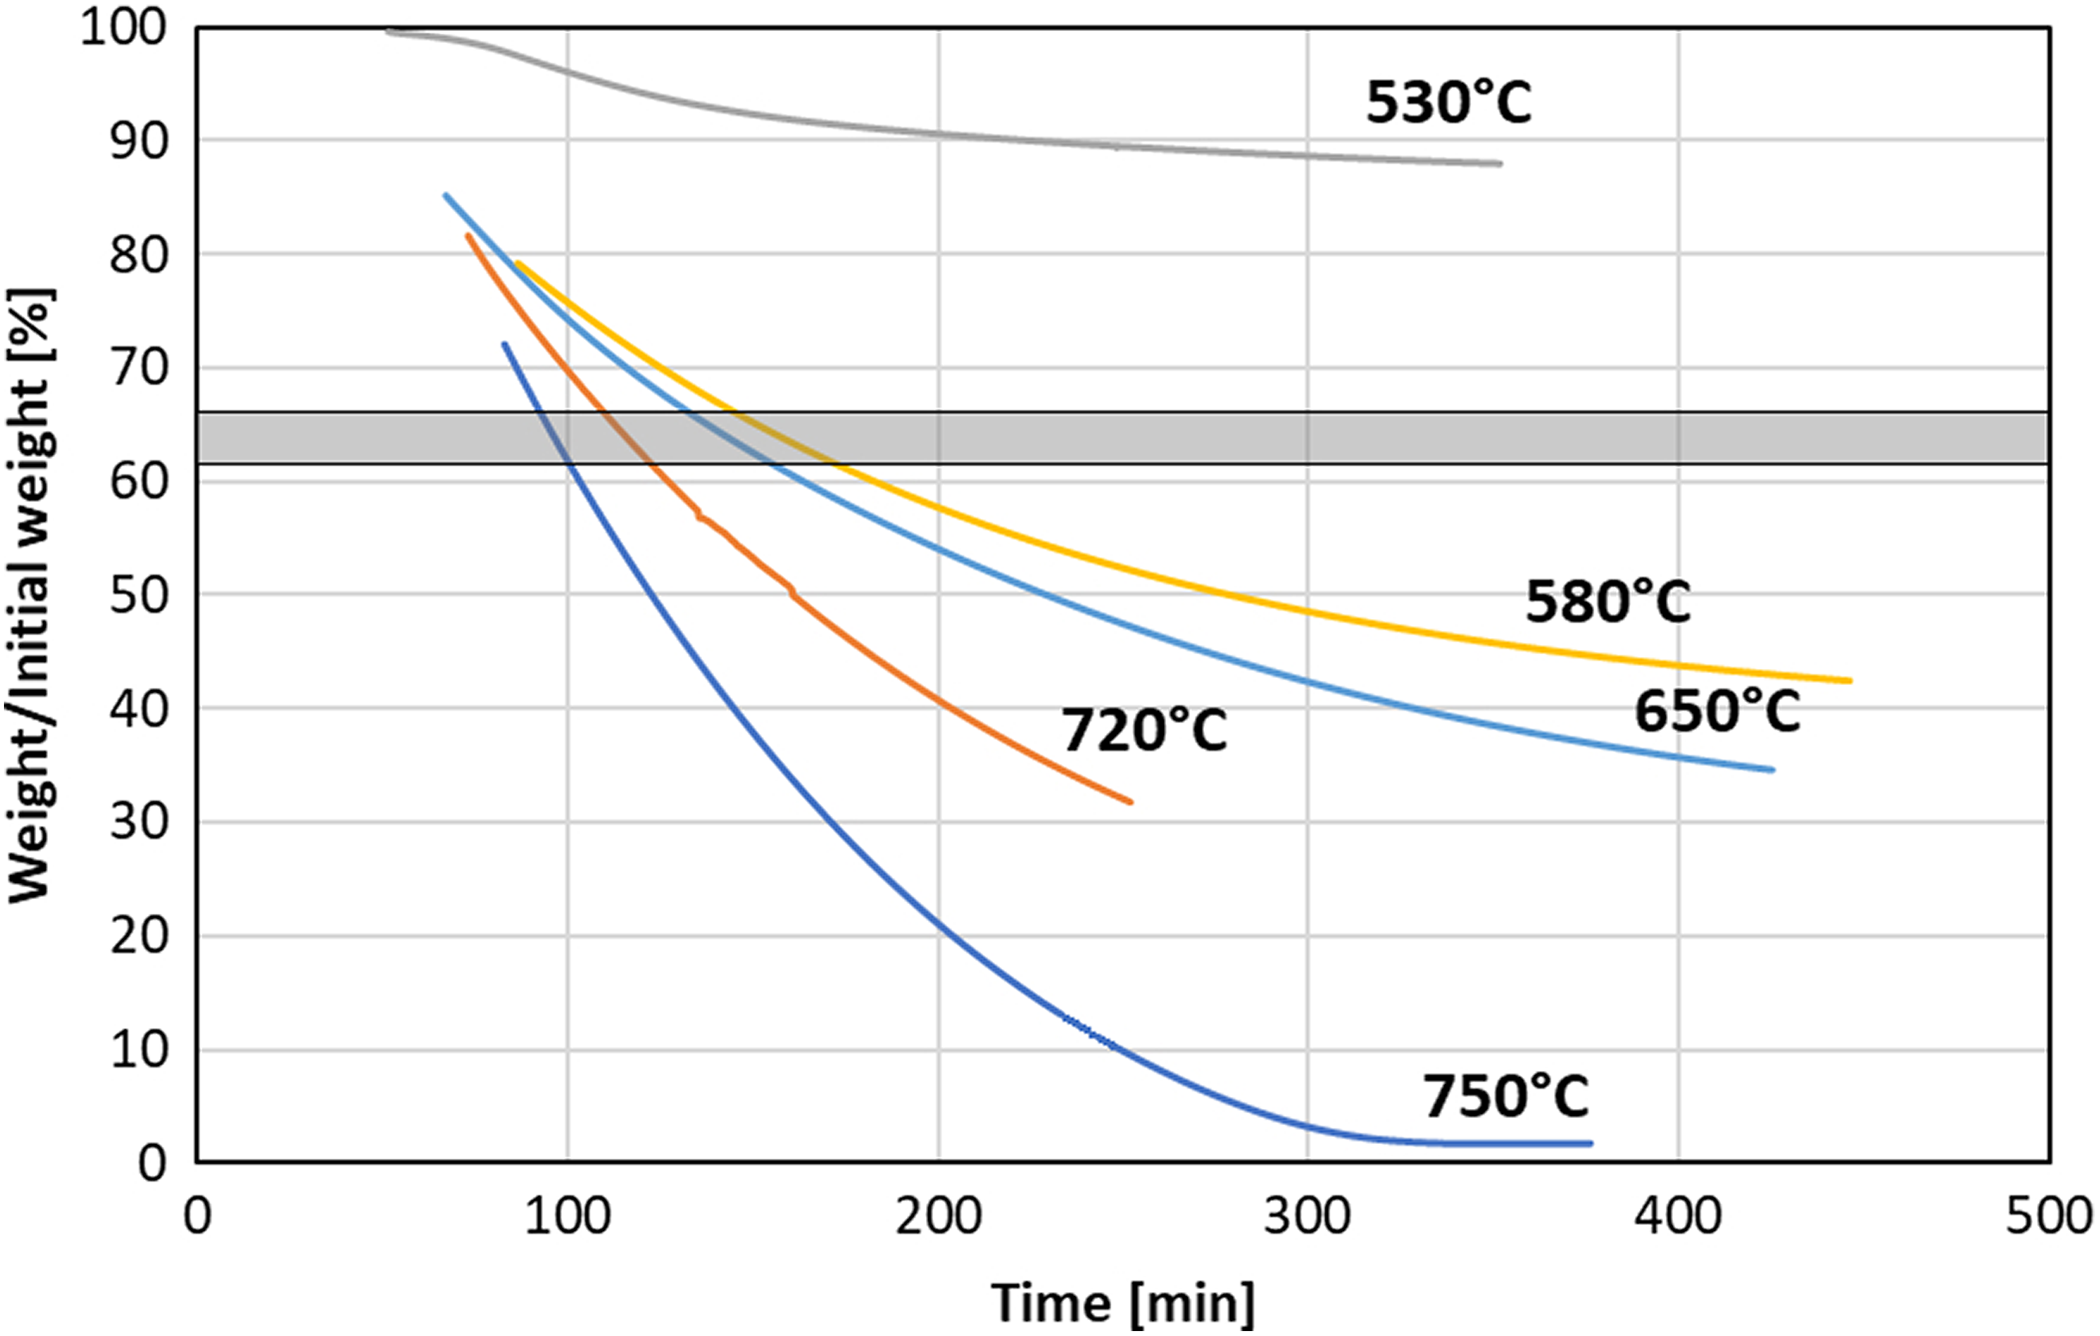
Effect of temperature on weight loss of the carbon fiber/PEEK specimens during isothermal heating in nitrogen. PEEK: polyether ether ketone.
The failure of the method may be caused by the high thermal stability of PEEK, which starts to degrade at about 520–530°C. Test at such temperature leads to very long testing times (at least 15-20 h), what would be unsuitable for wide application of the method. On the other hand, higher temperatures cause the degradation of the carbon fibers. The cited report 18 shows results obtained on polyacrylonitrile-based composite, which shows the lower thermal resistance of the polymer.
In such a case, another method was employed that requires heating of the composite in the oxidizing atmosphere. Such a method is primarily suitable for glass-reinforced composites because glass is highly resistant to oxidation and high temperatures, which guarantees complete pyrolysis of the polymer. Results of the several isothermal runs at temperatures varying from 530°C up to 630°C are shown in Figure 6. All testing temperatures led to the fiber degradation and complete burn of the specimen (except for 530°C where dwell time was too short). One can notice that around 55-70% of the initial mass all curves show a change of slope, which may be attributed to the change of degradation mechanism from polymer degradation/burn to fiber degradation. For further testing, temperature of 610°C was selected because it compromises short testing time and relatively clear transition from resin degradation to fiber degradation—seen as a change of curve’s slope.
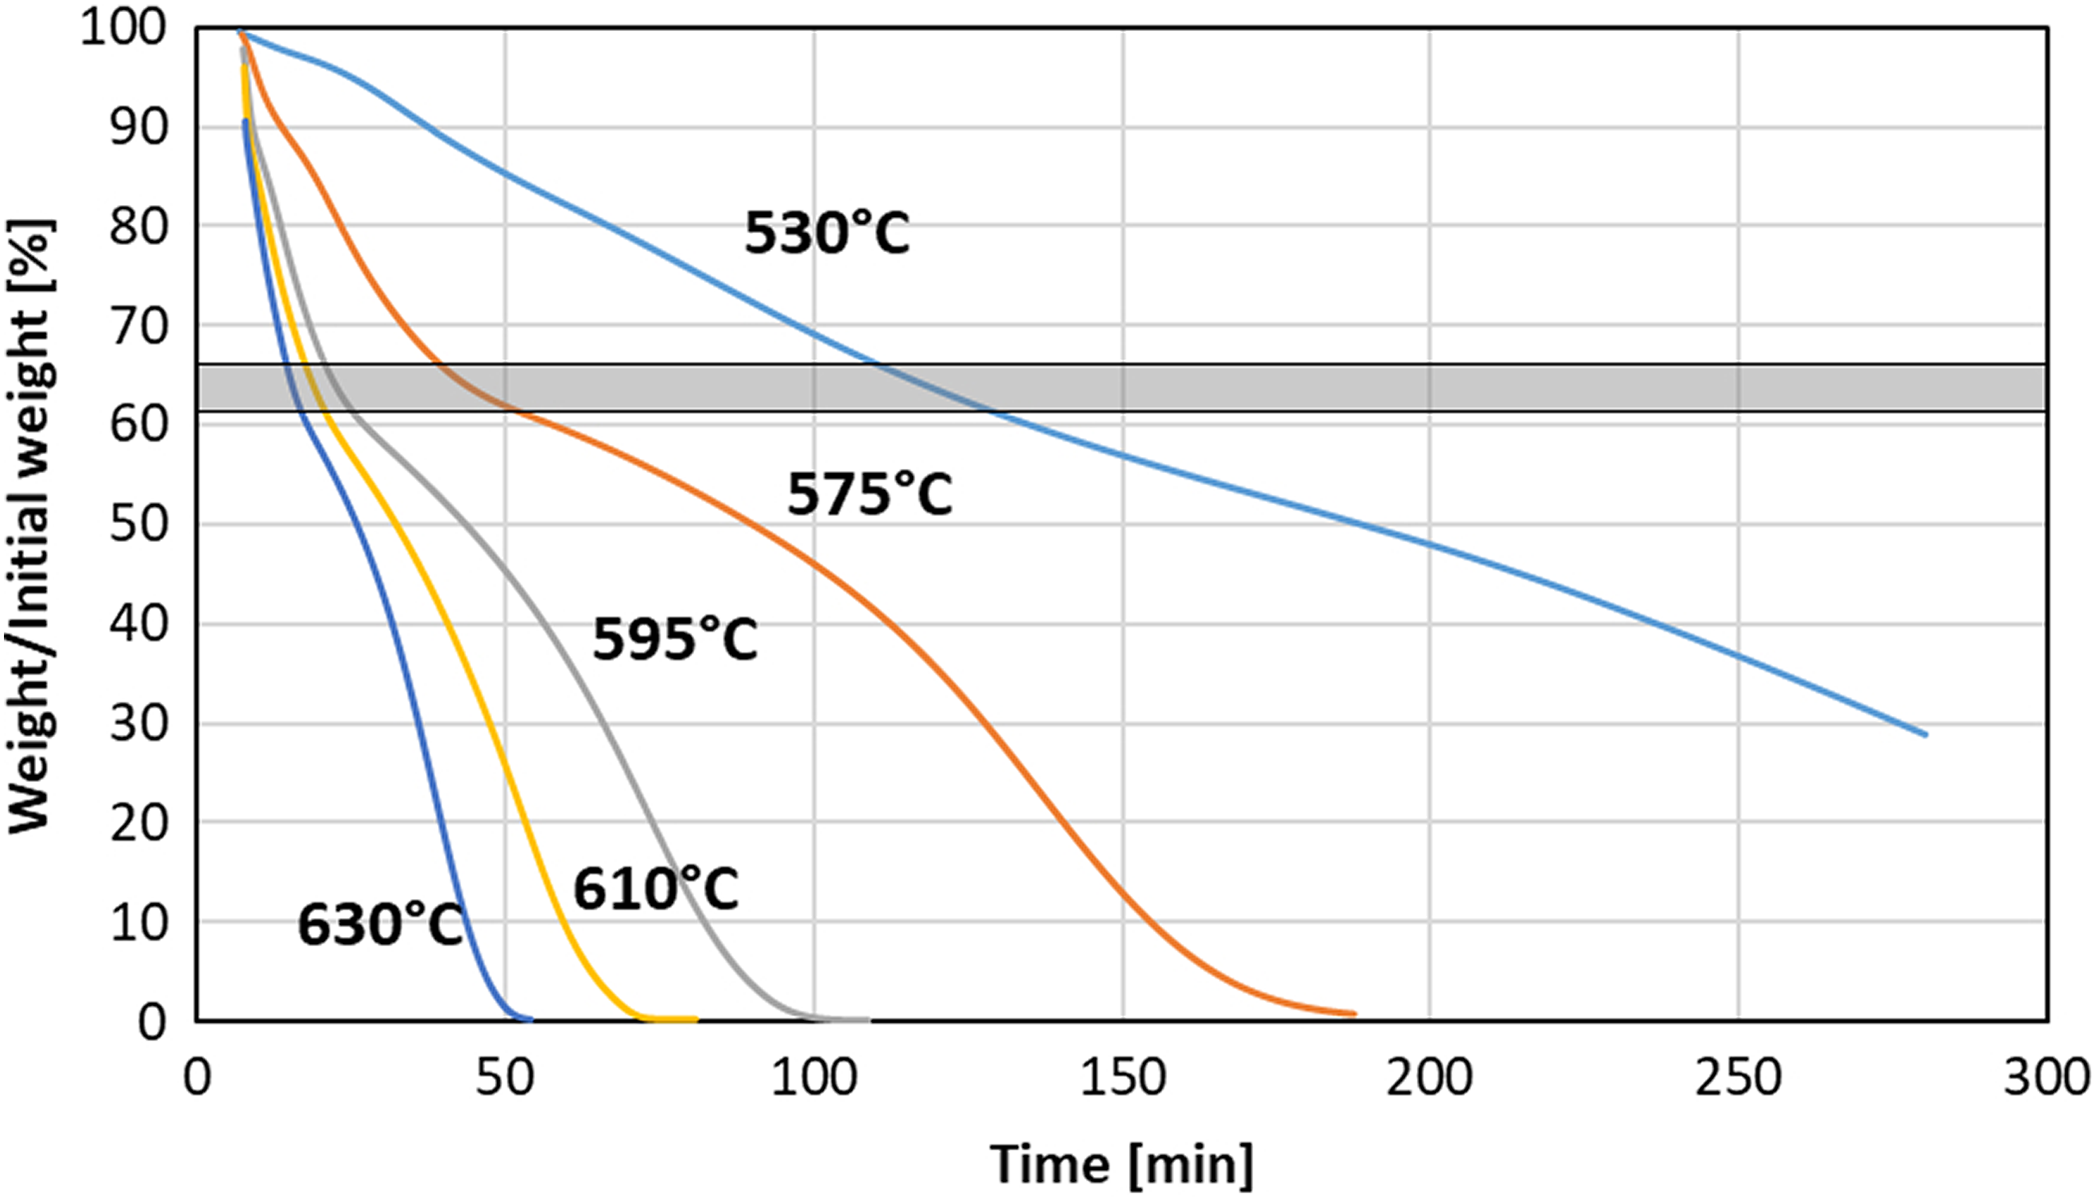
Effect of temperature on weight loss of the carbon fiber/PEEK specimens during isothermal heating in air. PEEK: polyether ether ketone.
We have assumed that the degradation mechanism change takes place when all the polymer matrix is removed. Thus, the fiber content could be determined by finding the point at which degradation mechanism changes. To do so, two lines are drawn, one tangent to the part of the curve showing degradation of the matrix and second to the part corresponding with degradation of the fibers. The intersection of the two lines determines the mass fraction of the fibers in the composite specimen. The determination method is shown in Figure 7. SEM observations were carried out for a specimen annealed at 610°C for 15 min, which corresponds to point of the degradation mechanism shift. SEM images (Figure 8) show a chaotic pile of fibers without polymer left between fibers nor on the fibers’ surface. Also, the images show that the degradation process of the fibers barely began and it could be neglected.
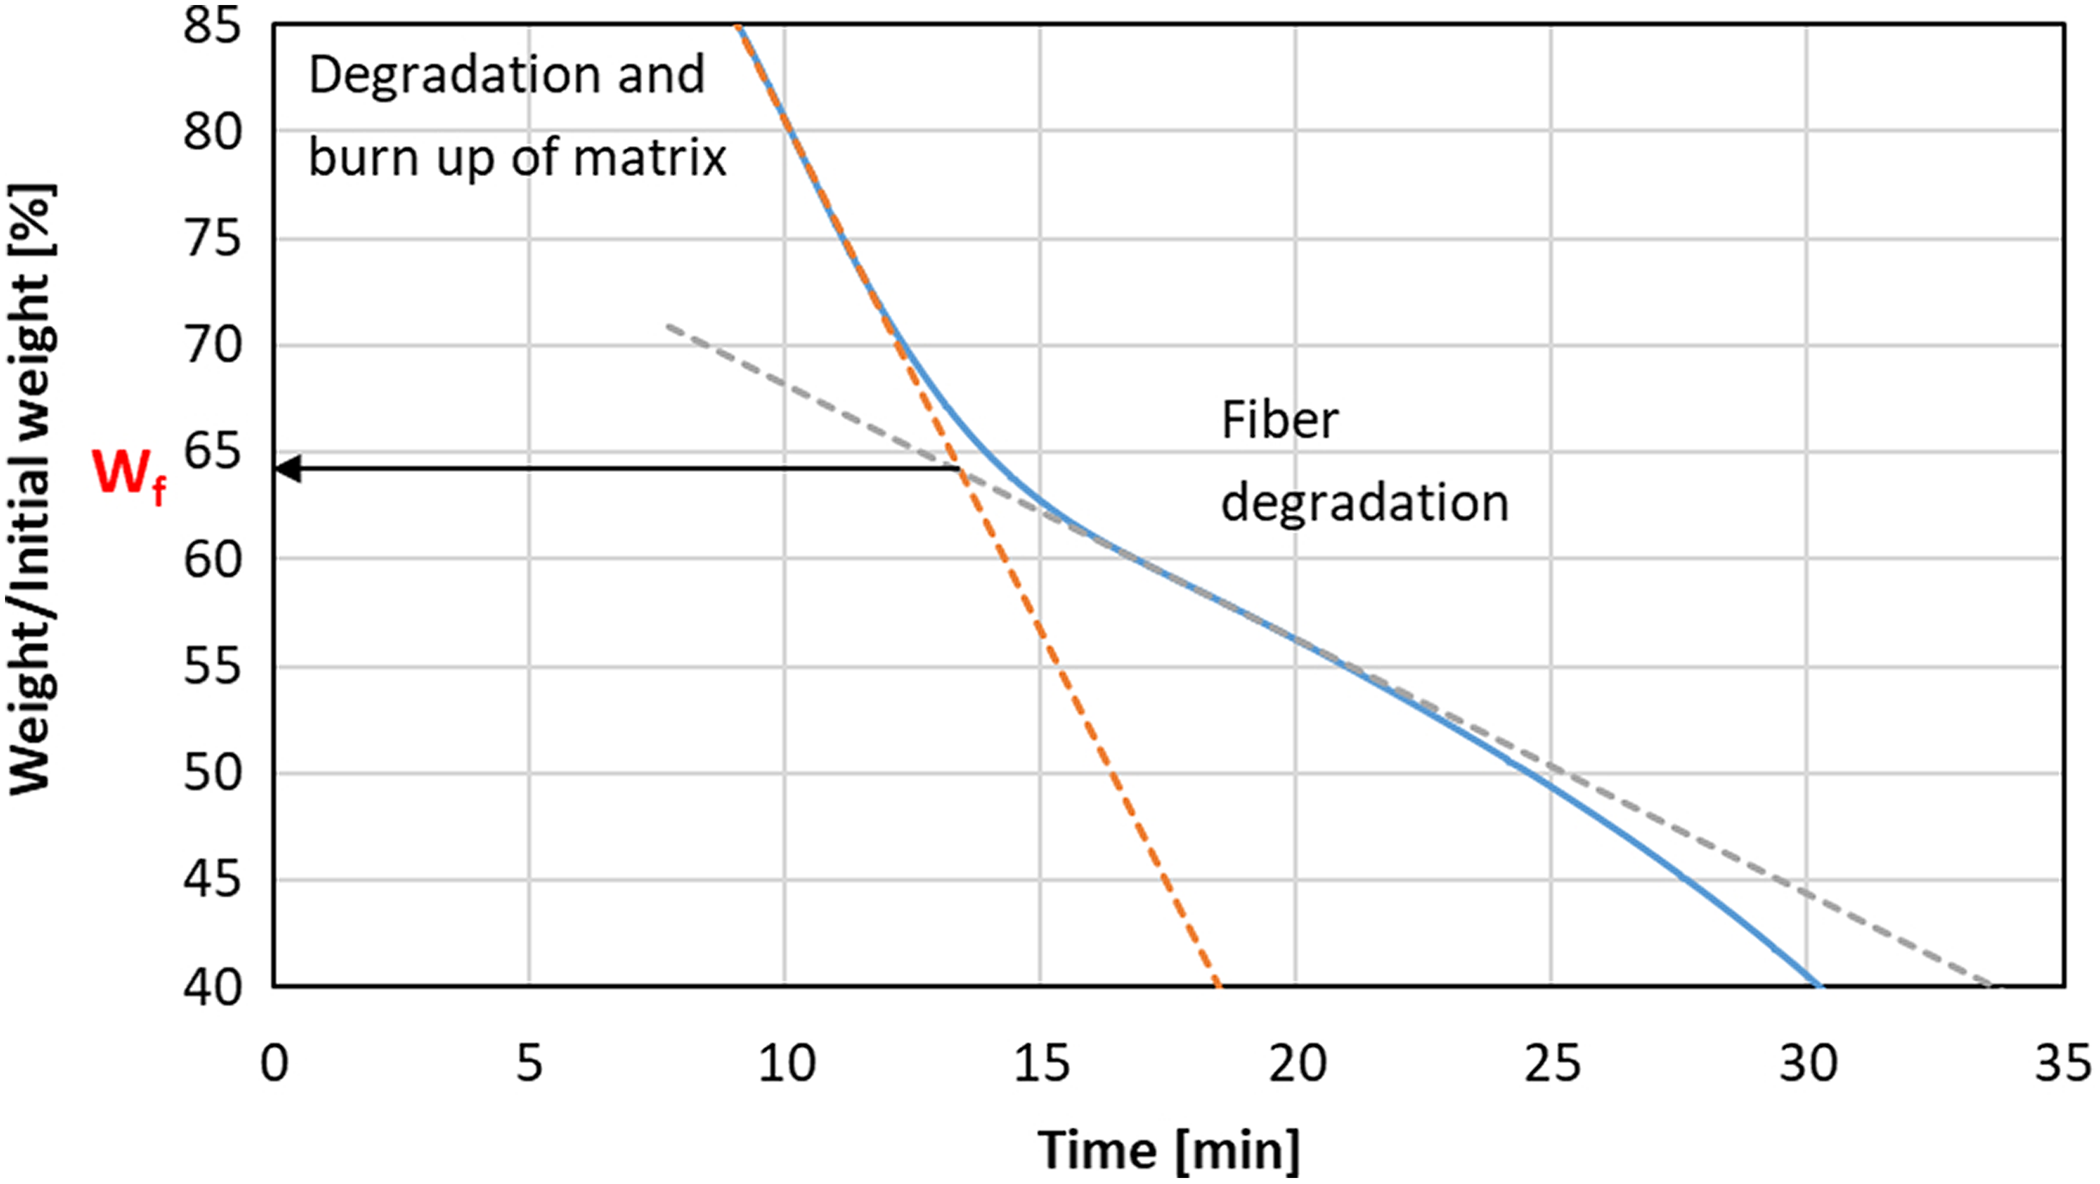
Schematic view of the method of fiber content determination. Curve recorded during isothermal annealing at 610°C in dry air.
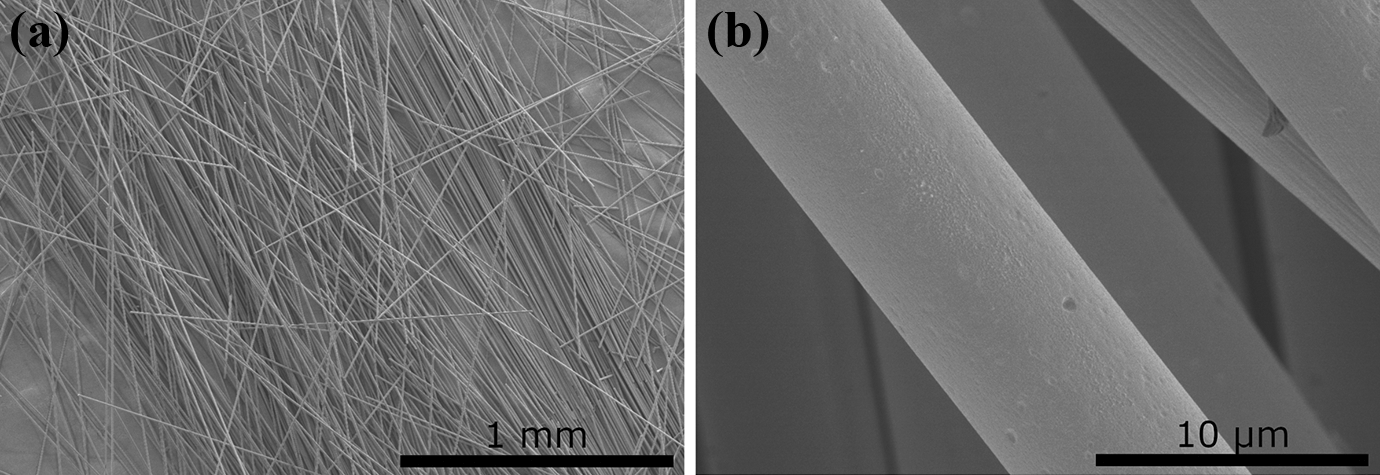
SEM images of the specimen exposed to a temperature of 610°C for 15 min in air atmosphere. SEM: scanning electron microscopy.
Using the thermogravimetric method described here, the fiber weight content was determined for unprocessed tape and three composite panels. Results are shown in Figure 9(a) along with the results obtained by chemical etching. If composite, polymer and fiber densities are known, it is possible to find volume content of fibers V f and voids V V
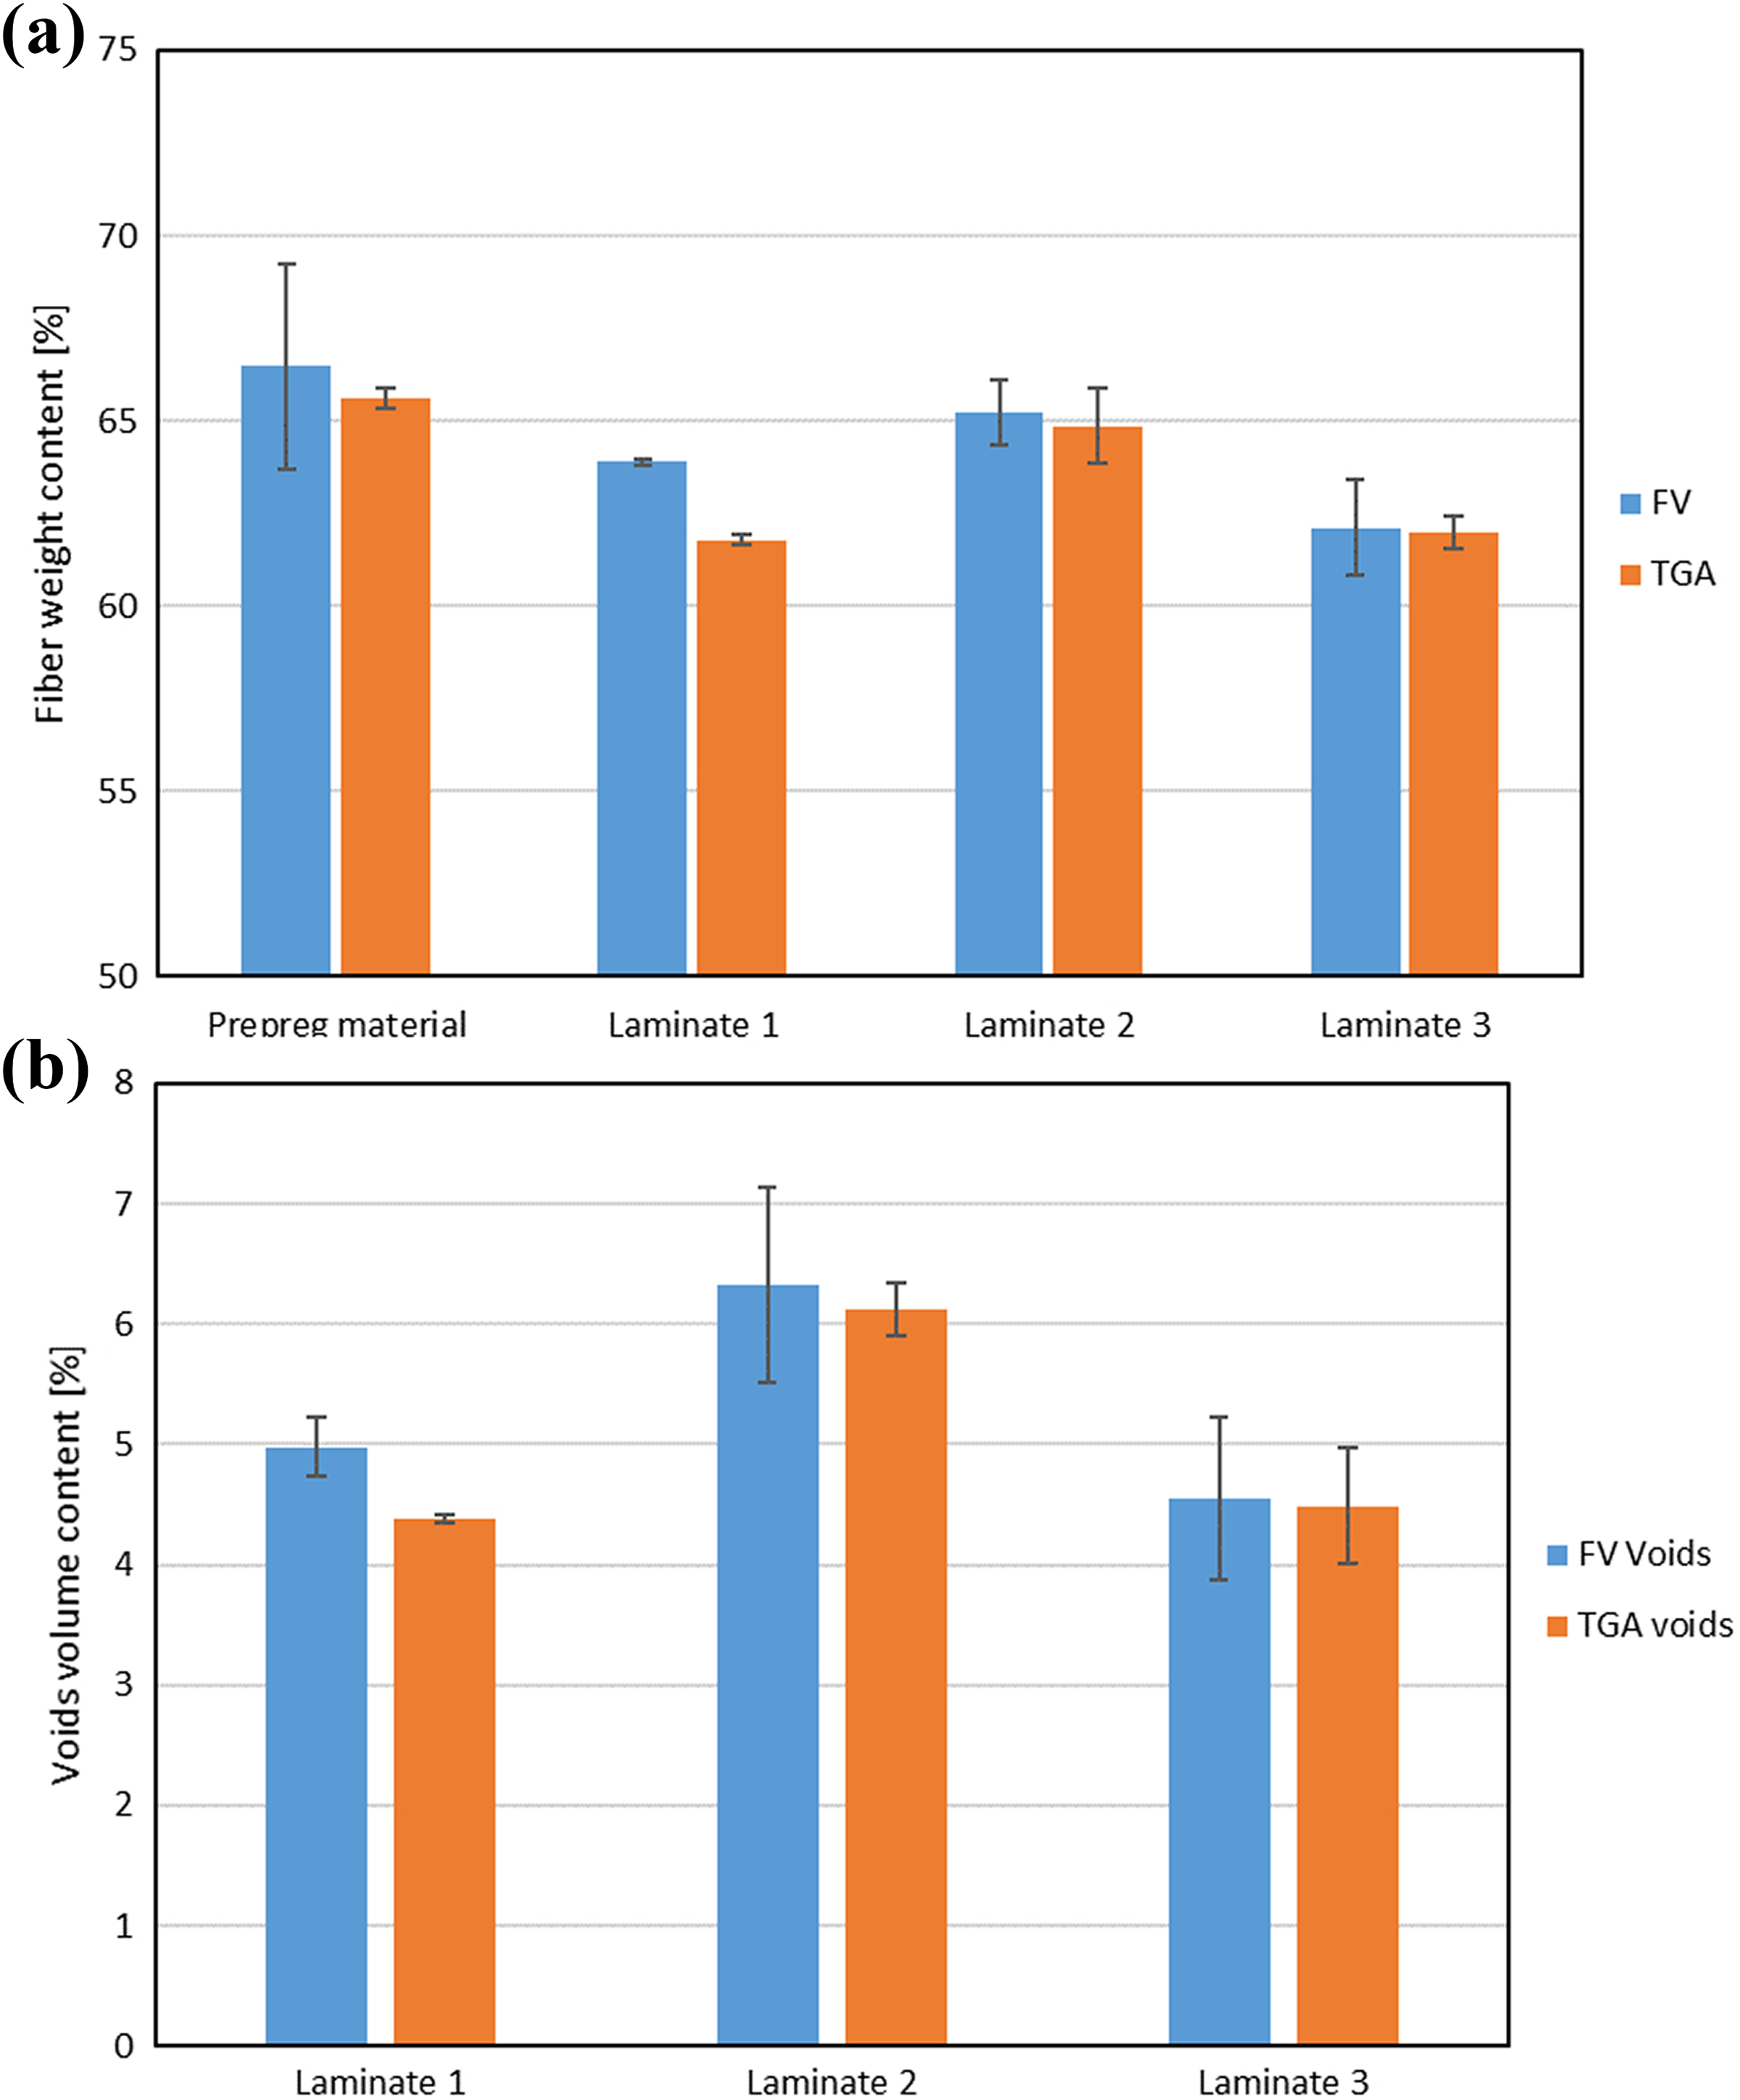
Comparison of results obtained by chemical etching and TGA methods. (a) Fiber mass content and (b) void volume fraction. TGA: Thermogravimetric analysis.
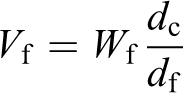
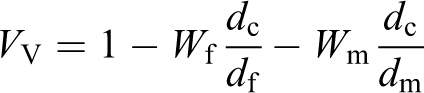
where W f and W m are weight fractions of fibers and matrix, respectively; d c, d f, and d m are densities of composite, fibers, and matrix, respectively.
Results of the latter are shown in Figure 9(b).
To confirm the assumed path of degradation, the kinetics of the degradation was studied. In rough approximation, the reaction kinetics could be described using an exponential equation
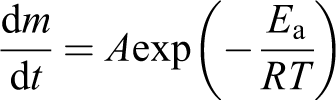
where dm/dt is the mass loss rate, A is a constant, E a is an activation energy of the reaction, R is a gas constant, and T is the temperature in kelvin.
The TGA curves for various temperatures (like ones shown in Figure 6) allow calculating the activation energy of reactions occurring before and after change of the lines’ slope. Results of such calculation are presented in Table 1 along with the values of activation energies of PEEK and carbon fiber degradation reaction reported by other authors.
Activation energies of the degradation processes.
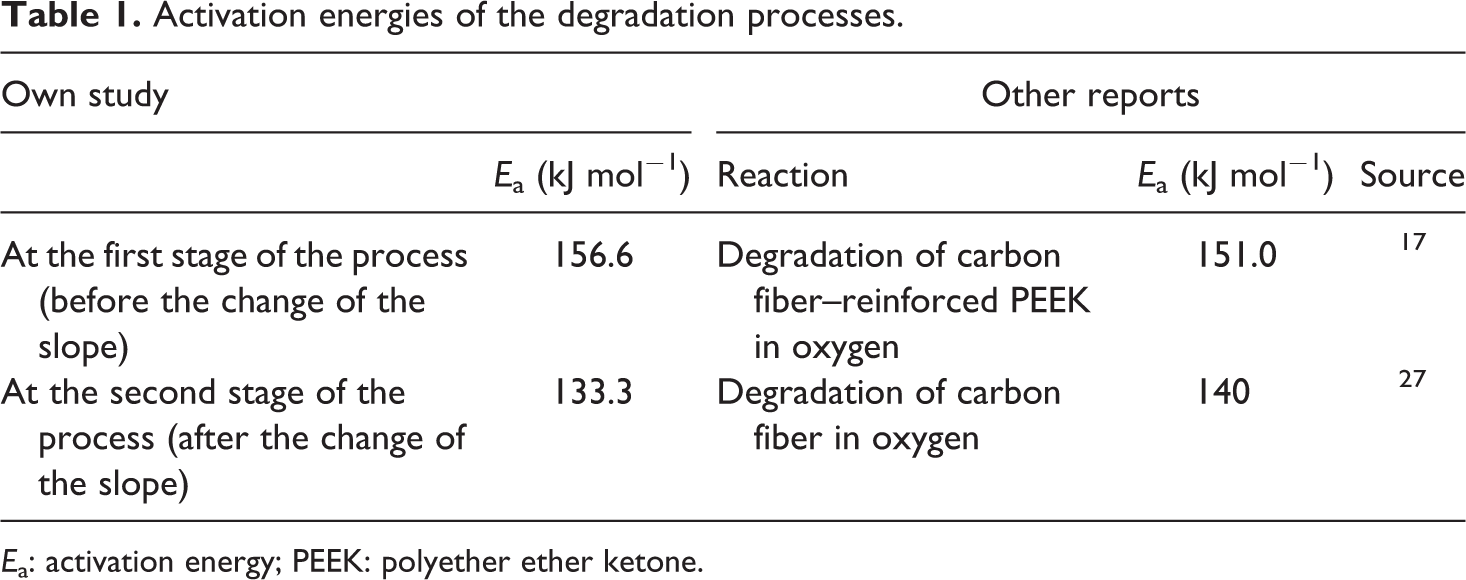
E a: activation energy; PEEK: polyether ether ketone.
The TGA results show good correlation with the ones obtained by matrix dissolution. The maximum difference of the fiber weight content is around 2%; however, typical differences are less than 1% and could be found in scatter bands of the chemical etching results. Using these two methods to assess the void content produced results with a difference smaller than 0.60%. The differences may be related to the fact that in each individual test other portion of the composite panel was investigated. The single composite panel may show some variations of fiber/resin and voids content when measured in various locations, which is the consequence of the manufacturing process (resin flow, uneven temperature distribution, etc.). Consequently, despite that tested specimens were cut from adjacent locations, they may slightly vary in composition. Since the samples for chemical etching test covered a larger portion of the panel, they may show larger scatter than small TGA specimens, which were cut from a limited area of the panel.
Extension of the method onto other matrices
From both laboratory and industrial standpoints, a single method designed to characterize various materials is highly desired. To verify whether the proposed method could be applied to a wider range of composites, four carbon fiber–reinforced composites were tested: two with PA (PA-6 and PA-12) and two with epoxy resin matrices. The representative mass loss curves for heating and isothermal annealing for both types of matrices are shown in Figure 10. PA matrices showed significantly lower resistance to elevated temperature than PEEK—the beginning of the polymer decomposition started at around 380-400°C and the maximum mass loss rate was reached at 465°C. Thus, the temperature of the isothermal annealing was reduced to 450°C. Figure 10(b) shows that at the selected temperature, the recorded curve has a clear change of the slope. The proposed method of fiber content evaluation was applied, and the obtained results match well with the results of the chemical etching (Figure 11). The degradation mechanism of epoxy resins (Figure 10(c)) showed three distinct mechanisms—the first which is most prominent at around 400°C, which corresponds to the beginning of polymer decomposition and loss of volatiles; 19 the second mechanism around 550°C, which is related to decomposition and burn-up of the resin. 19,22 The beginning of the peak corresponding to the domination of the third mechanism is visible to high temperatures—over 640°C. This mechanism is associated with the degradation of carbon fibers. 19,22,28
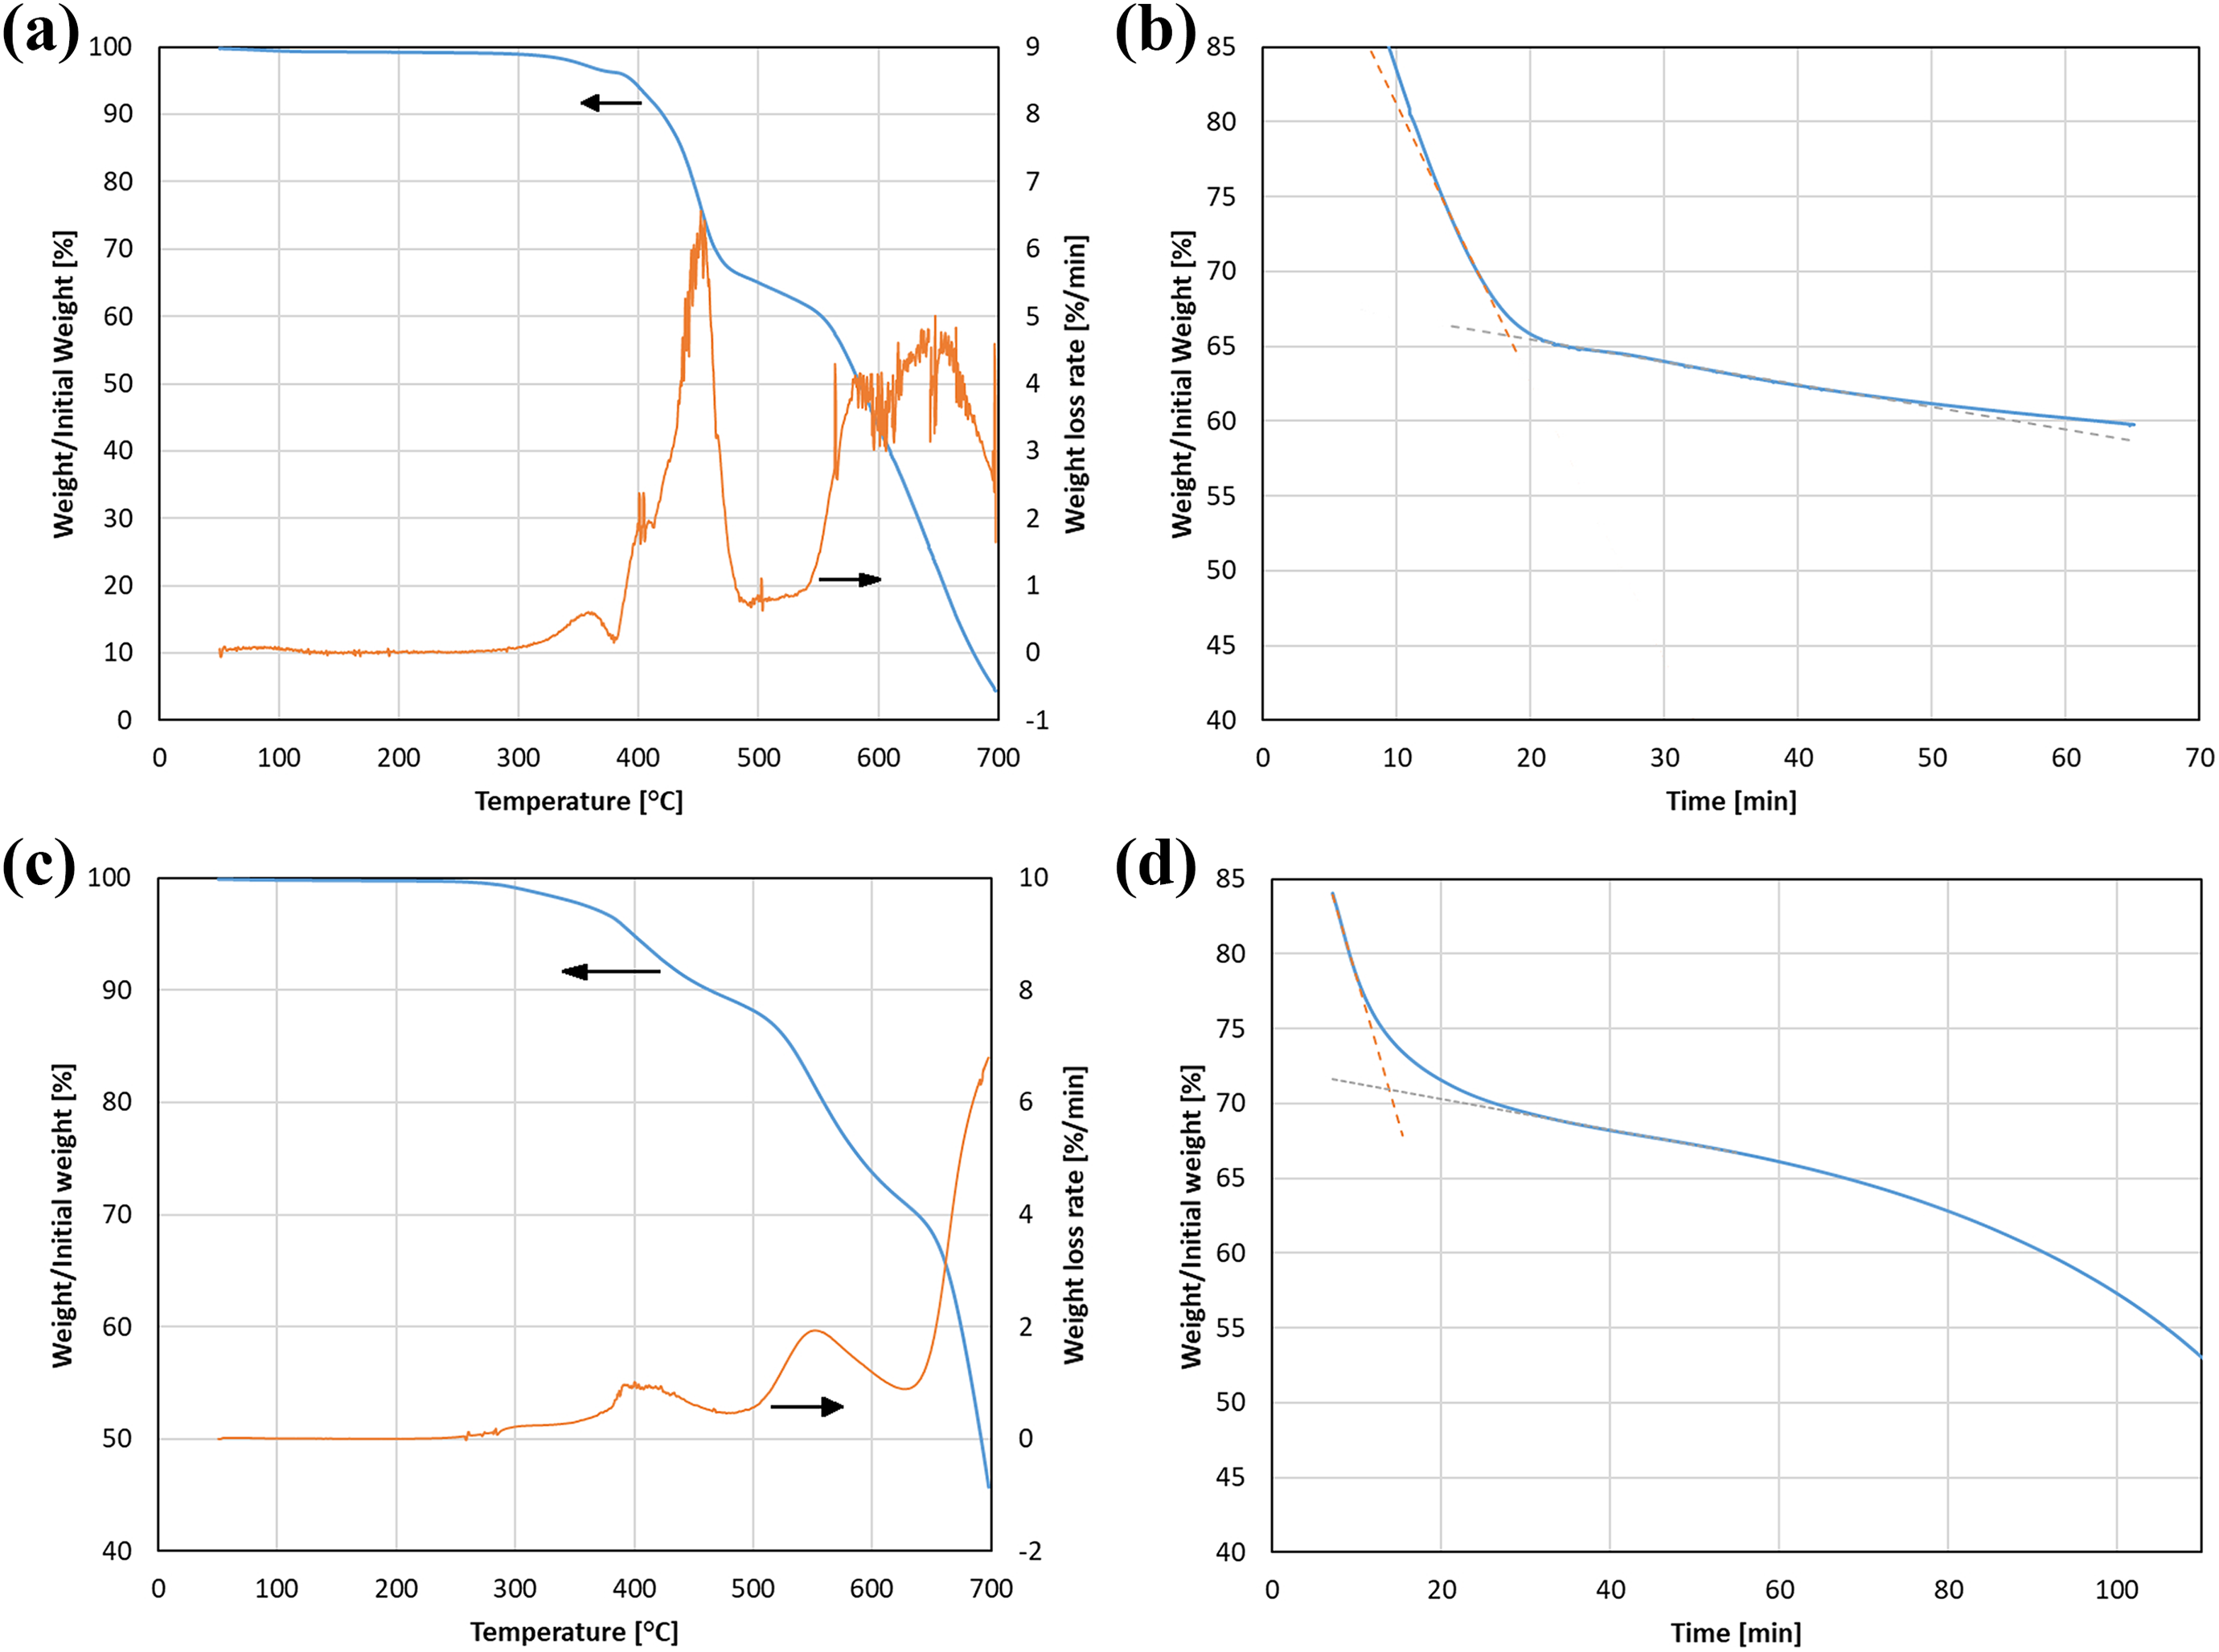
TGA curves recorded during (a) heating of carbon fiber—PA6 composites up to 700°C and (b) isothermal annealing at 450°C. Curves for carbon fiber–reinforced epoxy resin during (c) heating up to 700°C and (d) isothermal annealing at 550°C. All presented tests were carried out in dry air. TGA: Thermogravimetric analysis.
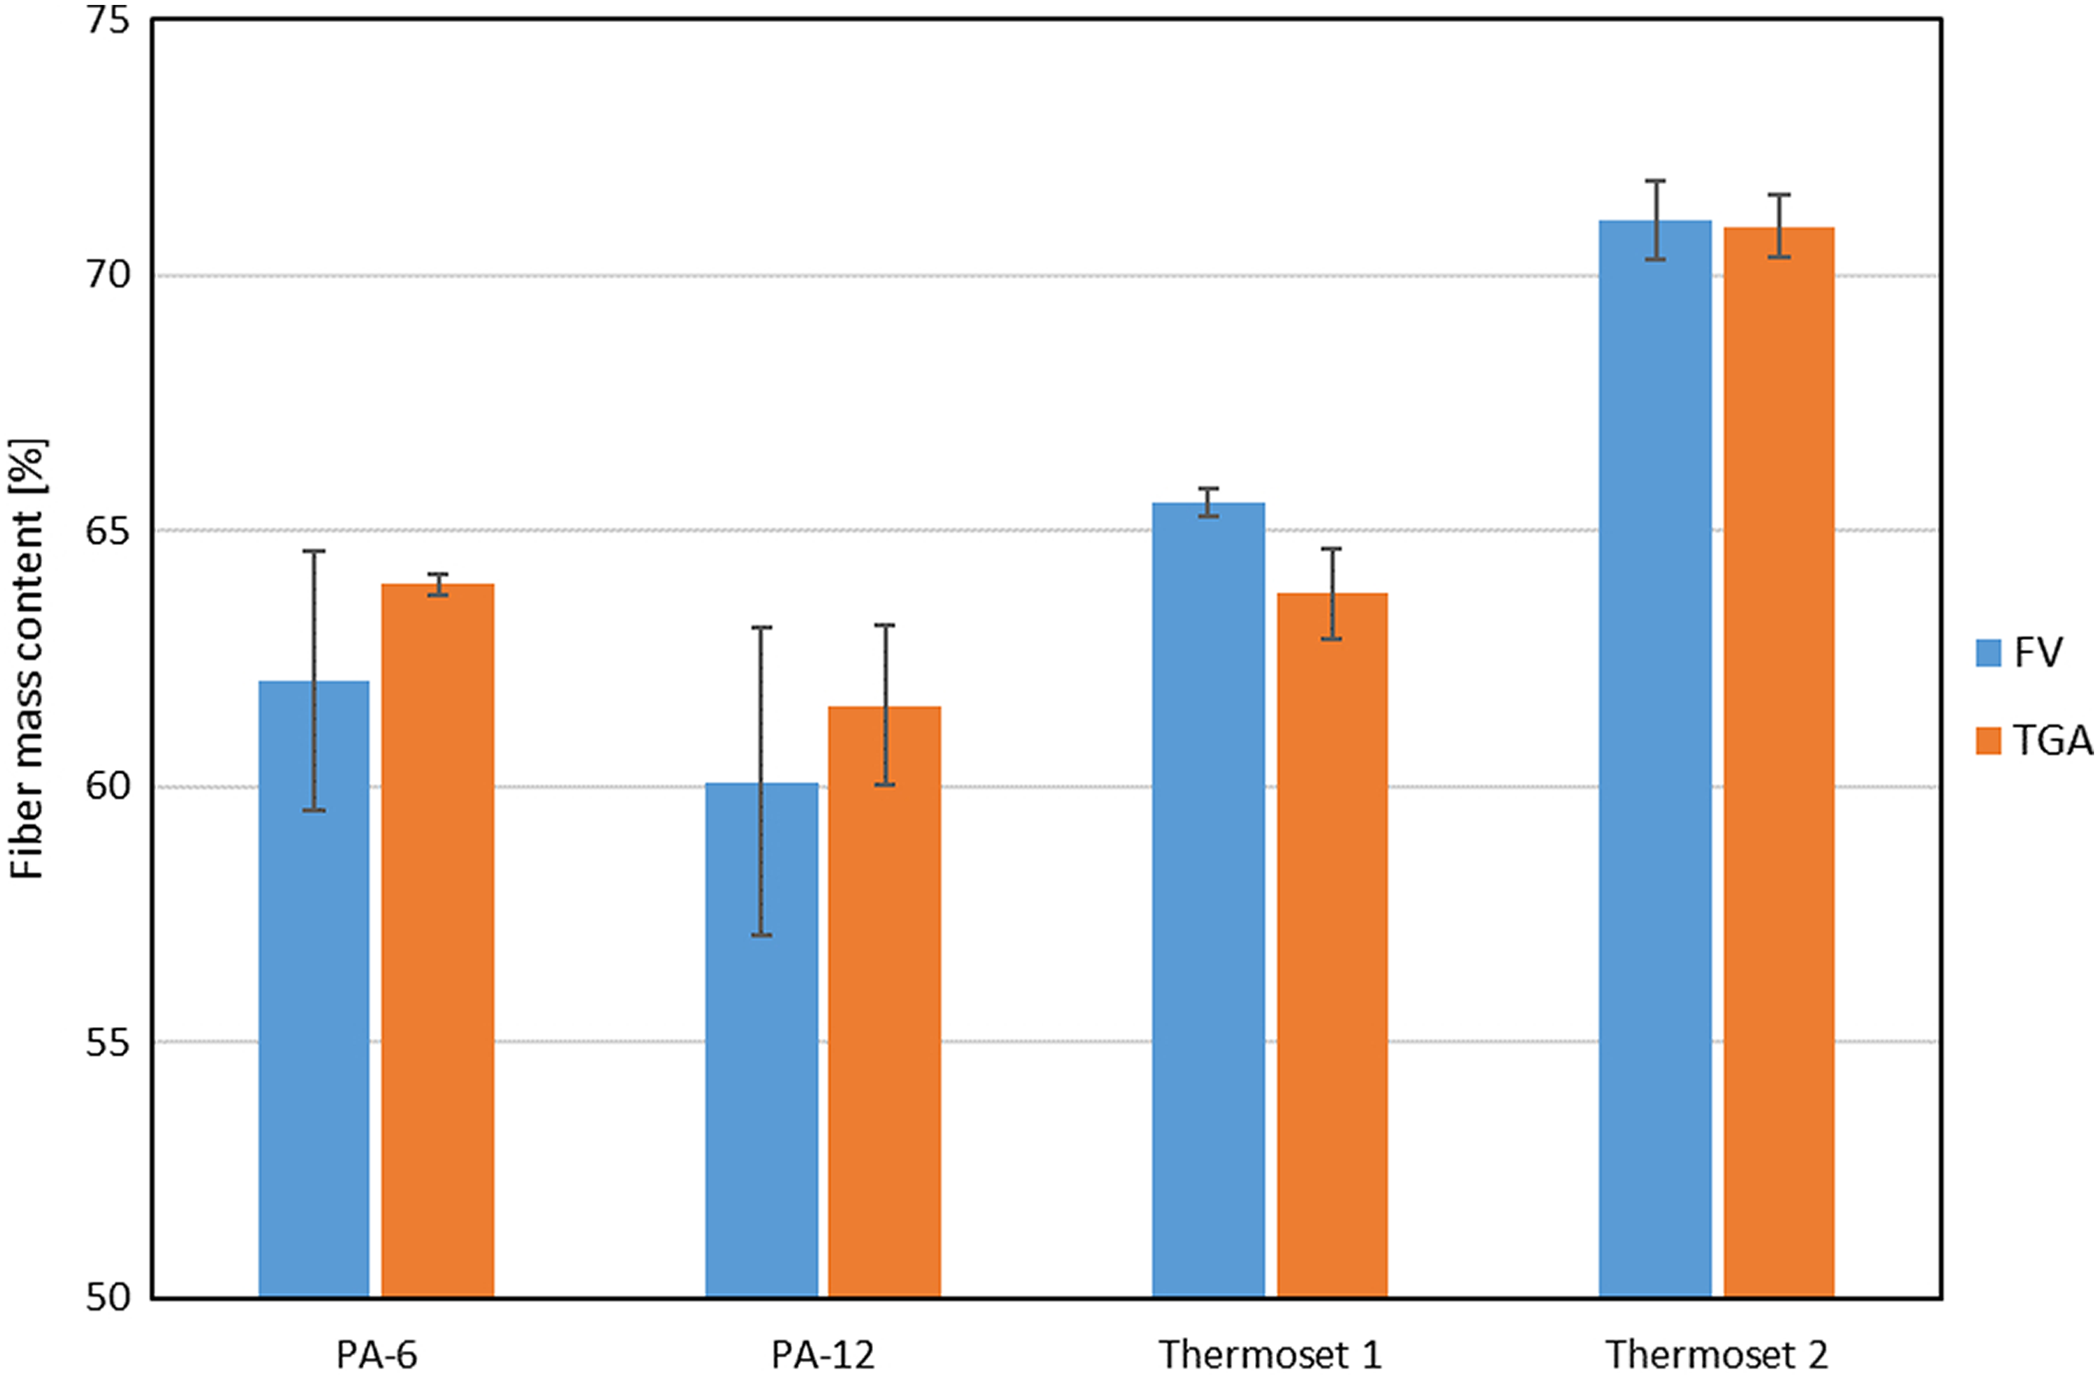
Results of carbon fiber volume fraction in two composites with PA matrices and in two composites with epoxy resin matrices. PA: polyamide.
Results of the tests are shown in Figure 11 along with the results of the chemical etching test. The diagram shows a very good match between the results obtained by two methods, which may prove potential of the TGA-based method to become universal characterization method.
Conclusions
The advanced thermoplastic polymers, such as PEEK, have been attracting the attention of composite engineers and have become a material of choice in many applications in, for example, aerospace industry. Some benefits of advanced thermoplastic polymers, such as high resistance to high temperature and chemical agents, are making them hard to test using standard methods. The study showed the ability of the TGA method to determine constituent content in composites with the thermoplastic polymer matrix. The TGA results did not show significant differences from the results obtained by chemical etching. Comparing both TGA and chemical etching methods, the former one has the following advantages which may develop increasing interest of both composite industry and researchers:
The chemical etching of advanced polymers requires severe conditions—high temperatures and aggressive, often toxic chemical agents. Such conditions could be hazardous of laboratory staff and environment. The TGA method does not require any chemical agents and the only pollution is a small volume of gaseous products of degradation.
Results obtained by the TGA method are comparable with the ones determined by other tests.
The TGA method is relatively fast and easy to automatize since many TGA devices are equipped with an autosampler.
The TGA method requires 20-50 times smaller volume of the specimen than the chemical etching.
The proposed TGA method is versatile and could be easily applied to other, than PEEK-based, groups of plastic-reinforced composites.
Footnotes
Funding
The author(s) received no financial support for the research, authorship, and/or publication of this article.