
Abstract
This paper investigates the processing parameters placement rate and tooling temperature of laser-assisted automated tape laying (ATL). Plates with carbon fiber-reinforced polyether ether ketone (CF/PEEK) were produced at 6 m/min, 9 m/min and 18 m/min, and 23°C and 250°C tooling temperature, respectively. Correlations of processing conditions with micrographs, void content, thickness, the degree of crystallinity and the shear strength of the compression shear test, including a fractographic analysis, were derived. Processing conditions that increase the degree of crystallinity were only found to improve the compression shear strength at 6 m/min placement rates, primarily due to a void content below 3.4 % and degree of crystallinity above 26 %. The fractographic analysis derived from the compression shear test revealed a strong correlation between the degree of crystallinity and the size of ductile drawings. In contrast, the transverse tensile test showed no influences on the ATL processing conditions, whereas the tensile strength in fiber direction decreased by 11 % from a placement rate of 6 m/min to 18 m/min. ATL with a 250°C tooling temperature increased the strengths by 14 % compared to those at room temperature. A further tensile strength improvement of 0° and 90° to 1754 MPa and 75 MPa was obtained by a subsequent out-of-autoclave consolidation using vacuum bagging.
Keywords
Introduction
Production processes following the basic principles of additive manufacturing technologies have been increasingly investigated. These processes are characterized by sequentially adding material to a part or structure. The mechanisms of automated tape laying (ATL) can be ascribed to this category of processes, in which tracks of endless fiber-reinforced tapes are placed down to a layer and stacked to a composite laminate. The benefit of thermoplastic matrices in these processes is their rapid, reversible phase transition from solid to liquid. In the latter phase, a cohesive bond is created by polymer chain diffusion and entanglement between the thermoplastic polymers. During the ATL process, these polymer matrices of the incoming fiber reinforced tape and substrate are heated above their melting temperature to allow for bonding. It is followed by the consolidation and cooling down underneath the consolidation unit, e.g. roller, within a fraction of a second. This mechanism can either be applied as a preforming process followed by a subsequent consolidation or to directly consolidate a part or structure (in-situ consolidation).
The application of ATL with in-situ consolidation has been demonstrated for primary structures with rotationally symmetric geometries.1–4 Also, autoclave reference-like mechanical properties on flat geometries at a placement rate of 1.52 m/min were shown. 5 However, the issues highlighted by Cogswell et al. in 1992 on thermoplastic tape laying on flat geometries, that the “ […] lack of complete consolidation and the problems of thermal distortion mean that […] this technology is used as an automated lay down strategy for subsequent full consolidation […]”, 6 represents the industry standard still today in ATL.
A solution for addressing the aspect of thermal distortion of flat geometries has been described and/or improved in models.7–10 More often, thermal process models have addressed the aspect of full consolidation by integrating intimate contact and polymer chain diffusion submodels to evaluate for adequate processing conditions. The validation is performed using tests that characterize the layer bonding properties.11–16 The results are transferred to sensitivity studies and classifications in a parametric analysis, 13 a neural network 17 and a surrogate model 18 to estimate the influence of single processing variables.
Experimental procedures for finding machine settings to obtain a high material performance of ATL that match references from presses or autoclaves have been widely investigated.19–24 Given that the ATL process bonds the incoming tape with a substrate to a laminate, it is convenient to perform mechanical tests that address the layer bonding properties with interlaminar shear strength, double cantilever beam, mandrel or wedge peel, and single lap shear tests as an indicator for laminate qualities and their correlation to processing parameters.22,25–35 Interpreting the test result and its transfer as objective criteria to adequate laminate qualities often remains challenging. It is due to the unknown correlations with structural design parameters, e.g. elastic moduli or strengths, for analytical or numerical calculations. The wedge-peel test is one prominent example as the failure mechanism is characterized by contradicting responses with the peel strengths either decreased or increased through brittleness, e.g. increased by the degree of crystallinity, and ductility, e.g. increased by the degree of bonding or moisture content, respectively.14,23,33 Therefore, it can lead to a misinterpretation of the test response and processing conditions for obtaining high material qualities, which are often associated with a more brittle behavior of semi-crystalline polymers to increase stiffness, strength and chemical resistance. The similar release energy-based failure mechanism of the double cantilever beam and their transfer to basic elasticities were only investigated by few authors using ATL. It indicates that a decreased fracture toughness may correlate with an increased bending32,36 and shear strengths. 22 Another often applied test is the interlaminar shear strength test (or short beam strength test), as summarized by. 28 It has been shown to correlate with the transverse tensile test, 12 but may not necessarily correlate with the flexural strength 37 and often lags of adequate failure mechanisms when applied on more ductile thermoplastic matrices. 14
More recently, the aspects of the interaction of the processing conditions of ATL, the degree of crystallinity, and mechanical properties have been addressed. It has been shown that mainly the tooling temperature increases the degree of crystallinity using low-melt polyaryletherketone 31 and carbon fiber-reinforced polyphenylene sulfide.24,38 An increased placement rate demonstrated no change of the degree of crystallinity using carbon fiber-reinforced low-melt polyaryletherketone, 31 whereas a decrease was observed with polyphenylene sulfide matrices.24,36 The relationship of a modulated degree of crystallinity using ATL to mechanical properties has been investigated in multiple studies. It has been demonstrated with the single-lap-shear, 31 transverse tensile 38 and bending test 36 with an increased test response, whereas the fracture toughness was decreased. 36 Even though the interlaminar shear strength test has been more widely applied, it has been demonstrated to have either no, 38 a small 24 or a distinct 36 sensitivity on the degree of crystallinity. However, in contrast to press processes, the variation of a single processing parameter of ATL often changes multiple others, as Chen et al. have demonstrated by including the void content into consideration, 24 showing an increasing void content at increased placement rates. Subsequent repassing using the ATL process has demonstrated a reduction of the void content,19,39 but no improvement of the mechanical indicators were obtained. 39
Increasing the placement rate of ATL and, thus, its productivity was investigated in this work. In addition, the usage of cost-ineffective heated tooling was analyzed as a potential material quality improvement. The applied quality measures were micrographs, the degree of crystallinity and the compression shear test, which was used as the layer bonding strength indicator. A fractographic analysis of the test results was performed and correlated to the processing variables. Finally, standard tensile tests were conducted to characterize the influences on basic linear structural design parameters as global macroscopic analysis. These insights demonstrate the complexity of developing adequate processing conditions and evaluating their performance.
Materials and Methods
ATL System
The robot-mounted ATL system was made by AFPT GmbH of Dörth, Germany (Figure 1(a)). The consolidation roller was the mid-sized roller from
40
of 64 mm outer diameter and 30 mm width. A silicone rubber jacket covers the water-cooled aluminum core. The laser heating source operates at a small band within the range of 1000 nm at center and was from Laserline GmbH, Mühlheim-Kärlich, Germany. The near-nip-point temperature, here the processing temperature, was controlled using a thermal camera as a temperature sensor set to an emissivity of one. Note that the real nip point is covered by a shadow from the consolidation roller as the incident angle from the laser optics was set to 28°. The divergence angle of the laser optic allows for adjusting the spot size depending on the tape width (Figure 1(b)). In this work, the spot size was set circa 5 mm wider than the tape on each side. Robot-based ATL system (a) with a heated table of 600 mm × 600 mm and (b) during tape laying.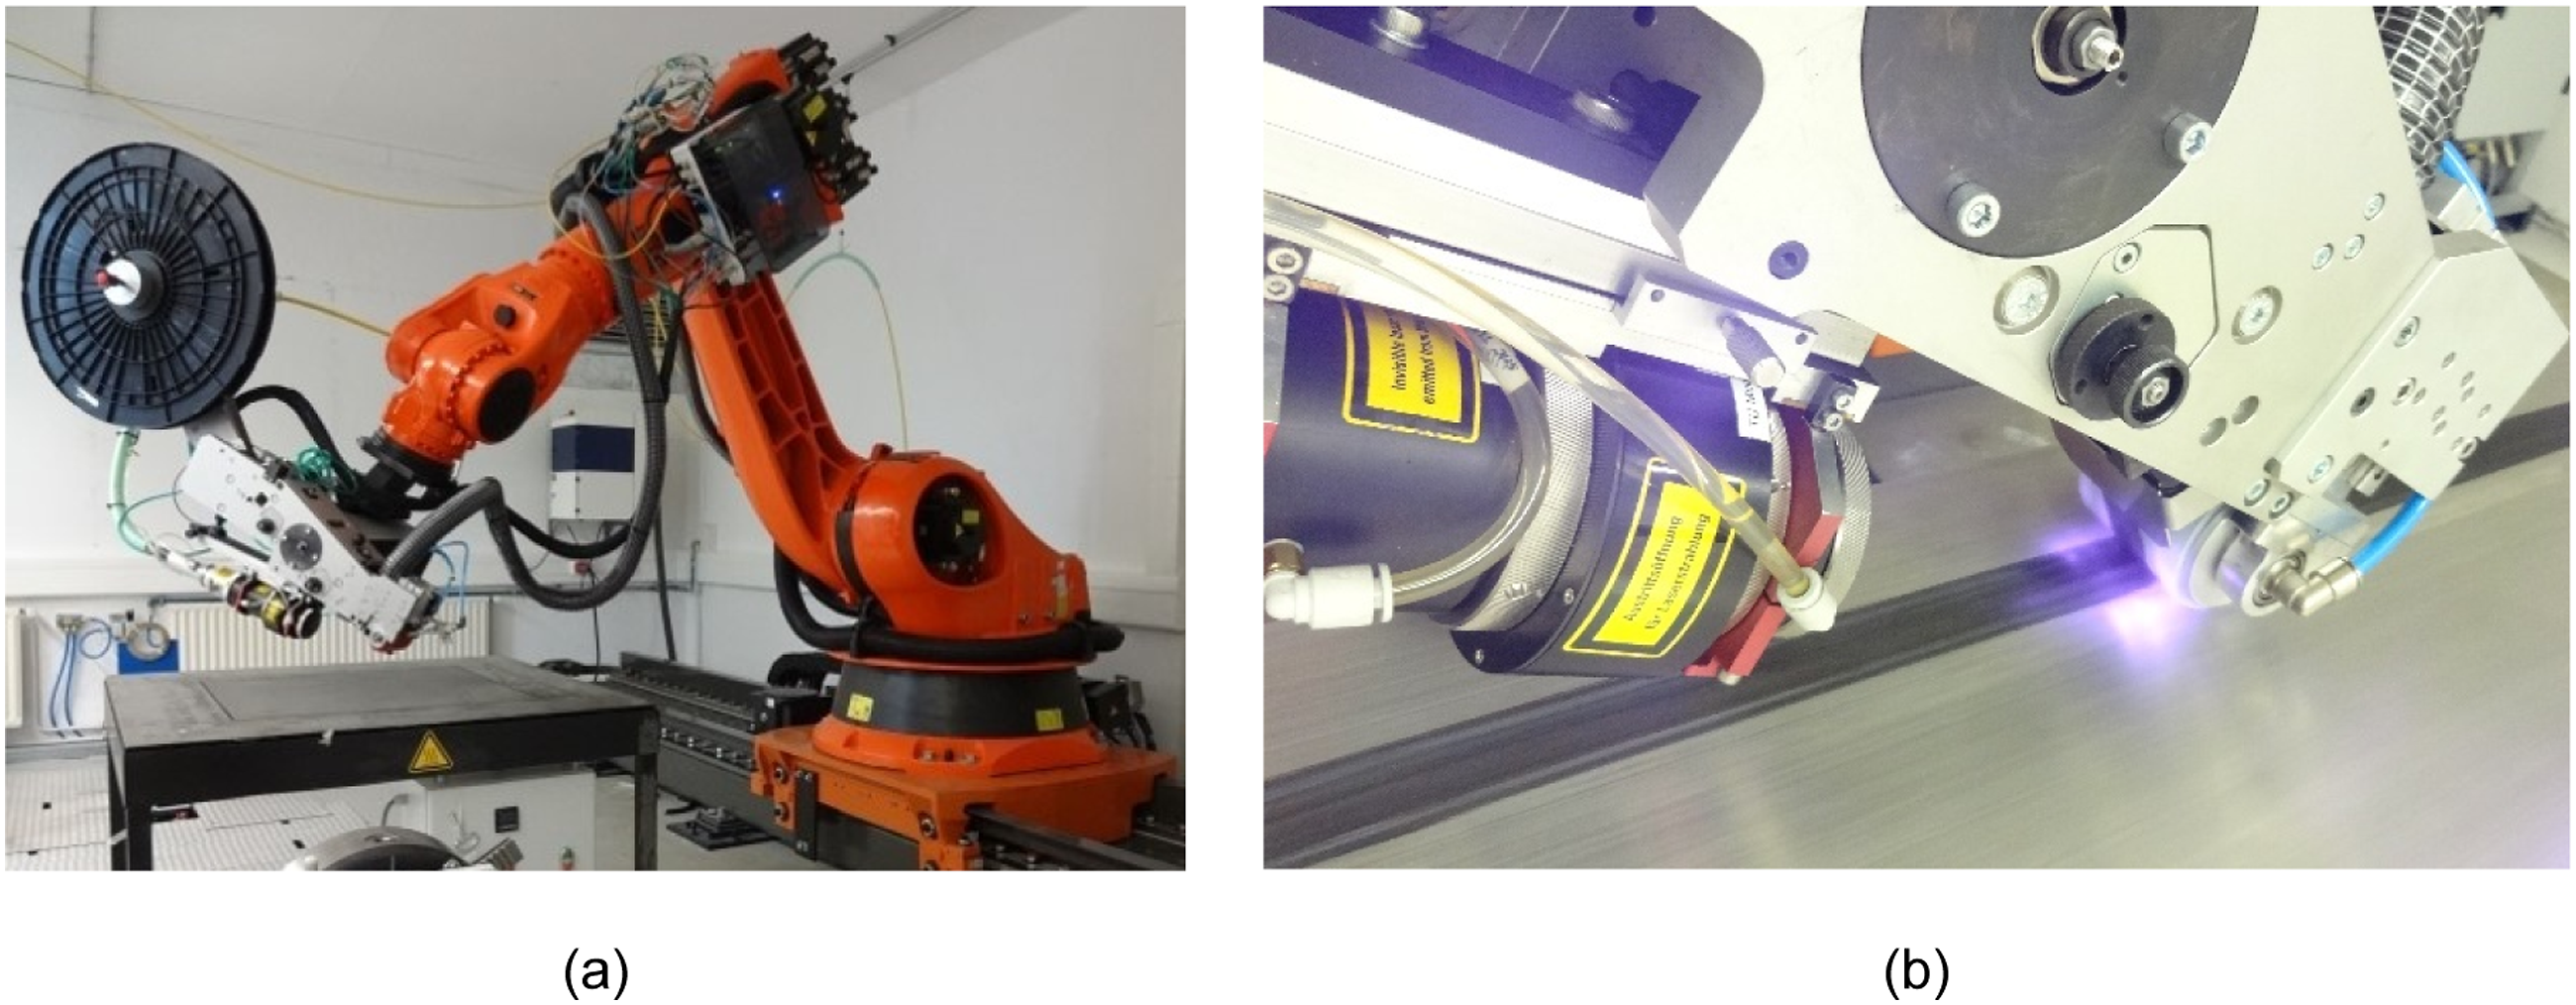
Material
The material under investigation was carbon fiber-reinforced thermoplastic tape with a Tenax®-E TPUD PEEK-2-34-HTS45 P12 12K-UD-145 polyether ether ketone matrix from Teijin Carbon Europe GmbH of Wuppertal, Germany. The carbon fiber of this tape was a HTS45 (Tenax®-E HTS45 P12 12K 800tex). At an areal weight of 145 g/m2, a fiber weight content of 66%, and a thickness of 0.14 mm, the main 12″ spool was slitted to ½” slit tapes prior to the ATL process.
Experimental Design
Processing conditions at the processing temperature of 480°C and conducted tests and analysis.
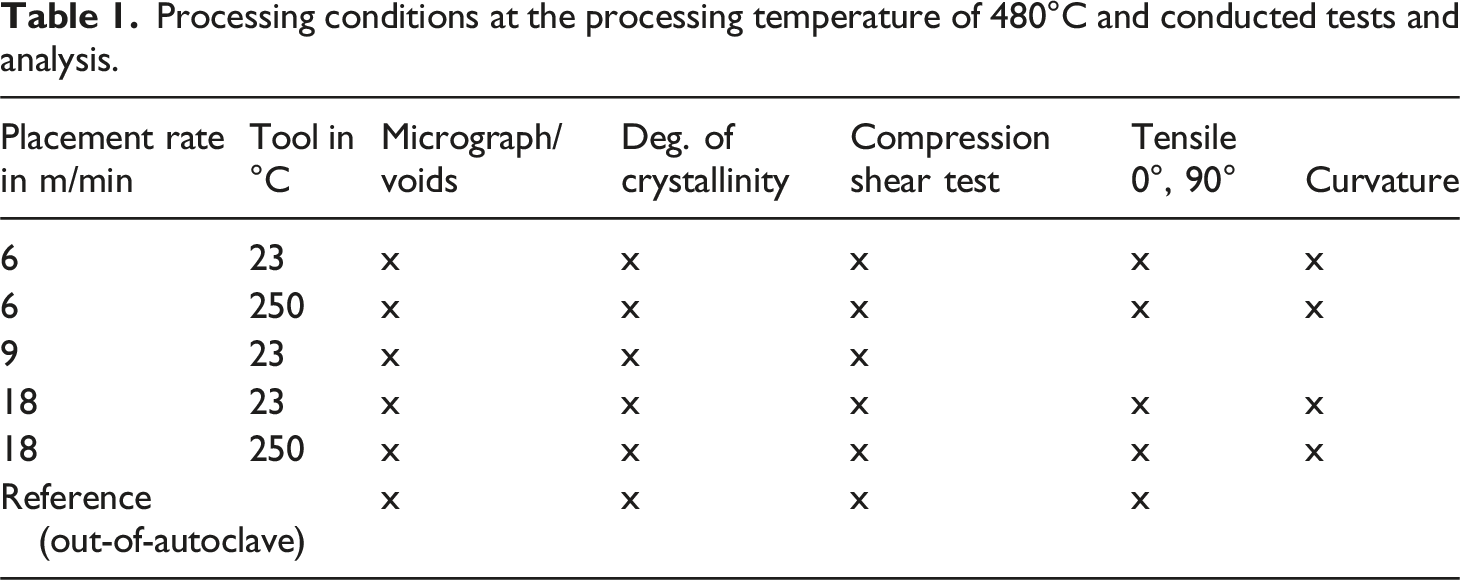
The tooling temperature of 250°C was chosen based on the central point between melting and glass transition temperatures. In addition, isothermal crystallization at this temperature is possible of the PEEK matrix. Unidirectional plates consisting of 16 layers with a length of 600 mm and width of 300 mm and were manufactured using the processing conditions of Table 1. Further references were produced using vacuum bagging post-consolidation (see later this section).
A constant consolidation force of 370 N was applied throughout all the experimental trials. The processing temperature was set to 480°C throughout all placement trails, yielding the approximate observed laser powers at 6 m/min of 1100 W and 900 W for the tooling temperature of 23°C and 250°C, respectively. The increase of placement rate to 9 m/min increased the power to 1400 W. At 18 m/min, 2400 W and 2100 W were monitored for the lower and higher tooling temperatures, respectively.
Out-of-Autoclave Post-consolidation
Unidirectional ATL plates of 300 mm × 300 mm (length x width) were utilized for a subsequent consolidation step. The vacuum bagging set-up consisted of a steel plate, polyimide films (perforated), boundary steel plates and a caul plate (Figure 2). A light glass weave was placed under the caul plate to achieve a good surface quality and air exchange to the vacuum outlet. A heavy weave was put on top of the caul plate. A polyimide film was used as vacuum film to withstand the consolidation temperature of 395°C for 15 min at atmospheric pressure and sealed using the vacuum sealant tape (GS A-800-3G Sealant Tape, Generals Sealants Inc., City of Industry, CA, USA). During the consolidation cycle, the vacuum pressure was below 4 mbar (measured at the vacuum pump) with a cooling rate of 10°C/min to the demolding temperature of 140°C. Vacuum bagging for the out-of-autoclave subsequent consolidation.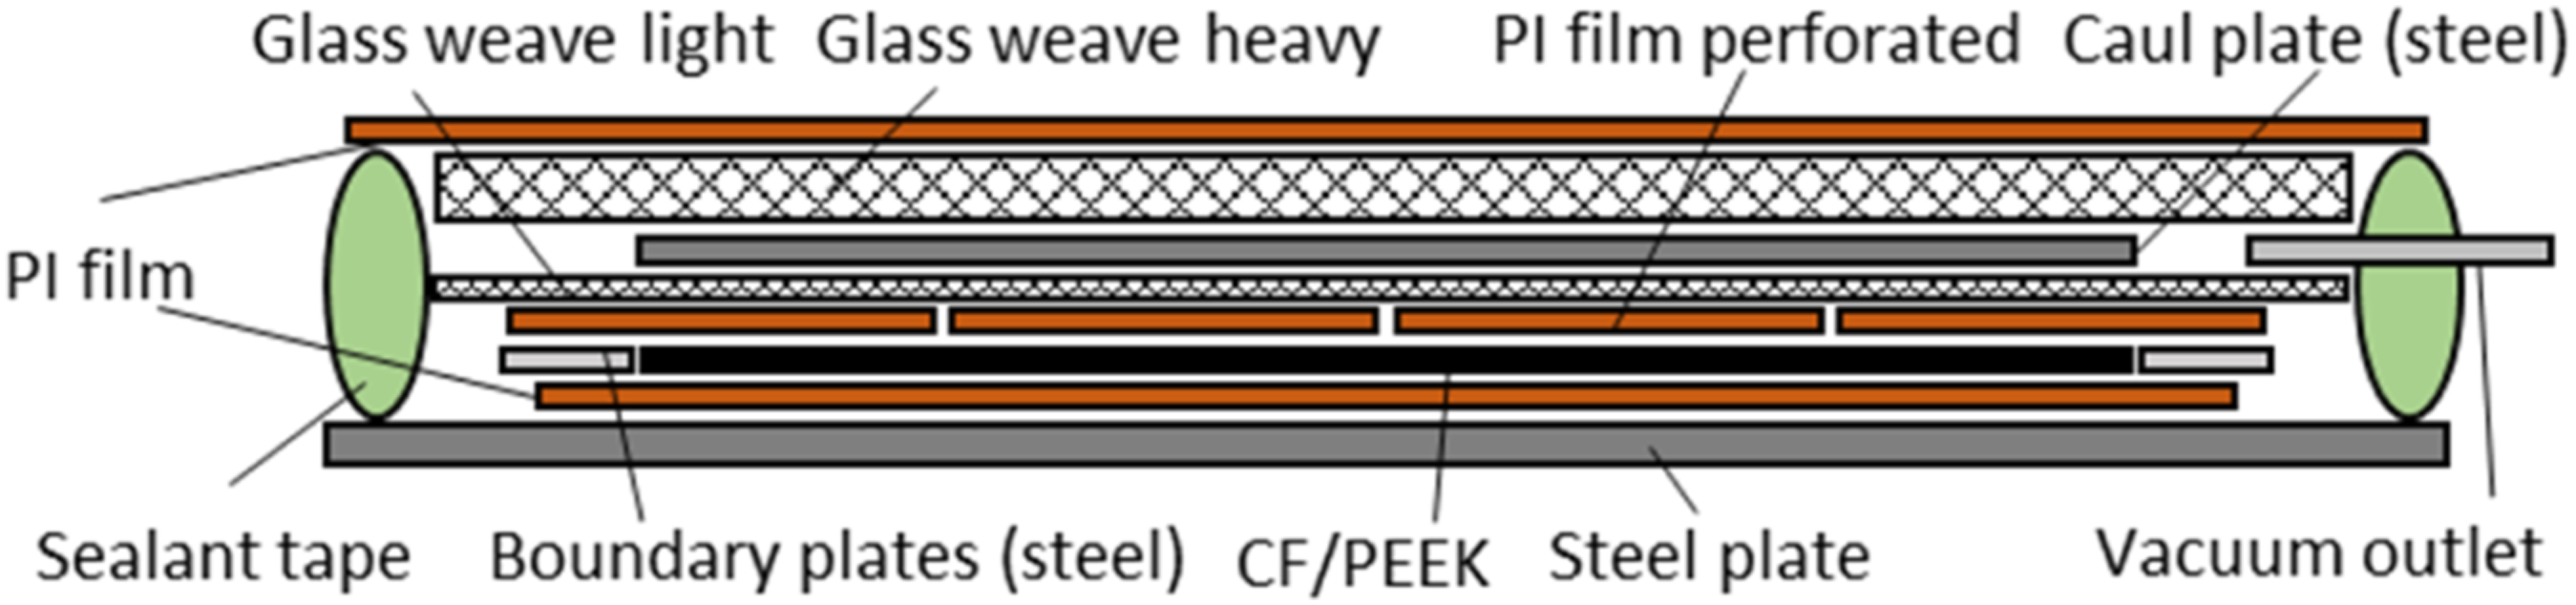
Degree of Crystallinity
The differential scanning calorimetry (DSC) specimens were extracted through the laminate thickness using a diamond hollow drill with an inner core diameter of 4.5 mm with isopropyl alcohol as a coolant during the drilling process. Three specimens for each series were tested using a DSC 8500 from PerkinElmer, Inc. of Waltham, MA, USA, and referenced to 
Microscopy, Scanning Electron Microscopy, Void Content and Specimen Profiles
Small samples were cut out of the plates produced for the mechanical testing, embedded into resin and further polished for the microscopic analysis. The void content was analyzed using image processing of the micrographs. Three specimens of 10 mm width were analyzed for every processing condition by merging multiple images to the entire cross-section. The result part of this work displays representative images from each processing condition. Further, a scanning electron microscope was used to analyze the fracture patterns derived from the compression shear tests. Hight profiles of the plates were recorded with a Keyence VR5000 3D optical profiler, Keyence, Osaka, Japan. With the maximum length of the device is 200 mm, sections of the ATL plates were cut to this length.
Mechanical Analysis
Compression Shear Test
Compression shear tests were performed to characterize the layer bonding strength. This test has already been applied on carbon fiber-reinforced polyamide 6 composites40,41 and metal hybrids
40
using ATL. This non-standardized test is schematically shown in Figure 3(a). The unidirectional specimens are loaded parallel to the reinforcing fiber. The maximum shear strength of the layer interface with (a) Schematic principle of the compression shear test. The red arrows demonstrate the possibility of individual specimen thickness adjustment and load introduction area for each side of the specimen. (b) Specimen of the compression shear test with a 10 mm width and 6 mm length.
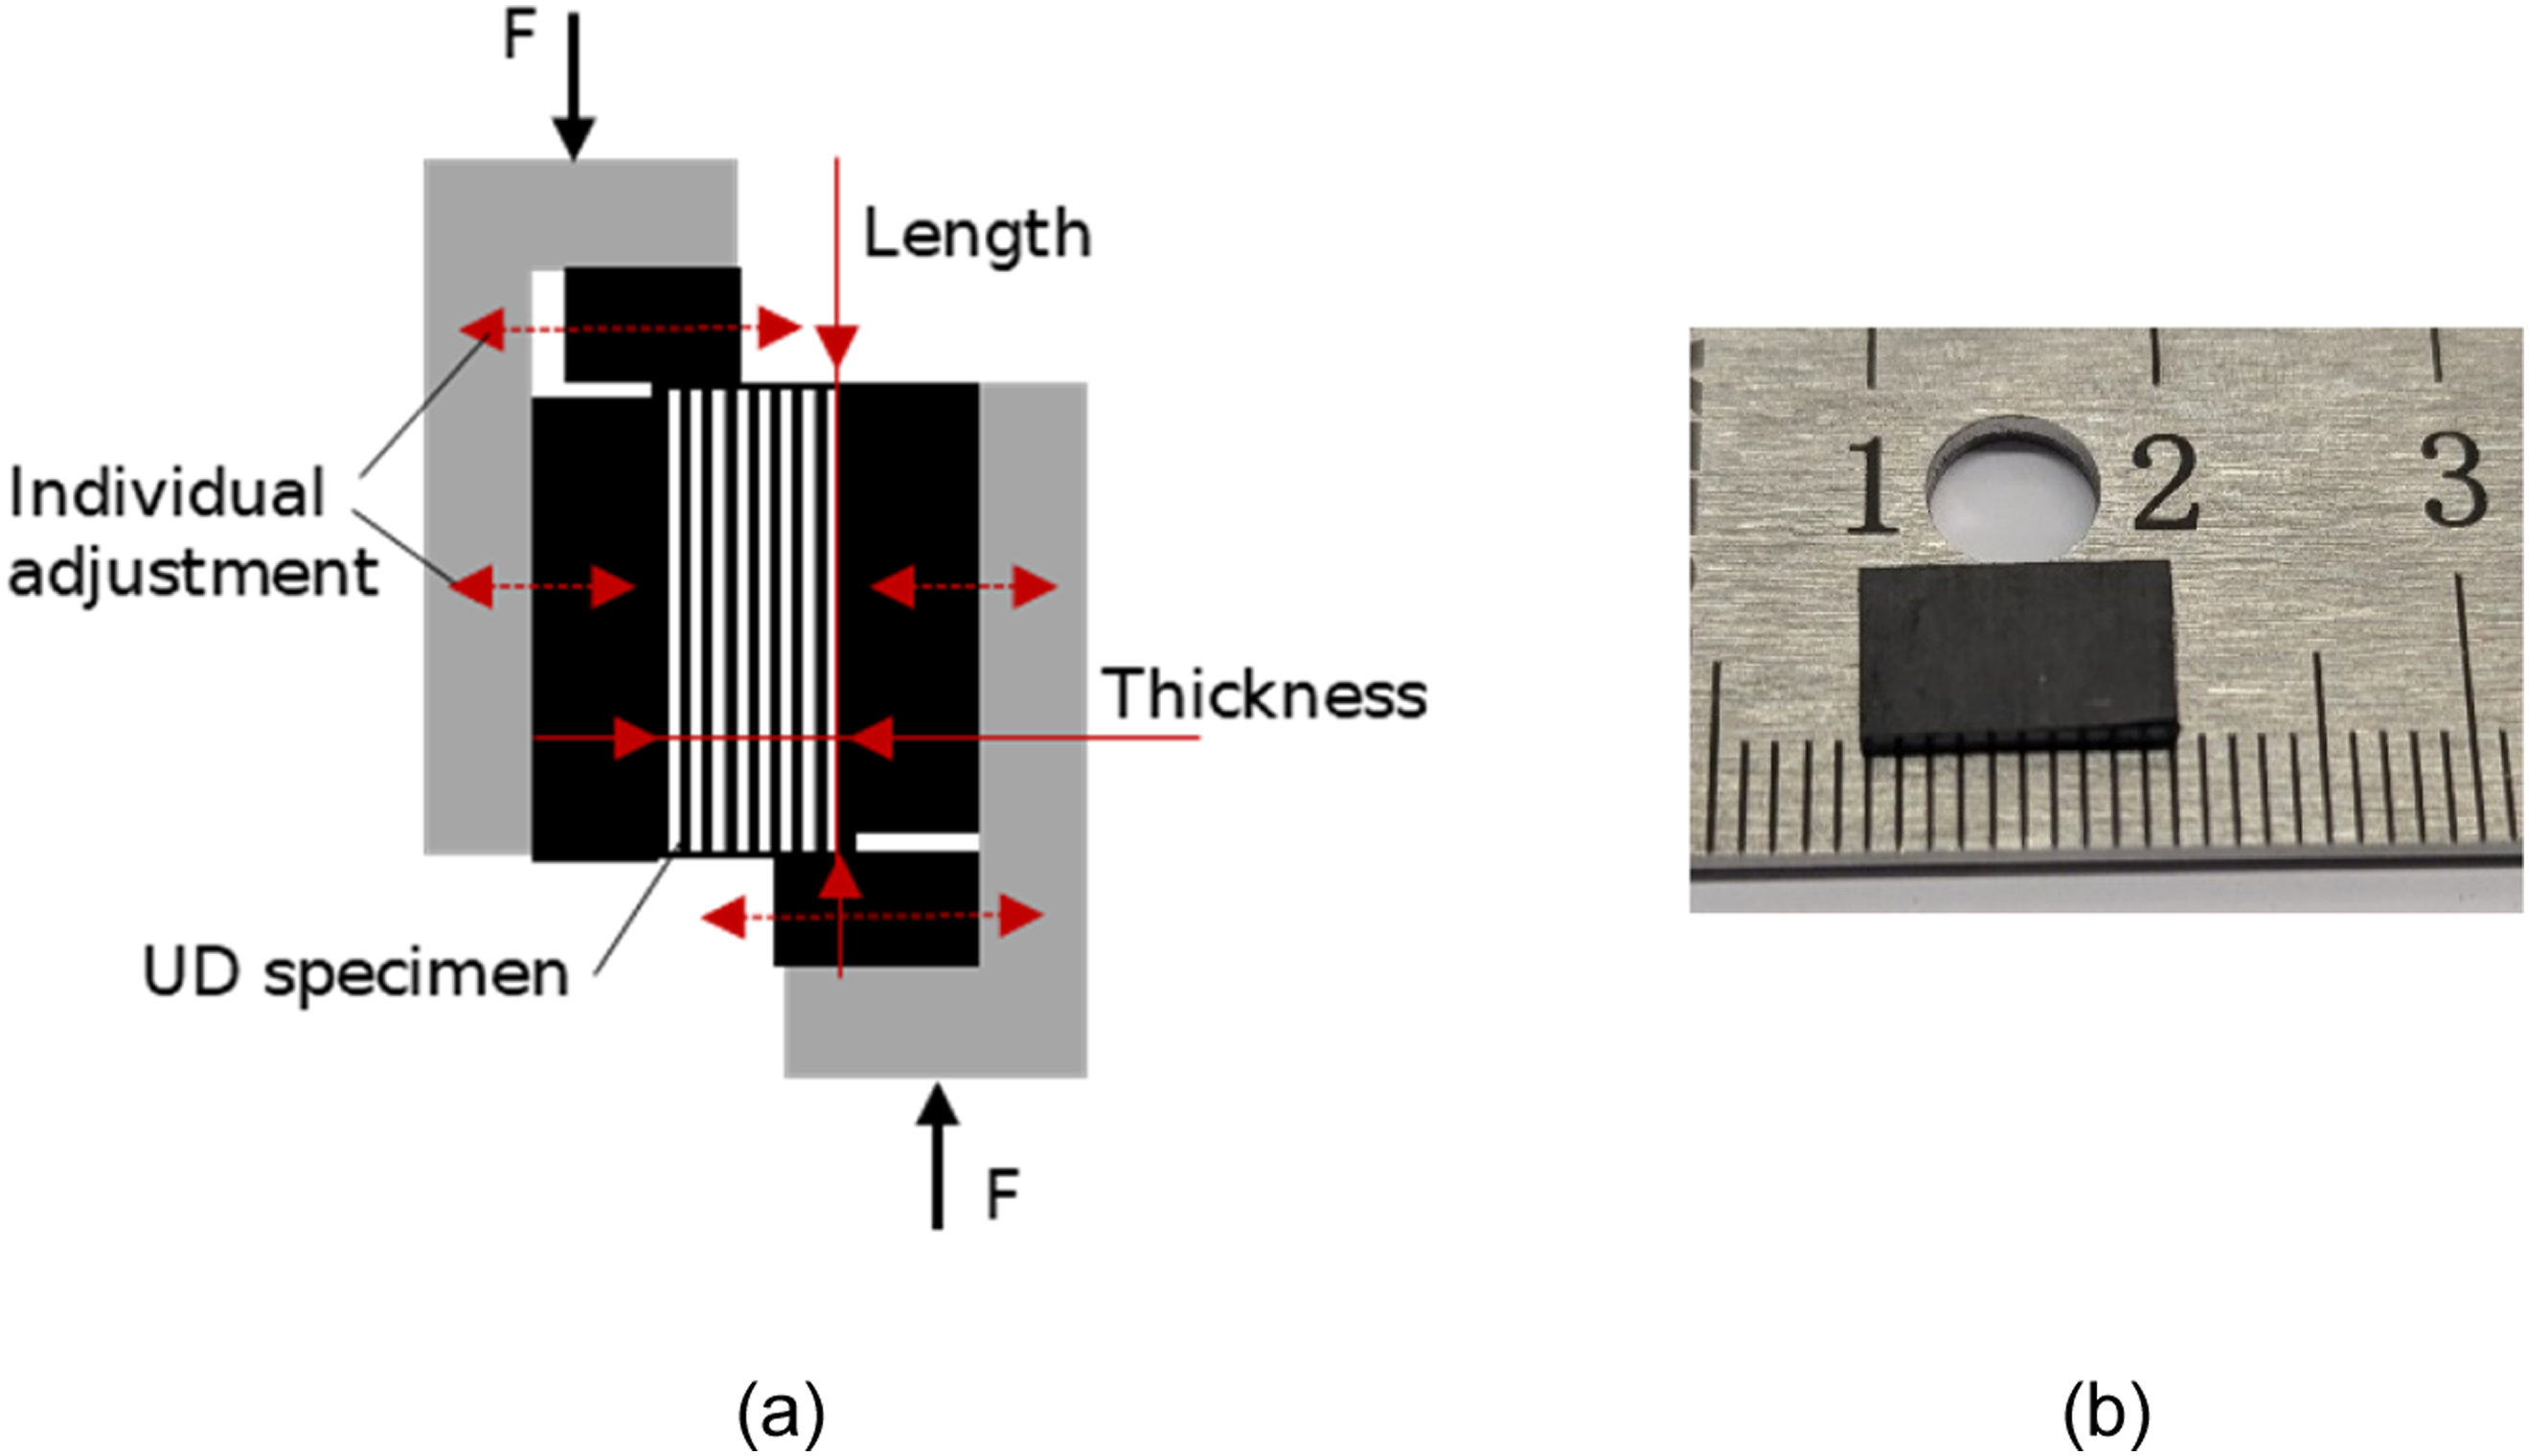
The thickness of the specimen is not a parameter of this test. The fixture is adjustable for varying specimen thicknesses as the shear load introduction is individually adjusted for the positions of the back of the specimen and the load introduction position. Therefore, the test is considered independent of the specimen thickness. It is an advantage over tests such as the interlaminar shear strength test (or short beam strength) or single lap shear test, with defined bearing lengths to thickness ratios and the superposition of bending moments with the shear stress, respectively, because ATL specimens derived from different processing conditions may vary in thickness (see result section). Further, the compression shear test is applicable on more ductile matrices using ATL, such as PA6, in contrast to the interlaminar shear strength test. It is therefore of interest to apply the compression shear test to ATL materials and describe the correlations of layer shear strength to tests and analysis performed in this work.
In this work, the compression shear test specimens consisted of 16 unidirectional layers and were cut into 10 mm length and 6 mm width (Figure 3(b)) for each of the five specimens of every series of Table 1. The quasi-static universal testing machine was utilized with a 10 kN load cell with a 0.5 mm/min testing speed.
Tensile Tests
Tensile tests in and transverse to the reinforcing fiber were performed to estimate the influence of the processing conditions on general linear elastic transversal isotropic mechanical properties. In fiber direction, tests were conducted following DIN EN 2561 using specimen type A with a 10 mm width and a testing speed of 2 mm/min. Transverse tensile tests were performed following DIN EN ISO 527-5. The specimen type B with 25 mm width was tested at a speed of 1 mm/min. The specimen consisted of 16 layers. The strain measurements were performed using the digital image correlation system with stereo cameras ARAMIS 4M from Carl Zeiss GOM Metrology GmbH, Braunschweig, Germany. For that purpose, a stochastic pattern was sprayed on the surface.
Results and Discussions
Micrographs, Void Content and Laminate Thickness
Micrographs are shown in Figure 4. The slowest placement rate of 6 m/min indicates a distribution of small voids throughout the specimen, with minor indications of their presence between the layers, yielding a 2.54 ± 0.05 % void content. At the tooling temperature of 250°C, a slight increase of void appearances between the layers is revealed with a content of 3.4 ± 0.08 %. The void content is reduced to 3.1 ± 0.13 % at the increased placement rate of 9 m/min. However, macro voids and small voids found at 6 m/min and the tooling temperature of 23°C were present. Increasing the placement rate to 18 m/min further increased the number of macro voids to an overall void content to 11.03 ± 0.15 %. The separation of the layers by voids now becomes more pronounced at the tooling temperature of 23°C and is further increased at 250°C tooling temperature even though the overall void content was decreased to 9.01 ± 0.26 %. The post-consolidated micrographs only comprised a void content of 0.71 ± 0.08 % with distinct void concentration areas. Further, it becomes clear that the tooling temperature of 250°C generates a deconsolidation-like behavior as the voids between the individual layers become more pronounced than at lower tooling temperatures, with macro voids primarily accounting for the increased placement rate. Micrographs at placement rates of 6 m/min, 9 m/min and 18 m/min, tooling temperatures of 23°C and 250°C and out-of-autoclave (OoA) post-consolidated laminates.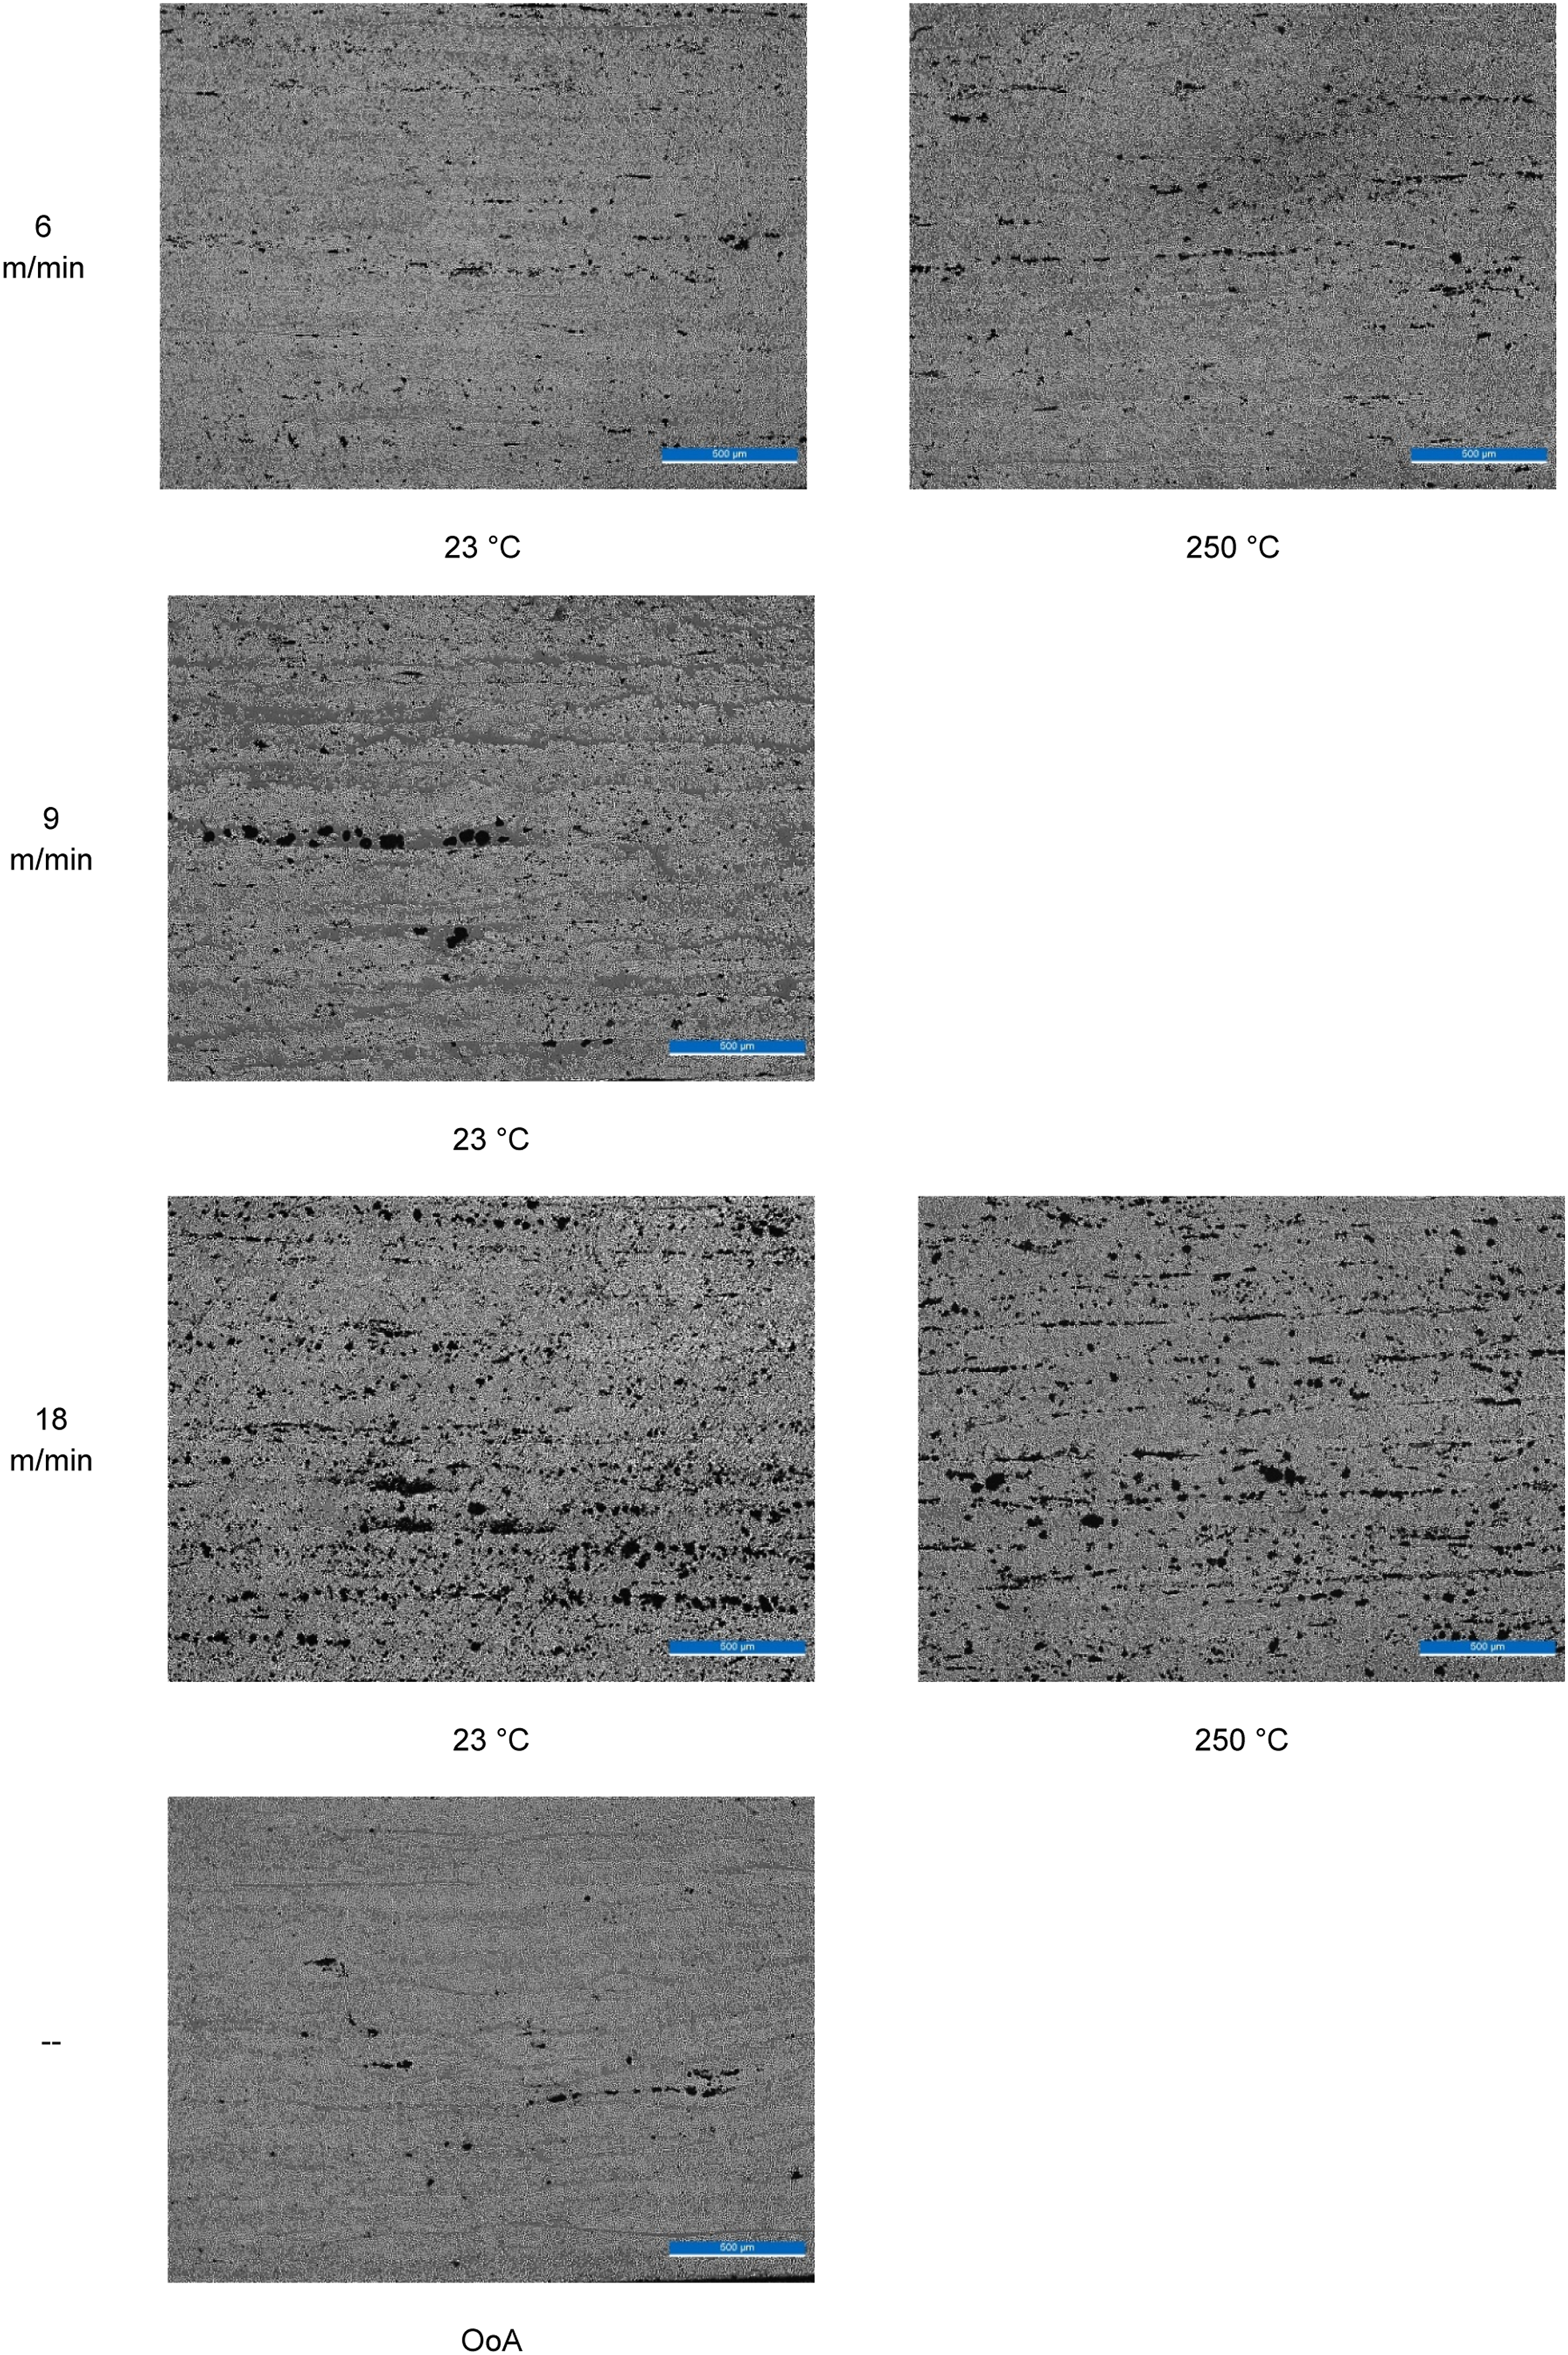
Further, the thickness derived from different processing conditions of the 16 layers correlates to the porosity from the micrographs. The lowest thicknesses were found at a 6 m/min placement rate and post-consolidated specimen (Figure 5). An increased placement rate and tooling temperature resulted in increased measured thicknesses. Thicknesses of 16 unidirectional layers derived from the ATL processing and subsequent out-of-autoclave consolidation (OoA) of all specimens tested.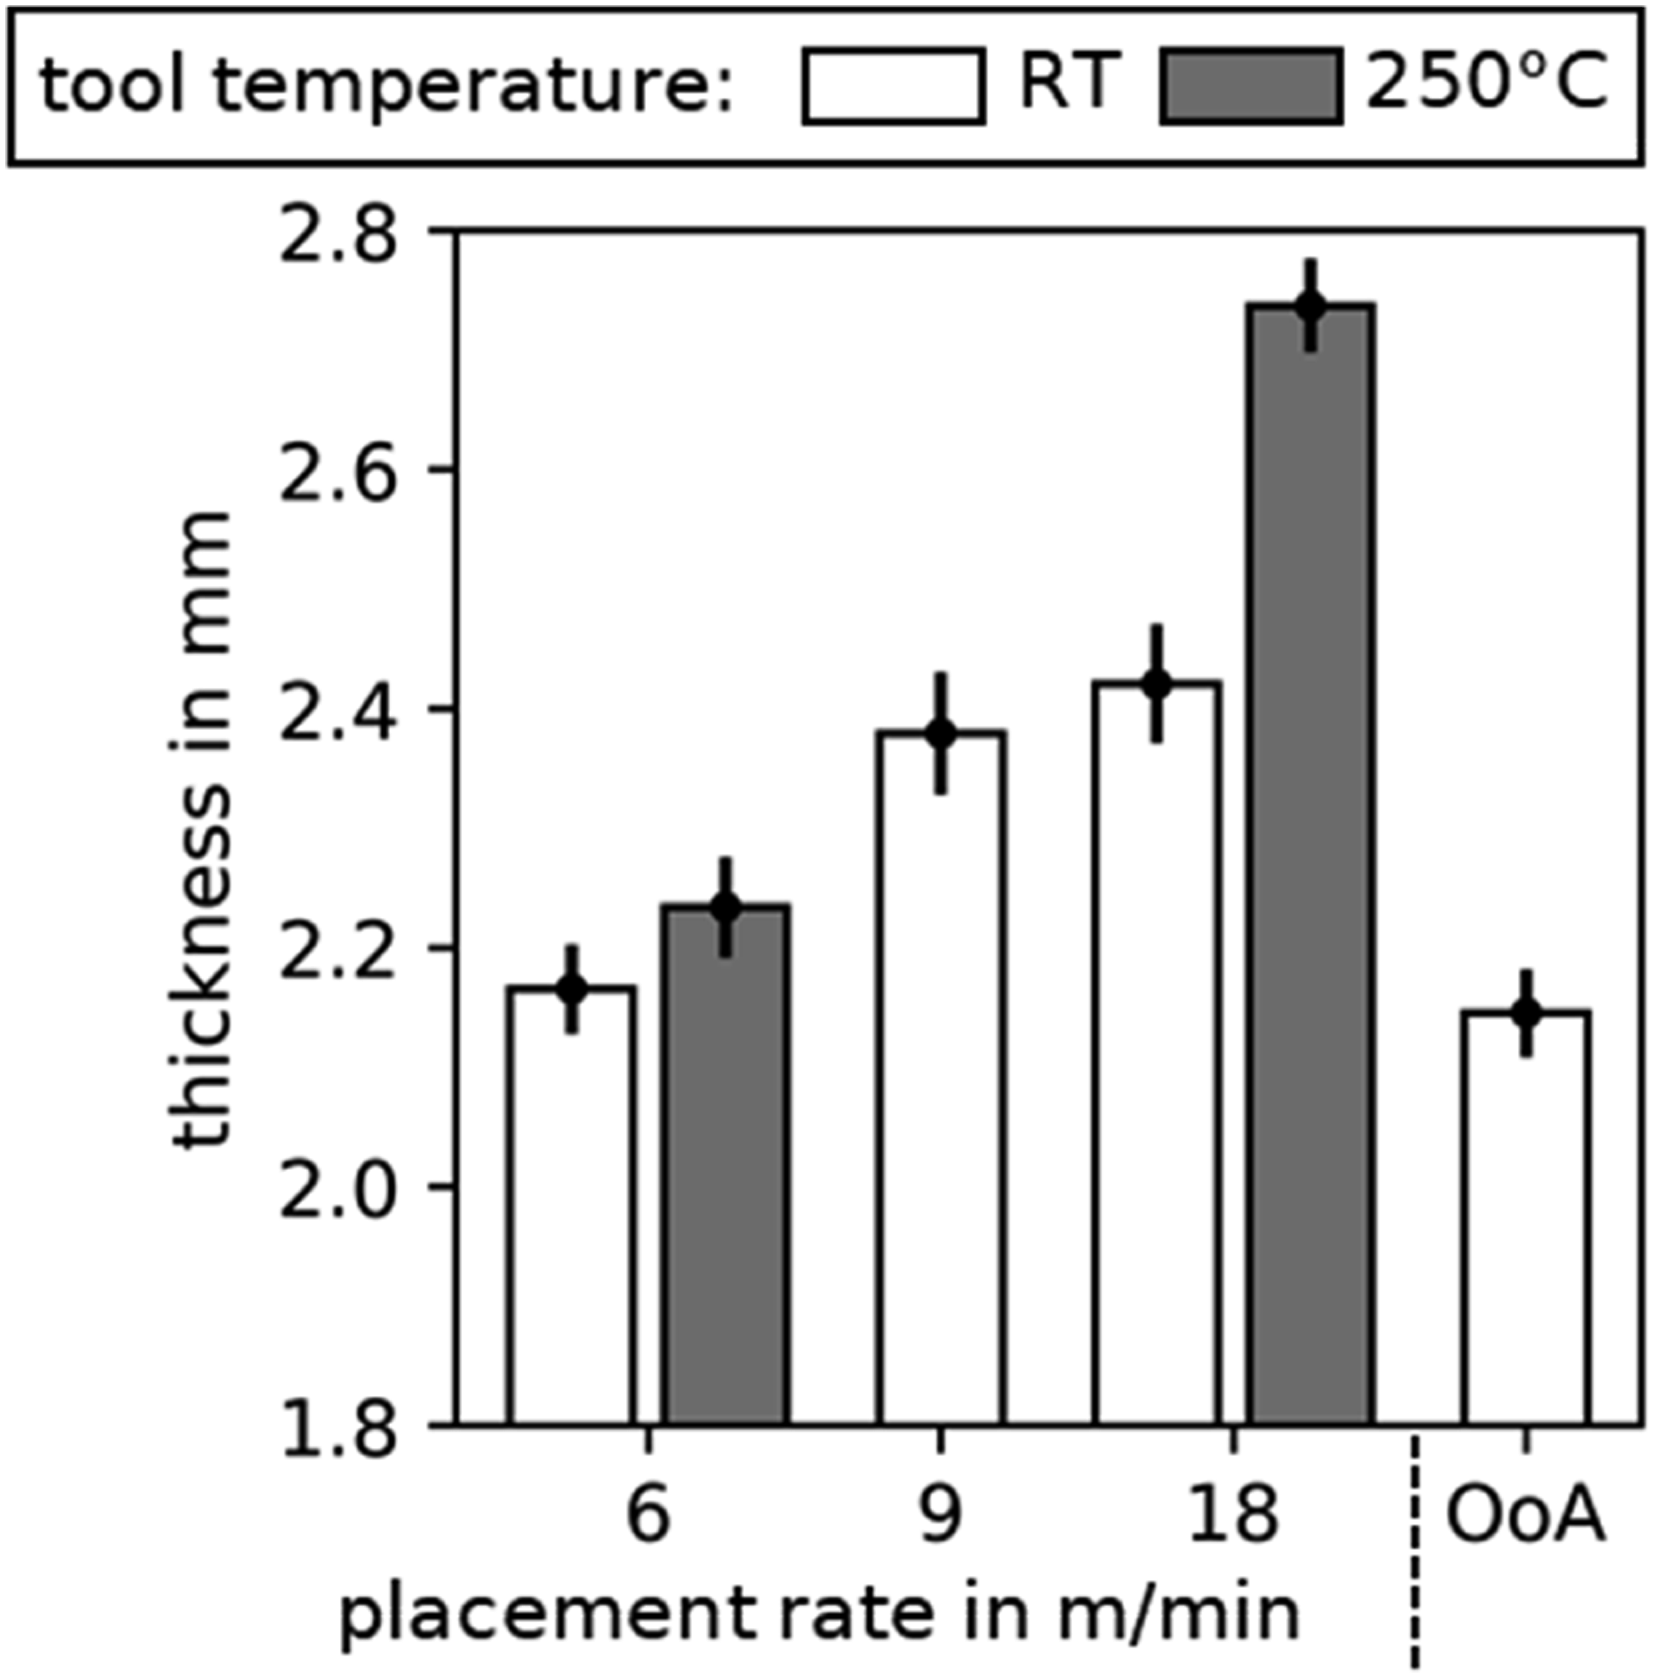
Degree of Crystallinity
Figure 6 shows the degree of crystallinity over the placement rate derived from the experimental design of Table 1. The post-consolidated specimens have a 37.7 % degree of crystallinity on average. The results derived from the ATL process are of a lower degree of crystallinity. 27.4 % at a 6 m/min placement rate at a tooling temperature of 23°C was found and further reduced at increased placement rates. Degree of crystallinity over the placement rate at different tooling temperatures and out-of-autoclave (OoA) subsequent consolidation. The dotted curves are fitted lines into the measurement points.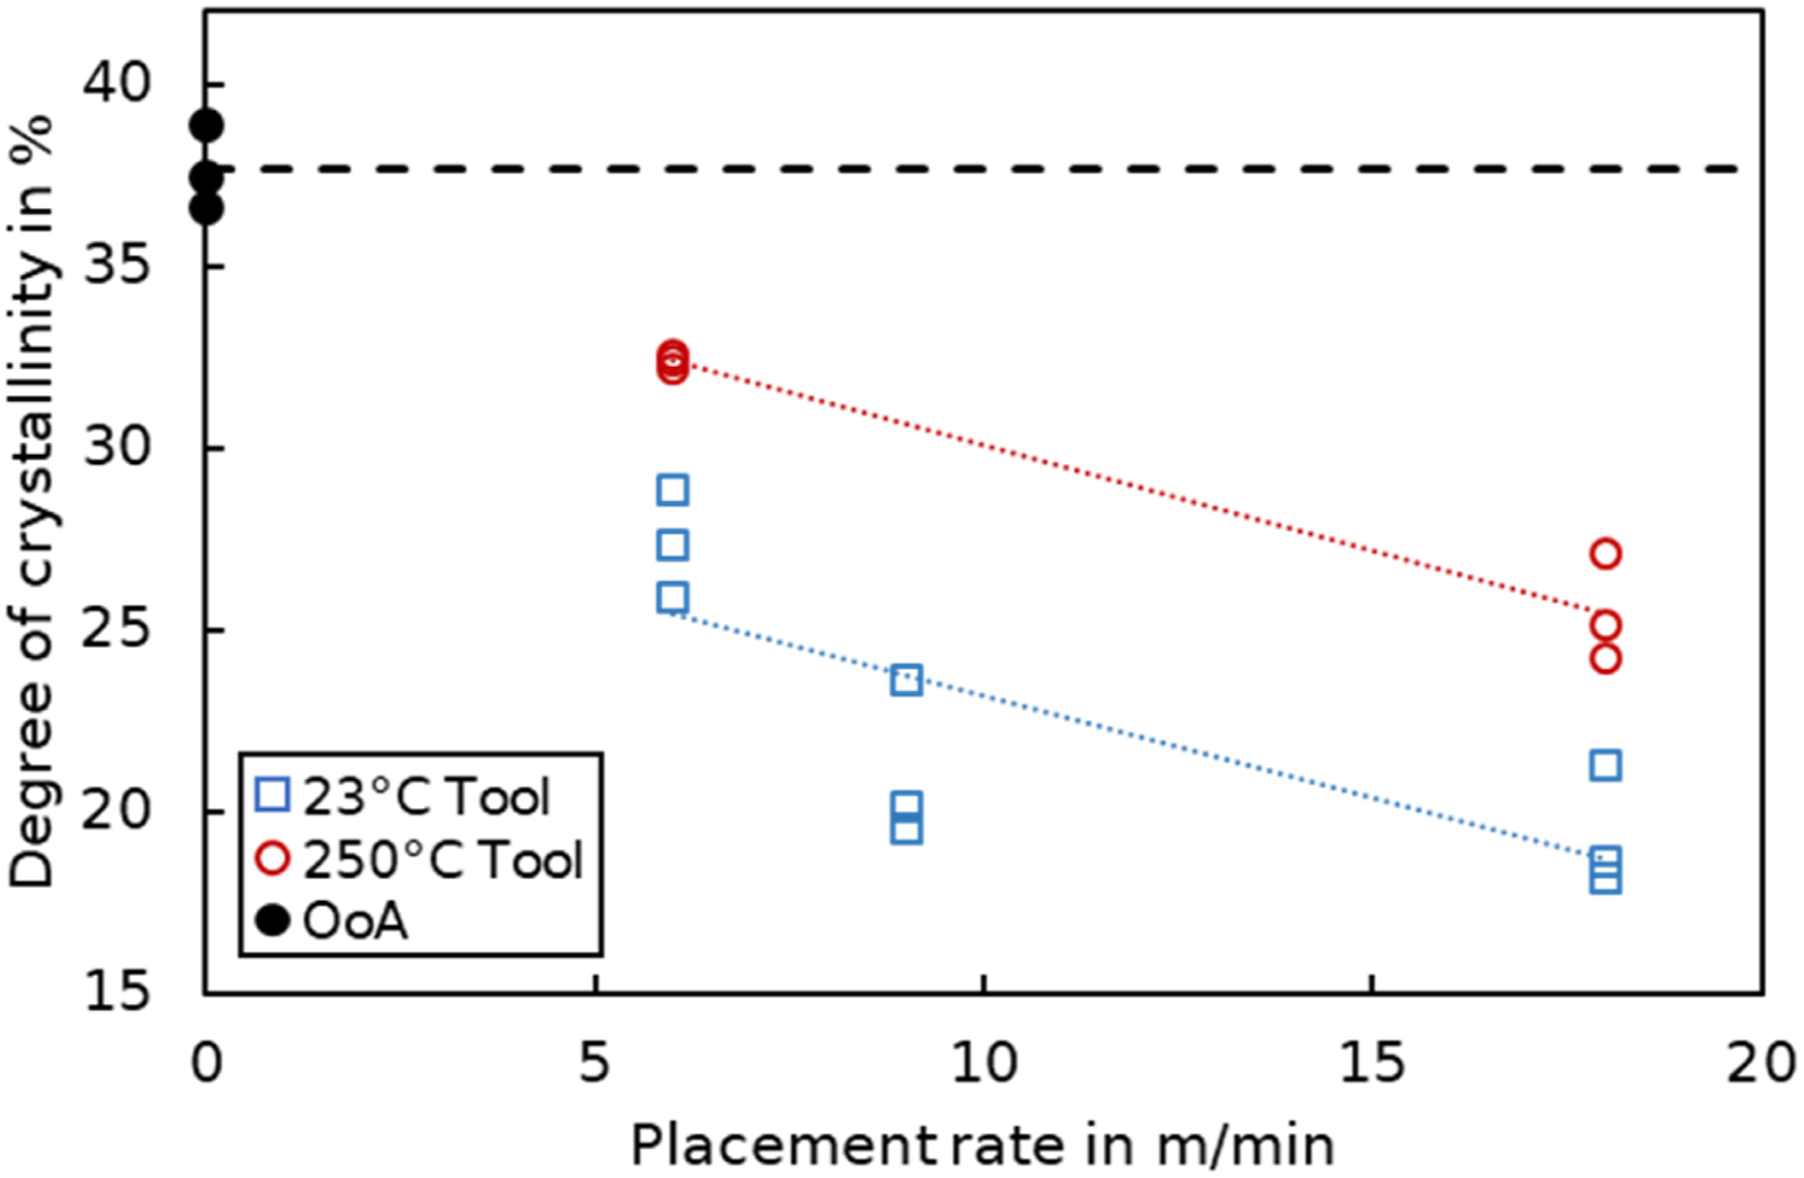
All specimens produced at the tooling temperature of 23°C showed an exothermal crystallization process during the heat-up phase of the DSC a few degrees above the glass transition temperature of circa 143°C (Figure 7). This characteristic reaction consisted of an onset temperature at circa 150°C, a peak at 168°C and an offset at 195°C, and was later subtracted from the melting enthalpy according to (1). In contrast, no exothermic reaction was observed at tooling temperatures of 250°C. At this temperature, the degree of crystallinity at 6 m/min was 32.4 % and further reduced at the increased placement rate. Even though both processing conditions (250°C tooling temperature, subsequent consolidation) obtained the state of equilibrium of the crystallization reaction, the degree of crystallinity of ATL specimens was found to be lower. The difference can be explained by the ATL temperature profile, as it is a fast colling, quenching-like behavior until reaching the substrate temperature. If the PEEK polymer is not fully crystallized, isothermal crystallization will occur at the substrate temperature of 250°C. However, the fast, quenching-like cooling rate will create more crystal nuclei, resulting in smaller crystals, whereas a slow-cooled material consists of larger crystals. Lager crystals have a higher melting enthalpy and, therefore, a higher degree of crystallinity.42,43 Characteristic heat flow signals derived by the DSC during the heat-up phase at different tooling temperatures.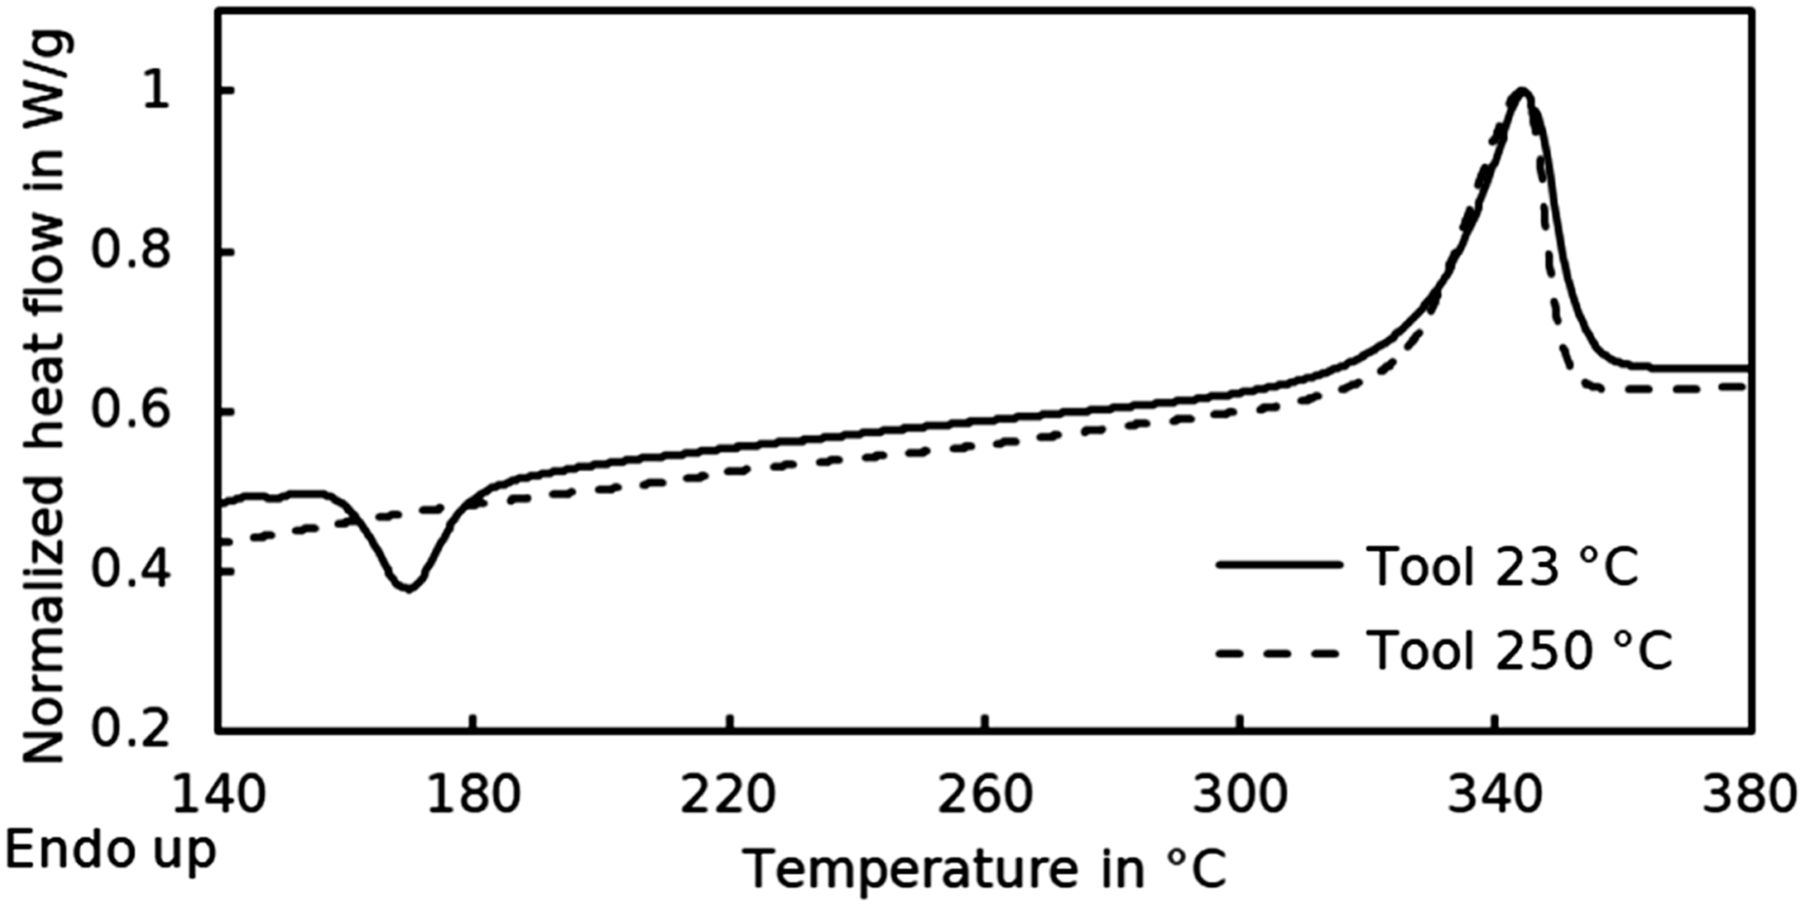
Compression Shear Test
The results of the compression shear test are shown in Figure 8. At a 6 m/min placement rate, the shear strengths were increased at the higher tooling temperature of 250°C compared to those at room temperature. An increase in placement rate to 9 m/min reveals a reduction of the shear strength compared to 6 m/min. No differences in shear strength can be stated at 18 m/min. The out-of-autoclave vacuum bagging consolidated specimens have higher shear strengths than those produced at an 18 m/min placement rate. The standard deviation of the post-consolidated specimens is relatively high compared to the ATL results. Therefore, the derived strengths were found to be in the range of the results rate of 6 m/min placement rate, whereas a slight decrease at 18 m/min was derived. It is noteworthy, that the standard deviation of the out-of-autoclave specimens is relatively high compared to ATL. An explanation is the presence of voids within the post-consolidated specimens (Figure 4), that are not evenly distributed throughout the specimen. With the small size of the compression shear test specimen, it is likely to test interfaces with a void inclusion, which highly reduces the amount of material in the cross-section with this, the shear strength. In contrast, specimens with a shear strength in the range of 60 MPa are assumed to be void-free. Average and standard deviation of shear strengths derived from the compression shear test at different placement rates, tooling temperatures of ATL and out-of-autoclave (OoA) post-consolidated results.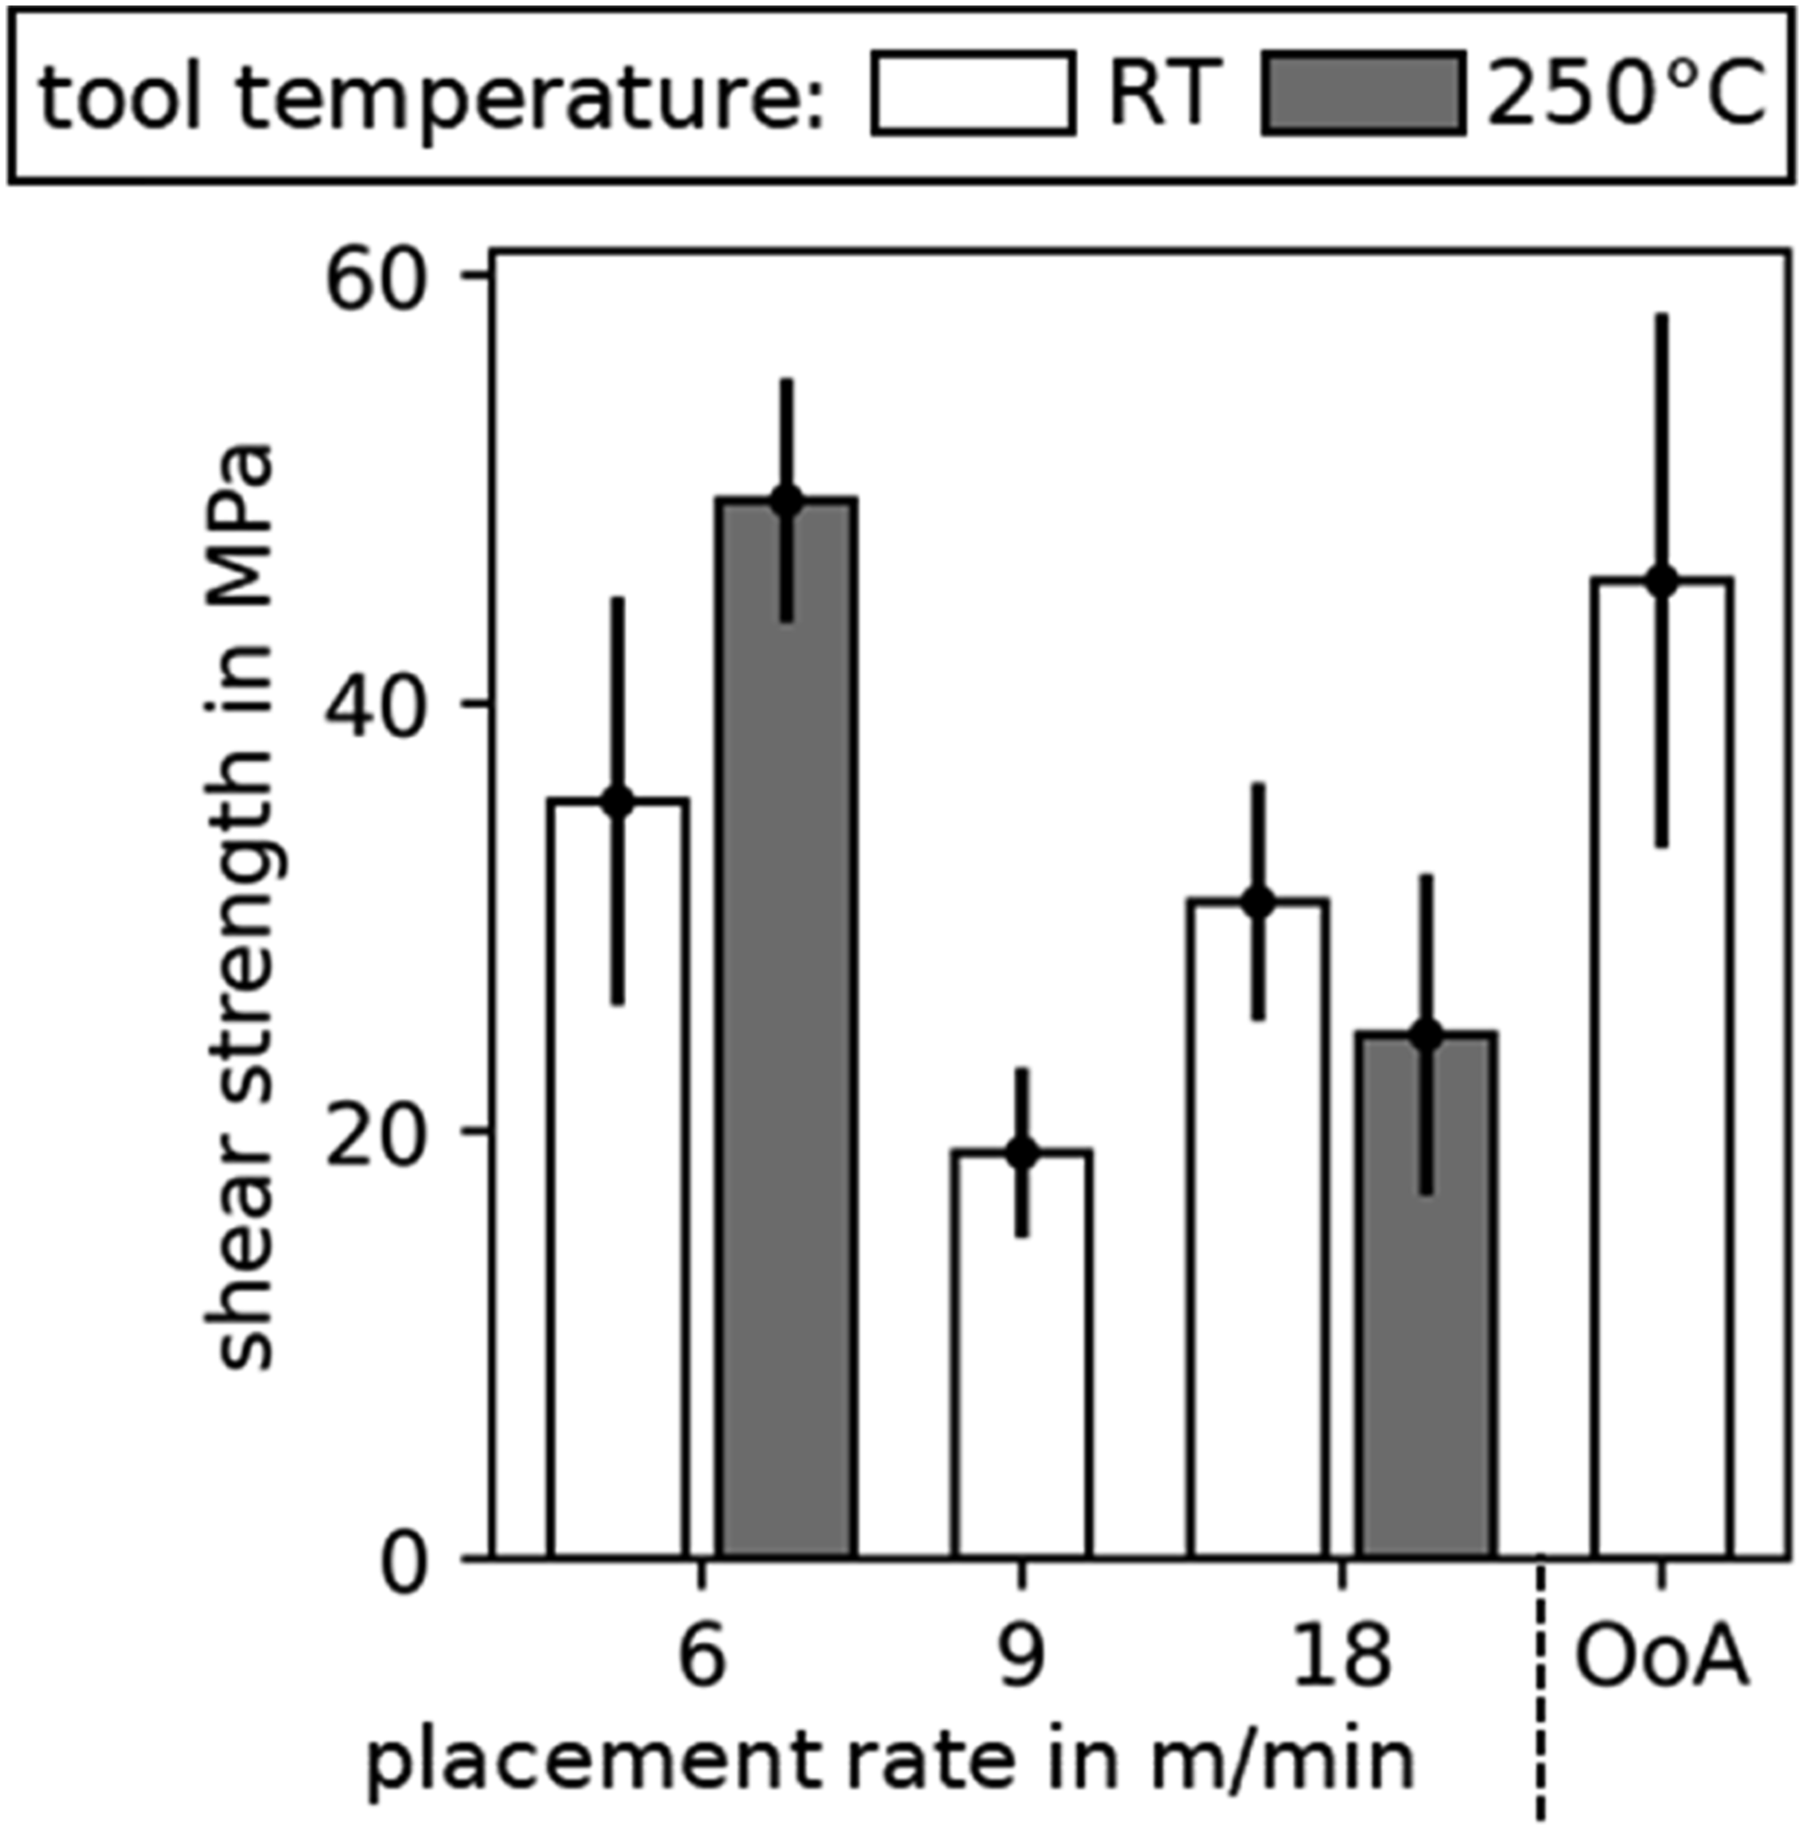
Electron Scanning Microscope
The fracture modes of the compression shear test are shown in Figure 9. The matrix adherent of the parametric fractographic study of Figure 10 revealed a reduction at increased placement rates. The adherend matrix also became slightly smaller at increased placement rates. In contrast to the applied tooling temperatures of 23°C, the tooling temperature of 250°C resulted in an almost thoroughly attached matrix material to the carbon fiber, with larger segments attached. These attachments were also pronounced in the post-consolidated reference with additional debonded and drawn carbon fibers from the specimen’s fracture surface area. No brittle failures were found, even in the post-consolidated specimen with the highest degree of crystallinity in this work. According to,
44
it is expected to be a test characteristic due to a simultaneous failure over the entire shear surface. Therefore, the main characteristics are abrasion and ductile drawings (Figure 9). Electron scanning microscope for illustration of the fractographic modes. Electron scanning microscope images of the fracture surfaces of the compression shear test at placement rates of 6 m/min, 9 m/min and 18 m/min, tooling temperatures of 23°C and 250°C and out-of-autoclave (OoA) post-consolidated laminates.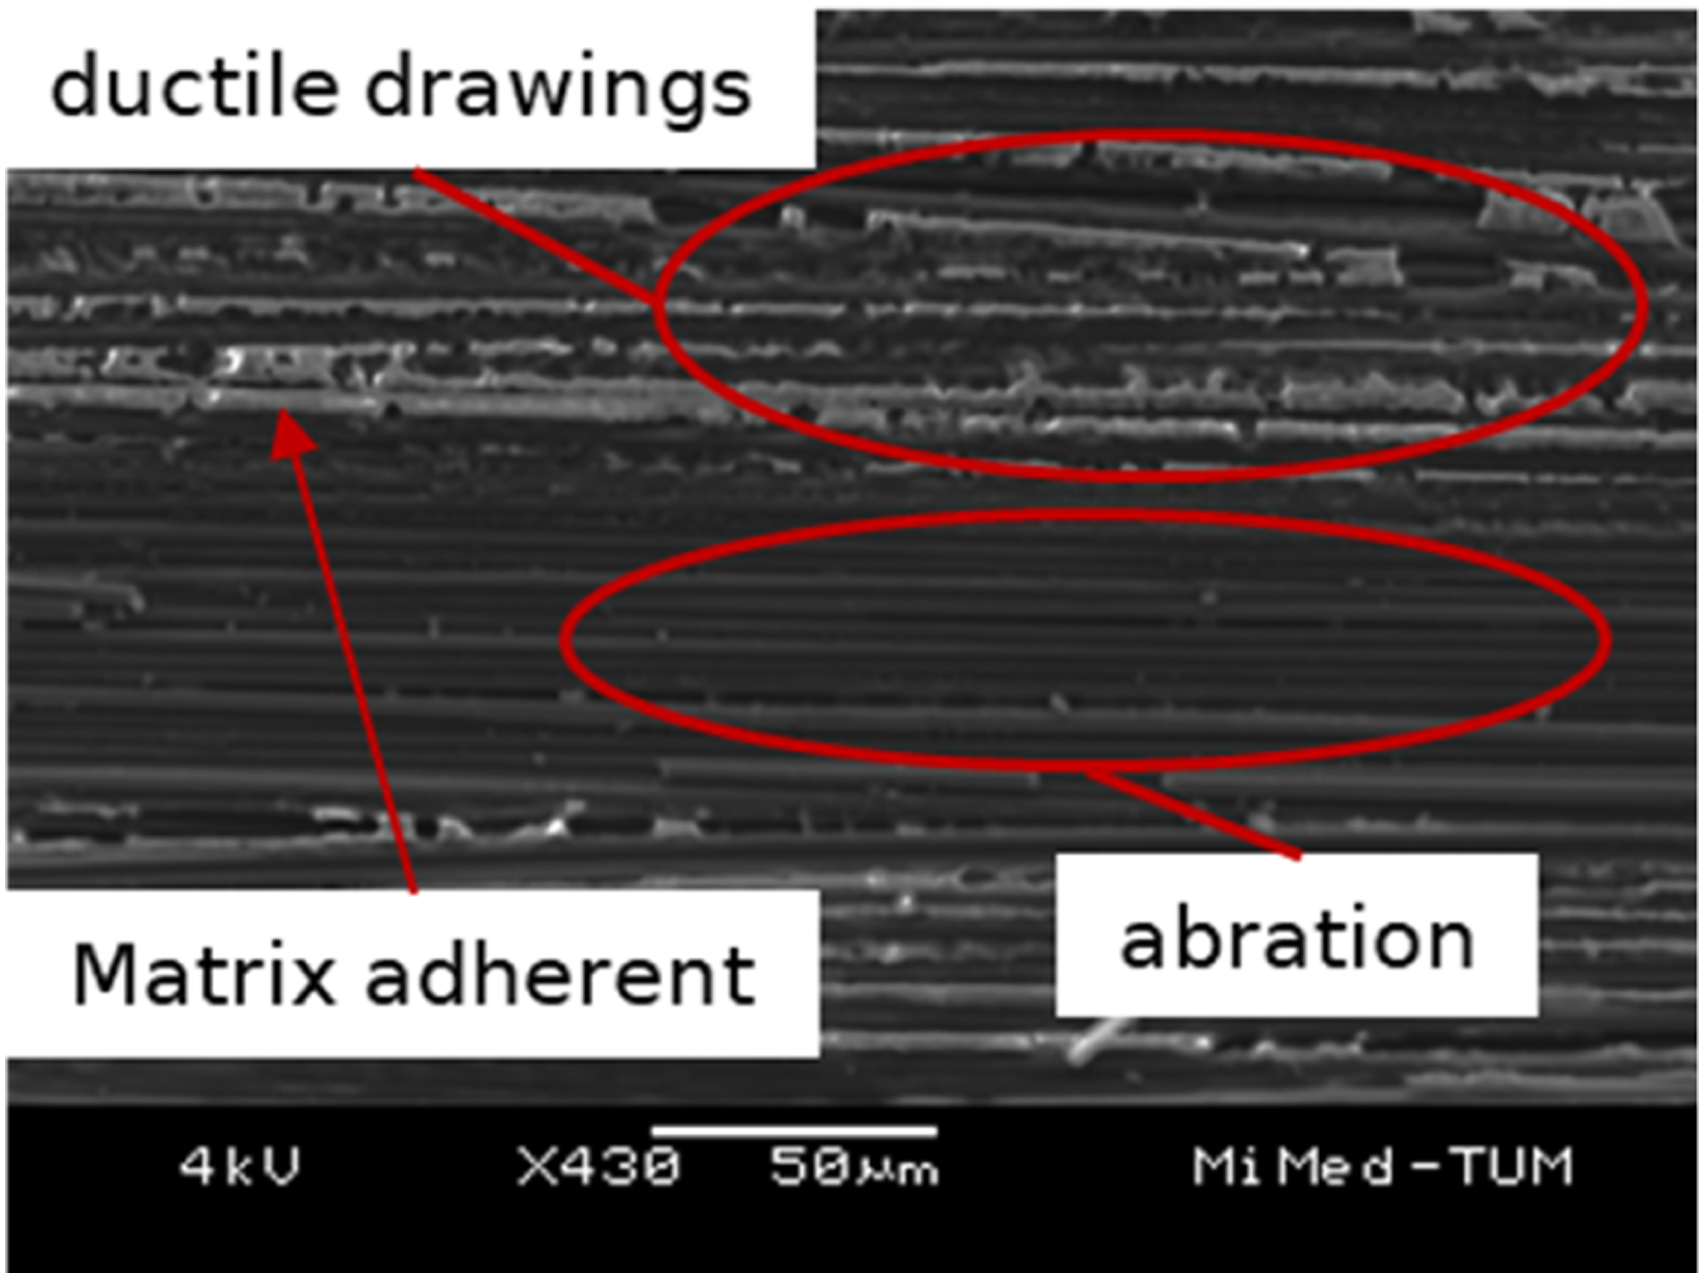
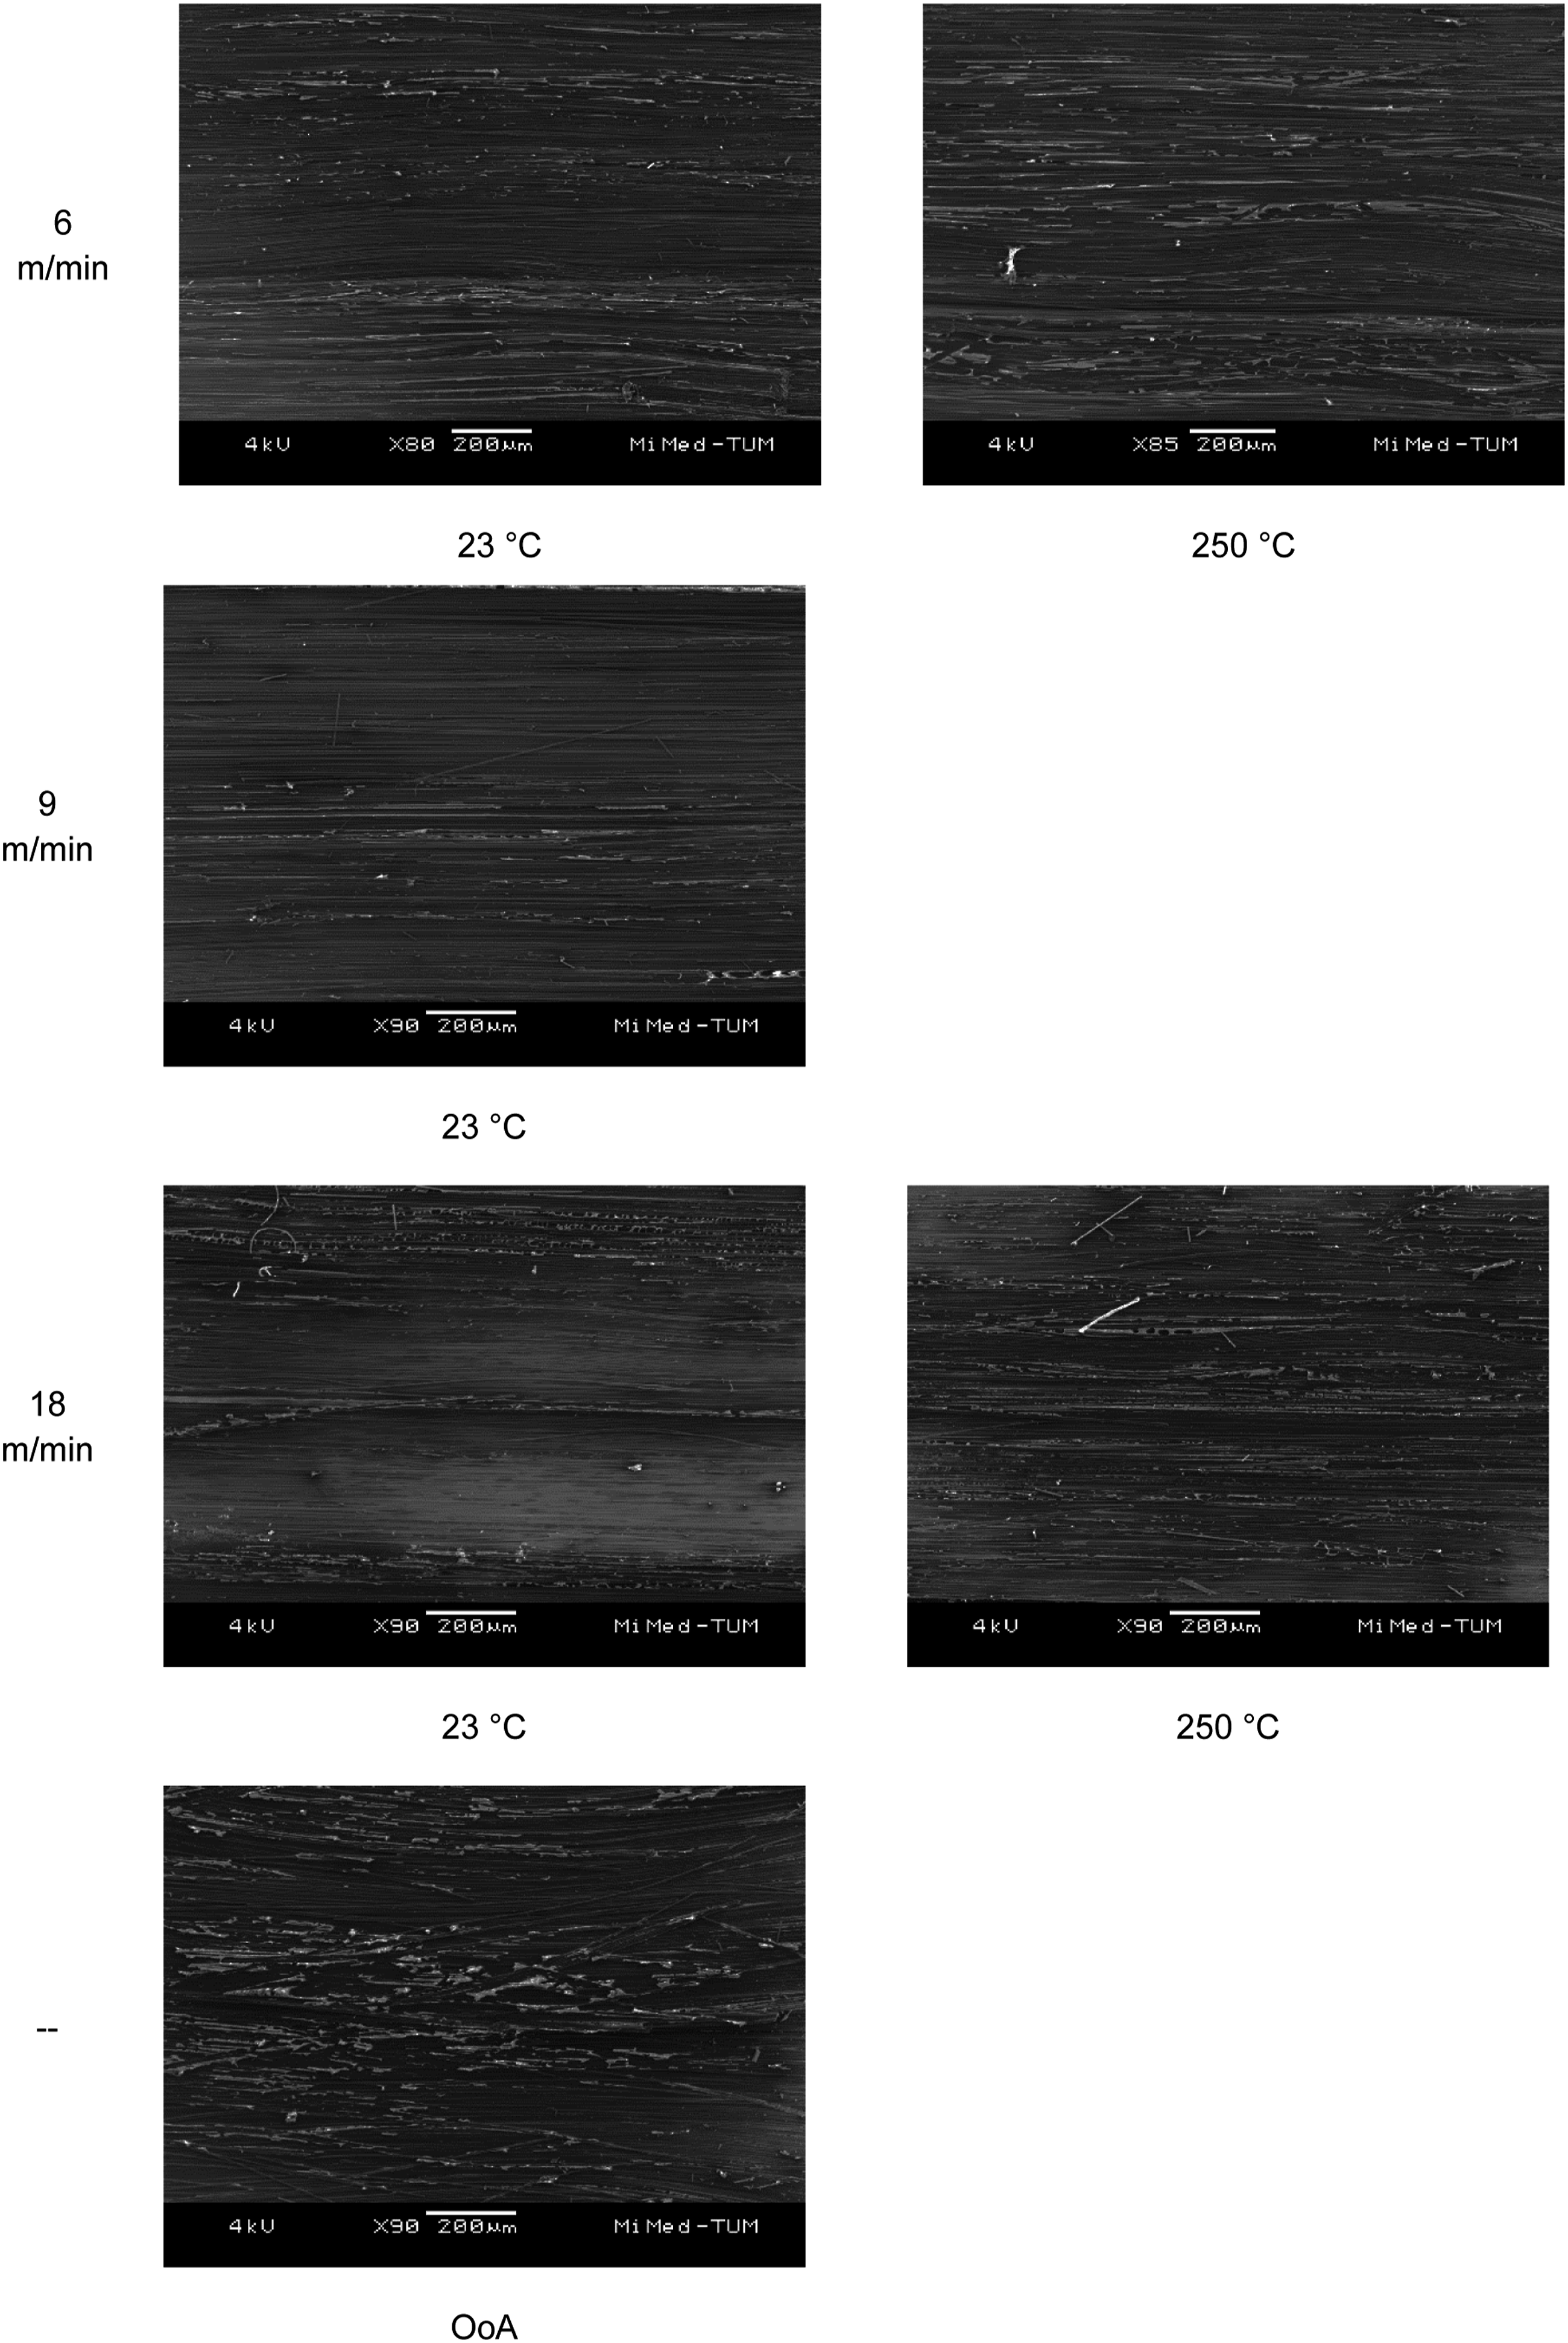
Accounting for a correlation between the degree of crystallinity and the fracture patterns, it becomes clear that the increase of the degree of crystallinity increases the fiber matrix adhesion, which has already been demonstrated in multiple studies.6,45,46 Ductile drawings are increasingly spread throughout the fracture surface at 250°C tooling temperature with smaller drawings at higher placement rates and their corresponding lower degree of crystallinity. Lower tooling temperatures and increased placement rates reduce the degree of crystallinity with more and larger abraded areas of their corresponding fracture patterns derived from the compression shear test. These abraded areas could be due to a porous cross-section, which is prone to failure, an insufficient layer bonding, or the shear failure mode itself. Another possible explanation is an incomplete crystallization process for these fracture images. Even though the specimens at 6 m/min and 23°C tooling temperature were found to be in the same range of bulk degree of crystallinity compared to those at 18 m/min placement rate and 250°C tooling temperature, a recrystallization process was found at the lower placement rate. It may consist of non-crystalline areas within the specimen with the property of lower fiber-matrix adhesion, resulting in an abraded fracture characteristic. Even though this fracture characteristic and crystal structure can be considered non-desirable, the extent of porosity at increased placement rates (Figure 4) is likely to be the limiting factor of the low compression shear strengths derived at placement rates above 6 m/min.
Tensile Tests
The transverse tensile tests of ATL were found to be of lower strength than out-out-autoclave consolidated results, obtaining a mean strength of 75 MPa (Figure 11(a)). This latter result is in the range of the literature that states 65 MPa to 91 MPa for this parameter.
6
The transverse tensile strengths were found to be circa 40 MPa using the ATL process without a subsequent consolidation. Apparent differences between faster placement rates or hotter tooling temperatures were not found. Although the stiffnesses aligned more closely throughout the chosen processing parameters (Figure 11(b)), a subsequent consolidation increased the stiffness to 8.7 MPa. This result remains slightly below the data from,
6
where a range of 8.9 MPa and 10.4 MPa of the transverse tensile stiffness were reported. The direct consolidated specimens’ stiffness remains below 8 MPa without a pronounced difference between the placement rates and processing temperatures. Notably, the transverse tensile tests only show distinct differences between the production method (ATL or post-consolidation) even though the void content from placement rates from above 9 m/min showed a high increase of the thicknesses of the specimens and the range of 10 % of void content. Average and standard deviation of (a) strengths and (b) stiffnesses of the transverse tensile tests at different placement rates, tooling temperatures of ATL and out-of-autoclave post-consolidated (OoA) results.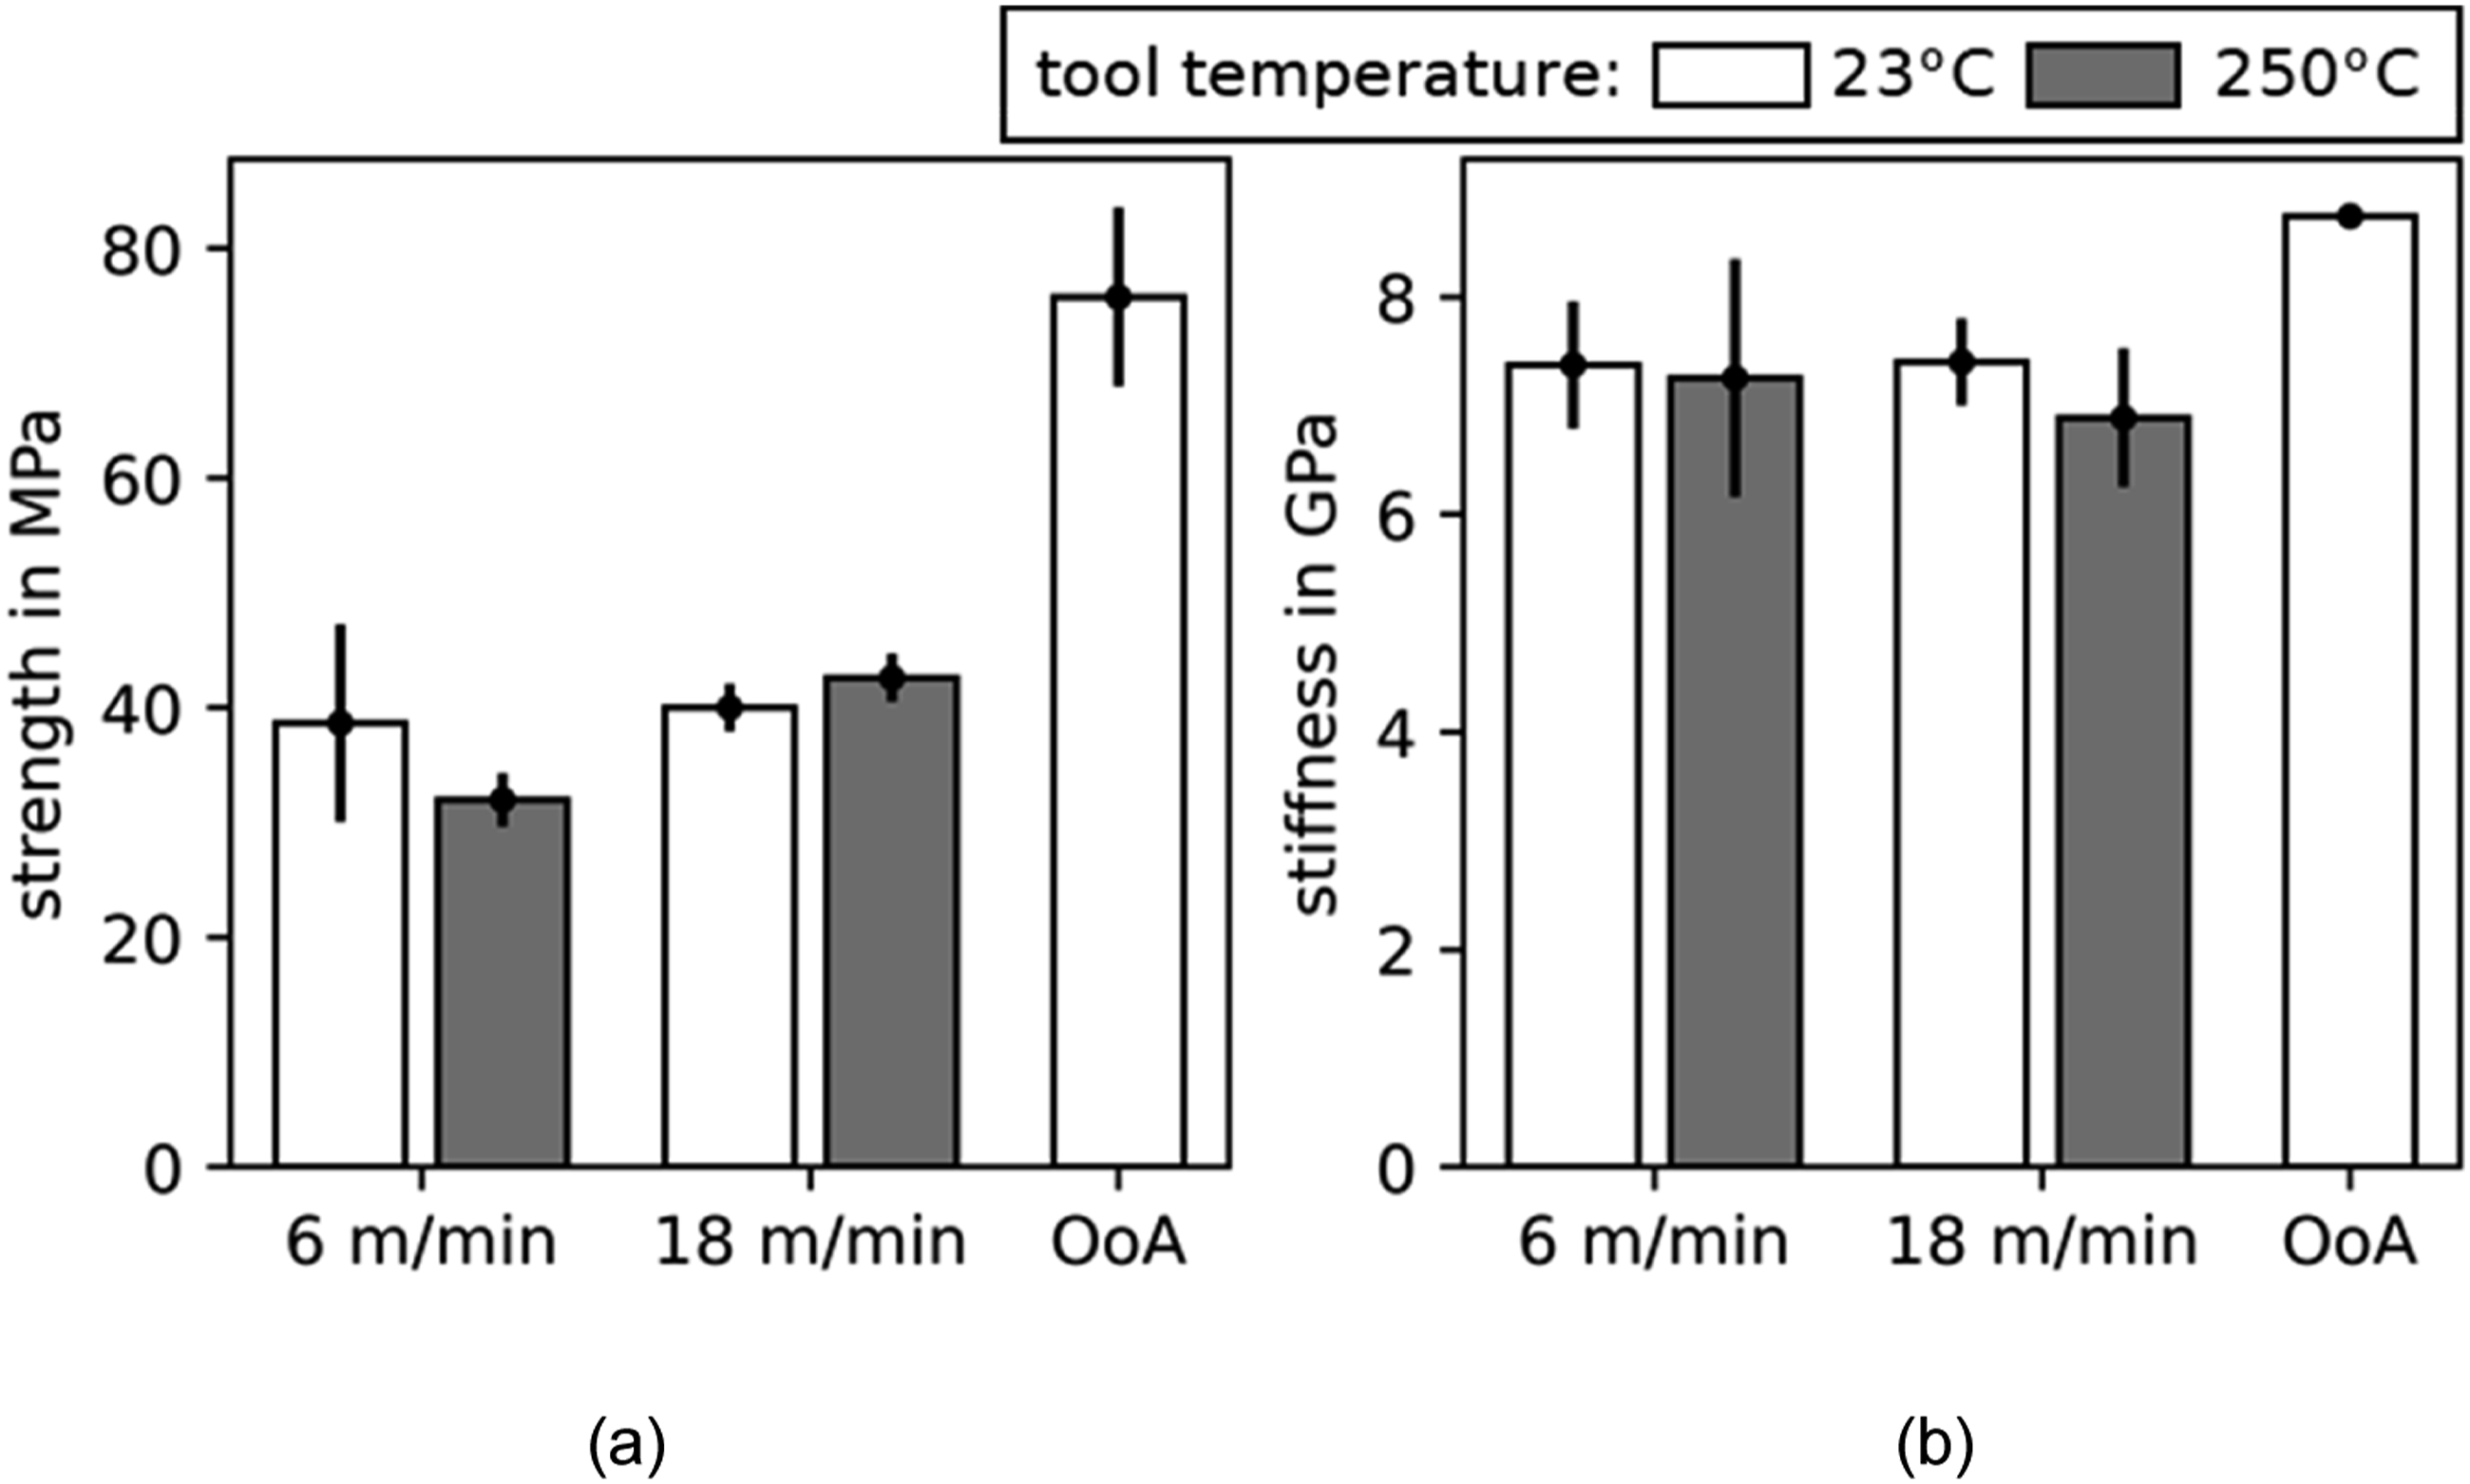
Interestingly, well-known mechanisms of interactions developed using press or autoclave processes cannot satisfyingly explain the findings of this work, e.g. an increase of void content or the degree of the degree of crystallinity reduces the mechanical performance. Similar to our work, 38 demonstrates that the degree of crystallinity derived from different processing and tempering conditions can have counterintuitive correlations. It suggests that the main driver for the differences is the crystallographic morphology. However, the void content or curvature was not further investigated.
Therefore, the transverse out-of-plane curvature, as is well-known from unidirectional ATL plates with in-situ consolidation, was measured (Figure 12). On a length of 200 mm, the maximum displacements of the ATL plates range from 1.16 mm to 1.47 mm, with only the plate derived from a rate of 18 m/min at a tooling temperature of 250°C with a displacement of 0.7 mm. It is obvious that the curvatures create an inhomogeneous stress profile in the cross-section of the transverse tensile test, inducing a superimposed bending moment prestress prior to the tensile stress. However, the differences in the measured curvatures are somewhat in the same ranges. A further comparison of the transverse tensile strength of the 6 m/min ATL rate reveals a lower transverse tensile strength by factor two compared to the out-of-autoclave consolidated specimens. It demonstrates that the superimposed bending moment and other unknown effects that are difficult to quantify, such as the internal residual stress, void content and distribution and crystallographic morphology, significantly impact the reduction of the transverse tensile test results. With only a few authors publishing data on the transverse tensile test at different processing conditions,12,38 the complexity of this parameter in relation to processing conditions is not understood. Curvature profiles of the transverse fiber direction of the ATL plates. The scanning device is limited to 200 mm in length.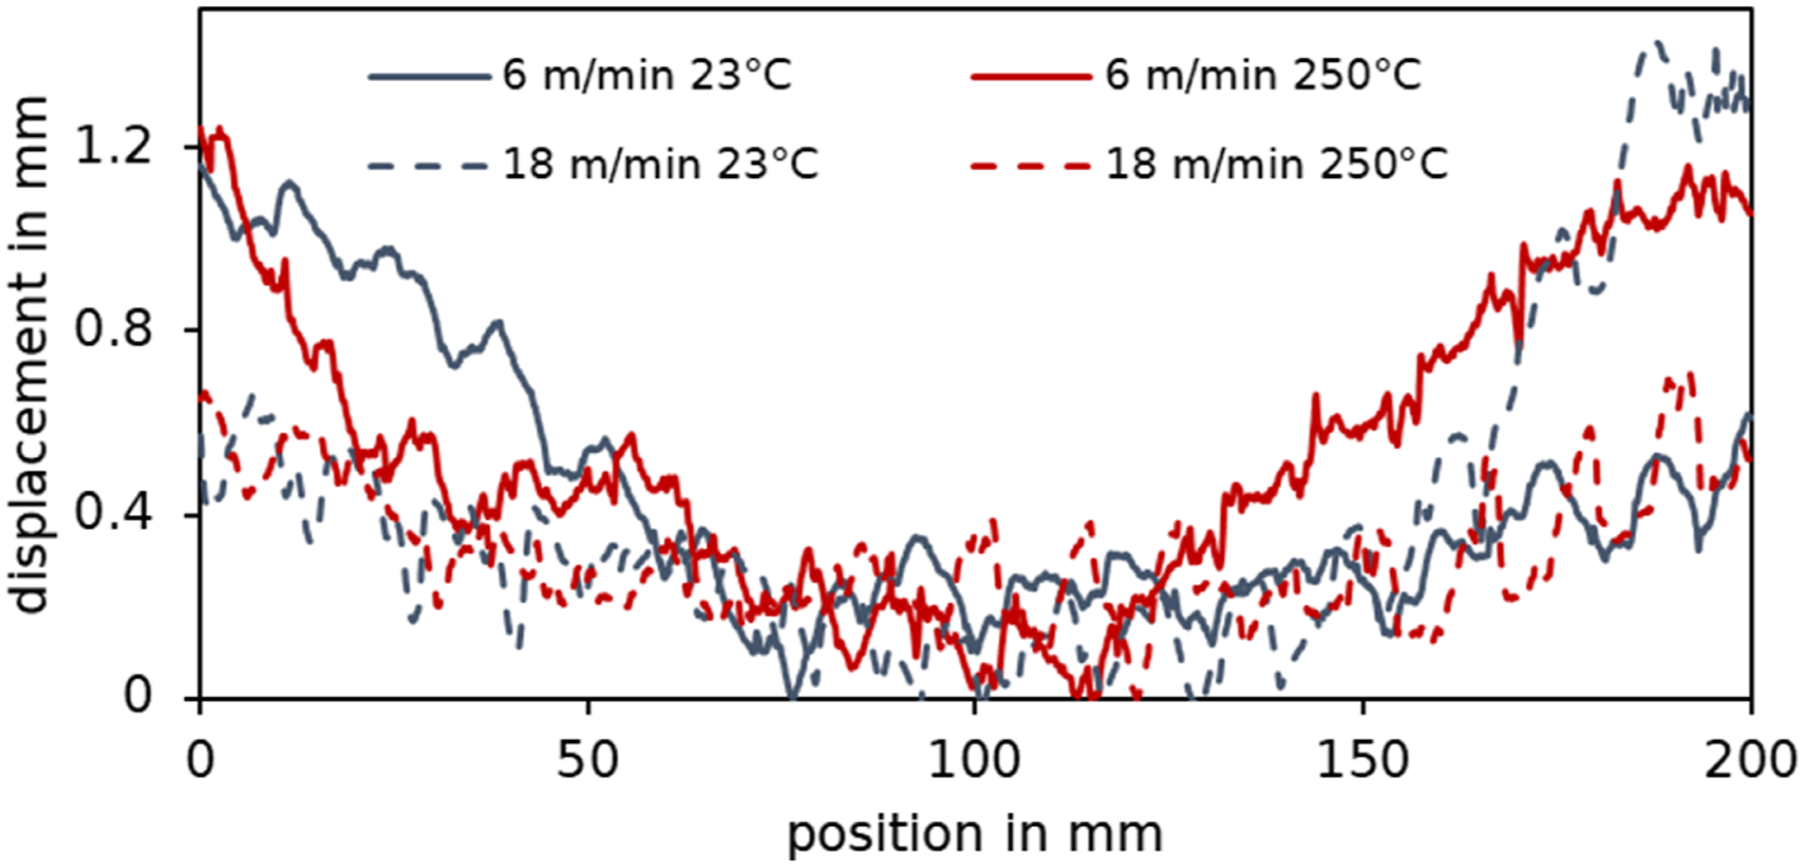
It becomes clear that the state-of-the-art relations developed using press and autoclave processes can be insufficient to describe the results of the multiparameter environment of the ATL process. Even though correlations can be found in some selected cases, many unknowns remain, such as machine settings, the machine itself (sometimes unique pieces), and tape quality that has been addressed most recently, 47 among others. Not surprisingly, the results can even differ hugely between the authors. Further, even though the compression shear and transverse tensile test are matrix dominant, care should be taken when interpreting test results using a single mechanical test as a performance indicator for ATL laminates qualities. Unlike the transverse tensile test, whose differences cannot be distinctively explained in this work, the compression shear test showed a high sensitivity to the void content. This dependency becomes evident when considering the results of the post-consolidated specimens and comparing those to ATL specimens with the placement rate of 6 m/min, as the shear strengths were of the same ranges.
In contrast to the compression shear and transverse tensile tests, the tensile test in fiber direction revealed increased strength at higher tooling temperatures and slightly decreased at increased placement rates. (Figure 13(a) and (b)). In fiber direction, a strength of approximately 1754 MPa of the out-of-autoclave specimens was derived, 84 % of the lowest strength reported by.
6
Using ATL only, the highest strength of 1471 MPa was derived at a 6 m/min placement rate and a tooling temperature of 250°C. At both tested placement rates, an increase of 14 % from the tooling temperature at room temperature to 250°C was derived, whereas the lower placement rate revealed an increase of 11 % at both tooling temperatures under investigation. Qualitatively, the stiffnesses were found to be more independent of the processing than the strengths. With the post-consolidated mean stiffness of 122 GPa, 92 % of the lowest value reported by
6
were reached. The direct consolidated stiffnesses using ATL were found to be independent of the tooling temperature, obtaining 118 MPa at a placement rate of 6 m/min. Increasing the placement rate to 18 m/min reduced the stiffness to 111 MPa and 114 MPa at tool temperatures of 23°C and 250°C, respectively. Average and standard deviation of (a) strengths and (b) stiffnesses of the tensile tests in fiber direction at different placement rates, tooling temperatures of ATL and out-of-autoclave post-consolidated (OoA) results.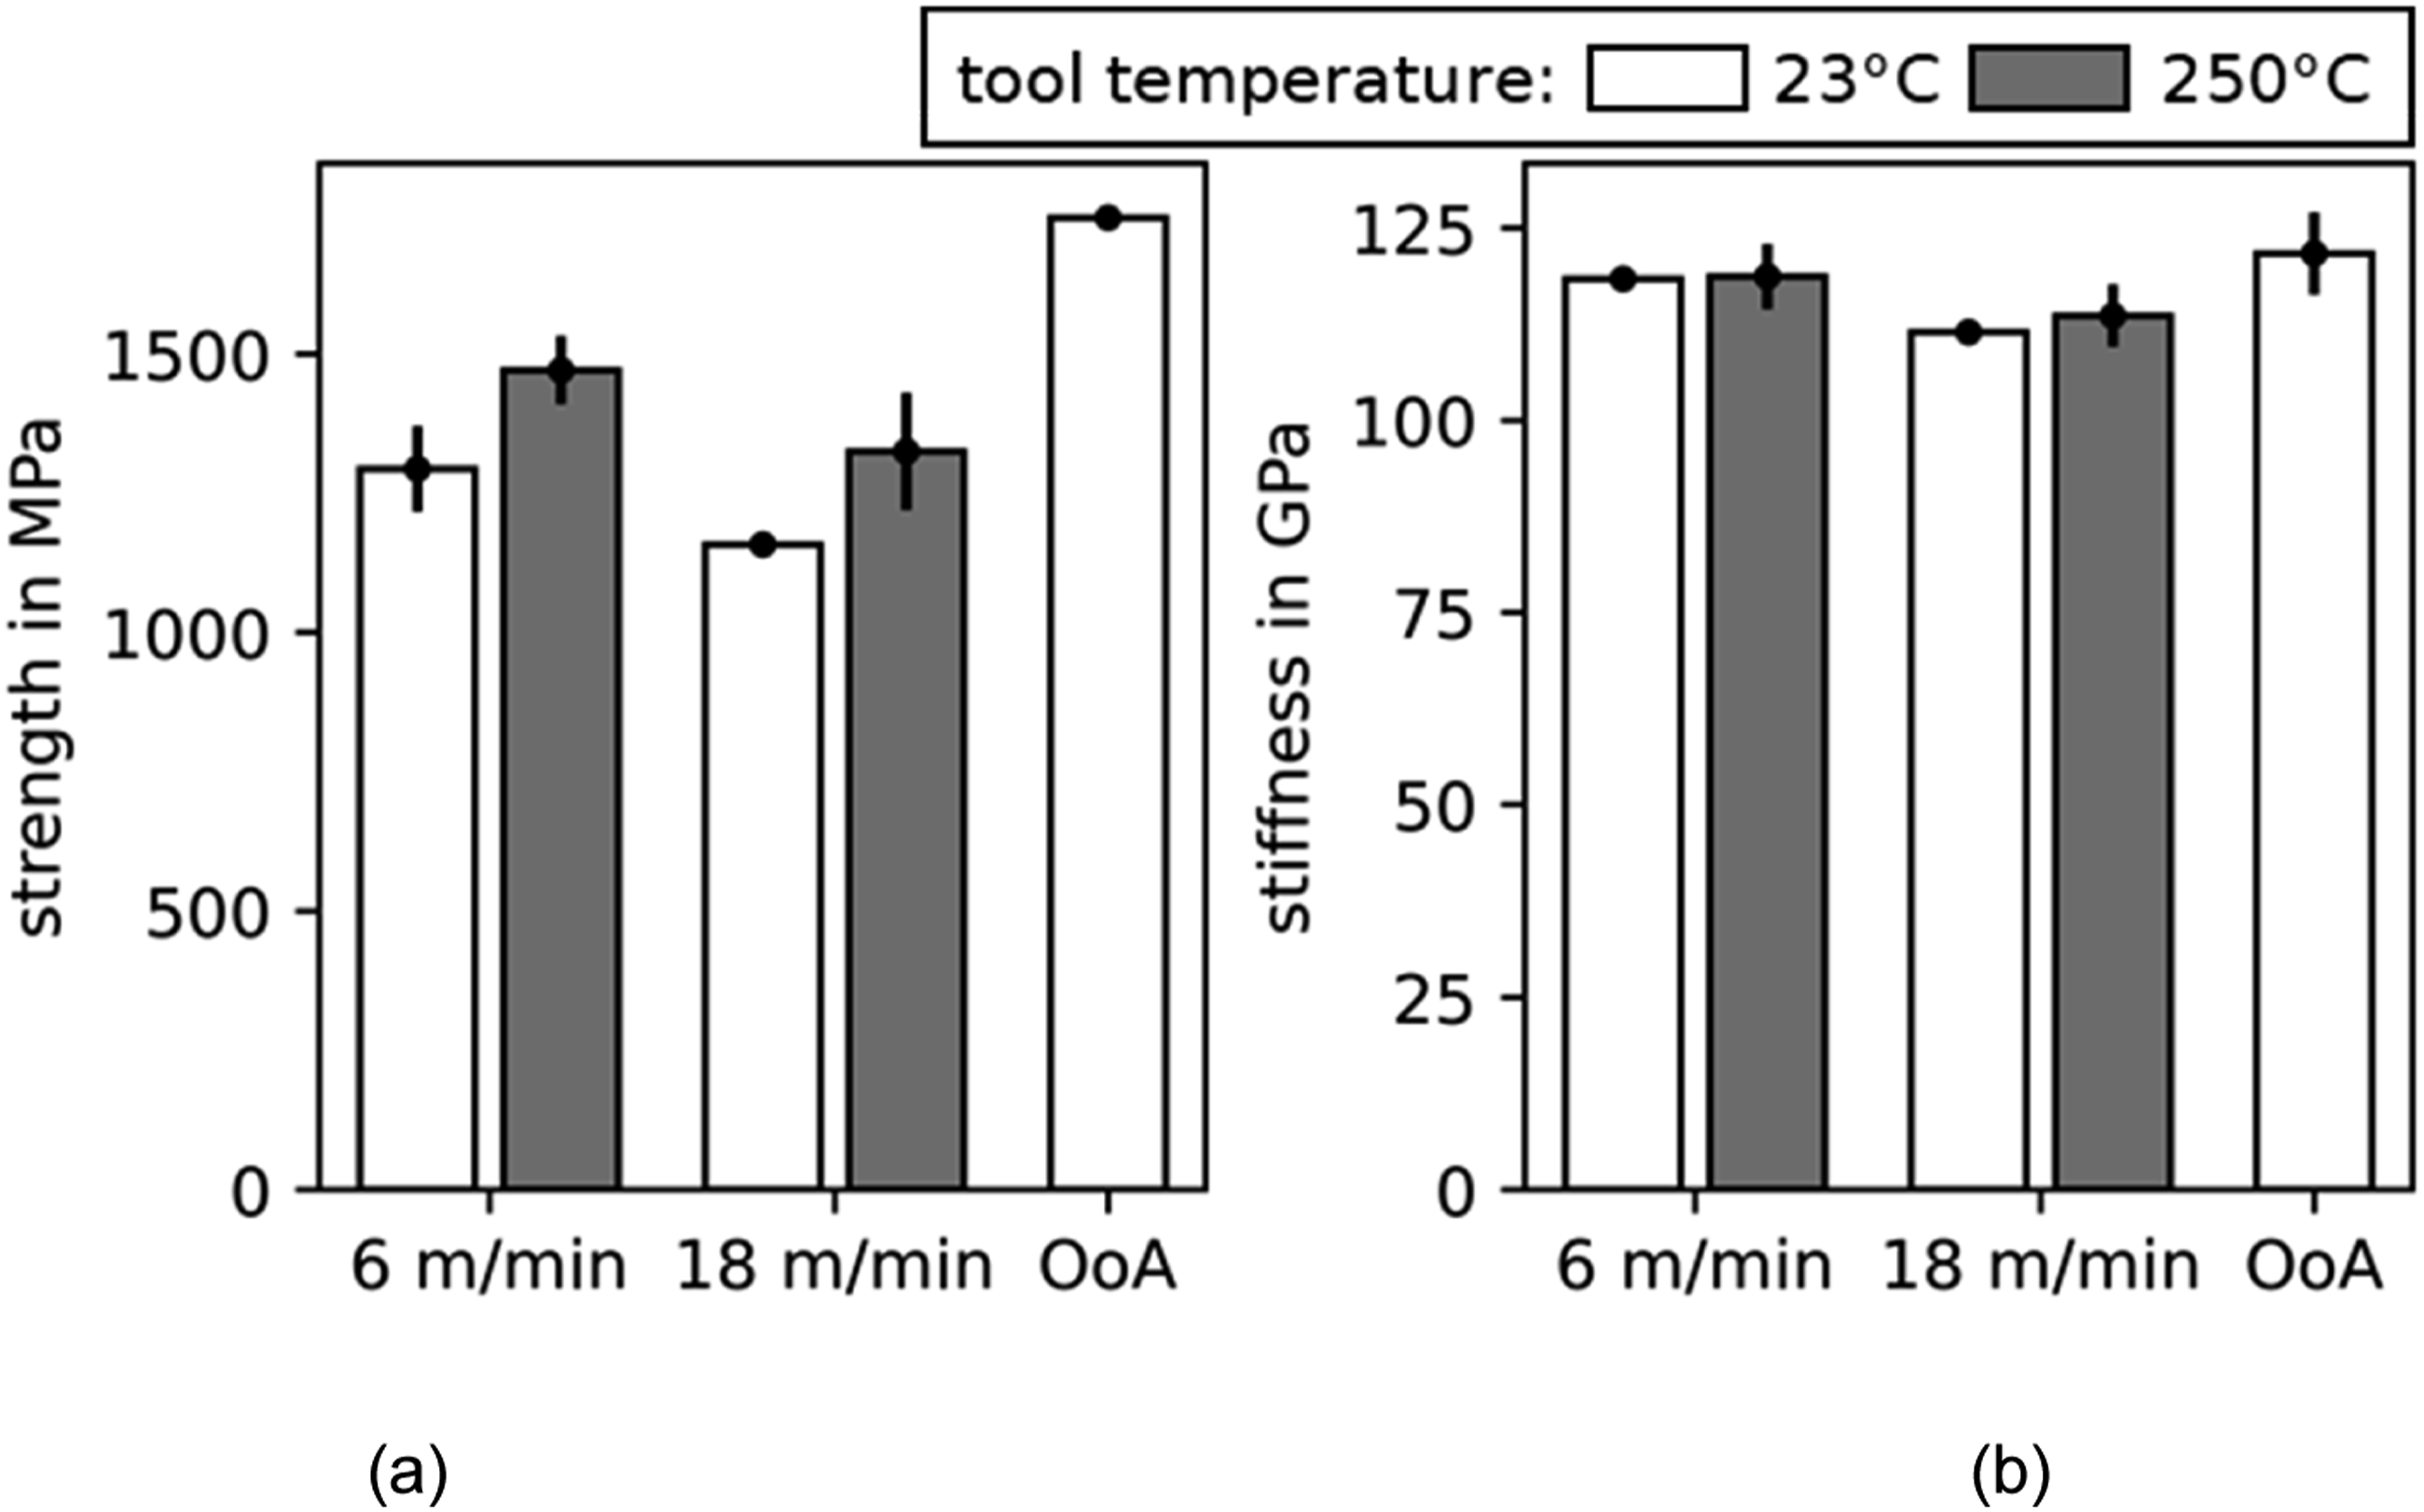
In the case of the strength of the tensile test in fiber direction, the tooling temperature was found to be of influence in addition to the processing between ATL and a subsequent consolidation. In contrast, the transverse tensile test responses were found to be independent of the placement rate. Notably, the thickness was increased by 27 % from 6 m/min placement rate at room temperature to 18 m/min and 250°C tooling temperature (Figure 5). Neglecting the definition of pressure or strength as a subscription of the thickness and only dividing the measured force by specimen width, 2800 N/mm (6 m/min placement rate, 23°C tooling temperature) were derived versus 3630 N/mm (18 m/min placement rate, 250°C tooling temperature) and 84 N/mm versus 117 N/mm in and transverse fiber direction, respectively. Although the increased placement rate reduces the degree of crystallinity and is expected to reduce the mechanical properties further, see e.g., 46 the reference to the mass or layer number increases the mechanical performance. The fact that the basic linear tensile elastic parameters do not represent the findings of the compression shear test from the previous section underlines the importance of determining structural design parameters.
Conclusions
The present study investigates the influences of increased placement rates and tooling temperature of ATL using CF/PEEK. It reveals that increasing the placement rate and tooling temperature increases the laminate thickness and the void content. Large voids and visible layer boundaries indicate an insufficient compaction. In contrast to the transverse tensile test not being affected by the void content of ATL specimens, the alignment of voids along the layer boundaries showed a high sensitivity of the compression shear test, representing the weakest shear plane. An increased placement rate reduces the degree of crystallinity and can be counteracted by an increased tooling temperature. These correlations correspond to the observations of the fractographic analysis of the compression shear test. The derived shear strengths were within the post-consolidated reference when the void content was below 3.4 % and the degree of crystallinity above 26 %. Regardless of the processing conditions using ATL, the transverse tensile test revealed no pronounced differences, whereas the strength in fiber direction was increased at the tooling temperature of 250°C and decreased at increased placement rates. The out-of-autoclave post-consolidation demonstrated an overall improvement in the mechanical performance of standard tensile tests compared to ATL. Accounting for the increased thickness at increased placement rates while maintaining the material strengths, it becomes evident that adequate compaction should be addressed in the future to increase the material performance and should offer a performance increase, possibly in the range of 27 %.
Footnotes
Acknowledgements
We thank Markus Wolfahrt from Polymer Competence Center Leoben GmbH for providing the compression shear test fixture. We also thank Prof. Tim C. Lueth and Christoph Rehekampff from the Chair of Micro Technology and Medical Device Technology of the Technical University of Munich for providing access and help for their electron scanning microscope.
Declaration of Conflicting Interests
The author(s) declared no potential conflicts of interest with respect to the research, authorship, and/or publication of this article.
Funding
The author(s) disclosed receipt of the following financial support for the research, authorship, and/or publication of this article: The support for this research was provided by the Federal Ministry for Economic Affairs and Climate Action (BMWK2) of Germany in the National Civil Aviation Research Program (LuFo) under grant 20E1902. This support is gratefully acknowledged. Project DEAL provided support for open-access publishing.
Data Availability Statement
All data generated or that appeared in this study are available upon reasonable request by contacting the corresponding author.