
Abstract
Polyols from chaulmoogra seed oil and grape seed oil were prepared by epoxidation and ring opening of oxirane ring using lactic acid in nitrogen atmosphere with a control over their functionality. Nanocellulose was derived from Desmostachya Bipinnata grass leaves and further surface functionalized. Modified nanocellulose was used as filler to prepare porous flexible bio-based polyurethane nanocomposites via in-situ polymerization. Adsorption of malachite green (MG) dye from wastewater using the prepared polyurethane composites was carried out. The effect of varying factors such as weight percentage of filers (modified nanocellulose), dosage of the adsorbent, pH, temperature and time on the MG adsorption have been studied experimentally. Material characterization for prepared materials was carried out using FTIR, NMR, TGA, DSC, and SEM along with other physical and chemical methods. FTIR results indicated the presence of peaks at 1704 cm−1 for –C=O stretching vibrations from urethane groups, 1531 cm−1 for –NH bending, 1232 cm−1 for –C–N stretching and 1105 cm−1 for –C–O stretching in the urethane group (–NHCOO–) thus, indicating the formation of urethane linkage in the polyurethane. Polyols with functionality around 2.8 were obtained from the oils, which has contributed to forming flexible polyurethanes. Morphological studies indicate the nano fibrillation of cellulose and closed-cell porosity in polyurethane and its composites. The flexible porous PU and its nanocellulose composites displayed improved thermal stability from 256.3°C to 270.5°C. Taguchi’s L27 orthogonal array have been applied for experimental design and optimization and the results were analyzed using ANOVA for raw and S/N ratio. It was found that pH is the most influential factor for adsorption lead by quantity of nanocellulose, time, dosage of the adsorbent and temperature.
Introduction
Polyurethanes (PU) rely on petrochemicals as raw materials for their synthesis similar to most of the other polymers. However, the higher energy requirement for the production of petrochemicals as well as the environmental concerns of the petrochemicals enhances the need for more sustainable and eco-friendly alternatives for the synthesis of polyurethanes. 1 Recent advances in PU research has focused on substitution of petro-based polyols and isocyanates with bio-based resources2,3 such as polysaccharides (starch and sugars), 4 wood (lignocellulose), 5 proteins 6 and vegetable oils 7 etc. Polyol, the major component for PU synthesis can be derived from various renewable feedstocks.8,9 These polyols can serve as sustainable alternative for existing polyols as they have similar chemical structures with slight variation which can provide enhanced performance characteristics and have great ecological and economical significances. 9 Though polyols were successfully obtained from renewable sources, studies shows that in comparison with commercially available petroleum based polyol derived PUs, the properties of bio-based polyurethanes are inferior in terms of mechanical strength and other functional characteristics. 10 To overcome this, various studies were conducted to improve mechanical, anti-flammable properties, adsorption characteristics and thermal properties by incorporation of fillers such as nanoparticles, particulates, fibers, agricultural wastes etc.11–14 The large number of OH groups present on the cellulose surface helps in chemical modification using other species and allow derivatives to be formed. As the size of the cellulose is reduced to nanometer scale, it gains high surface area, which in turn provides a wide range of application in various fields. It is also a promising alternative to activated carbon adsorbent 15 than activated carbon to tackle environmental pollution. The surface functionalization of nanocellulose can improve its properties and applications. 16 The hydroxyl groups on the nanocellulose can be modified with functional groups such as sulphate (-OSO3-) carboxyl (-COO), aldehyde (-CHO), amino (-NH2), thiol groups (-SH), etc. These modifications increase the adsorption capacity of nanocellulose towards different pollutants in wastewater.17,18 Use of polymers in environmental remediation offers design flexibility, recyclability and ease of use. 19 Composites of the polymers are found to possess better properties than polymers alone.20–22 Nowadays a significant number of investigations are taking place in the field of bio-based polymer aerogel for wastewater treatment and biomedical applications. Among the polymer composites, hydrogel and aerogel composites possess optimum porosity and superior water absorption capacity. 23 Reduction in the dependence on monomers derived from petroleum sources and increased use of monomers from renewable sources are gaining importance as world is looking at more and more sustainable materials. Synthesizing biodegradable and biorenewable source for PU manufacturing and polymer industry as a whole is highly needed for both economic and environmental reasons. Industries increasingly indulged in the manufacturing of biobased polyols, mainly synthesized from vegetable seed oils. 24 The conversion of oils to polyols can be carried out using transesterification (one step synthesis), epoxidation, hydroformylation, and ozonolysis (two step synthesis). Transesterification uses less chemicals and found to be eco-friendly.25–27 IChaulmoogra (Hydnocarpus wightianus) oil and grape seed (Vitis vinifera) oil are two locally and easily available non-edible seed oils which possess the potentials of making polyurethanes. On the other hand, nanocellulose from Desmostchya Bipinnata is modified to use as filler in polyurethanes.
Extensive literature survey indicates that, the use of Chaulmoogra oil and grape seed oil for preparing polyurethane has been very limited. Also, the use of nanocellulose from plant sources and their use as fillers in bio-based polyurethane will make the overall composite more bio-based material. Hence, in the present work, nanocellulose from Desmostachya Bipinnata grass leaves are prepared and functionalized via carboxylation, amination and phosphorylation. Modified nanocellulose is further reinforced into polyurethane via in-situ polymerization route. The obtained bio-based composite materials with flexible design option have been used as adsorbents for adsorbing MG dye. Further, Taguchi’s method is used to optimize chemical processes which contributes to the process economy.
Experimental
Materials
DABCO (1,4- diazabicyclo 2 Octane, MDI (4,4’-diphenyl methane diisocyanate) were purchased from Tokyo chemical industries (TCI), Bangalore. PEG-6000 was procured from Karnataka Fine Chemicals, INDIA. Desmostachya Bipinnata grass was purchased from local vendors. Sodium hypochlorite, hydrogen peroxide (40%), pH buffer 4.5 and sulphuric acid (64%) were procured from Karnataka Fine Chemicals, INDIA for bleaching and hydrolysis process. Orthophosphoric acid, urea, ethylene diamine (99%), acryl amide (98%), potassium peroxo disulphate, citric acid and hydrochloric acid were procured from Sigma Aldrich. Distilled water was used throughout the experiments. All the chemicals were used without further purification. Chaulmoogra oil and Grape seed oil were procured from local vendor.
Methods
Synthesis of nanocellulose from Desmostachya Bipinnata grass leaves
Oven dried grass leaves were milled, and the powdered grass was digested at 80°C in 4% NaOH solution for 2 hours to remove a larger part of lignin and hemicellulose. Then the powder was subsequently bleached with 1.7% (w/v) NaClO2 and hydrogen peroxide (40%) mixture to remove the lignin and remaining hemicellulose. The bleached cellulose fibers were washed thoroughly with distilled water until the water showed a neutral pH. The obtained cellulose was acid hydrolyzed by refluxing with 60% (w/v) H2SO4 for 60 minutes. The reaction was quenched by adding five-fold ice water into the mixture. Hydrolyzed sample was washed to neutral pH and sonicated for 15 minutes followed by filtration.
Surface functionalization of nanocellulose derived from Desmostachya Bipinnata
Carboxylation
80wt% of aqueous solution of citric acid was made and nanocellulose was soaked in the solution with magnetic stirring under reflux with oil bath temperature of 90°C for 5–6 hrs. One-fold de-ionized water was added to dilute the solution. The isolation of NCs was carried out by repeated centrifugation at 14,000 rpm for 8−12 min by replacing supernatant with equal amount of de-ionized water. The presence of NCs was confirmed at pH 5, where turbidity was persistent. Then turbid supernatants (i.e., NC aqueous suspensions) were filtered and dried.
Phosphorylation
85% (v/v) phosphoric acid was added to 3 wt% NC dispersion at 30°C. After adding acid, the reaction flask was placed in an oil bath which was pre-heated to 100°C. The mixture was stirred for 30 minutes. The slight yellow reaction mixture was cooled and kept in an ice bath at room temperature. The modified and unmodified NCs were centrifuged at 9000 rpm for 15–20 min by replacing supernatant with equal amount of de-ionized water. The process was repeated till neutral pH was reached and turbidity was persistent.
Amination
10 g nanocellulose was dissolved in 50 ml distilled water and 1 g of potassium peroxy disulphate was added into the mixture and stirred. After 10 minutes, 1 g acryl amide was added to it and stirred for 90 min at 50°C. 55 ml ethylene diamine was added into it and refluxed for 8 hours. The aminated NC was purified by washing with deionized water followed by vacuum drying at 50°C.
Synthesis of epoxidised Chaulmoogra seed oil and grape seed oil
Epoxidation of chaulmoogra seed oil was done using in situ prepared peracetic acid which was obtained by the reaction of 30 wt% hydrogen peroxide with glacial acetic acid as reported elsewhere. 27 Similar method was also used for the epoxidation of grape seed oil. 1200 g seed oil and 1200 g toluene was added with 140 g glacial acetic acid and 18 g sulfuric acid, and heated to 55–65°C. The hydrogen peroxide was slowly added dropwise to the reaction mixture and the mixture was stirred for 6 hours at 65°C. Then the organic layer was separated and washed with sodium bicarbonate to make it to neutral pH. Traces of toluene and water residues were removed by distillation.
Synthesis of polyols from epoxidised oils
100 g of epoxidised Chaulmoogra oil and 60 g of lactic acid was added in a 500 ml three necked round bottom flask that contains a stirrer bar, nitrogen purging system and thermometer. The reaction was carried out at 80°C for 6 hours under continuous stirring. The final reaction mixture was washed with distilled water to remove unreacted chemicals until the pH value of the solution became 7. The polyol obtained was recovered by evaporating the water under reduced pressure. Same method is adopted for grape seed oil also.
Preparation of Polyol-PEG based porous Polyurethane composites
Process flow chart for the preparation of nanocomposites is shown in Figure 1. Briefly, polyols from chaulmoogra oil and grape seed oil were taken equal ratio (3 g each). This mixture was added with 5 wt% (with respect to PU mass) of mixed functionalized nanocellulose (in equal quantity) along with 0.7 wt% DABCO catalyst (with respect to polyol and PEG mass) and stirred. The mixture was heated to 95–100°C and 4 g of PEG-6000 was added into the mixture and mixed well at 100°C. To this mixture 1.5 g of MDI was added and mixed under nitrogen atmosphere. The mixture was stirred well and immediately poured into a mold. After the polymer composite formation, it was removed from the mold and washed with water and kept in ethanol and then washed with acetone. The unreacted monomers were removed by washing the porous polyurethane composite with water. Same procedure was used to prepare 1 wt% and 3 wt% nanocellulose filled porous polyurethane composites. Process flow diagram for the preparation of nanocomposites.
Characterization of Polyols, nanocellulose and porous PU and its nanocomposites
X-ray diffraction of nanocellulose was done using Rigaku Ultima IV X-Ray Diffractometer at an operating voltage of 40 kV and current 30 mA using Cu-kα radiation (1.5406 Å). The scan speed was 3.0000°/min and scan range was 5 to 85°. Measurement of carboxyl group and amino group in the nanocellulose were carried out using standard procedures. 28,29 The chemical structure of Chaulmoogra seed oil, grape seed oil and their derived polyols were analyzed by 1H NMR spectroscope using Bruker model AV400 (400 MHz). FTIR spectra of the polyols were recorded by Bruker (Alpha, 200619) Infrared spectrophotometer. ASTM procedures were used to measure OH Value (ASTM D4274-11), Saponification Value, Water Content (ASTM D6304-07), Acid Value (ASTM D4662-08), % Oxirane Value (ASTM D1652), and Iodine Number of both oils and polyols (ASTM D1957). Acid number of the two polyol was determined by ASTM D4662-08 procedure. FESEM characterization of nanocellulose and polyurethane and nanocomposites were carried out using JEOL JSM-7100F. ATR-IR of polyurethane was conducted using Bruker Infrared spectrophotometer (Alpha 200619). Thermal analysis was carried out using Perkin Elmer, Diamond TG/DTA thermal analyzer in nitrogen atmosphere with a heating rate of 10°C/min.
Adsorption Studies
The adsorption studies were performed with constant stirring in Erlenmeyer flasks, using 20 mL of 10 ppm MG solution together with the adsorbent material. 0.1, 0.3 and 0.5 gm of the adsorbent was studied for a period of 30, 60 and 90 minutes at different temperatures, viz. 30, 40 and 50°C. The pH adjustment was realized with dilute solutions of NaOH and HCl (0.1 N). The dye concentration was determined by a UV–VIS spectrophotometer at 617 nm wavelength. Adsorption capacity at equilibrium (qe) and at time ‘t’, (qt) were calculated and dye removal percentage R (%) was evaluated.


Taguchi’s experimental design
Controllable factors and their levels.

Taguchi’s optimization enables experimental results into a signal to noise ratio (S/N). It helps to analyze the experiment quality and result validity. The term signal denotes the mean value and noise represents the standard deviation. In general experimental results are analyzed by analyzing the highest adsorption efficiency. In Taguchi’s analysis, signal to noise ratio ‘Larger is better’ is considered. Minitab 19 was used for the necessary calculations.
Desorption experimental studies
Preliminary analysis was done by using different solvents such as acetone, chloroform, methanol, ethanol, salt etc. In the desorption studies MG loaded adsorbent was mixed with different desorption agents such as ethanol: water (80:20), methanol: water (80:20) and solvent mix of chloroform: methanol: water (1:1:1). A solvent volume of 15ml was added to 0.5g of dried dye-saturated substrate, and it was shaken vigorously for 15 minutes. The MG dye extract solvent was then filtered. This solvent mixture was left to evaporate at 650C to evaporate the solvent. The remaining volume water was made up to 5ml with distilled water and the concentration of the desorbed dye was determined by a spectrophotometer.
The desorption percent D (%) of the dye was calculated by the following equation
Results and Discussions
Characterization of nanocellulose
FESEM Analysis
The morphological analysis of nanocellulose is considered as an important parameter as the source and the surface treatment of the nanocellulose has a significant influence on the dimension and characteristics of nanocellulose formed. The morphology of prepared cellulose was observed under FESEM and the results are found to be similar to our earlier reported results (Figure 2a and 2b).
30
Even though the surface of the nanocellulose looks flaky (Figure 2a), but a magnified view of the same material shows the formation of cellulose fiber (Figure 2b). This is attributed to effective hydrolysis of cellulose. A closer observation reveals the defibrillation of nanoscale order, which shows the conversion of cellulose to nanocellulose. Defibrillation of cellulose fibers indicates the successful removal of non-cellulosic region hence the fibers are individualized to nano dimension.
31
In order to see the fibrils distinctly, either high resolution field emission scanning electron microscopy or transmission electron microscopy would be better. FESEM images of nanocellulose derived from Desmostachya Bipinnata grass leaves (a) Lower Magnification and (b) Higher Magnification (Reproduced with permission from ref [30]).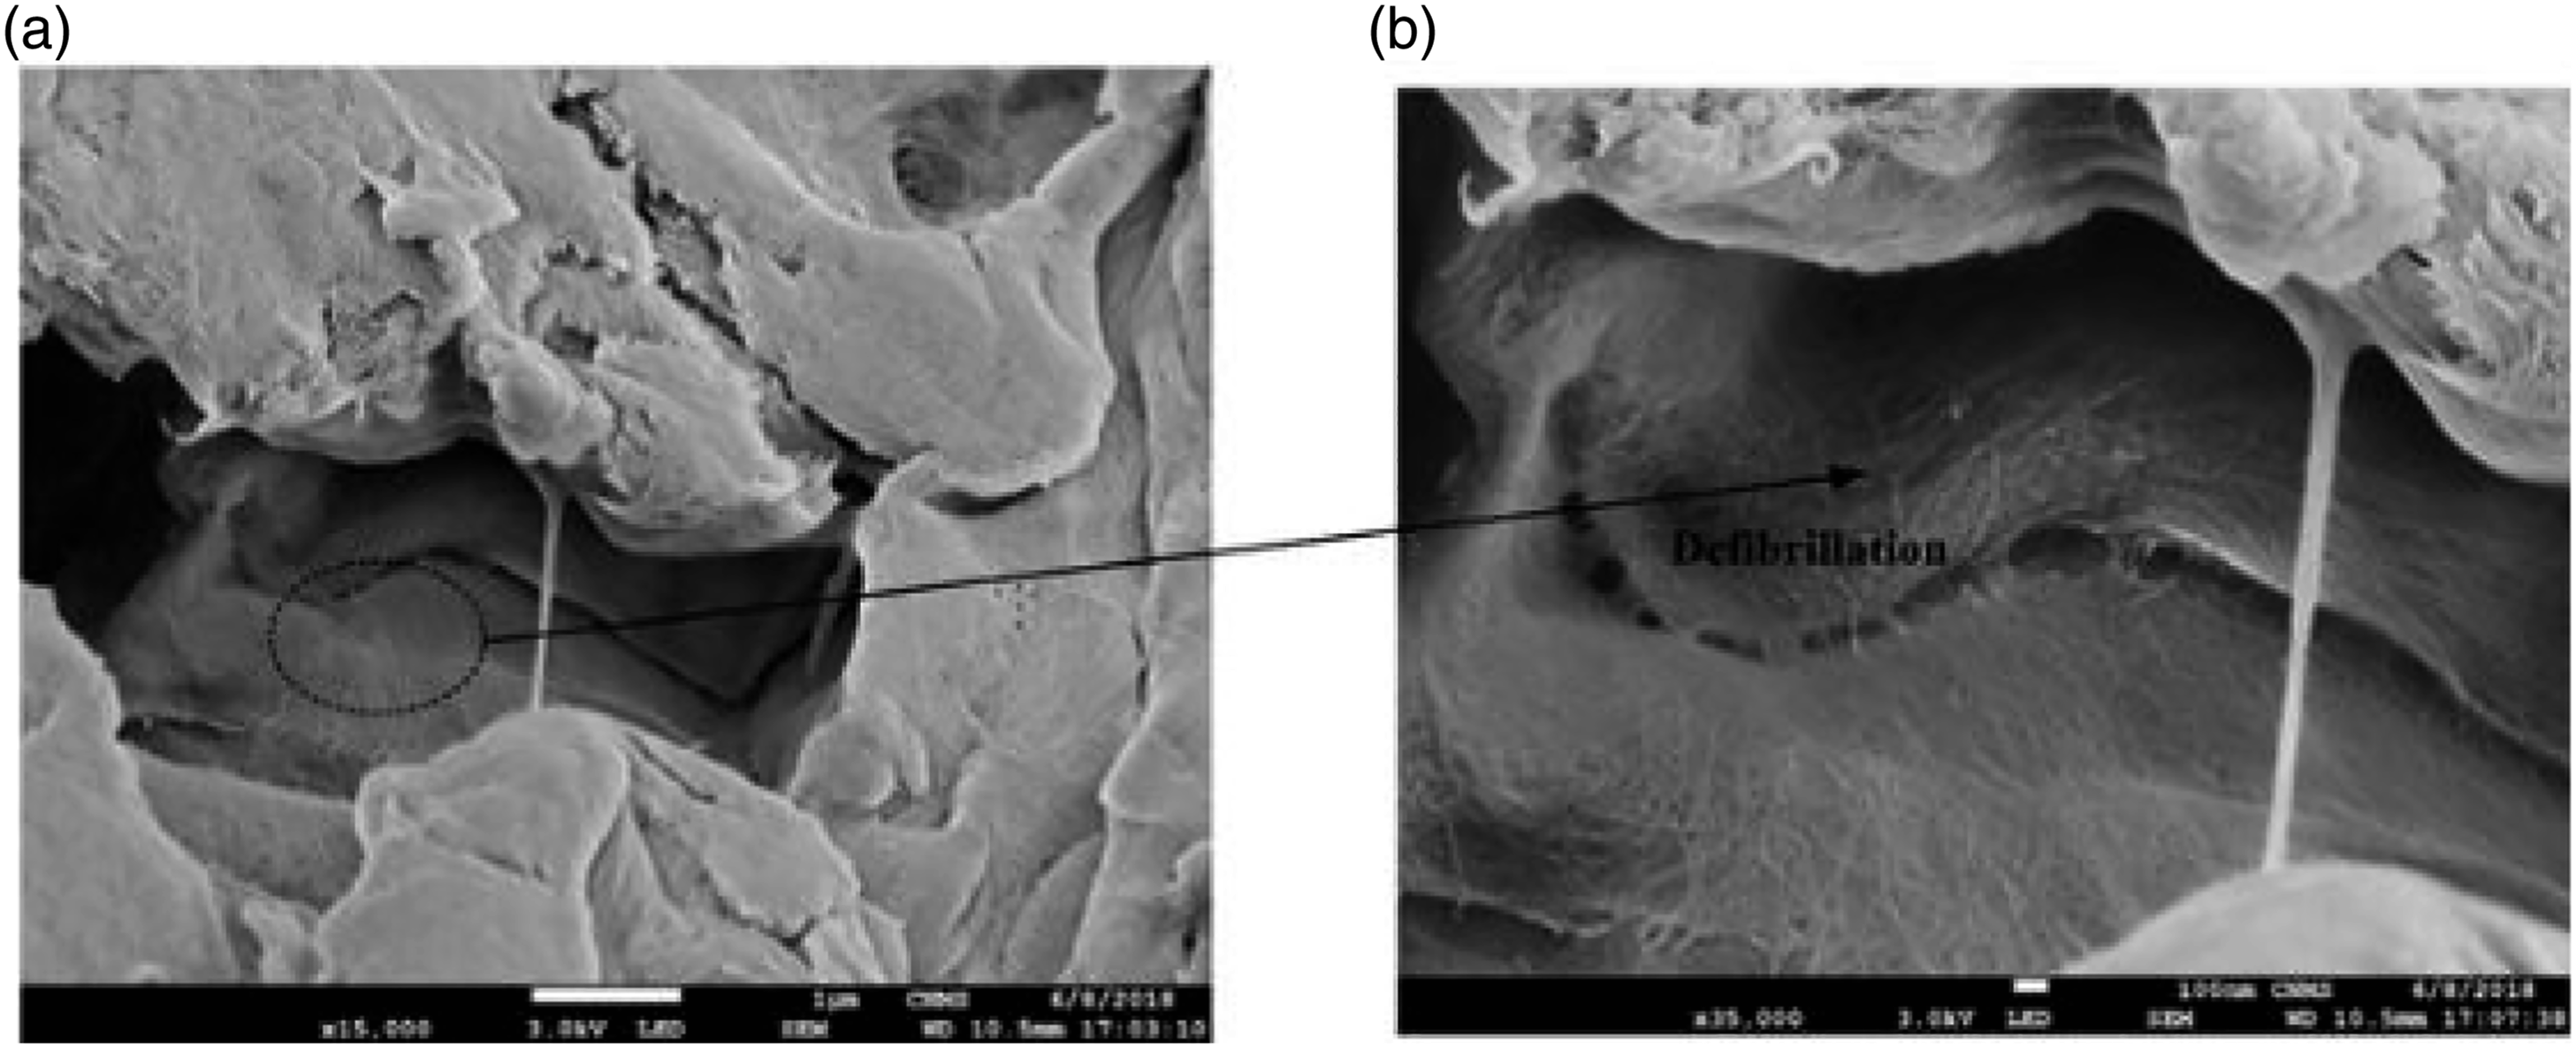
X-ray diffraction analysis
XRD graphs of cellulose, nanocellulose and surface functionalized nanocellulose are shown in Figure 3. Figure 3(a) and (b) show that both cellulose and hydrolyzed cellulose have sharp peaks observed at 2θ =15.8°, 22.3° and 34.7° which are the characteristic peaks of [1 1 0], [2 0 0] and [0 0 4] lattice planes.
32
A shoulder observed at 20.4° corresponds to the lattice plane [0 1 2]. The crystallinity index of the bleached and NC samples were found to be 67.02% and 79.6% respectively. Cellulose-I peak at 22° was clearly observed. A mini shoulder at 2θ =16° shows the presence of cellulose-II in the sample. The crystallinity index was increased from 67.02% for cellulose to 79.6% for nanocellulose. This is attributed to the reason that the non-cellulosic content is removed during the pre-treatment process like delignification and bleaching, and the amorphous region is dissolved by controlled acid hydrolysis. Nano-fibrillation may also lead to an increase in the crystallinity index.
33
XRD images of (a) Cellulose, (b) Hydrolyzed cellulose, (c) Aminated nanocellulose, (d) Carboxylated nanocellulose and (e) Phosphorylated nanocellulose.
XRD pattern of aminated NC from Desmostachya bipinnata grass leaves is shown in Figure 3(c). X-Ray diffractometry for aminated NC displays peaks at 15.5° [1 1 0], 21.9° [0 2 0] and 34.9°[0 0 4] and CrΙ (crystallinity Index) was found to be 69.9%. The high intensity crystalline peak was observed at 21.9°. This suggests the retention of inherent crystalline structure of aminated NC even after the surface functionalization. Also, the modification occurred only on the surface which was again confirmed by the decreased crystallinity index upon amination when compared to unmodified NC. The cellulose I polymorphic form was retained in the aminated NC and the crystallinity decreased accordingly. It may also be due to the opening of glucopyranose rings and destruction of their ordered arrangements. 34 The double peak is due to its wide size distribution and different degrees of amino group substitution. X-Ray diffraction pattern of carboxylated NC from Desmostachya bipinnata grass leaves is shown in Figure 3(d). The peaks observed at 16.4° [1 1 0], 22.4° [2 0 0] and 34.7° [0 0 4] are similar to unmodified NC. CrΙ (crystallinity Index) of carboxylated NC is 73.9% which is lower than unmodified NC. It was found out that the majority of the crystalline structure of NC was preserved during the carboxylation process. Slight decrease in crystallinity is due to long term oxidation resulting in the removal of some crystalline region. 35 Ultrasonication in the defibrillation process might result in a small alteration to both the amorphous and crystalline regions of cellulose. 36 X-Ray diffraction pattern of phosphorylated NC from Desmostachya bipinnata grass leaves is shown in Figure 3(e). X-Ray diffractometry displays peaks observed at 15.9° [1 1 0], 22.4° [2 0 0] and 34.9° [0 0 4]. CrΙ (crystallinity Index) of phosphorylated NC was calculated as 78.6%. The maximum intensity crystalline peak was observed at 22.4° and low intensity amorphous peak was observed around 18°. CrΙ value of phosphorylated NC (78.6) is slightly lower than unmodified NC which may be due to the higher degree of substitution of functionalized phosphate group. 37
FTIR analysis of nanocellulose and modified nanocellulose
FTIR analysis of cellulose, nanocellulose and functionalized cellulose are shown in Figure 4. Figure 4(a) displays the FTIR spectrum of desmostchya bipinnata cellulose before hydrolysis and (b) represents after hydrolysis. Broad Peaks observed at 3427.9 and 3348 cm−1 in Figure 4(a) and 4(b) shows the O-H stretching vibrations.
38
Another sharp peak at 2917.3 and 2902 cm−1 in the bleached and hydrolyzed cellulose spectra is due to the stretching vibrations of saturated C-H group in the cellulose. Peak around 1371 cm−1 and 1327 cm−1 is associated with asymmetric and symmetric C-H bending vibrations. Absence of Peak around 1200 – 1300 cm−1 for lignin and 1700-1800 cm−1 for hemicellulose in both the spectra (Figure 3a and 3b) indicates the complete removal of lignin and hemicellulose from the cellulose due to bleaching and other chemical treatments. Peak observed at around 1162 cm−1 is due to the C-O-C stretching vibrations of pyranose ring. Another prominent peak around 1061 cm−1 is related to C-O and C-O-C stretching vibrations of cellulose. Small peak at around 667 cm−1 of the spectra corresponds to O-H out of plane bending. No noticeable difference was observed between bleached spectra and hydrolyzed one. The bands at 899 and 895 cm−1 in the bleached and hydrolyzed spectra are due to C-O stretching and β-glycosidic C-H rocking vibrations of cellulose structure.
39
The results suggest that the chemical structure of cellulose did not change after alkali treatment, as the absorption bands in the spectra clearly represents the characteristic bands of the cellulose. This confirms the structure of the cellulose is preserved during the pre-treatment such as bleaching. Most of the peaks in the NC spectra (Figure 4(b)) are same as that of the cellulose (Figure 3(a)). This indicates the retention of structure of the cellulose even after the hydrolysis. FTIR spectrum of (a) Cellulose, (b) Hydrolyzed cellulose (nanocellulose) (c) Aminated nanocellulose, (d) Carboxylated nanocellulose and (e) Phosphorylated nanocellulose.
But the peak at 3348.6 cm−1 (Figure 4 (b)) due to O-H stretching vibrations is sharper and strong compared to the similar peak in Figure 3(a). This indicates hydrolysis leads to an increase in the exposed O-H groups due to the conversion of cellulose into nanocellulose. Figure 4(c) is the FTIR spectra of aminated nanocellulose derived from Desmostchya bipinnata. There is a new peak observed at 1476 cm−1 in Figure 4(c) (which is absent in other nanocellulosic materials) is due to N-H bending vibrations 40 which shows the presence of amine group in the surface functionalized nanocellulose. Figure 4(d) is the FTIR spectra of carboxylated nanocellulose derived from Desmostchya bipinnata grass leaves. This spectrum contains a peak at 1736.5 cm−1 due to the stretching of the carbonyl group 41 which is absent in Figure 4(a) and 4(b). Figure 4(e) shows the FTIR spectra of phosphorylated nanocellulose. A new peak at 1280.9 cm−1 is present in Figure 4(e) showing free stretching vibrations of P=O, which is not present in Figure 4(b). 42 There are two new peaks visible in Figure 4(e) at 1090.5 and 991.8 cm−1 due to O-P-C and P-OH stretching vibrations respectively. Similar results were obtained for O-P-C and P-OH stretching vibrations with closer frequencies by other researchers.42,43 This confirms the phosphorylation of nanocellulose. 44
Crystallinity index, Crystalline size, Yield, Carboxylic group content, Amine group contents and Water retention value of nanocellulose and modified nanocellulose
Carboxyl content of CNC and modified CNC’s were measured and calculated. Quantification of carboxyl group content of desmostachya Bipinnata was done by using acid-base titration. Since –COOH groups are acidic, solution containing carboxylated CNC was titrated against a base. The value increased from raw cellulose to nanocellulose and also from nanocellulose to modified nanocellulose. It is due to the availability of limited hydroxyl groups of cellulose and the conversion of surface hydroxyl groups to carboxyl after the modification process. Large number of OH groups present on the CNC surface will react with citric acid easily. Quantification of amino group content present in the modified desmostachya Bipinnata was also done by using acid-base titration. Since amine groups are basic, solution containing aminated CNC was titrated against an acid. Additional acid required to neutralize the aminated CNC will measure the amount of –NH2 group introduced into the amino modified CNC. The larger number of functionalized amino groups can be attributed to the esterification reaction.
Crystallinity index, Crystalline Size, Yield, Carboxylic group content, Amine Group contents, Phosphate group content and Water retention value of Nanocellulose and modified Nanocellulose.

Characterization of Oils, Epoxidised Oils and Polyols
FTIR Analysis of Chaulmoogra oil, Epoxidised oil and Polyol
In Figure 5, the major triglyceride bands of carbonyl ester groups are observed at 1731 (Figures 5(a) and (b)) and 1744 cm−1 (Figure 4(c)). Vibrations due to stretching of aliphatic hydrocarbons (–CH2) are observed at 2916 and 2848 cm−1 (Figure 4(a) and 4(b)), and at 2922 and 2855 cm−1 (Figure 5(c)). A new band is observed in Figure 4(b) at 802 cm−1 Which corresponds to epoxy groups thus confirming the successful epoxidation to chaulmoogra oil.
47
FTIR spectrum of (a) chaulmoogra oil (CMO) (b) epoxidised chaulmoogra oil (c) polyol derived from CMO, (d) grape seed oil (GSO) (e) epoxidised grape seed oil (f) polyol derived from GSO. H1-NMR Analysis of Chaulmoogra oil and Chaulmoogra polyol.
FTIR spectra of the polyol derived from chaulmoogra oil (Figure 5(c)) shows a band at 3495 cm−1 corresponding to –OH (broad stretching) which indicates the formation of polyol from the epoxidised chaulmoogra oil. Disappearance of band at 2983 cm−1 corresponding to =CH group of double bonds of chaulmoogra oil and epoxidised chaulmoogra oil indicates it’s conversion into hydroxyl groups. The intensity of band corresponding to triglyceride bands of carbonyl ester groups is shifted from 1731 cm−1 to 1744 cm−1. This could be due to newly formed lactate ion from lactic acid which acts as a chain extender in the process of polyol preparation from chaulmoogra oil.48,49
In Figure 5, the major triglyceride bands of carbonyl ester groups are observed at 1740 (Figure 5(d) and 5(f)) and 1733 cm−1 (Figure 5(e)), vibrations due to stretching of aliphatic hydrocarbons (–CH2) are observed at 2915 and 2855 cm−1 (Figure 5(d) and 5(e)), and at 2937 and 2855 cm−1 (Figure 5(f)). The peak at 3020 cm−1 and 3012 cm−1 is due to =CH group of double bonds of grape seed oil and epoxidised grape seed oil (Figure 5(d) and 5(f))
50
. A broader peak in the polyol spectra observed at 3476 cm−1 is due to –OH stretching (Figure 6(c)) and the disappearance of bands at 3020 and 3012 cm−1 confirms the conversion of double bonds into hydroxyl groups. A small band was observed at 865 cm−1 attributing to the unreacted epoxy groups which failed in converting to hydroxyl groups.
51
H1 NMR Spectrum of (a) Chaulmoogra oil and (b) Chaulmoogra polyol by LA as a chain extender (c) Grapeseed oil and (d) Grapeseed oil polyol by LA as chain extender.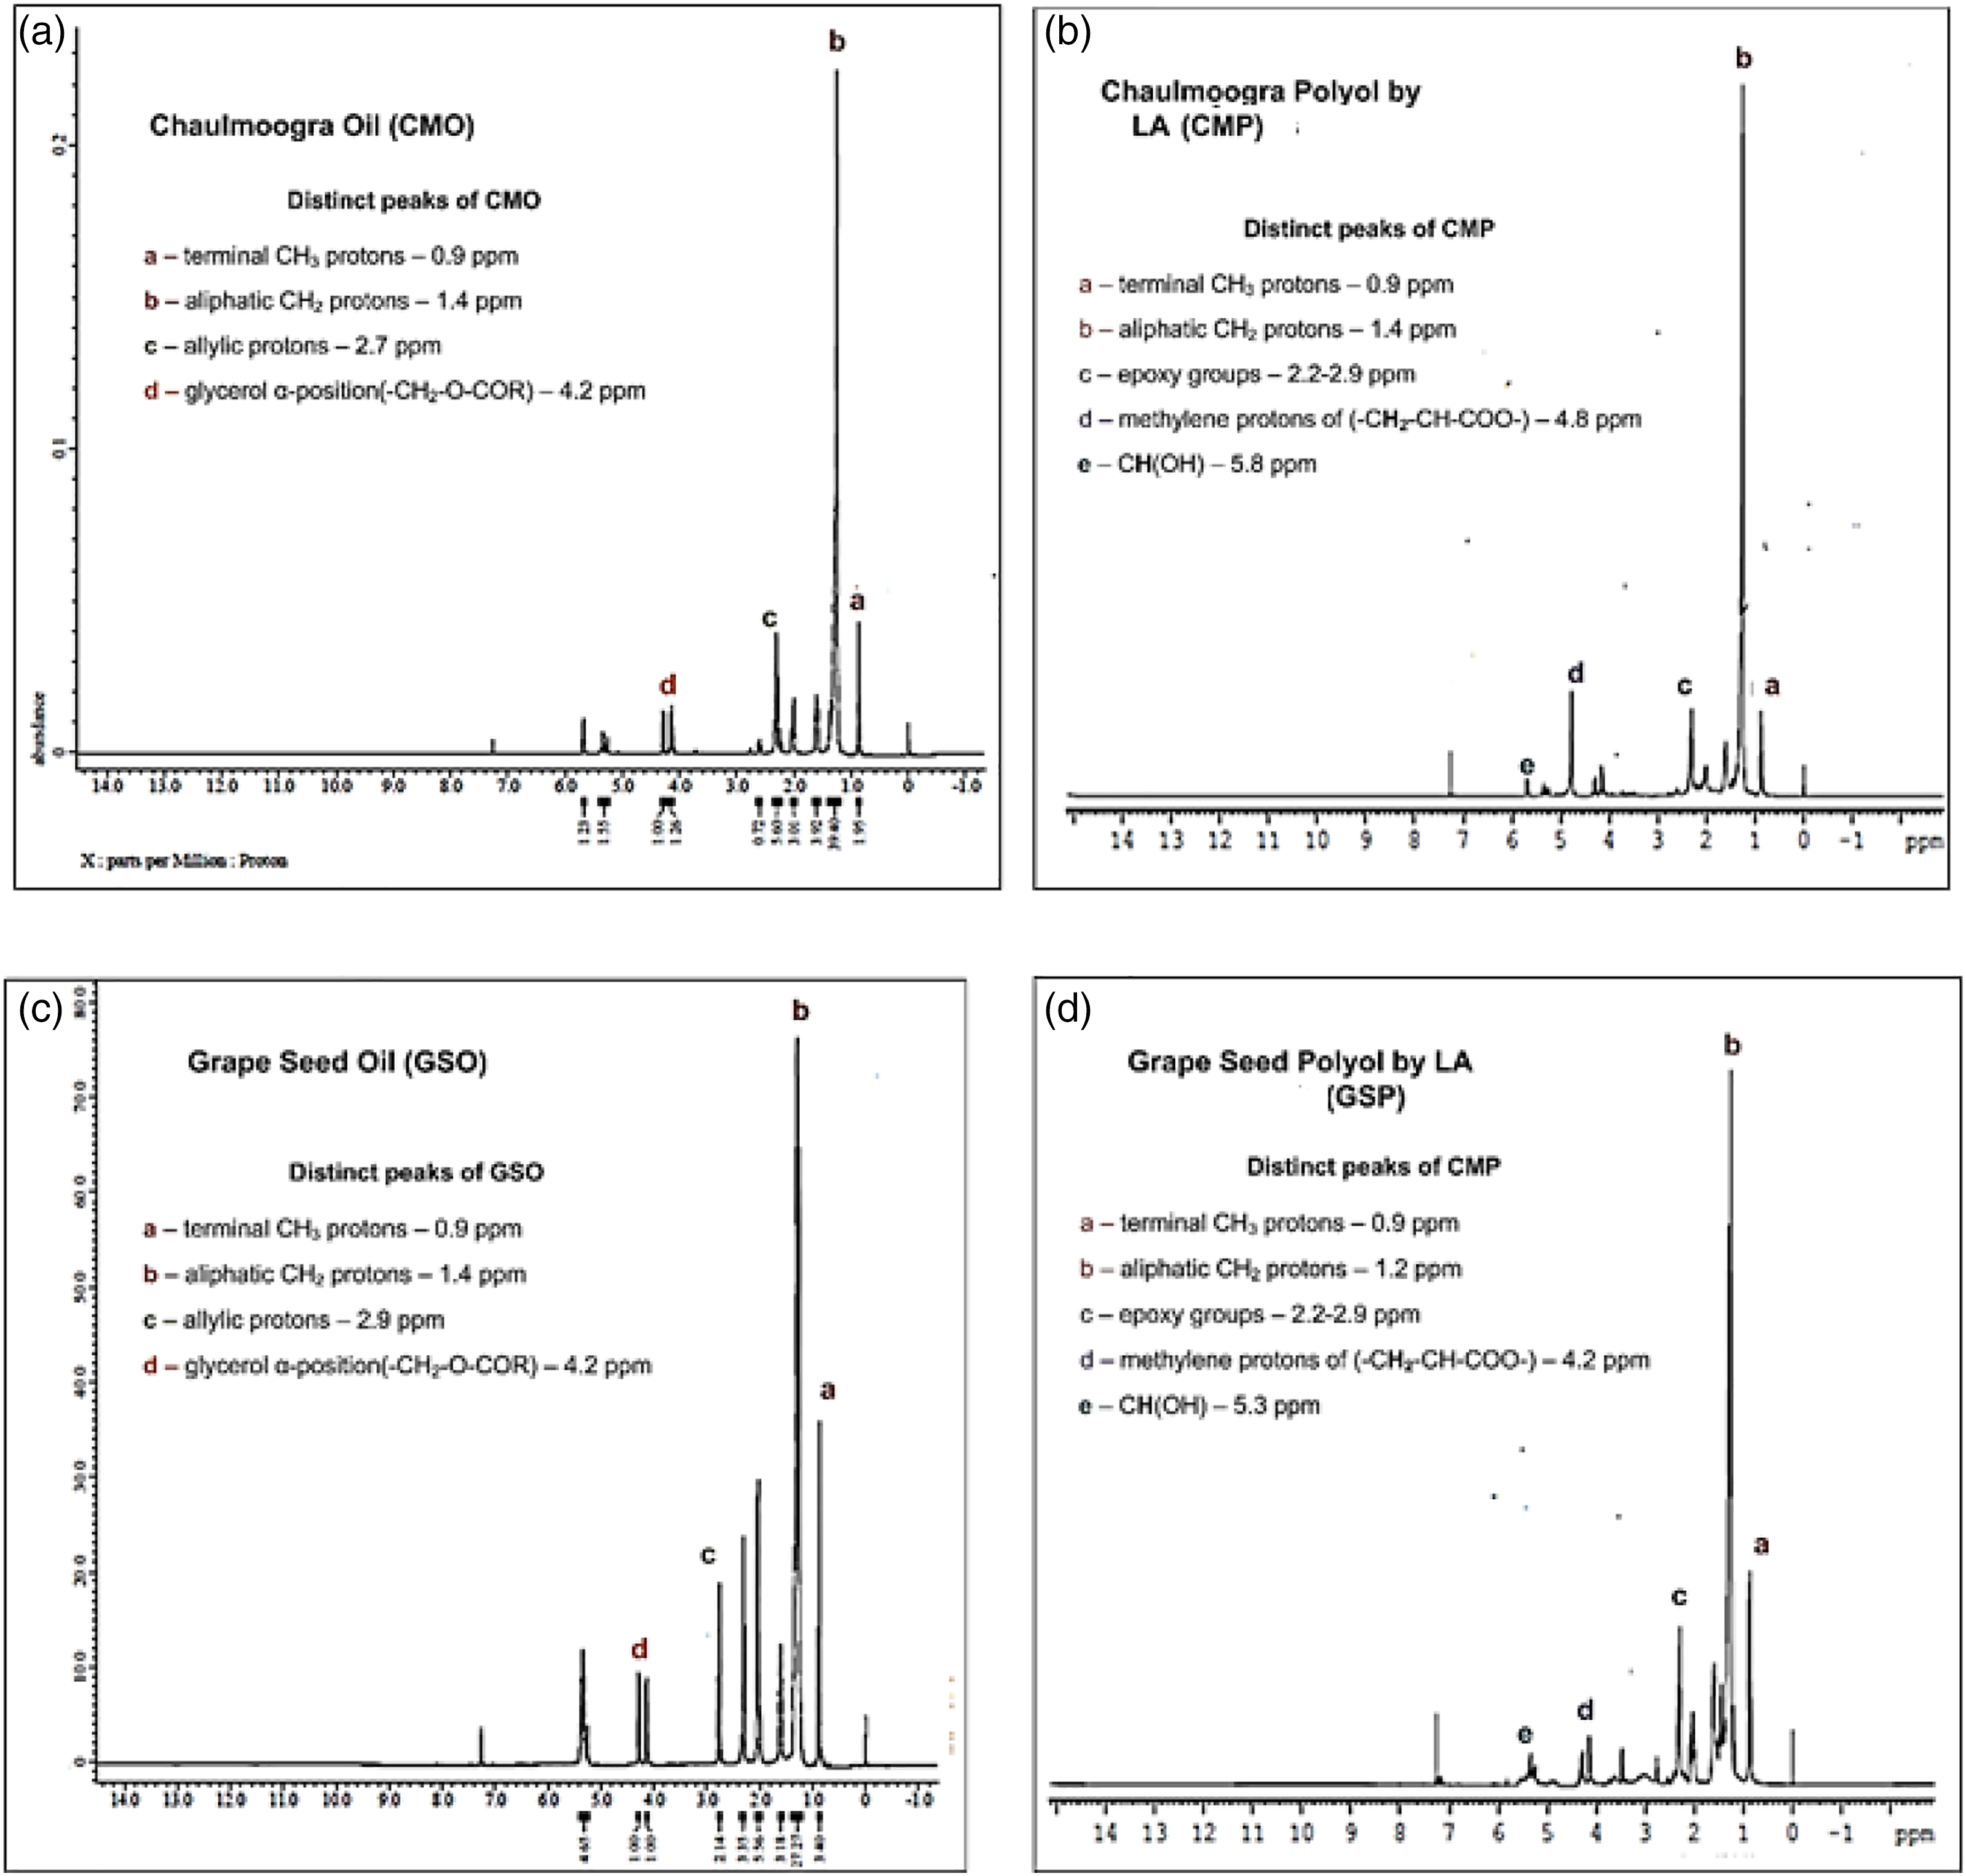
In Figure 6(a) and (b), the proton signals at 5.4–5.2 ppm are characteristic peaks of –C
H1-NMR Analysis of grapeseed oil and grapeseed polyol
In Figure 6(c) and (d), the proton signals at 5.4–5.2 ppm are characteristic peaks of –C
Physicochemical characterisation of the oils and polyols
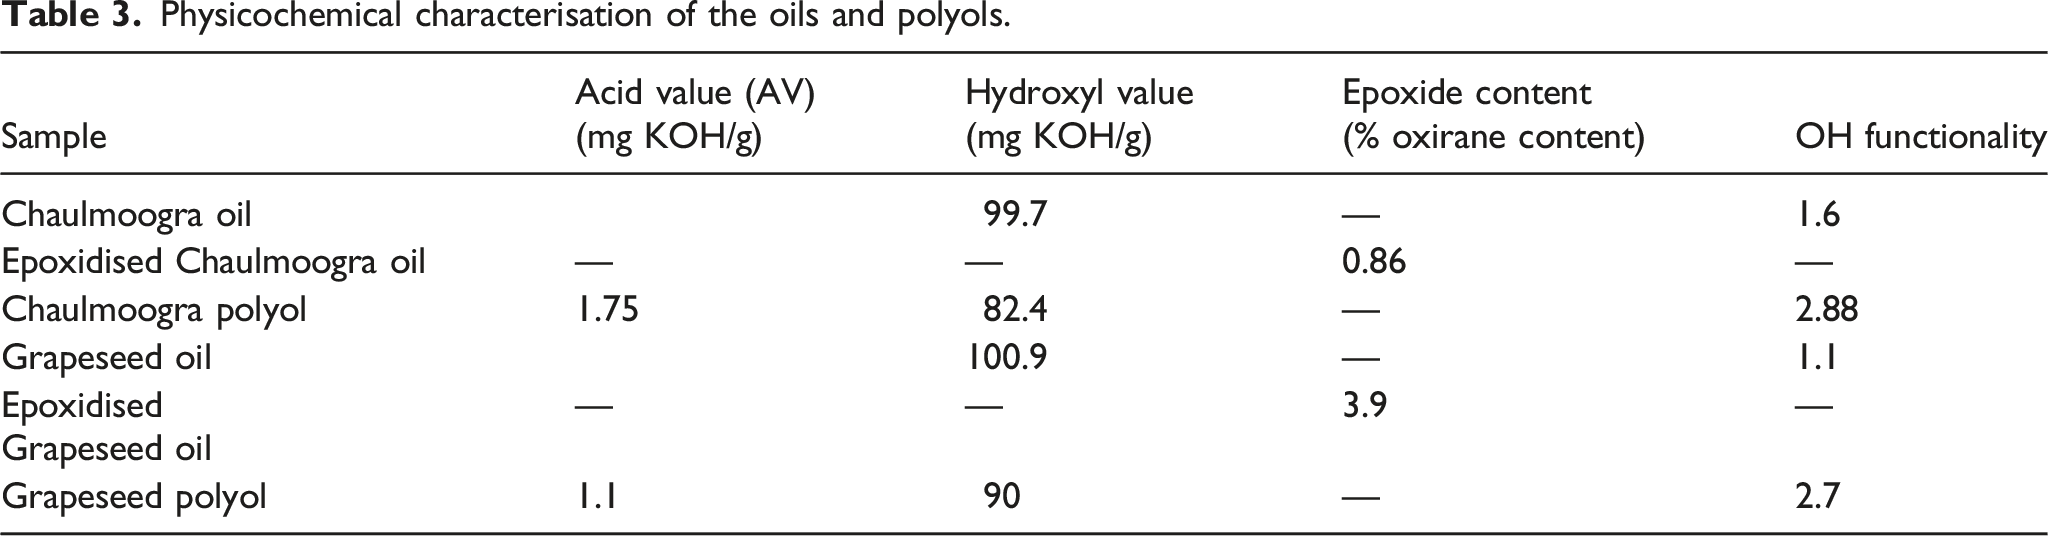
It is very essential to note the difference in the double bonds in the fatty acid chains of the oil, as it is fundamental in determining the possible –OH groups which will be introduced into the oils after its conversion to polyol.24,54 Tests to assess acid value (ASTM D4662-08), hydroxyl value (ASTM D4274-11] and % of oxirane content (ASTM D1652 - 11) were performed for chaulmoogra oil, epoxidised chaulmoogra oil, chaulmoogra polyol, grapeseed oil, epoxidised grape seed oil and grapeseed polyol.
Acid Value (AV) helps in determining the number of carboxylic acid groups present in the oil (i.e. free fatty acids). The initial value of both Chaulmoogra oil (CMO) and Grapeseed oil (GSO) was 10.96 and 0.078 mg KOH/g of oil respectively. The higher acid value of CMO was due to presence of moisture and processing conditions,55,56 whereas the AV of polyols derived from CMO and GSO was higher than oil because of epoxidation followed by hydroxylation of the oils. Acid value also plays an important role in determination of hydroxyl value of the polyol. 57
Hydroxyl value (HV) gives the measure of free hydroxyl groups present in the sample and the formation of the polyurethane depends on the NCO/OH ratio. HV of polyol helps in determining the –OH functionality which plays a significant role in the formulation of polyurethane. Before the conversion, the hydroxyl values of Chaulmoogra oil (CMO) and Grapeseed oil (GSO) was 99.7 and 100.9 mg KOH/g of oil and is mainly due to the presence of high moisture content and not due to any structural difference in the virgin oil. The HV values of chaulmoogra polyol and grapeseed polyol was 82.4 and 90 mg KOH/g of polyol which suggests that low –OH functionality polyol has been achieved. This was also confirmed by calculating –OH functionality with the help of proton NMR. % of oxirane content of epoxidised chaulmoogra and grapeseed oil was found to be 0.86 and 3.9 and with the help of these values, the –OH functionality was determined. The functionality of Chaulmoogra and grapeseed polyol was found to be 2.88 and 2.7 respectively. This confirms that the polyol obtained was with –OH functionality of the order 2. Low functionality has played a major role in achieving flexibility of the biobased porous polyurethane-nanocellulose composites from Chaulmoogra oil(CMO) and Grapeseed oil(GSO). 58
Characterization of Porous Polyurethane and Composites
FTIR Analysis of Porous Polyurethane and Composites
Figure 7 shows FTIR spectra of porous polyurethane and Polyurethane nanocomposites prepared using bio-based polyols and reinforced with a low fraction of modified cellulose nanocrystals. The absence of stretching frequency due to triglyceride functional groups and band of free –N=C=O at 2500–2270 cm−1 Confirms the complete consumption of MDI and formation of polyurethane.
59
The important FTIR characteristic features of porous polyurethane are the presence of bands of –NH at 3345 cm−1 which shows urethane group stretching, bands at 2862–2937 cm−1 for –CH2 symmetric and anti-symmetric stretching vibrations, 1704 cm−1 for –C=O stretching vibrations from urethane groups, 1531 cm−1 for –NH bending, 1232 cm−1 for –C–N stretching and 1105 cm−1 for –C–O stretching in the urethane group (–NHCOO–). Thus, the formation of urethane linkage in the polyurethane is confirmed. Since the percentage of nanocellulose crystals are not more than 5 wt%, it was not possible to separate specific peaks of nanocellulose.52,60 FTIR spectrum of neat PU and different weight percentage of NC filled PU. TGA Analysis of Porous Polyurethane and Composites.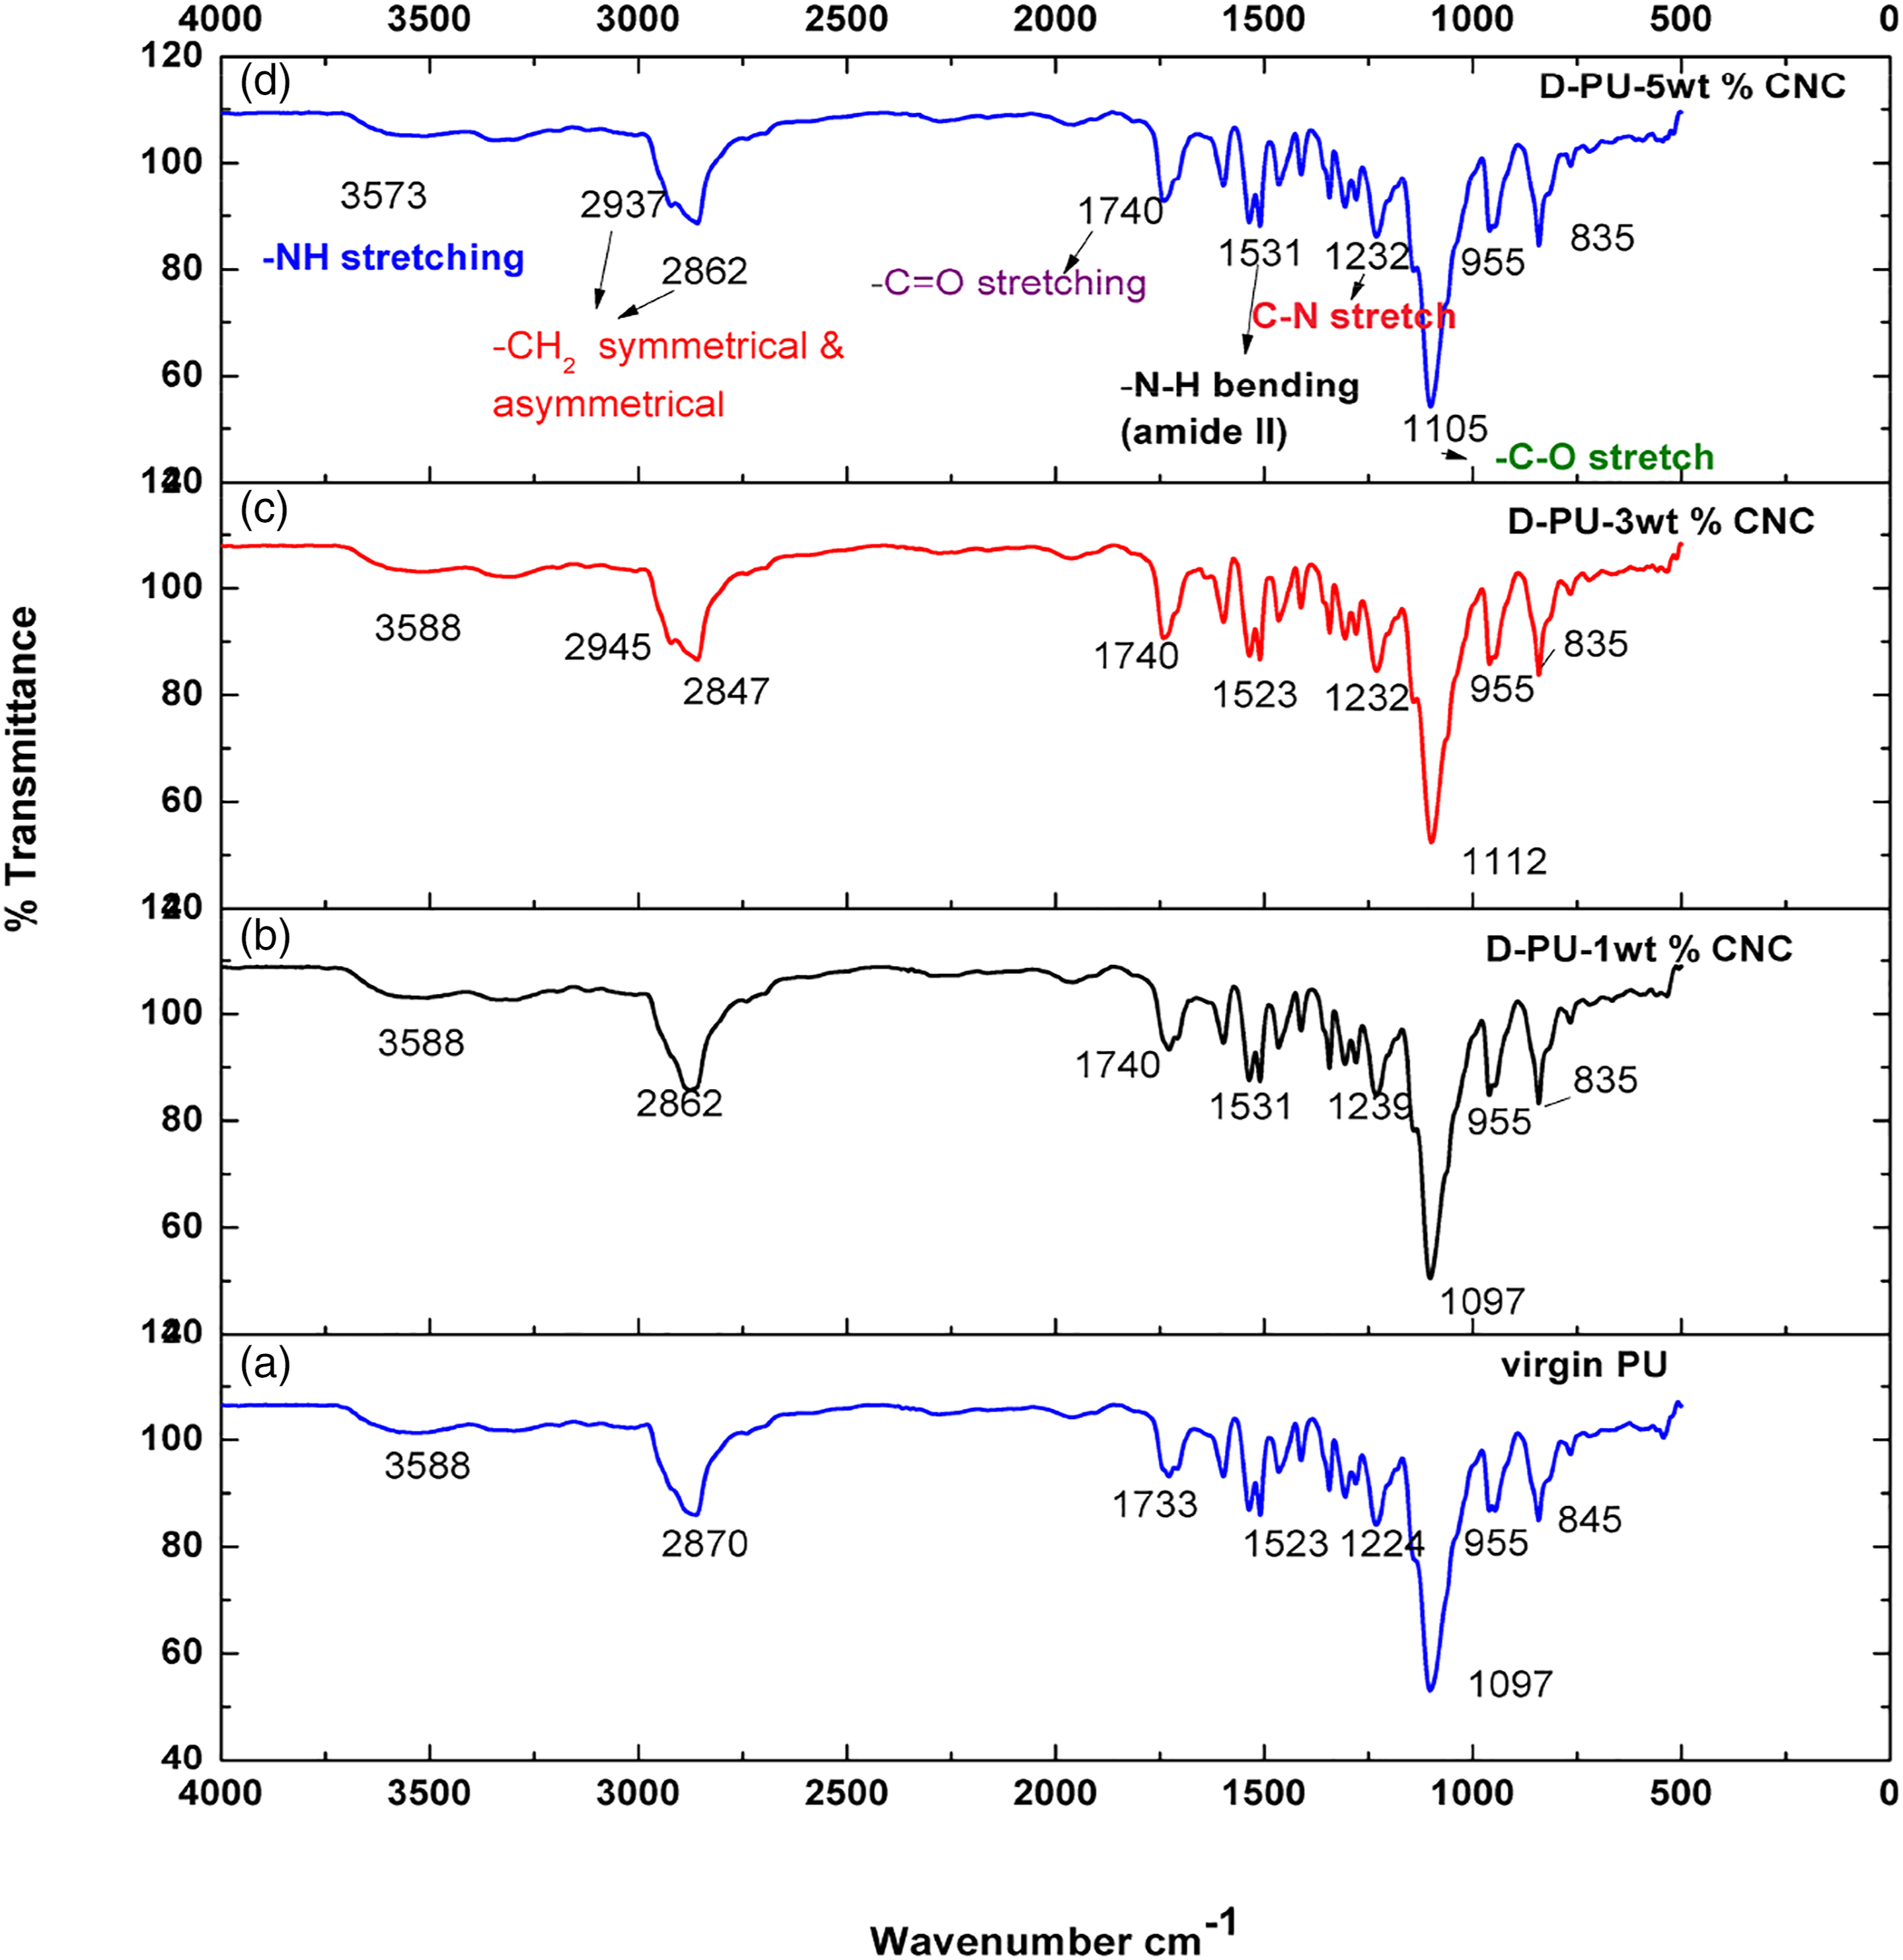
Thermal stability is important property for a material to decide its applications. Generally thermal stability is evaluated by measuring the initial degradation temperature (IDT) at 5 wt% degradation.
61
TGA and DTA results for PU and mNC filled PU are given in Figure 9. The results indicate better thermal stability for mNC filled PU composite. The surface modification of NC has resulted in better dispersion and adhesion of mNC in the PU matrix, which can hinder the heat propagation and act as a barrier, thereby increasing the thermal stability.
62
The IDT for PU is 256.3°C and that of mNC filled PU composite is 270.5°C (Figure 8(a)). This can be attributed to the incorporation of nanocellulose into the porous PU offering a stabilizing effect against decomposition. It can be seen in the thermogram (Figure 8(b)) that the decomposition of the sample was occurring in two stages. First stage degradation corresponding to urethane decomposition is occurring at 296.2°C for PU. It has increased to 325.3°C for mNC filled PU indicating the increase in thermal stability upon the incorporation of mNC. The second stage degradation corresponding to chain scission of polyol back bone, which is at 408.1°C for neat PU and 419.5°C (Figure 8(b)) for mNC filled PU showing retardation in the decomposition of PU by the addition of modified nanocellulose. (Table 3) (a) Thermogram of neat PU and 5 wt% mNC filled PU (b) DTA of neat PU and 5 wt% mNC filled PU. SEM. Analysis Porous Polyurethane and Composites. Physicochemical characterisation of the oils and polyols.
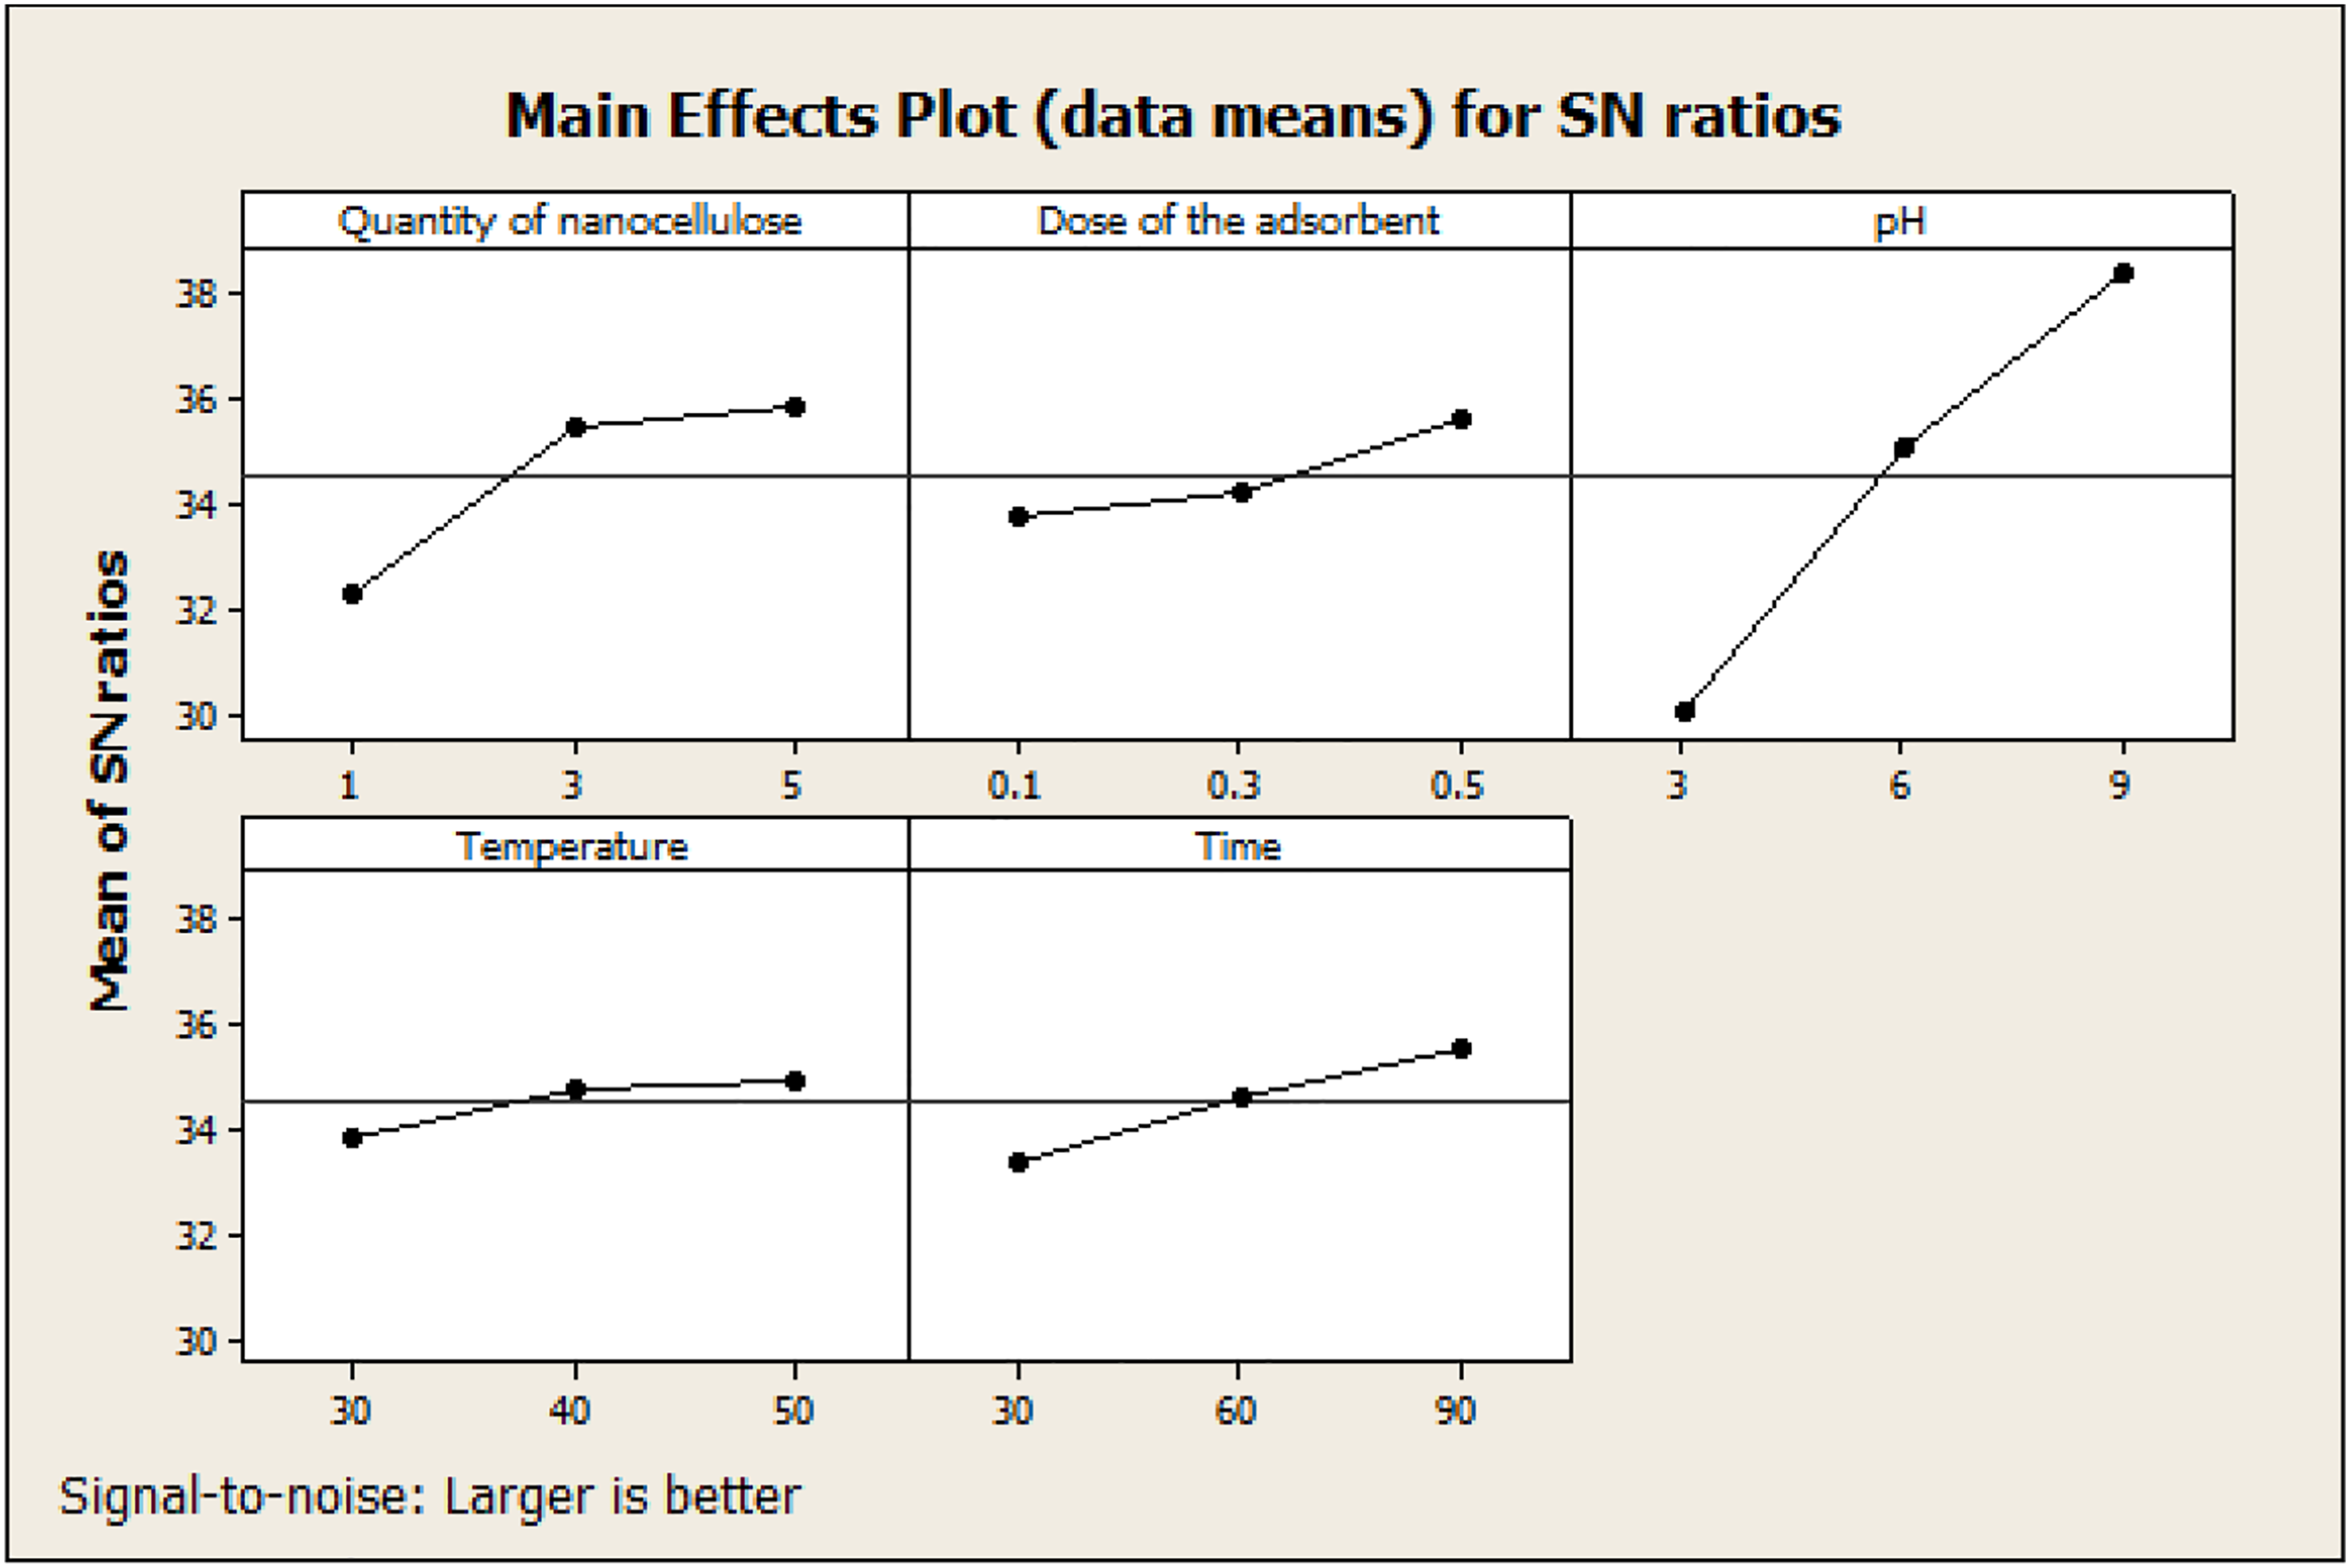
Scanning Electron Micrograph (SEM) of virgin PU and its composites are shown in Figure 9. Morphological analysis of the virgin PU indicates the existence of cell porosity with mixture of elongated and spherical shaped pores. The surface morphologies of modified nanocellulose (combination of aminated, carboxylated and phosphorylated in equal amount) filled PU shows increase in the size of the pores with spherical shapes. Addition of nanocellulose increases the viscosity of the reaction mixture leading to coalesce of pores. This is evidenced with the decrease in the strut size, between two pores, with the increase in nanocellulose in the PU composites. It can be seen in the SEM images of composites (Figure 9b, c, d) that the distribution of nanocellulose exists with some extent of agglomeration at higher loading. At higher nanocellulose loading of 5 wt%, the pores have collapsed (Figure 10(d)). SEM images of (a) Virgin PU (b) 1 wt.% NC filled PU (c) 3 wt.% NC filled PU (d) 5 wt.% NC filled PU. Optimization of Adsorption by Taguchi’s Method. The S/N ratio response curves for the individual effects of parameters on MG dye adsorption efficiency.
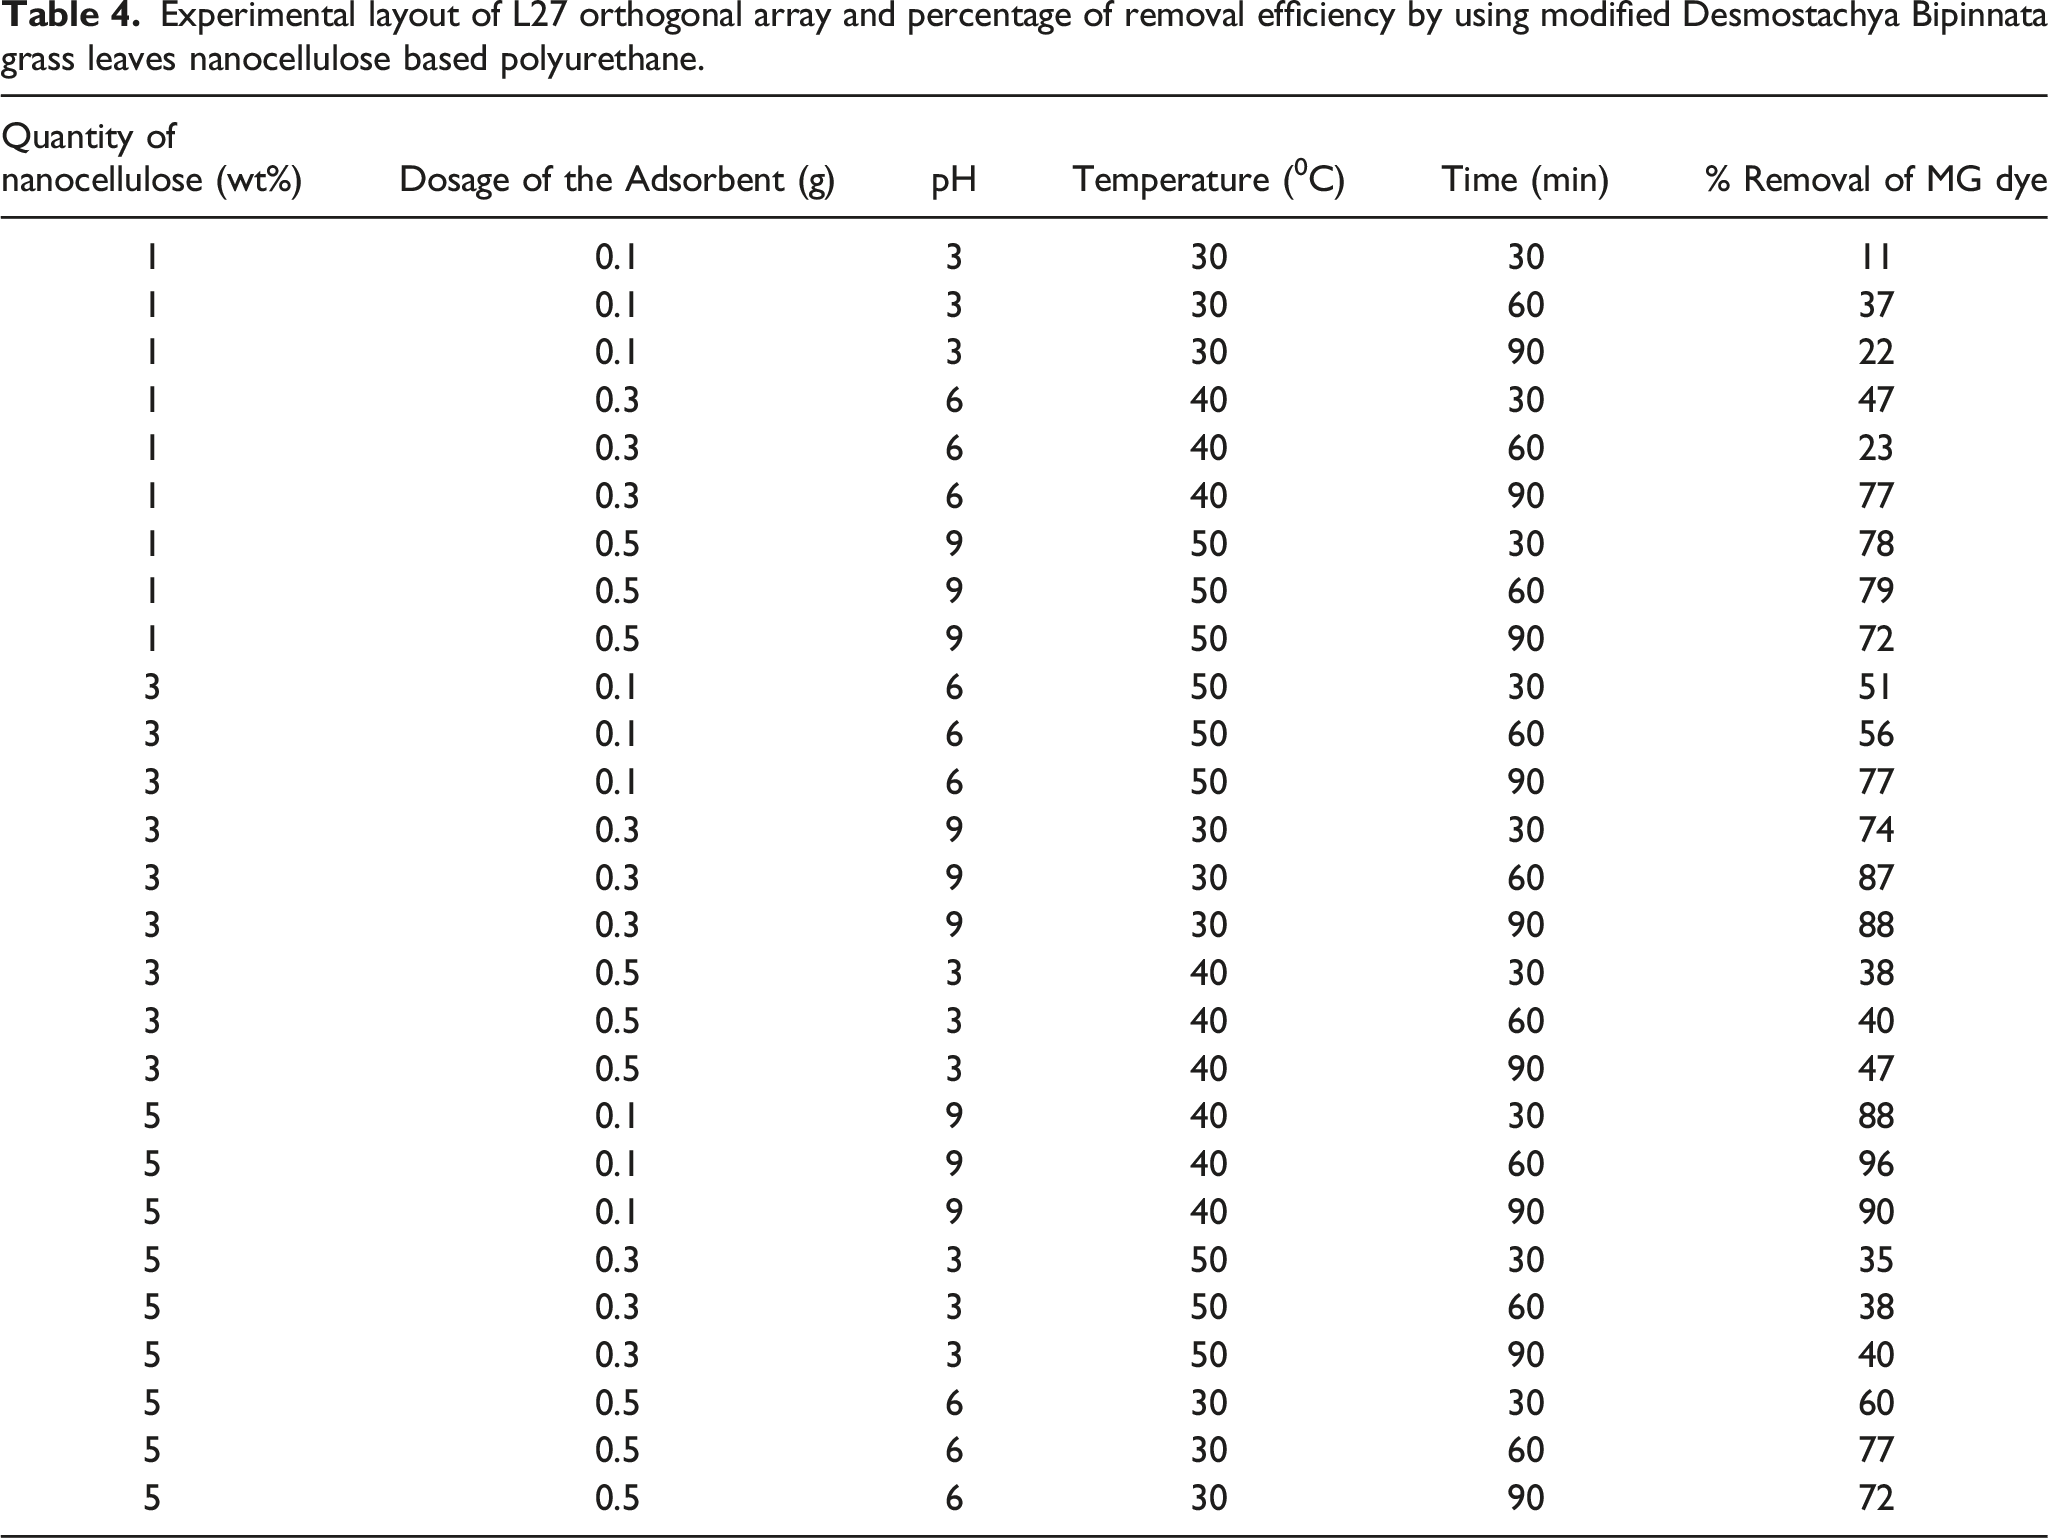
Experimental layout of L27 orthogonal array and percentage of removal efficiency by using modified Desmostachya Bipinnata grass leaves nanocellulose based polyurethane.
Response Table for Signal to Noise Ratios (Larger is better).

Percentage of removal efficiency by using Aminated (A-NC), Carboxylated (C-NC), Phosphorylated (P-NC) and hybrid of the (equal amount of carboxylated, aminated and phosphorylated nanocellulose) Desmostachya Bipinnata grass leaves nanocellulose based polyurethane composite.
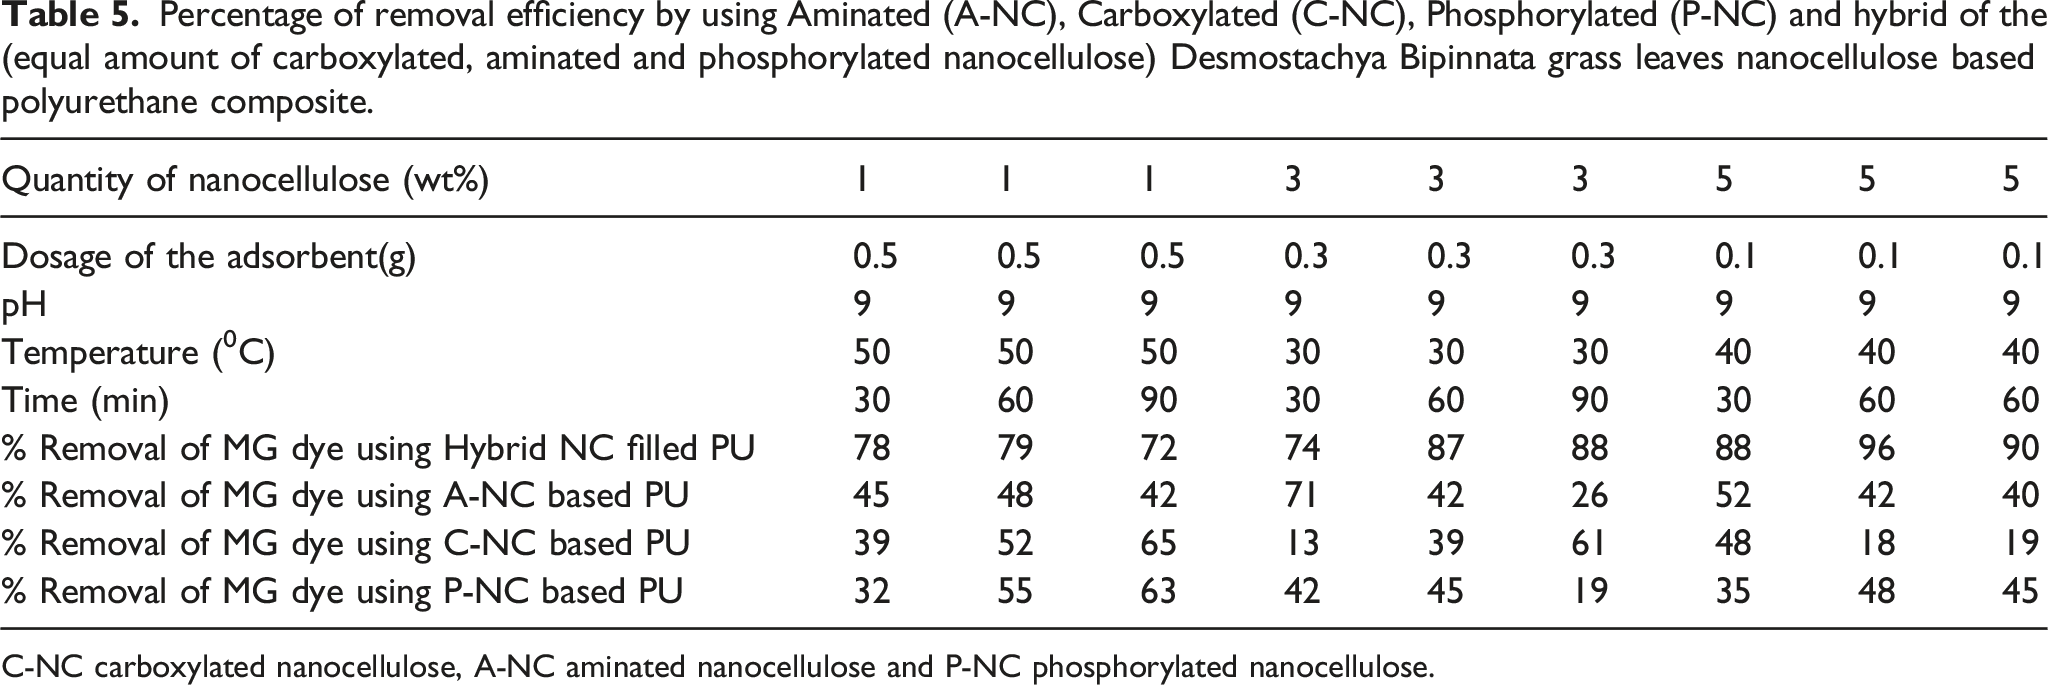
C-NC carboxylated nanocellulose, A-NC aminated nanocellulose and P-NC phosphorylated nanocellulose.
Analysis of Variance for SN ratios.
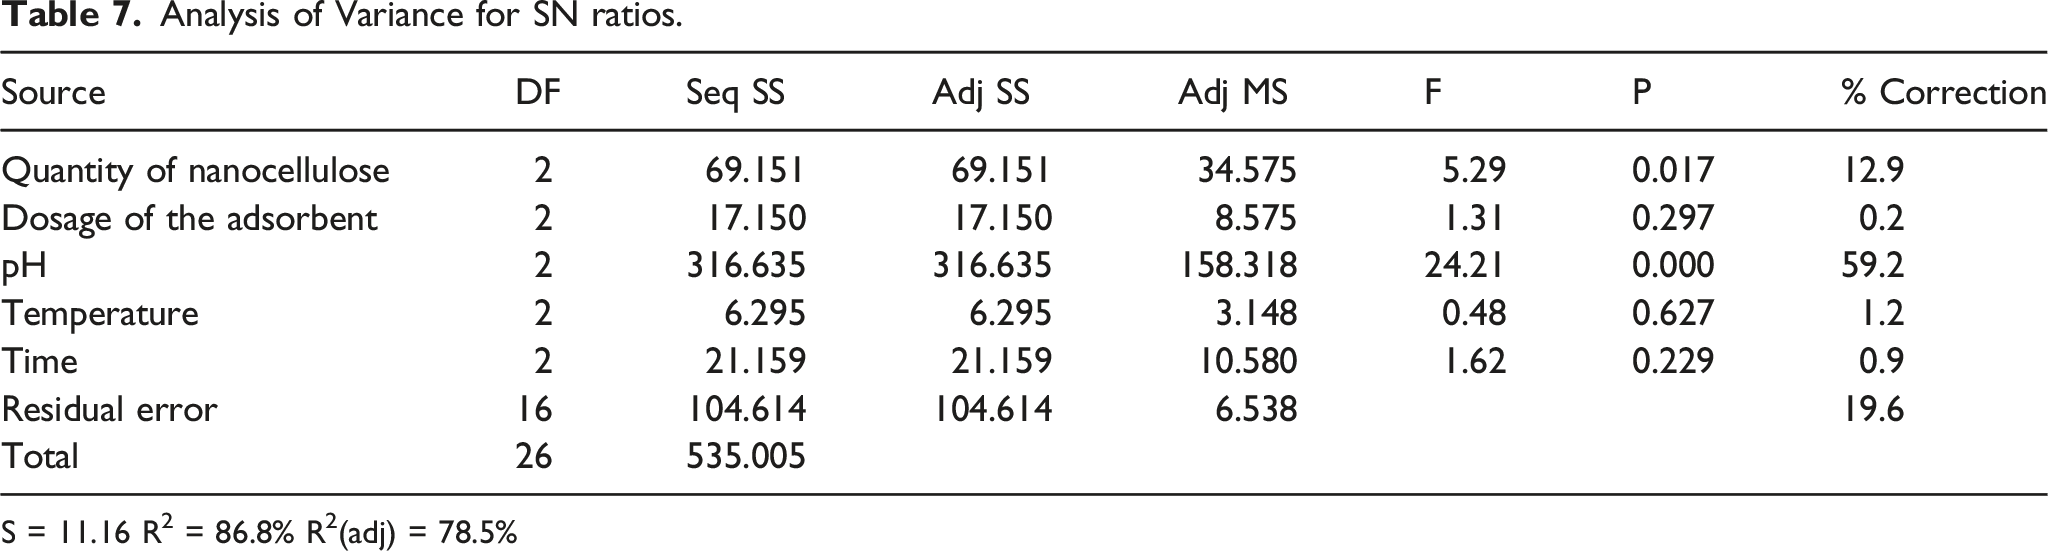
S = 11.16 R2 = 86.8% R2(adj) = 78.5%
Desorption and regeneration studies
To obtain the desorption efficiency, adsorption study was again conducted by using the optimum parameters such as pH (9), quantity of nanocellulose (5 wt %), dosage of the adsorbent(.5g), temperature (500C) and time (90 min). Adsorption was found to be 95%. Desorption was carefully carried out by using different solvents in different ratios.Desorption studies were performed in different solvents such as ethanol, methanol and solvent mix. Solvent A is Ethanol: water (80:20), solvent B is Methanol: water (80:20) and solvent C is Chloroform: methanol: water (1:1:1). Solvent C was found to be highly efficient as a desorbing agent with desorbing efficiency of 86%. With methanol-water, the percentage of desorption was found to be 77. Regeneration experiments were done to authenticate the reusability of the material for practical application in real systems.The regenerated adsorbent was washed carefully with distilled water and dried. Thee dried adsorbent was subsequently reused as an adsorbent for 5 cycles. It was observed that, the efficiency of the dye removal from the adsorbent was decreasing after each cycle.Adsorption percentage of adsorbent in the second cycle was 75, third cycle was 53 and fourth cycle was found to be 20. This may be attributed to the strong adherence of dye molecules to surface modified nanocellulose.The force of electrostatic attraction between the adsorbent surfaces and cationic MG dye also caused the efficiency in desorption First and second regeneration cycle is recommended, after which the adsorbent material has a lower adsorption performance. MG dye was successfully desorbed by modified nanocellulose based PU composite. A good percentage of recovery was observed (86%) with solvent mix (solvent C) suggesting the possible re use of composite material for two cycles.
Conclusions
Nanocellulose was isolated from Desmostachya Bipinnata grass leaves by chemical treatment followed by ultrasonic fibrillation. FTIR analysis on the nanocellulose samples revealed the removal of hemicellulose and lignin during the chemical process. Crystallinity index of the sample was above 60%. Biobased polyester polyols with moderate hydroxyl value were synthesized from Chaulmoogra seed oil and grape seed oil by epoxidation followed by acid catalyzed ring opening and trans esterification. The optimized procedure was found to be economical due to the use of lactic acid as chain extender, which is efficient and suitable for large scale polyol productions. New method of synthesis of porous PU with promising properties is expected to partially or fully replace petroleum based polyols in the PU industry. Prepared porous PU showed hydrolytic stability and alkali resistance due to the removal of glycerol from the starting triglyceride and by the introduction of ester group during the ring opening reaction. The mNC with the cellulose II crystal structure were successfully prepared. The prepared mNC were used as reinforcing nanofillers to enhance polyurethane (PU) properties. The mNC were evenly distributed in the PU matrix, leading to a significant enhancement of the thermal stability of the PU. The strategy developed here to produce nanocomposites could be utilized in the development of commercial packaging materials, flexible devices, biomaterials and combined with other polymers to obtain superior functional mNC-based composite nanomaterials. The introduction of mixture of carboxylated, aminated and phosphorylated nanocellulose into PU is expected adsorb multiple pollutants such as heavy metal ions and various dyes from textile effluents. The flexible PU-mNC composites provide design flexibility to designers in industry while making the reactors for effluent treatment. The MG dye removal efficiency by adsorption on modified nanocellulose based PU is affected by the quantity of nanocellulose, dose of the adsorbent, pH, temperature and time. The Taguchi L27 experimental design showed that the most effective factor was the pH-followed by the quantity of nanocellulose. It was found that the accuracy of the Taguchi method prediction was very good. Desorption studies performed in different solvent showed that the solvent mix was the best desorbing agent with an efficiency of about 86%. The efficiency of the adsorption process after adsorption -regeneration cycles were analyzed. After first cycle the desorption percentage was 86%, after second cycle, adsorption reached to 75%, third cycle 53% and the fourth cycle was 20%. From the results it was found that the bio-based mNC filled PU material is a promising material for adsorption of MG dye and the Taguchi method can be used to optimize the adsorption process parameters.
Footnotes
Authors' contributions
The first author Ms. Jyothi Vijayan has carried out the research work and prepared the draft. The second author Ms. Akshatha Chandrashekar has helped in testing of the materials. The third author Dr. Jineesh A.G. and fourth and fifth authors Dr. T. Niranjana Prabhu and Dr. Prashantha Kalappa have given the plan of work, supervised the work and discussed the interpretations and revised the manuscript.
Declaration of conflicting interests
The author(s) declared no potential conflicts of interest with respect to the research, authorship, and/or publication of this article.
Funding
The author(s) received no financial support for the research, authorship, and/or publication of this article.
Data availability
All the data required for this article have been provided in the article itself and any information further required will be provided.