
Abstract
This study concerns the identification and monitoring by acoustic emission (AE) of the different damage mechanisms leading to the final rupture of glass/epoxy laminates. The series of specimens are subjected to static and fatigue loading in order to follow the progression of the various damage mechanisms over time and to identify the most critical ones leading to material failure. The specimens are made with two stacking sequences ([0/90]s and [90/0]s) using the vacuum infusion process. Several parameters such as the energy, the amplitude, the rise-time, the counts and the duration are used for the AE technique in order to identify the damage mechanisms evolutions to classify the collected events (AE). The damage mechanisms recorded in each stacking sequence are identified and characterized using a multi-parametric analysis. The damage accumulated in the test specimen is first of all transverse cracking, followed by interlaminar decohesion and finally fiber breakage leading to total composite failure.
Keywords
Introduction
Composite materials are widely used in automotive, air and maritime transport, railways, buildings, aerospace, as well as sports and recreation. Composites structures are more interesting for their ability to reduce operating costs, because of their high resistance to fatigue and corrosion, their suppleness and especially their low mass.1–5 However, during their use, composite materials may suffer from a wide variety of damage: defects due to exposure to humidity, temperature cycling, mechanical fatigue or impact.6-10 To quantify and identify this damage, the application of non-destructive testing (NDT) is necessary. Assessing the degree of damage in composite materials is a major industrial issue. Within this context, different types of techniques and systems are implemented in order to check and identify the different damage mechanisms responsible for the degradation in performance and profitability of composite materials. Among these various methods of inspection and checking, acoustic emission (AE) analysis is of paramount importance, since it offers the possibility of carrying out an overall check and health monitoring of different types of material and structures.11–14 When the material is subjected to external loads (thermal, chemical or mechanical), different cracks will appear to cause the generation of many elastic waves with different characteristics. 15
The application of an external load and/or in the presence of an aggressive environment produces internal modifications such as crack development, local plastic deformation, corrosion and, in some cases, phase transformations. The acoustic emission technique can give us information on the internal behavior of the materials considered. This technique makes it possible to select signals that induce changes in the internal structure and composition of the material, and it ignores all the noise and minor defects that are not related to the mechanical applied loadings. The Acoustic emission technique is more advantageous than other inspection methods used, because it makes it possible to track the process of degradation in the properties and performances of structures as it occurs and in real time. It is a continuous monitoring technique that can also be used as a non-destructive inspection method. The most important factor in acoustic emission tests is the choice of the sensors used. The waves propagate in the structure and are detected by means of specific sensors that allow the conversion of the surface movements of the material into electrical signals. These signals are processed by suitable instrumentation in order to indicate and locate the sources of acoustic emission. Thereafter signal will be amplified and processed to generate the acoustic emission signal. Many researchers have used various classification and data processing methods based on a multi-parameter statistical analysis to classify the different signals acquired during the acoustic emission tests.16–19 With advancement and development in the field of computer data processing, the multi-parametric classification method has been used more and more in different applications, as it offers speed and robustness in the processing and classification of acoustic emission signals.
Mechanical behavior of a glass/epoxy composite of the stacking sequence [0/90] subjected to cyclic tensile tests is studied by Johnson et al. 20 They used a supervised classification method based on principal component analysis (PCA) by directly using the waveforms of the typical signals obtained from the damage mechanisms previously identified as input parameters. They were subsequently able to discriminate effects due to matrix cracking and delamination. Adolfsson et al. 21 identified different types of damage in a glass/epoxy laminate using the acoustic emission technique. Two types of laminates were adopted in order to promote the formation of certain types of damage during the tensile tests. The authors observed that for each damage mechanism, acoustic emission signals with different parameters (amplitude, duration and frequency content) could be identified. Godin et al. 22 used a classification method composed of a PCA coupled with the k-mean method to investigate damage progress in a unidirectional glass fiber under tensile tests. From the obtained results, four types of damage mechanism are observed with different acoustic signal characteristics. The first class (class A) group signals characterized by short duration, amplitudes that vary between 50 and 70 dB, a slow rise time and too low energy values. Then, they obtain a group of signals with high amplitude, quick rise time, short duration and high energy. According to the used multi-parametric analysis, they refer to the fiber/matrix debonding (class B). The fiber breaking (class C) is characterized by signals with an important energy and amplitudes (greater than 80 dB). Finally, (class D) is characterized by signals with a slow rise time, very long duration and higher energy.
El Guerjouma et al. 23 analyzed the damage initiation and progression in unidirectional polyester and glass/polyester specimens under uni-axial loading tests. Three types of samples were used: pure resin and unidirectional laminates oriented at 45° and 90°. All the specimens were selected to generate the corresponding damage modes. For specimens elaborated with pure resin, they generated signals corresponding to matrix cracking. For unidirectional samples oriented at 45° and 90°, in addition to matrix cracking, they generated 90° and 45° interlaminar decohesion. Subsequently, in order to separate these two types of signals, they implemented a neural network approach.
Ben Ameur et al. 24 carried out an experimental study to evaluate the mechanical properties and to determine the damage mechanisms of polymer reinforced with carbon and flax fibers during tensile tests. Different stacking sequences and have been considered. In order to identify the damage mechanisms occurring in the stacking sequences studied and to pursue their temporal evolution until failure, the clustering methodology based on the five temporal parameters was applied. Four classes were obtained for the different stacking sequences. According to the literature each class corresponds to a damage mechanism: matrix cracking (class A), fiber-matrix debonding (class B), delamination (class C) and fiber pull-out and fiber breakage (class D). Similar studies carried out by Suresh Kumar et al. 25 on hemp and basalt fibres reinforced polymer composite laminates.
Lin and Waas 26 reported study of a comprehensive experimental and computational low velocity impact (LVI) damage for T800s/3900-2B laminated composites with three stacking sequences. The stacking sequences studied are [0/45/0/90/0/- 45/0/45/0/-45]s, [45/0/-45/90]3s, and [45/- 45/0/45/-45/90/45/-45/45/- 45]s. For each layup, three impact energy levels have been examined. After the LVI tests, the induced damage has been characterized with ultrasound C-scanning and high-resolution micro computed tomography (micro-CT). Computational predictions have been conducted using the enhanced Schapery Theory (EST) model. The numerical results are accurate in terms of the impact load responses and induced damage. The physics of the LVI damage of the samples with various stacking sequences and as a function of impact energy has been resolved using the EST model. The damage predicted by the EST model and the revealed damage mechanisms contribute to understanding the physics of the LVI behavior of laminated composites.
The focus of the present paper is to study the damage initiation and progression in glass/epoxy composite laminates. The test specimens are subjected to static and cyclic tensile loading. Damage initiation and propagation during experimental tests has been monitored using the acoustic emission technique. The classification of the different signals collected during the fatigue tests has been ensured using a multi-parametric analysis
Material preparation
The composites studied during this work are implemented using laminated fibers with stacking sequences of [0/90]s and [90/0]s. The studied composites have been manufactured using the vacuum molding method. The different layers are positioned manually according to the desired sequence. The layers are impregnated with resin at room temperature using a roller or a brush. The whole is placed in a bag under vacuum with a pressure of 0.7 bars for 10 h. The resin will be drained to the end of the mold and drawn to the vacuum channels. Plates of different dimensions were cured at room temperature with pressure using vacuum molding process, and then post-cured in an oven to accelerate the polymerization and reduce the residual stress. The plates are cut according to the geometry of the tested specimens using a diamond disc saw. The manufacture of these materials is carried out in the laboratory (LAUM). The dosage used is 50% of the rate of 300 g/m2 density glass fibers and 50% of the rate of SR1500 type epoxy resin.
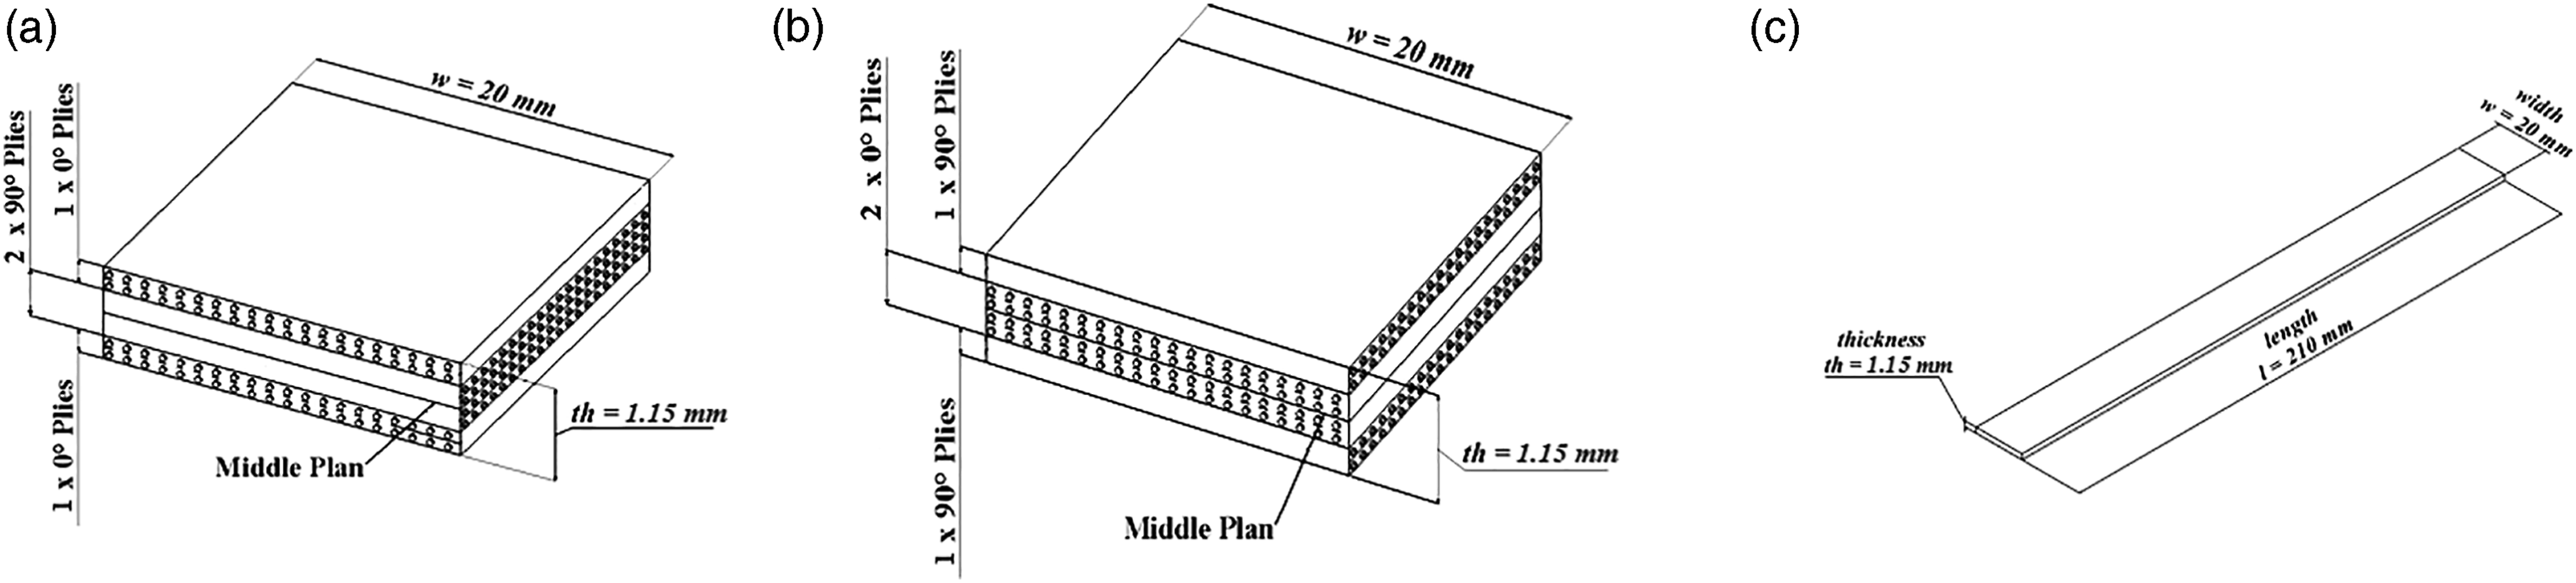
The vacuum technique (or “bag”) allows the implementation of better quality of composites material than with contact molding, the fiber content is higher since the excess resin is sucked up by the vacuum created during vacuuming. The geometry of the tensile specimen is given in Figure 1. The mechanical characteristics of the glass fibers and of the epoxy resin used during this study are presented in Tables 1 and 2. The tested specimens were manufactured according to the following dimensions: L = 210 mm, th = 1.15 mm and w = 20 mm where L, w and th are the length, width and thickness respectively (Figure 1(c)). Two type of laminate: (a) [0/90]s, (b) [90/0]s (in mm), (c) Specimen size (in mm). Mechanical properties of fiber.
10
Mechanical properties of resin.
10


Experimental tests
Static and fatigue tensile tests
Static and fatigue tests are carried out on a universal hydraulic test machine (INSTRON 8516), with a capacity of 100 kN (Figure 2). The tests were performed at room temperature with a displacement rate of 1 mm.min−1. The strain in the tensile direction was measured by mean of an extensometer with a gauge length of 50 mm. The applied load is measured using a load cell. Piloting and acquisition are done by computer. Three to five specimens were tested for each stacking sequence in order to check the reproducibility. Fatigue tests were performed to study the effects of cycling and the applied loading levels on the behavior of the glass/epoxy composites. One to three specimens test were carried out under load control fatigue according to the standard test method ASTM D3039/D3039M. The following fatigue parameters were employed during Fatigue tests: sinusoidal waveform was carried out at a constant frequency rate of 10 Hz, stress ratio Experimental procedure for static and fatigue tests.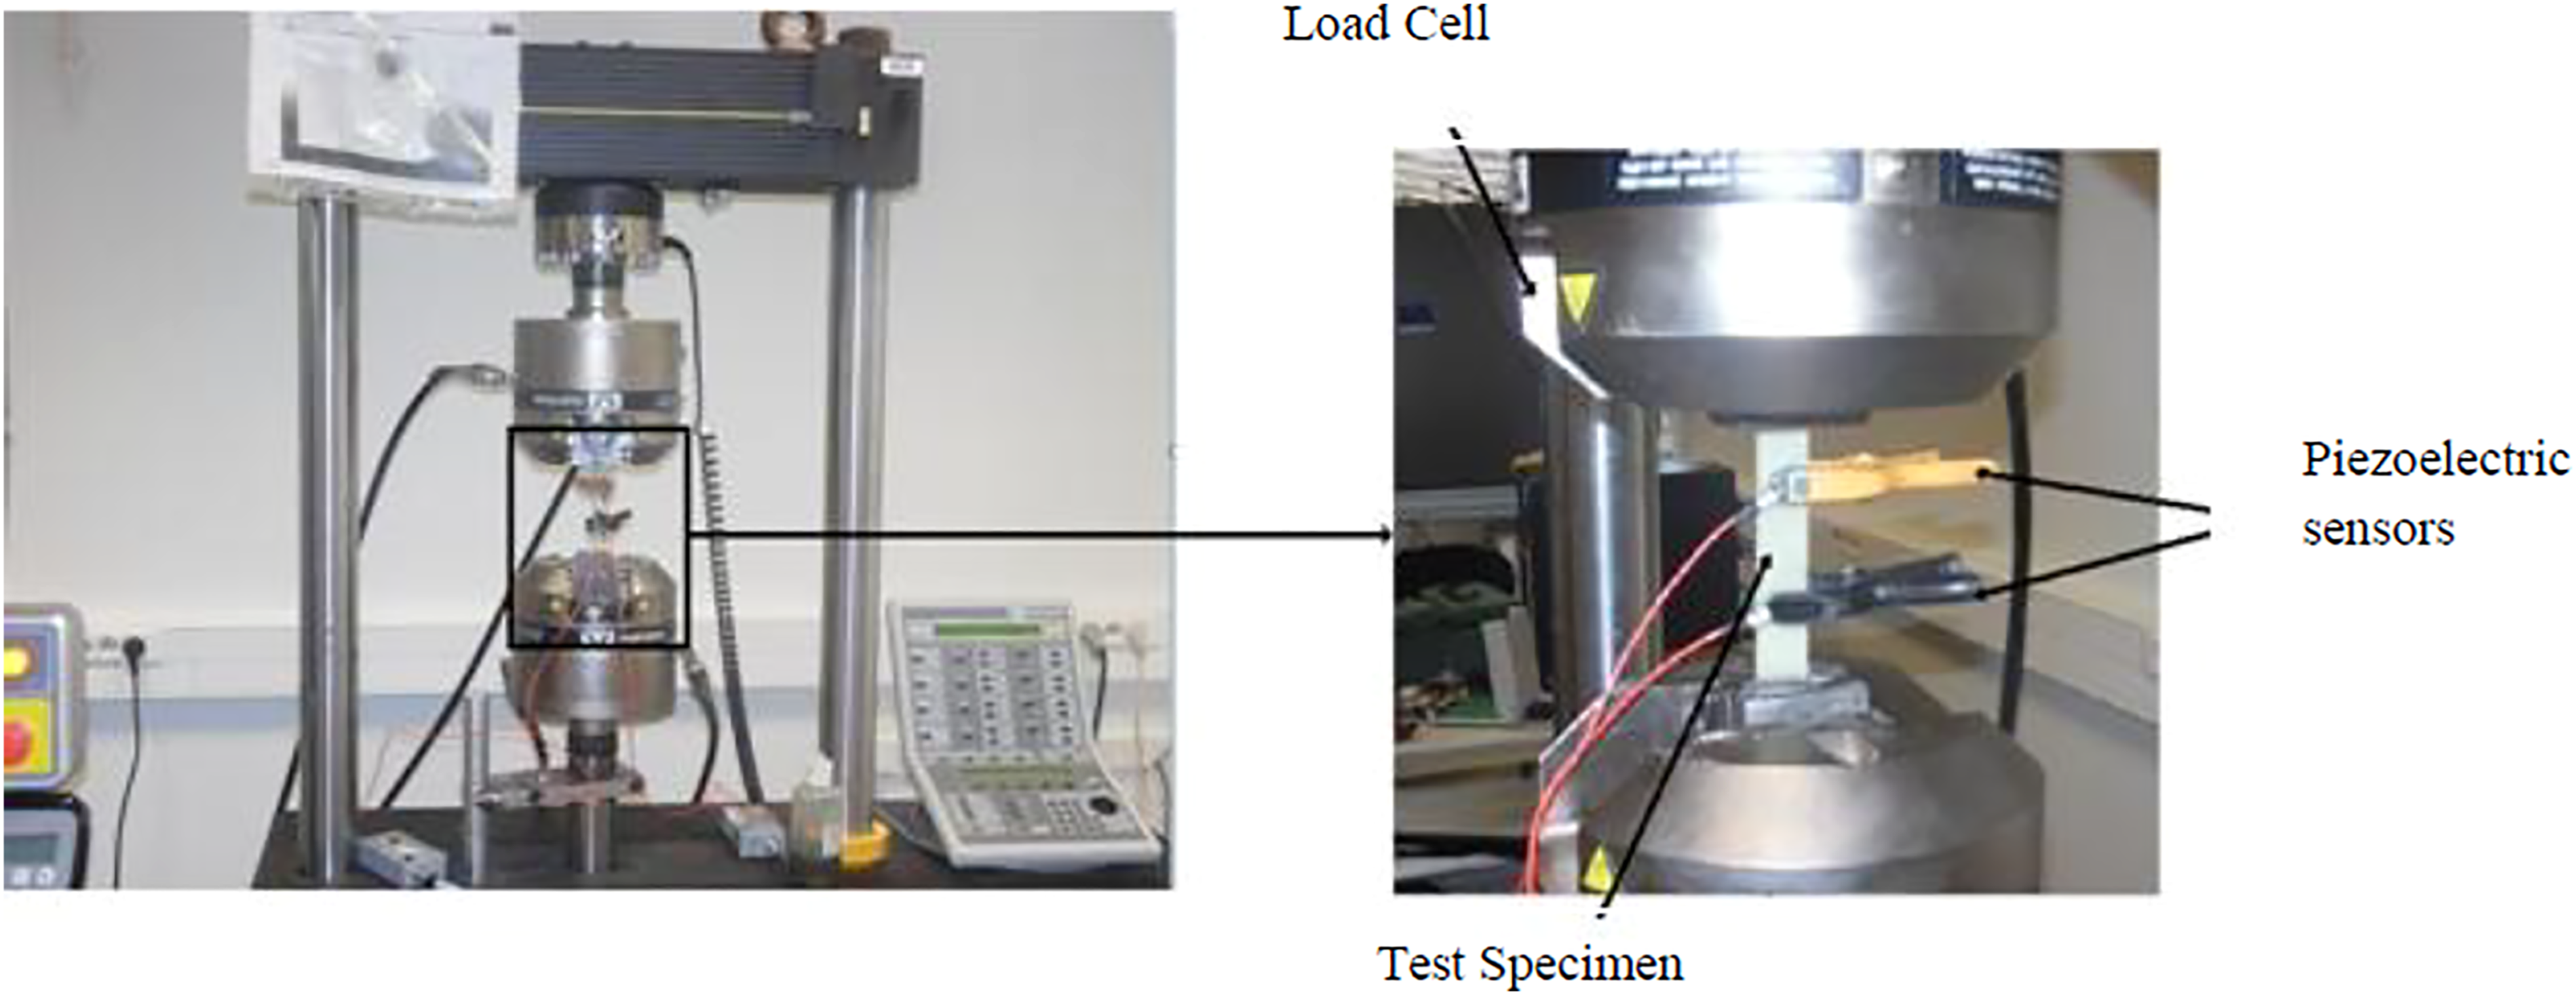
Acoustic Emission AE
The evolution of the damage propagation during experimental tests is monitored using the acoustic emission method with an acquisition system comprising six channels at a sampling frequency with a frequency range of 5 MHz, two sensors with two channels are used for each present tests. The signals are picked up and recorded by means of a piezoelectric differential sensor (Micro-80), with a bandwidth of 100 kHz–1 MHz and 10 mm in diameter, positioned on the tested materials with silicone grease allowing the location of the various damage sources. These signals are then amplified by a preamplifier with a gain of 40 dB and then converted by the PCI card to extract the AE parameters. The data acquired during the tests are transmitted and displayed in real time on a microcomputer. The acquisition threshold is determined before the start of each test using the procedure of Pencil Lead Breaking, which is explained in Ref. 27: Using a mechanical pencil, the lead is pressed firmly against the structure under investigation until the lead breaks. During pressure application with the lead, the surface of the structure gets deformed. At the moment of lead breakage, the accumulated stress is suddenly released, which causes a microscopic displacement of the surface and causes an acoustic wave that propagates into the structure. This test allows us to estimate the propagation velocity and to detect the start and the end times of AE signals. In fatigue tests, the amplitude of the acquisition threshold was determined using the Pencil Lead Breaking (PLB) procedure27,28 and was equal to 45 dB in order to filter the AE signals coming from external sources (noise). The launching of the tests and the acquisition are ensured using acquisition software (AEWIN MISTRAS), however data processing software (NOESIS and MATLAB) is used.
29
Five temporal parameters of the acoustic signals were selected for the classification of the data sets (Figure 3). After multiple initial trials, these parameters have proved to allow a good repeatability of the data clustering. The K-mean algorithm28,30 was used for the unsupervised pattern recognition. This algorithm aims to separate a set of n events into an optimal number of k clusters in which each event belongs to the cluster with the nearest mean. First, the data sets were normalized by the following transformation Experimental setup of acoustic emission method.


Results and discussion
Static results
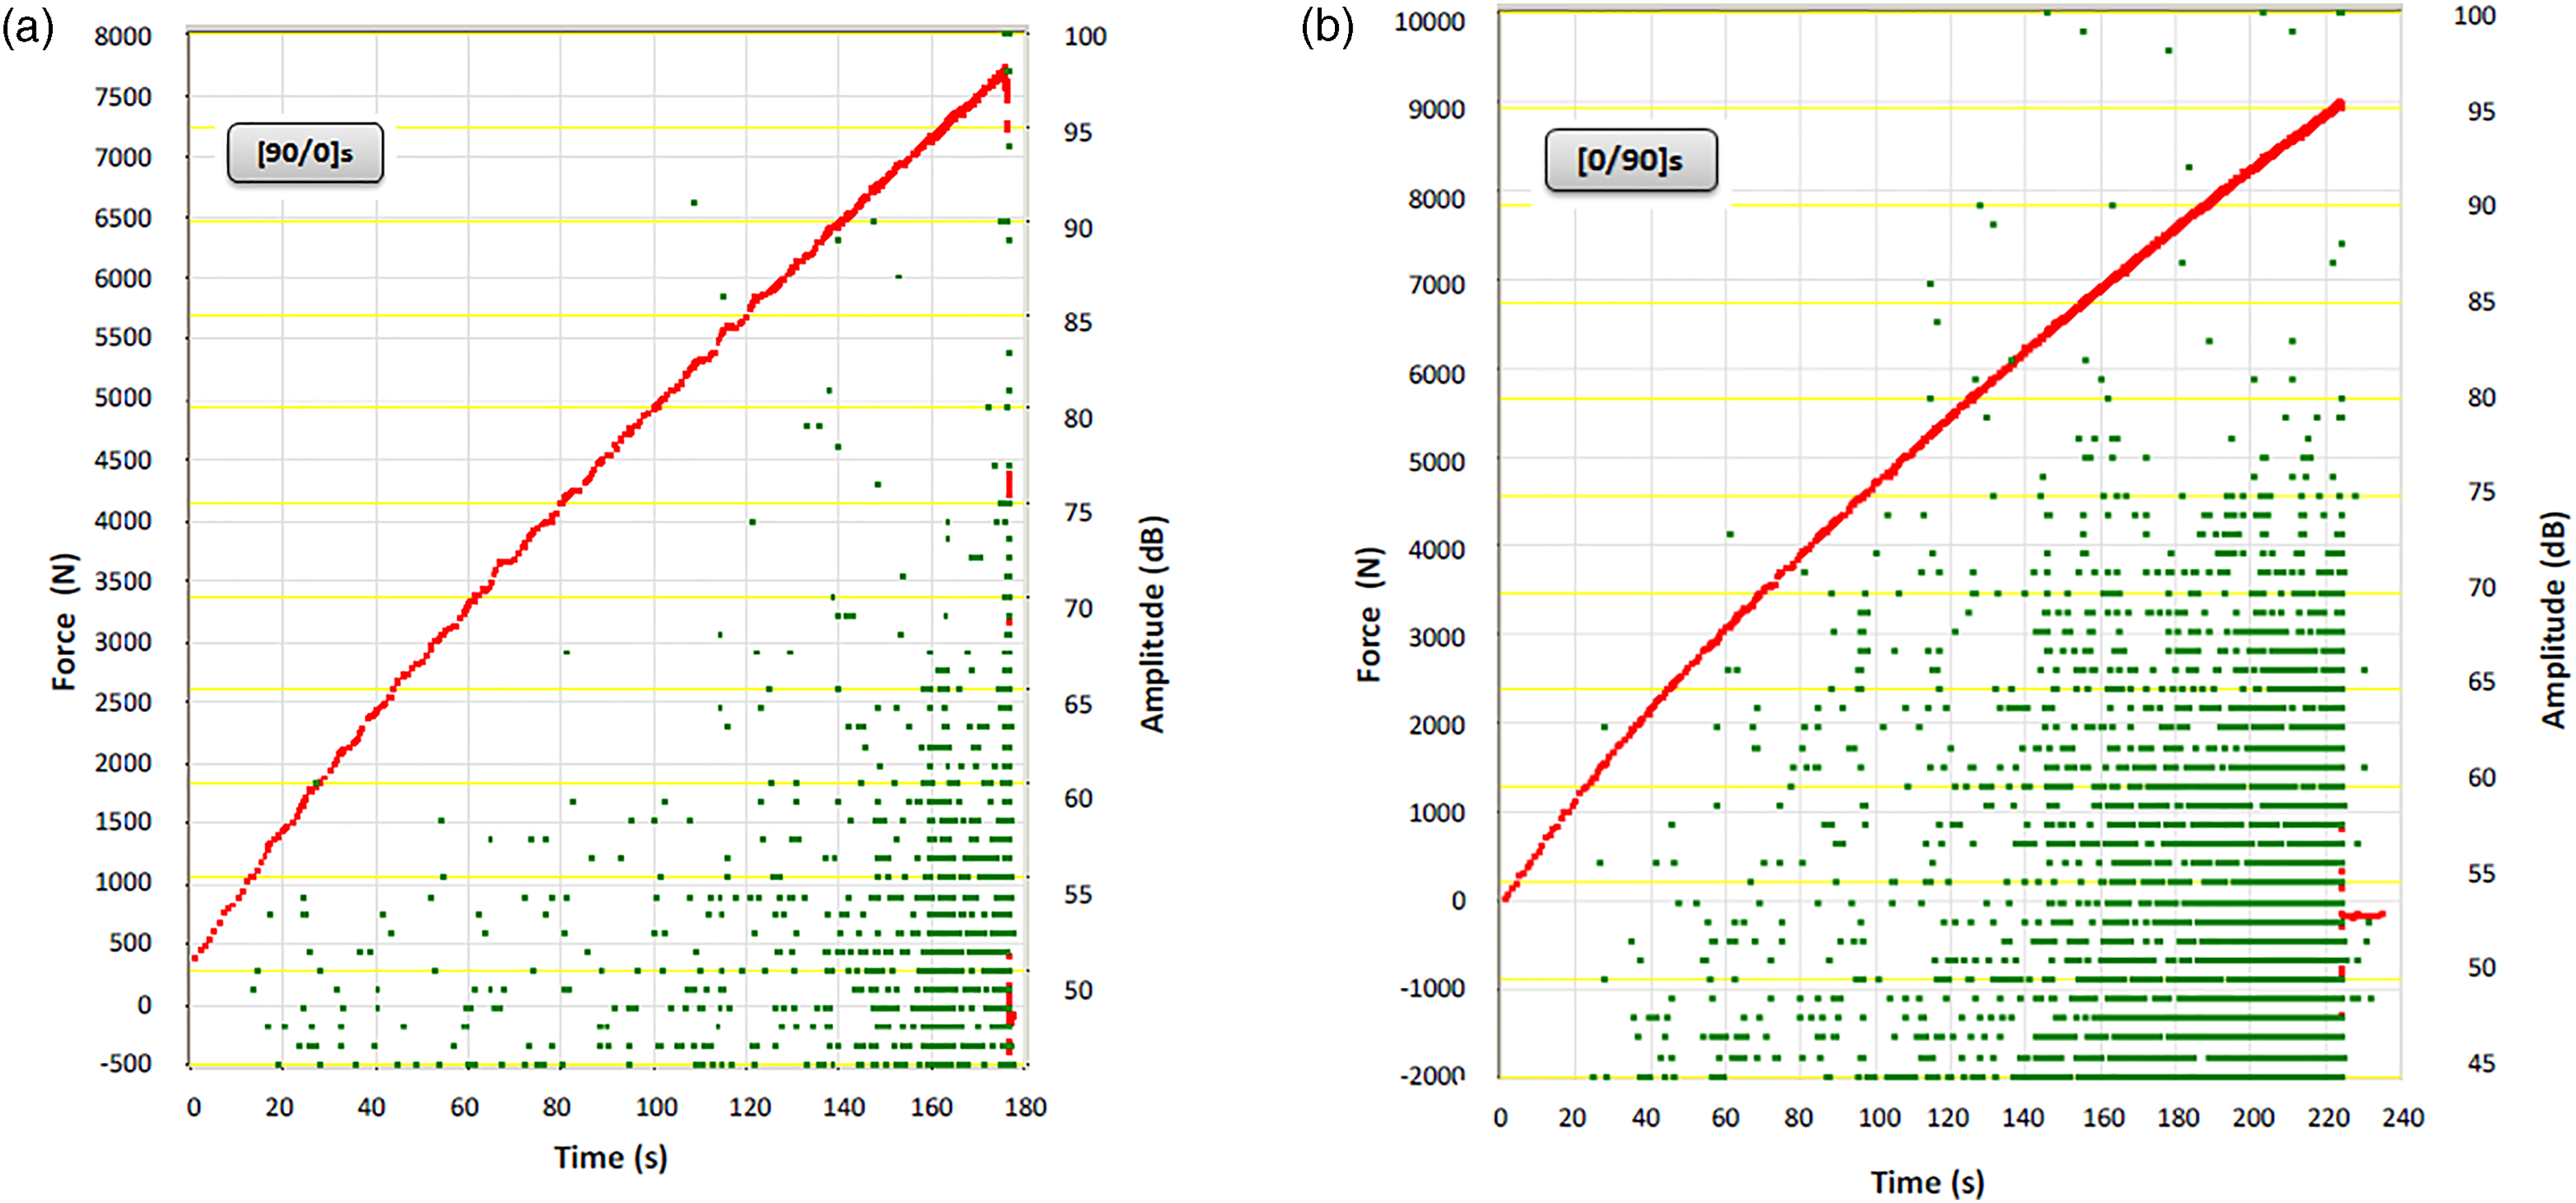
Applied load and acoustic activity
Stress-Strain curves are shown in Figure 4, the strength on 3 to 5 tested samples for the [0/90]s composites is Stress strain curves for the two laminates: (a) [90/0]s and (b) [0/90]s. Applied load and acoustic activity during static tests: (a) [90/0]s and (b) [0/90]s. RDB factor versus number of classes for the two laminates. Static properties obtained.

Identification of damage mechanisms by acoustic emission
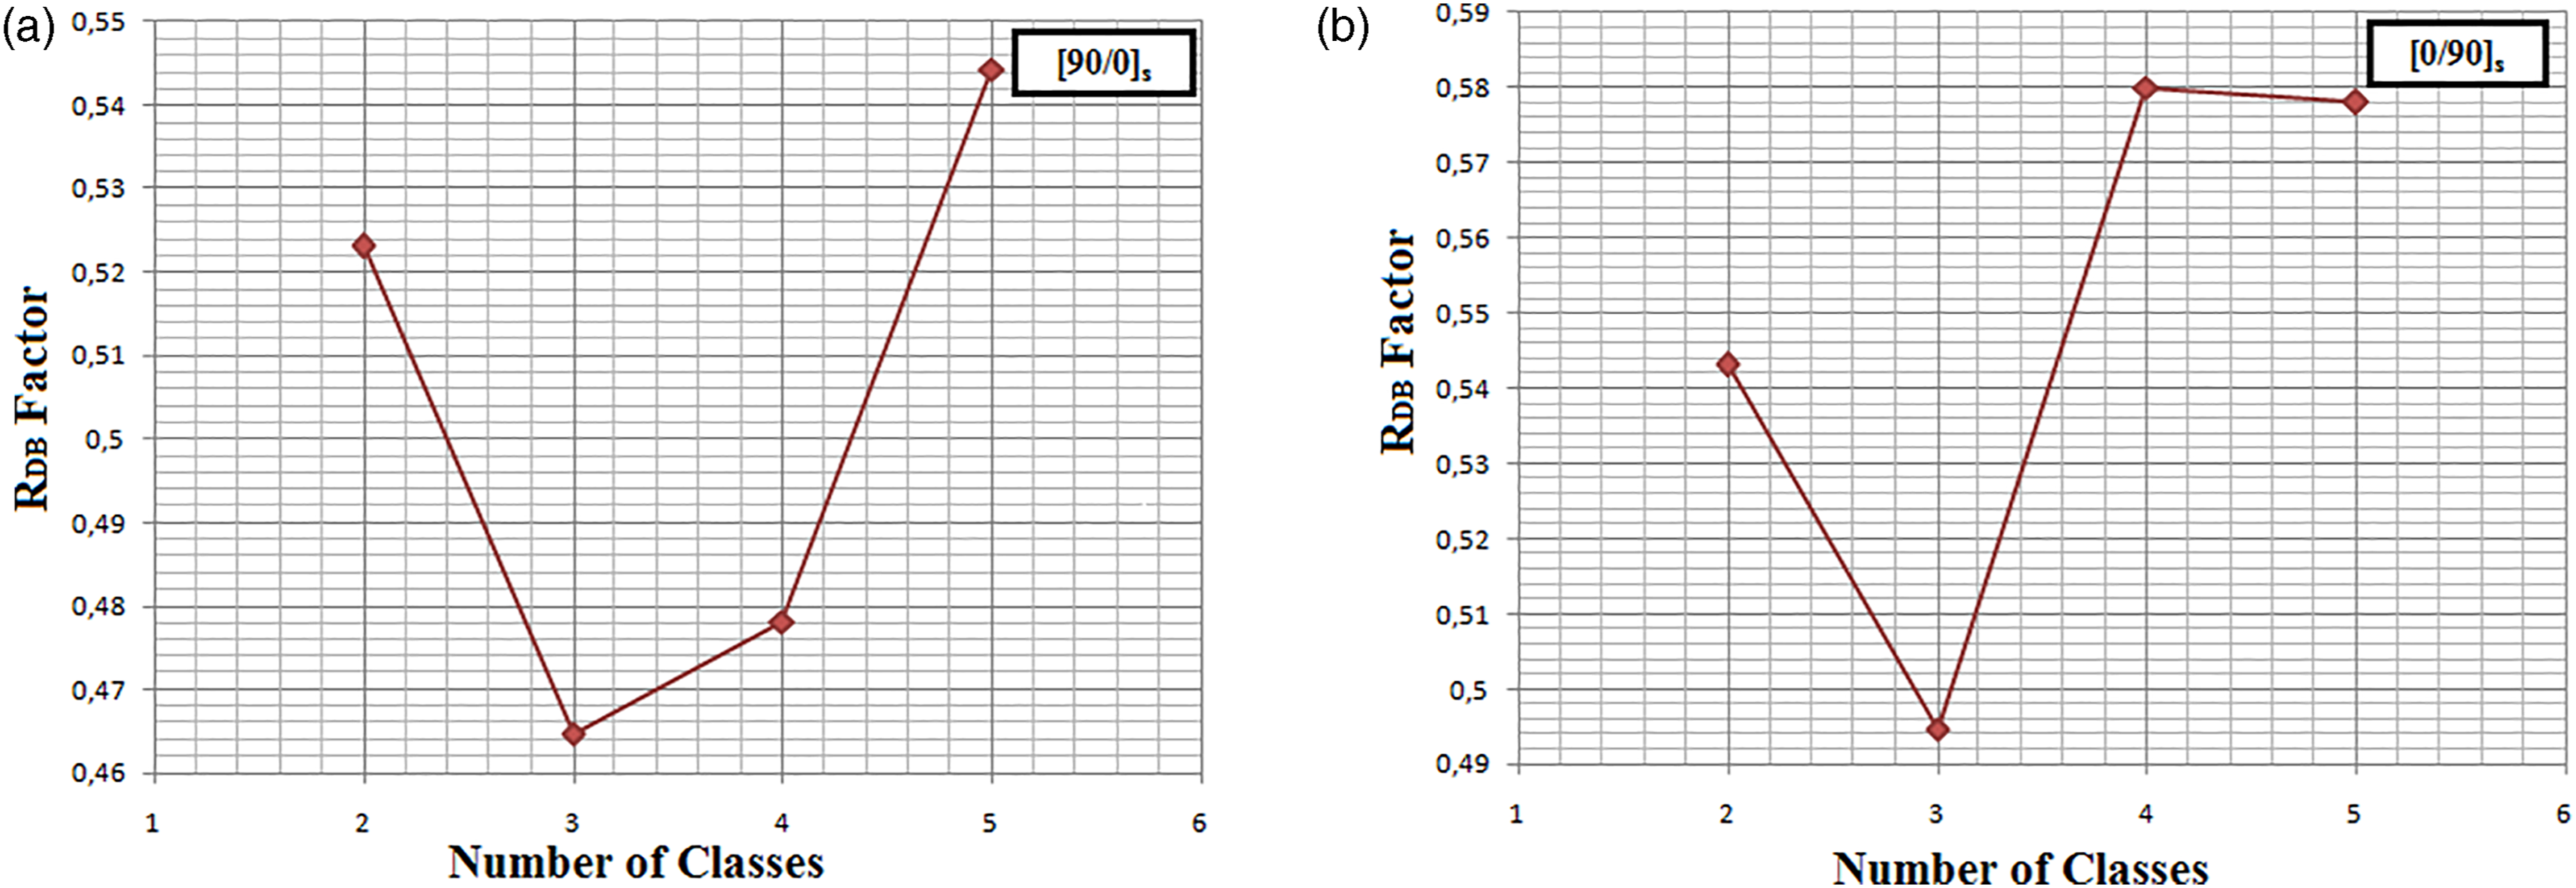
Three classes are observed for the tested specimens as shown in Figure 6, corresponding to the three damage modes as explained in previous paragraph Acoustic Emission AE, for the two studies specimen [90/0]s and [0/90]s by applying Davies and Bouldin factor (RDB). The RDB31-33 is calculated using the equation (2). This factor is a measure of the quality of a partition of a set of data in automatic classification. It is the average of the maximum ratio between the distance from a point to the center of its group and the distance between two group centers.
Shape of acoustic emission signals for each damage mechanism.

Principal Component Analysis (Figure 7) is performed to visualize results of the classification of the signals recorded during static tests in a two-dimensional subspace. The PCA is a multivariate technique called interdependence, because there is no dependent or independent variable identified beforehand. Another important feature of the PCA is that there is no null hypothesis to test or verify. According to the PCA analysis performed on the obtained results, it’s remarkable that most signals are concentrated, and highlights the presence of three classes of damage for the two laminates [0/90]s and [90/0]s. Principal component analysis results for acoustic emission signals clustered in monotonic tests: (a) [90/0]s, (b) [0/90]s.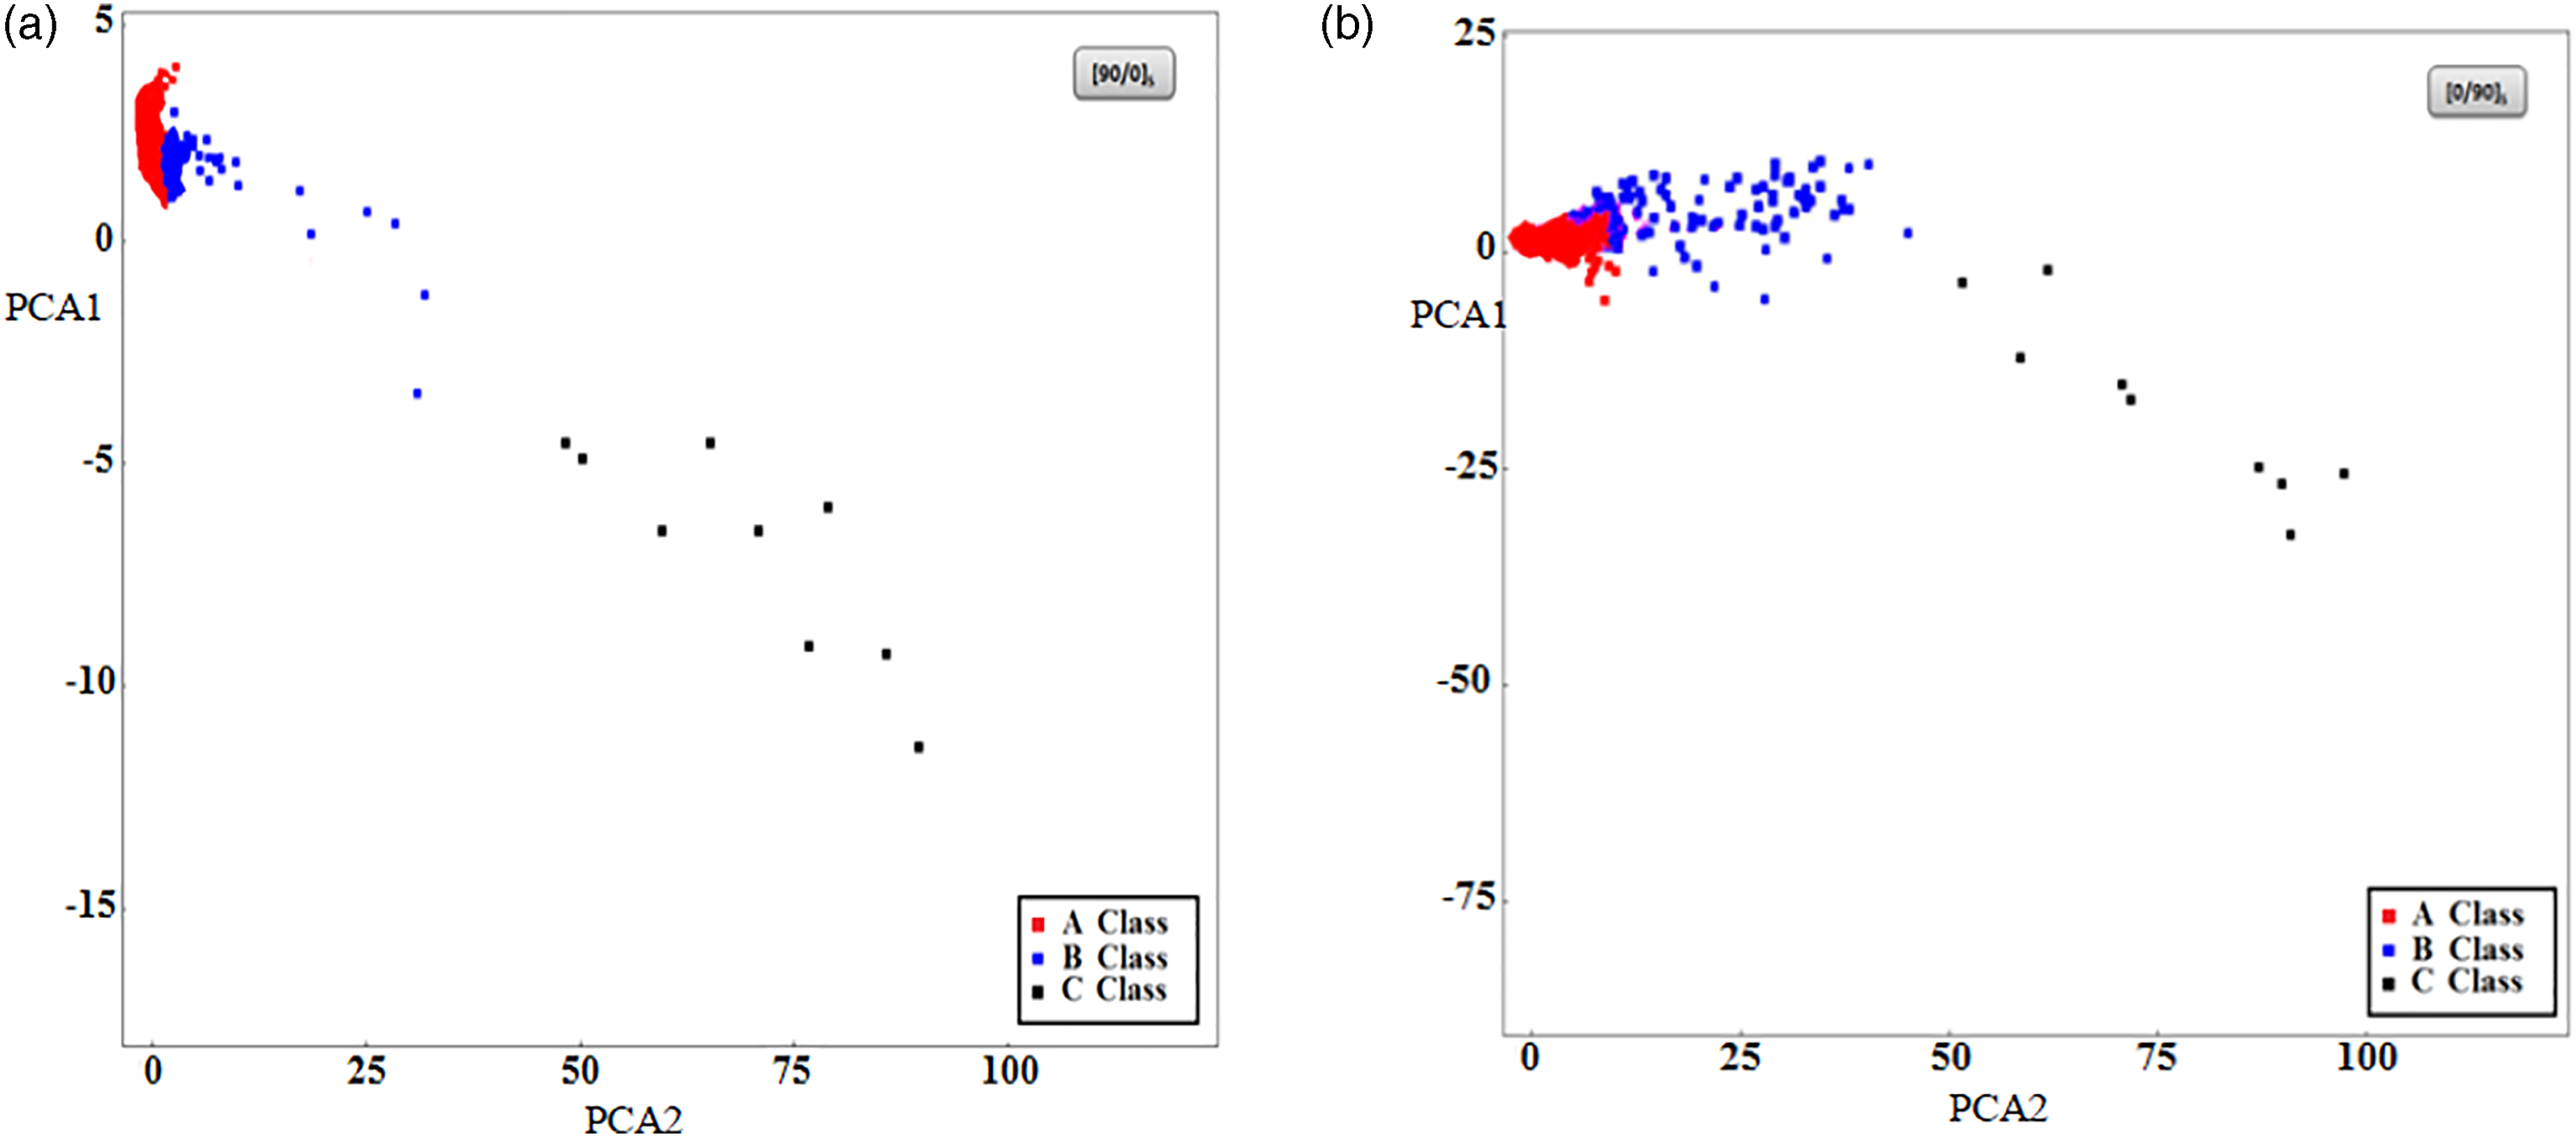
Amplitude versus time during static tests
In the Figure 8 the amplitude is proposed versus time distribution for the two laminates [0/90]s and [90/0]s. From the AE signals recorded during the static tests for the two types of laminates studied during this series of tests with a significant number of tested specimens, classification makes it possible to identify three types of signals: matrix cracking (class A), fiber/matrix debonding (class B) and fiber breakage (class C). Amplitude versus time in static tests: (a) [90/0]s, (b) [0/90]s.
The first class corresponding to matrix microfissuration, it includes signals with relatively long duration, amplitudes that vary between 45 and 65 dB, slow rise time and relatively low energy. However, the second class (B) which refers to the fiber/matrix debonding gathers signals with amplitudes that vary between 60 and 80 dB, higher energy and relatively short rise time. The last class (class C) includes signal with a very short duration, significant amplitude (above 90 dB), relatively short rise time, and an important energy. These signals come from the fracture of the fibers.
Time dependency of the damage mechanisms identified during static tests
After having identified the different modes of damage, the chronology of the appearance of the different acoustic signals for the various damage mechanisms is then obtained.
According to Figure 9 Time dependency of the damage mechanisms identified during static tests: (a) [90/0]s, (b) [0/90]s.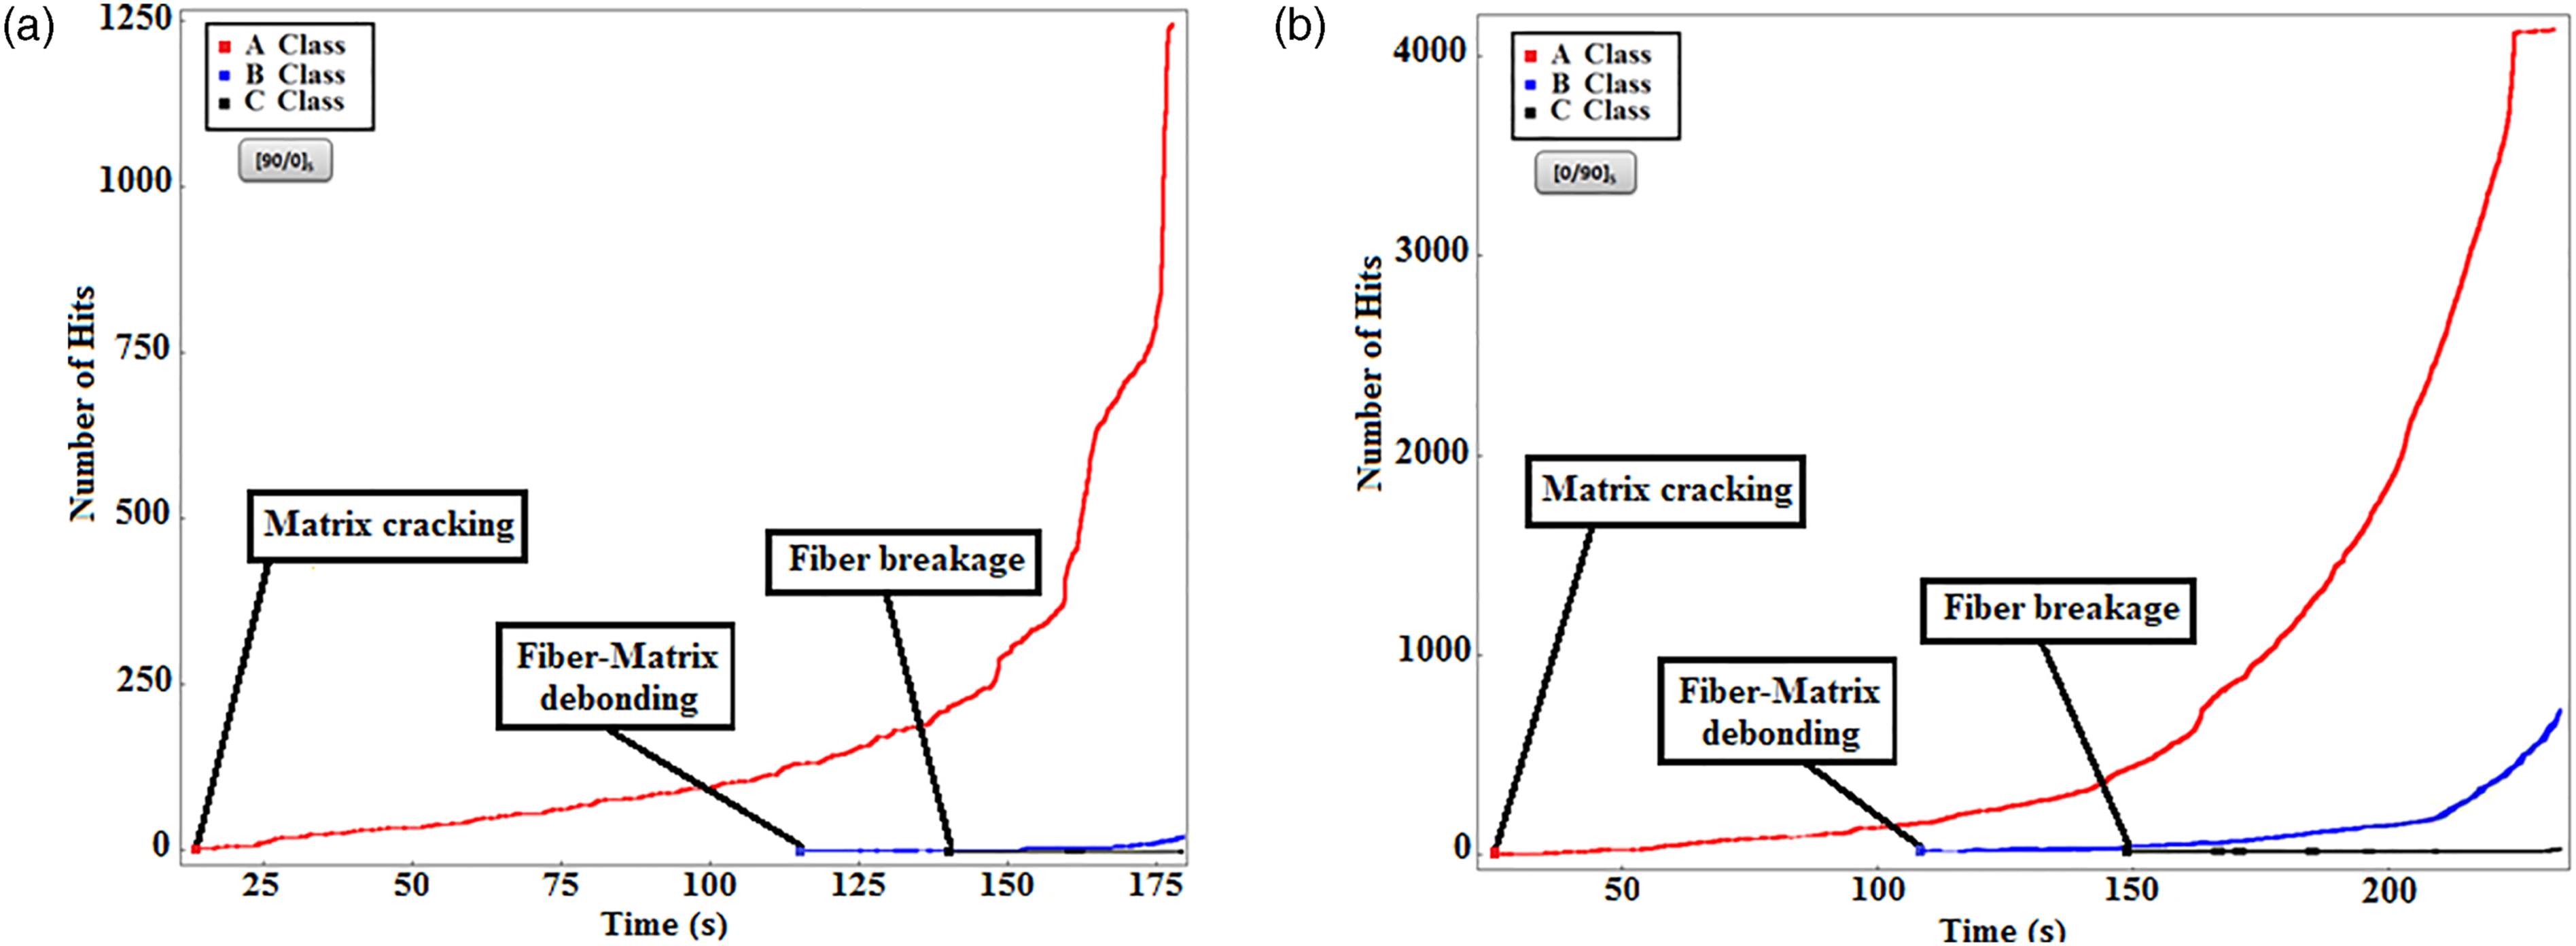
Fatigue tests
Amplitude versus number of cycles during fatigue tests
Figure 10 shows that most of the acoustic events for each class are concentrated. Figure 11 shows the distribution of the amplitudes of the various signals collected during fatigue tests. The same as in static tests, three damage mechanisms are observed (matrix cracking (class A), fiber-matrix debonding (class B) and fiber breaking (class C)). PCA results of the AE signals clustering in fatigue tests: (a) [90/0]s, (b) [0/90]s. PCA: Principal component analysis. Amplitude versus time in fatigue tests: (a) [90/0]s, (b) [0/90]s.

Degradation of the mechanical properties of the tested specimens during fatigue tests takes place according to four stages: Stage I: During this phase a low acoustic activity is observed. The amplitude of the signals recorded during this phase is in the range of 45–75 dB. The imposed load increases during this phase to reach the applied mean stress. Stage II: This phase is characterized by the presence of the three damage mechanisms: matrix cracking, fiber-matrix debonding and fiber breakage. The initiation and propagation of the matrix cracking is the most observed damage mechanism during this stage. The amplitude of the signals recorded during this phase is in the range of 45–100 dB. Stage III: The majority of acoustic signals collected during this stage represent the matrix cracking and fiber/matrix debonding. Generally the amplitude of these signals is in the range of 45–80 dB. Stage IV: Very significant and energetic acoustic activity appears in this phase. Also, during this phase we are witnessing the total failure of the tested specimen caused by the multiplication of several damage mechanisms leading to the appearance of the fiber breakage.
Figure 12 shows the evolution of the maximum load (F
max
) to (F
0max
) the maximum load in the first cycle versus to the number of cycles. The stiffness of the tested specimens decreases gradually, this degradation proceeds quickly when the number of the applied cycles is too high. The final failure of the tested material is observed after 4300 cycles for the [90/0]s composite laminate and after 5400 cycles for the [0/90]s specimen. Evolution in stiffness with number of cycles.
Time dependency of the damage mechanisms identified during fatigue tests
The time dependency of the damage mechanisms identified during fatigue test is presented in Figure 13 for the two laminates [0/90]s and [90/0]s . This result shows that the matrix cracking (A class) is the most important damage mechanism as it begins from the start of the test and involves much more numerous events. The second type of damage is fiber/matrix debonding (B class) appears after the matrix cracking (A class) followed by fibers breaking (C class). At the end of the experimental tests, a few signals are appeared and characterized by high amplitudes (above 90 dB). These signals are caused by the multiplication of the three damage modes. Time dependency of the damage modes in fatigue tests: (a) [90/0]s, (b) [0/90]s.
For laminate [0/90]s the events amplitude is higher and the number of hits (number of cumulative AE signals is about 18 103) is generally more than those observed in laminate [90/0]s (number of cumulative AE signals is about 12.5 103).
Micrographs and failure profile produced on scanning electron microscopes (SEM) are presented in the Figure 14: matrix cracking, “class A” (label 1), fiber/matrix debonding, “class B” (label 2) and fiber breakage, “class C” (label 3).” Scanning electron microscopes breakage profiles.
Conclusions
The results obtained make it possible to demonstrate the effect of stacking sequence and of the ply orientations on the static and fatigue behavior of glass/epoxy composites. The composite [0/90]s presents the highest static properties, and has a significant and longer lifespan during fatigue tests. Tests carried out were monitored by the AE technique in order to identify the damage mechanisms evolutions. This identification was made with an unsupervised clustering technique. The recorded events were classified with the kmeans algorithm based on temporal classification parameters to identify the main acoustic signatures of the predominant type of damage modes (the matrix cracking, the fiber/matrix debonding and the fiber breakage) in the composites studied. It is observed that the acoustic activities recorded during experimental tests are much more intense in the [0/90]s composites laminates with a higher cumulative number of hits. The study of the order of the apparition of the different modes of damage during static and fatigue tests shows that matrix micro-cracking is the most observed damage mechanism; it appears at the beginning of the experimental tests and progresses progressively. Fiber/matrix decohesion present the second damage mechanism which occurs causing fiber breakage at the end of the experimental tests.
Footnotes
Declaration of conflicting interests
The author(s) declared no potential conflicts of interest with respect to the research, authorship, and/or publication of this article.
Funding
The author(s) received no financial support for the research, authorship, and/or publication of this article.