
Abstract
Among the failure modes of composite materials, delamination is the most striking one. It may result in the reduction of stiffness and long-term performance of composite materials. The initiation stage is very crucial in delamination. This is because initiation stage requires higher amount of force, and after this stage, there is a stable propagation of delamination that requires little force and causes the failure of the structure. Initiation of delamination consists of two main stages including minor initiation and major initiation. These two stages are vital stages in the delamination process. Understanding the delamination behavior and their internal micro events in these stages may lead to better design and result in enhanced strength against crack initiation. This article proposes a combined method to discriminate various fracture mechanisms in the initiation of delamination. The combination of sentry function analysis and frequency analysis of acoustic emission (AE) waveforms are used to analyze crack initiation and to discriminate its internal micro failures during mode I delamination. Discrimination process is derived from the power spectrum density of AE waveform in distinct frequency intervals. Scanning electron microscopy (SEM) observation was used to determine different fracture mechanisms and associate these observed fracture mechanisms and their equivalent AE signal frequency range. It is shown that this combined method is a powerful device to study the behavior of the initiation of delamination.
Introduction
Recently, glass fiber-reinforced plastics (GFRP) are widely used in many applications, mostly in aerospace industry. Remarkable properties, such as high specific modulus of elasticity, lightweight, good corrosion resistance, and so on are the main reasons for these increasing demands. 1 In contrast, several damage mechanisms may degrade the utilization of composite materials. Among these damages, delamination is regarded as one of the most significant failure modes. Delamination may reduce the stiffness and long-term performance of the composite material. 2 Consequently, its characterization is an essential task. Mode I interlaminar fracture can be regarded as the most vital mode. This is because the energy required for initiation of delamination is lower than that of the shearing mode. Due to importance of the double cantilever beam (DCB), which simulates mode I delamination, there are several developed standards for DCB test. 3 –5 Evaluation of microscopic failures, such as matrix failure, fiber–matrix interface damage, and fiber failure during mode I delamination, is difficult. These failures are common in delamination. 5,6 AE technique, as an inherent online nondestructive method, is a robust device for recognition and characterization of various damage mechanisms in laminated composite materials.
AE events occur in the material when energy inside the material is suddenly released. 7 It is more likely that the source of AE is from defects present in the material rather than unflawed material. The advantages of testing and analyzing composites with the AE method are real time data, high sensitivity, and sensitivity to any process or mechanism that generates AE signals. In GFRP, AE signals commonly initiate from several sources such as matrix cracking, debonding, fiber breakage, and so on. Therefore, these signals have useful information about damage mechanisms. Nevertheless, evaluating the signals and consequently discriminating the damage mechanisms is a major challenge of the AE technique. 7,8
With the purpose of finding the correlation between AE characteristic and failure mechanisms, several investigations have been carried out using different AE parameters such as amplitude, energy, and counts. 9 –11 In addition, some researchers used multiparameter investigations for better discrimination of AE events. 12,13
Most of the above-mentioned studies, which are descriptor-based AE techniques, often focus on time features, which are not completely appropriate to make a distinction between AE waveforms. Frequency domain was used by some researchers to discriminate different damages. 14 –16 Some conclusions in the frequency domain are derived from the assumption that each failure mechanism has one unique waveform that is related with the distinctive peak frequency. The results of these studies show that frequency domain is a capable device for characterization of failure mechanisms in composite materials. Thus, waveform processing of AE signals using frequency analysis seems to be a very capable signal processing technique to separate fracture mechanisms.
Many studies have been carried out on initiation and propagation of delamination phenomenon.
17
–19
In the previous works,
20,21
sentry function, which is a novel approach introduced by Minak and Zucchelli,
22
–25
was used to detect the initiation of delamination. The sentry function is expressed in the logarithm form of the ratio between mechanical and acoustic energies (equation (1)):
where Es(x) is the strain energy, Ea(x) is the AE events energy, and x is the displacement.
This article discriminate various fracture mechanisms, from AE waveforms, during the initiation of delamination in glass/epoxy composite materials with three different layups. For the discrimination process, investigation of initiation of mode I delamination was simulated with a DCB test in opening mode and was carried out by applying the combination of sentry function analysis and frequency analysis using the power spectrum. Although there are several studies about evaluating critical energy for initiation of delamination and damage characterization occurred during delamination, but to the authors’ knowledge there have been almost no reports of acoustic emission associated with the deeper analysis of damage mechanisms in initiation stage of delamination. Therefore, introduced method in this work was applied to determine various damage mechanisms in minor and major initiation stages of delamination. Scanning electron microscopy (SEM) was also used to determine the different fracture mechanisms and associate these observed fracture mechanisms and their equivalent AE signal frequency range.
Experimental procedure
Description of materials
The composite specimens used in this study are thermoset epoxy resin reinforced with e-glass fibers. Rectangular plates of glass fiber/epoxy composite were manufactured using a hand layup procedure, which was followed by a 12-h vacuum bagged setting. All the specimens have similar layups, except in their mid-plane interface that were 0/0 and woven/woven. A sample SEM observation of the unidirectional and woven specimens is shown in Figure 1.
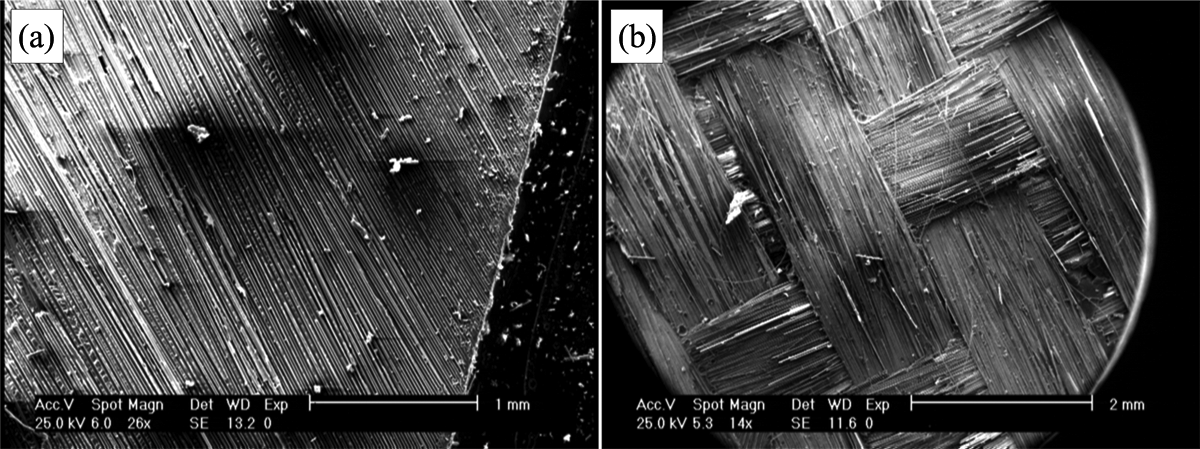
Scanning electron microscopic image of woven and unidirectional specimens.
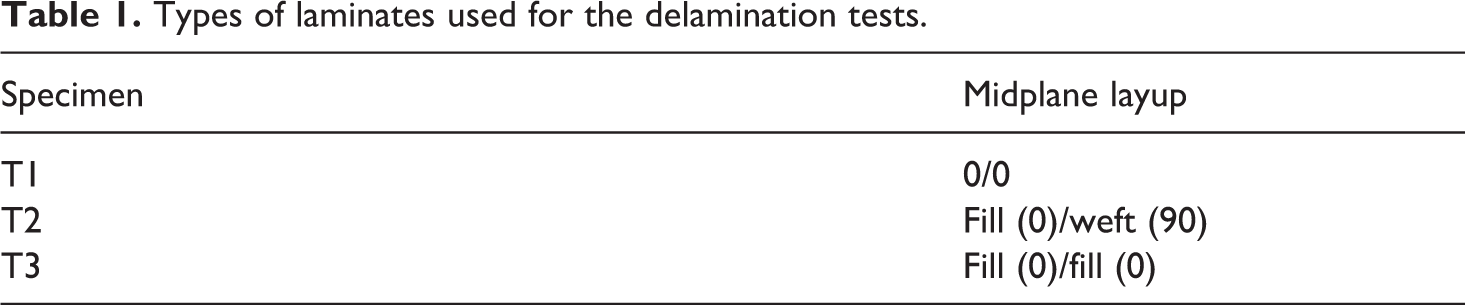
Properties of two different types of interfaces in the woven specimens, which are shown in Figure 2, are summarized in Table 1. Teflon film with a thickness of approximately 10 μm was inserted at mid-plane, during molding process, to create a starter crack as an initial crack for the mode I delamination test. After the vacuum bagging operation, the produced plates were located in open air at 20°C for 48 h. Ultrasonic c-scan was employed to examine the plates to guarantee excellent quality. Next, for making mode I opening test samples, the accepted plates were cut, according to the American Society for Testing and Materials (ASTM) D5528 standard, 26 using a band saw with a fine-toothed blade. Dimensions of the specimen are 220 × 20 ×5 mm3. For providing sufficient area for the AE sensor, 20 mm width is required, and for providing good coupling, 5 mm diameter is needed.
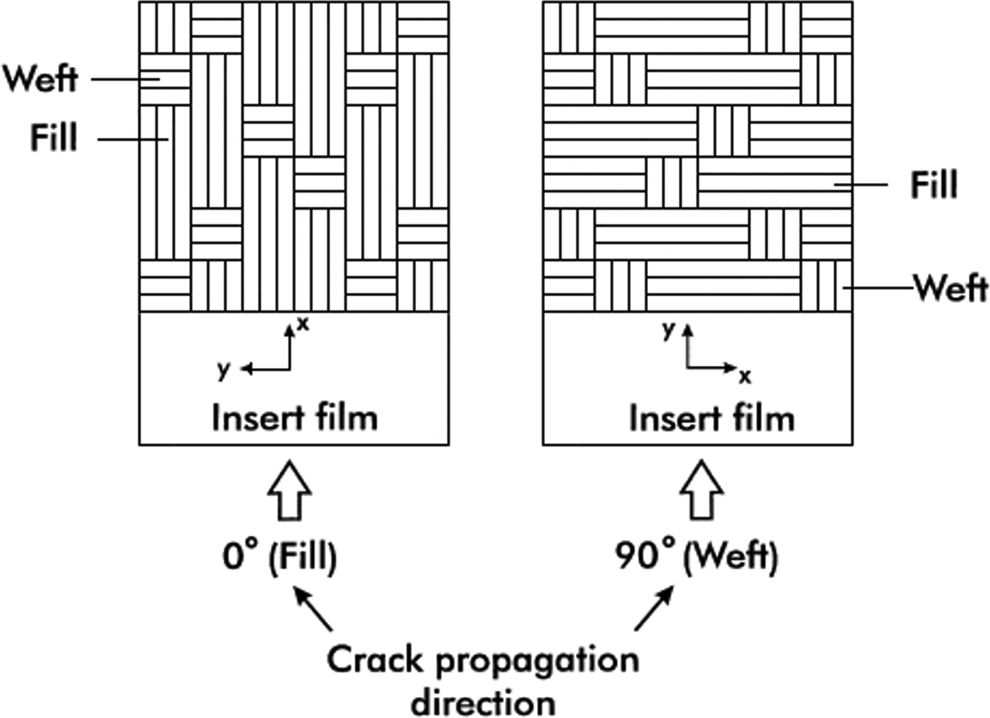
Schematic illustration of wave patterns.
Types of laminates used for the delamination tests.
Testing machine
A properly calibrated test machine was utilized. The constant displacement rate of this machine varies from 0.5 to 500 mm/min. Grips were used to hold the loading pins connected to the loading blocks that are bonded to the specimen. The load cell capacity of the test machine was 5000 N.
AE device
AEWin, which was the AE software, and a data acquisition system (PAC) PCI-2 with a maximum sampling rate of 40 MHz were used for recording AE events. The AE sensor called PICO, was a broadband, resonant-type and single-crystal piezoelectric transducer from Physical Acoustics Corporation (PAC; Princeton, New Jersey, USA). The resonance frequency and an optimum operating range of the sensor were 513.28 and 100–750 kHz, respectively. The surface of the sensor was covered with grease in order to provide good acoustic coupling between the specimen and the sensor. The signal was detected by the sensor and enhanced by a 2/4/6-AST preamplifier. The gain selector of the preamplifier was set to 40 dB. The test sampling rate was 1 MHz and 16 bits of resolution. The waveform parameters such as peak definition time, hit definition time, and hit lock-out time were set to 50, 100, and 300 µs, respectively. These values are selected in conjunction with pencil lead break tests on the specimens. Prior to the damage test, calibration of the data acquisition system has been carried out in accordance with a pencil lead break method, for all samples. The pencil lead break operation is based on the generation of repeatable acoustic waves at the specimen surface which is used for the device calibration. During the generation of the waves, velocity and attenuation of the AE waves were measured concurrently. For the device calibration, the lead breakage procedure was carried out several times at dissimilar positions between the AE sensors. After calibration, AE signal descriptors such as amplitude, rise time, duration, energy, and counts were recorded during the mechanical testing by two sensors that were placed in a linear configuration located at a distance of 50 mm, as shown in Figure 3.
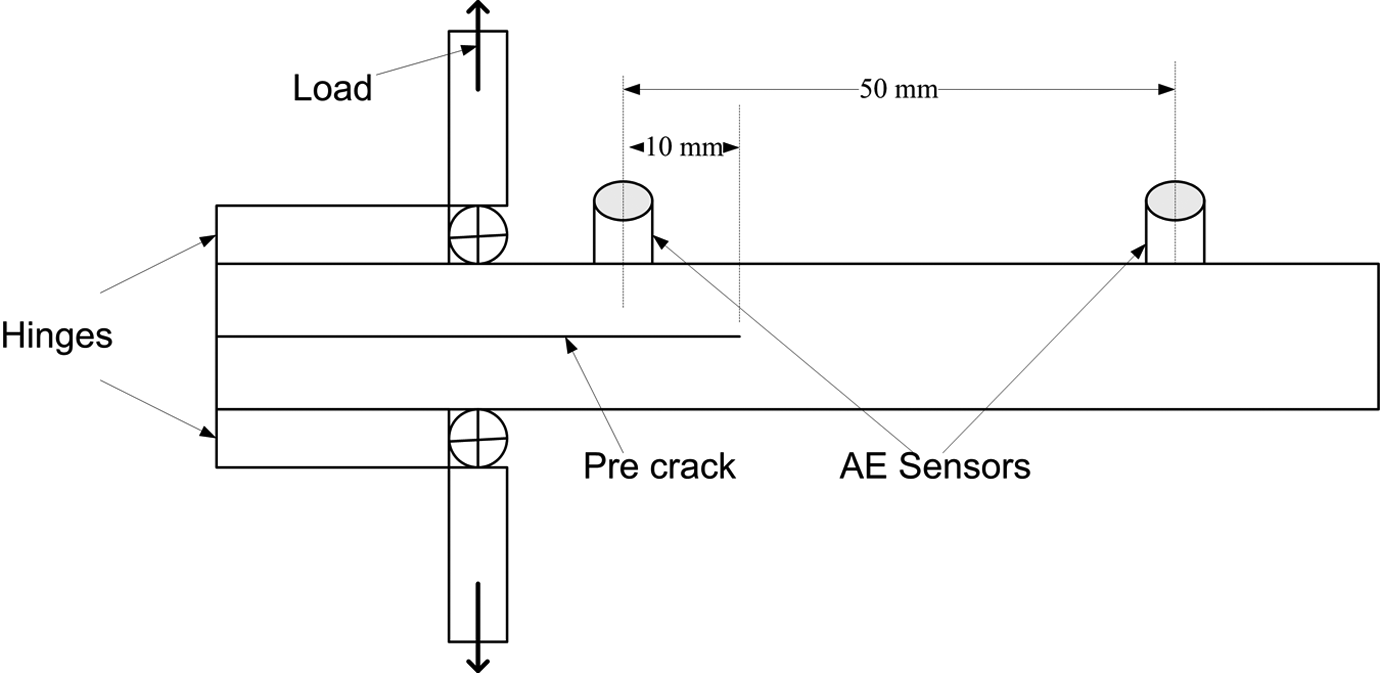
Schematic representation of DCB specimen for mode I delamination. DCB: double cantilever beam.
Methodology
The DCB sample is rectangular with uniform thickness and unidirectionally laminated composite specimen. Also, it has a nonadhesive Teflon film on the midplane, which provides a precrack for initiation of delamination. The hinges that are bonded to one end of the specimen are utilized to apply opening forces to the DCB specimen (Figure 3). While load and delamination length were being recorded, the ends of the DCB were opened by controlling either the opening displacement or the crosshead movement. The applied load and corresponding displacement were recorded and stored. Instantaneous delamination regions were marked on the chart at intervals of delamination growth based on ASTM D5528 standard. The test ended at maximum load.
Results and discussion
AE analysis is not part of standard fracture mechanics methods but can be applied in research and development of composite materials. Based on previous studies, 2,21 it was found that delamination failure is a mixture of different fracture mechanisms such as matrix cracking, fiber failure, and debonding of the matrix from the fibers. It means by characterizing these damage mechanisms, delamination will be characterized. For that reason, in this work, AE monitoring of delamination was used. Synchronized AE monitoring of the DCB fracture–toughness tests presents valuable information about microscopic and macroscopic characteristics of the delamination behavior. A large number of AE waveforms are obtained throughout a typical quasi-static loading of the composite material under the DCB test. Typical raw waveform of AE events in the time domain during the loading process is shown in Figure 4.
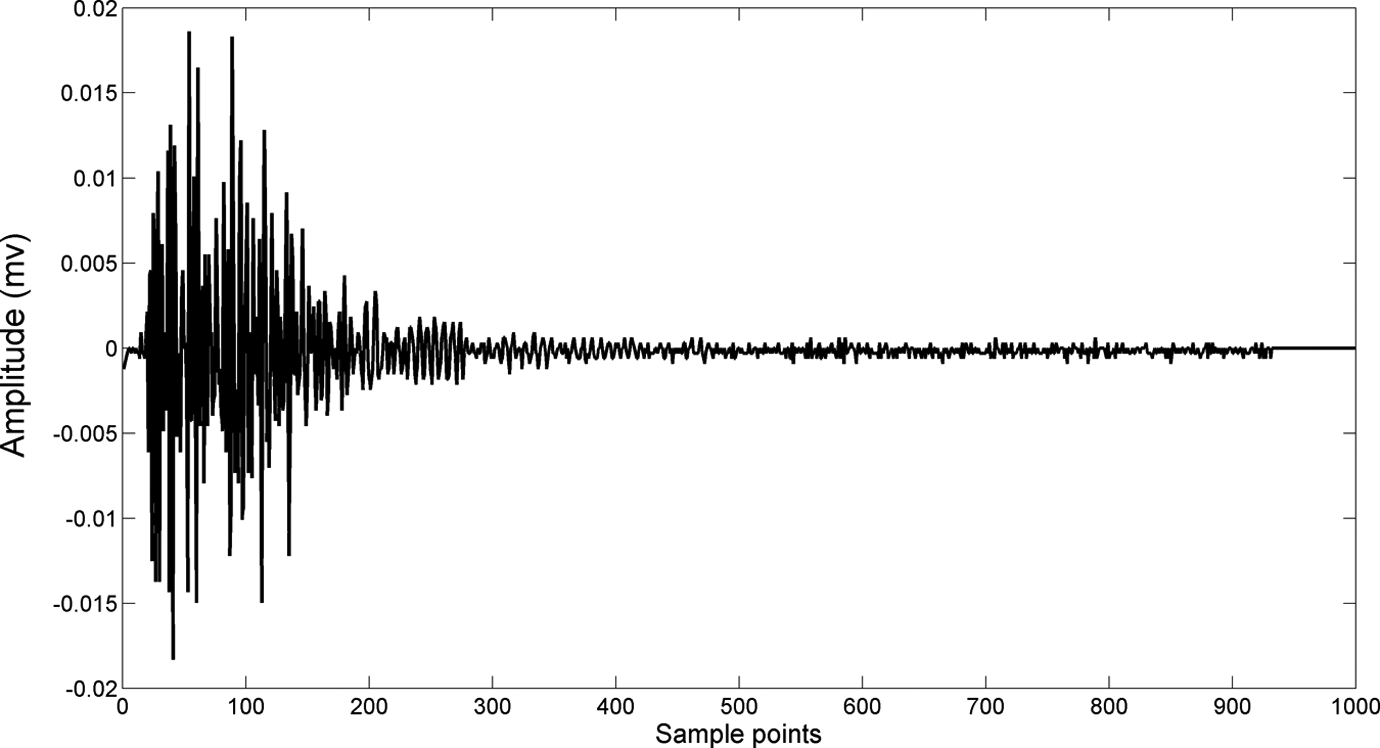
Typical AE waveform. AE: acoustic emission.
These events contain useful information and have significant roles in the examination of delamination behavior. In this study, completely different AE waveforms were noticed from the early stage of loading until the maximum load. Variations in AE events are because of different damage mechanisms during the test.
Procedure for initiation detection
The aim of this study is more focused to have investigation on the initiation stage of delamination. The importance of this investigation is due to the fact that initiation stage is critical in the delamination of the material. Knowing the delamination behavior in initiation can lead to an improved design with higher strength against crack initiation. Some previous studies revealed that the nonlinearity on the load–displacement plot is a practical indication of crack initiation.
26
Since defining a deviation from linearity is rather subjective and this method was not completely satisfactory, ASTM D5528
27
standard was developed to detect initiation stage. According to the previous work by Oskouei et al.,
25
it was found that the standard deviation of sentry function results, which relate AE parameters to the stress–strain diagram for detection of initiation stage, are smaller than the ones obtained by applying the ASTM D5528 methods. The sentry function is expressed as the logarithm of the ratio between mechanical and acoustic energies given by the relation
Es is the stored strain energy in the load–displacement plot. Ea is the AE events energy originated from intiation and propagation of delamination.
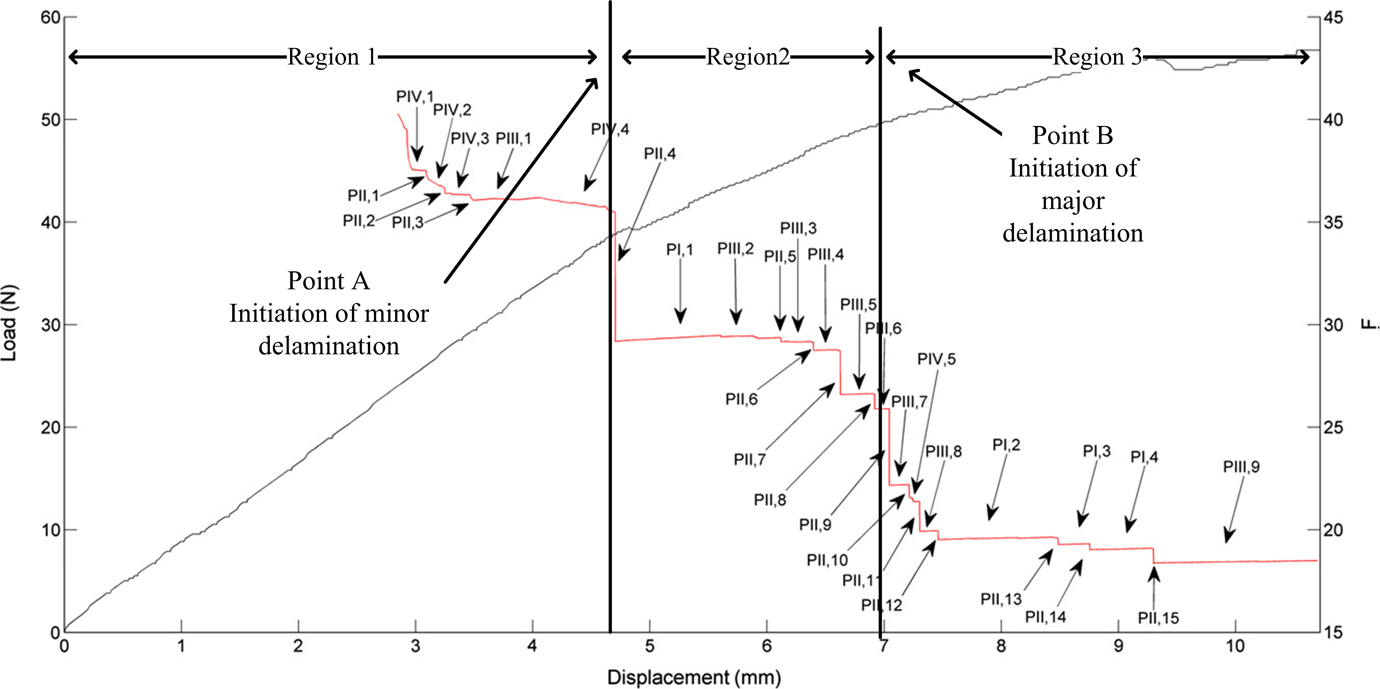
As illustrated in Figure 5 by applying sentry function method, two initiation stages are distinguishable during mode I delamination damage. In the previous work by Bakhtiary Davijani et al., 20 the delamination behavior in these specimens was studied using sentry function analysis. For instance, the sentry function trends of specimen T1 and T3 are shown in Figures 6 and 7. It is represented in Figures 5 to 7 that there are two stages in the initiation of delamination, minor initiation, which is related to the initiation of delamination in point A, and major initiation, which is associated with considerable damage (point B). Based on these two initiation stages, three different areas in the AE domain can be detected in the sentry function diagrams (Figures 5 to 7). These regions are explained bellow:
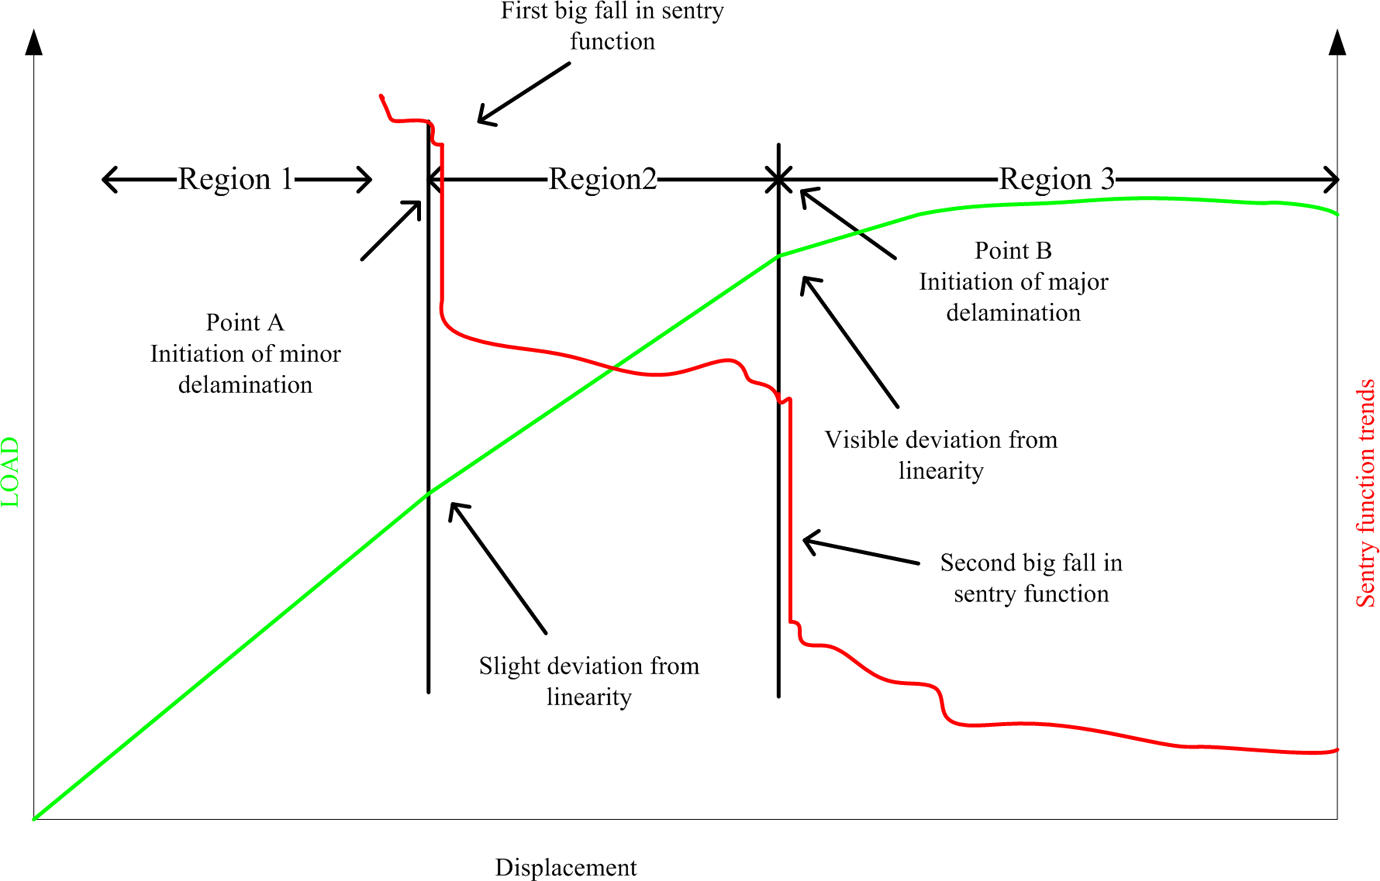
Schematic representation for different regions in sentry function diagram.
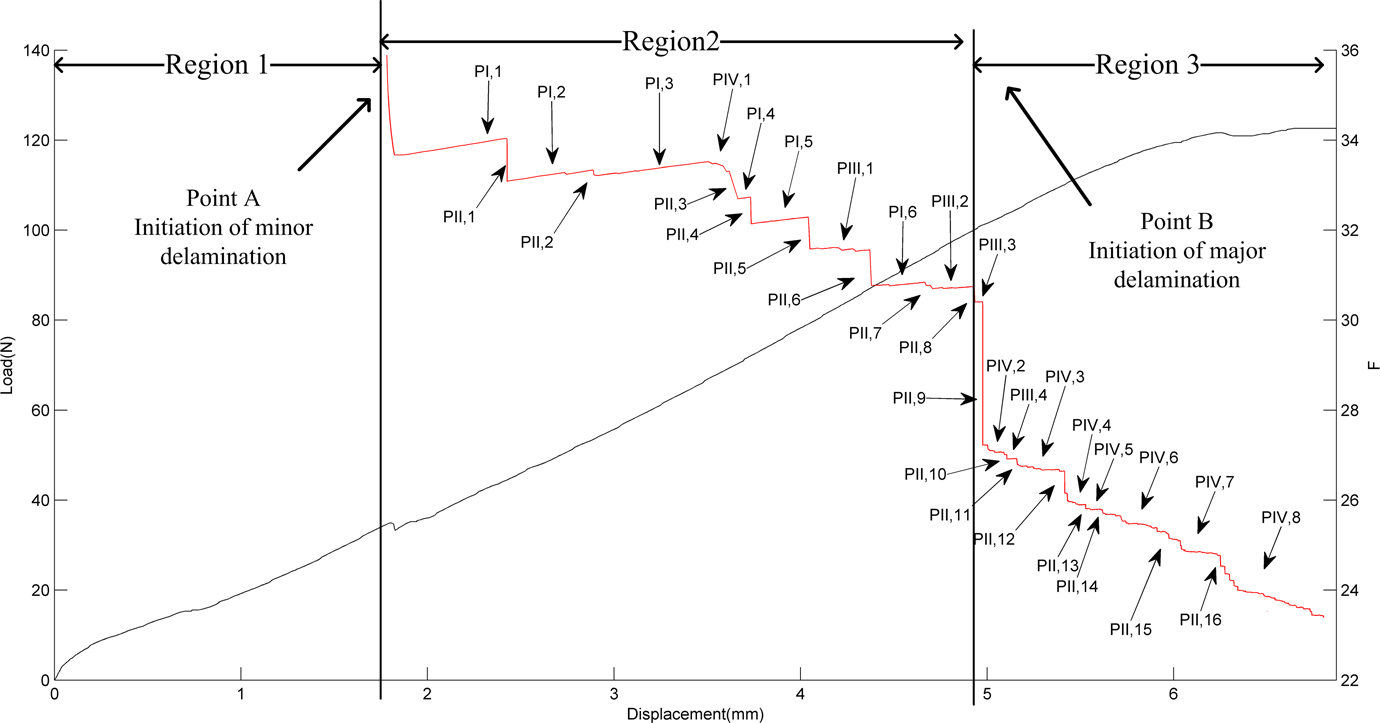
Different regions in sentry function diagram for specimen T1.
Different regions in sentry function diagram for specimen T3.
Region 1: the free failure domain (FFD), that is, the strain domain over which no failures are detected. At the early stage of the loading process and before point A, no events are detected. At the first region there is stored strain energy, when this stored energy reaches to critical strain energy that is needed for delamination initiation, the initiation event occurs. Variations in the critical strain are caused by the different stress concentrations in the crack tip of the specimens. There are several weak AE signals in the first region which might be associated with rubbing, elastic deformation, and manufacturing imperfection. At this region the damage level is negligible.
Region 2: region from the appearance of AE signals until the major failure in the sentry function trend. This major failure was considered as a significant damage level in mode I delamination. The beginning of the second region (point A on Figure 5) corresponds to initiation of minor delamination. This is because of the fact that sudden drops, defined by PII(x), indicate an instantaneous release of stored energy caused by internal material failure. When a significant internal material failure takes place, there is an immediate release of the stored energy that generates an AE event with high energy content. Also, slight deviation from nonlinearity in load–displacement plot is observable at point A. At this region the damage level is not negligible but the specimens are able to carry extra load.
Region 3: this region includes AE domain from major failure in delamination until the maximum load. The beginning of the third region (point B on Figure 5) corresponds to initiation of major delamination. Before point B, the crack propagation is arrested, and the strain energy is stored. 28 This point is in harmony with the point of deviation from nonlinearity that has been discussed in the ASTM D5528 standard. This point is associated with reduction in the slope of load–displacement diagram (Young’s modulus reduction). At this region, the damage level is high and the specimens cannot tolerate additional load.
As explained above, the initiation stages of delamination can be detected using sentry function method. As discussed before, sentry function method relies on strain and acoustic energy. As the strain rate is constant, strain energy increases with a particular rhythm. Because of the variation in the slope of the sentry function trends AE energy is changing. Each type of AE energy is related to a specific type of damage mechanism. Characterization of these damage mechanisms is useful for better understanding of delamination behavior, especially in initiation stages. Therefore, the analysis of AE waveforms, corresponding to these stages, was carried out by applying power spectrum analysis using fast Fourier transform (FFT) method.
In order to create AE reference pattern for this analysis, classification of pure matrix cracking and fiber failures was carried out by applying tensile tests (Figure 8).
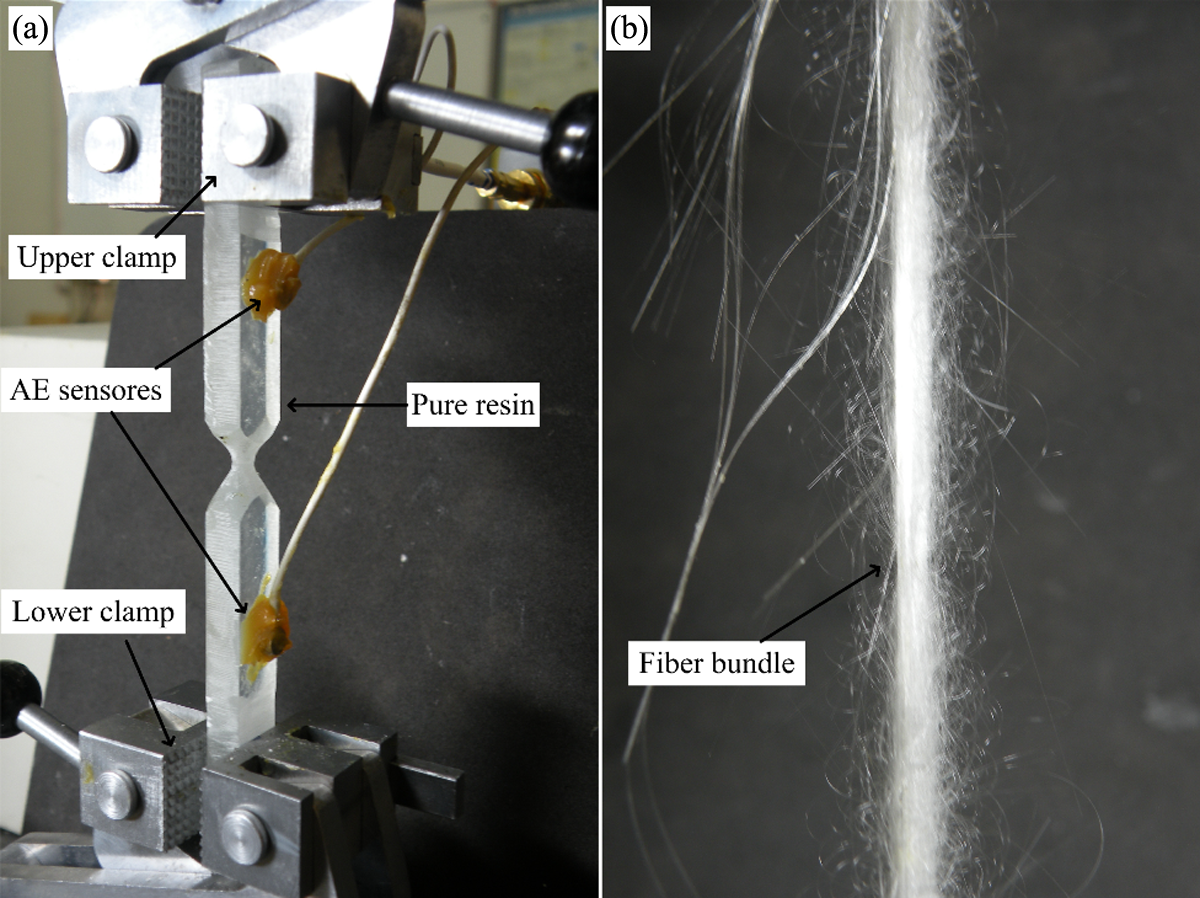
(a) Pure matrix cracking and (b) pure fiber breakage.
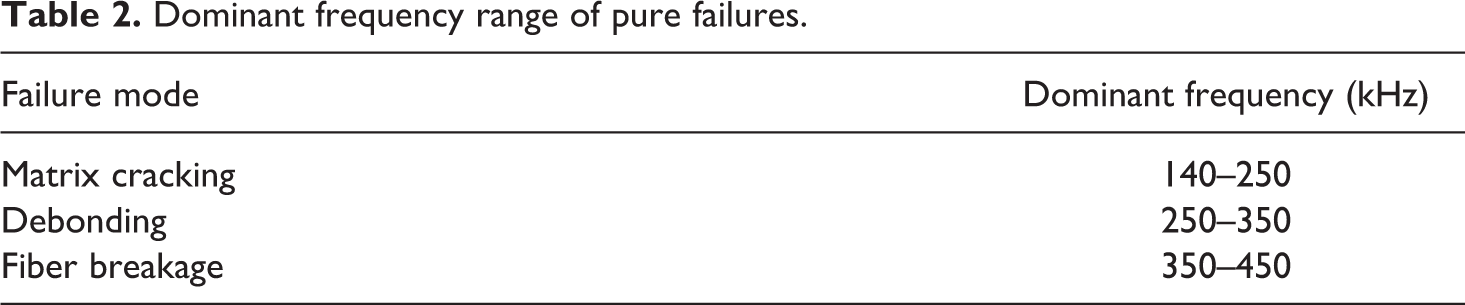
According to our previous investigation, 2 the frequency characteristics of fiber–matrix debonding are considered between matrix cracking and fiber breakage. The results of pure failures are shown in Figures 9 and 10 and Table 2.
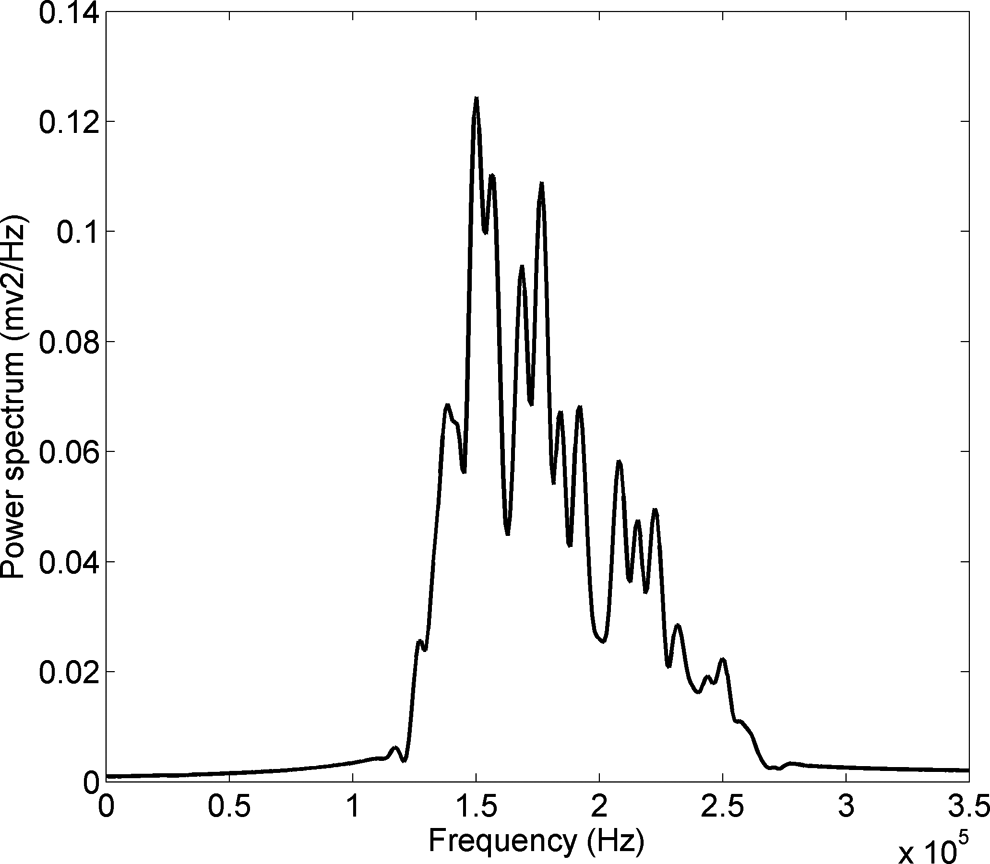
Typical frequency content of pure matrix cracking under tensile loading.
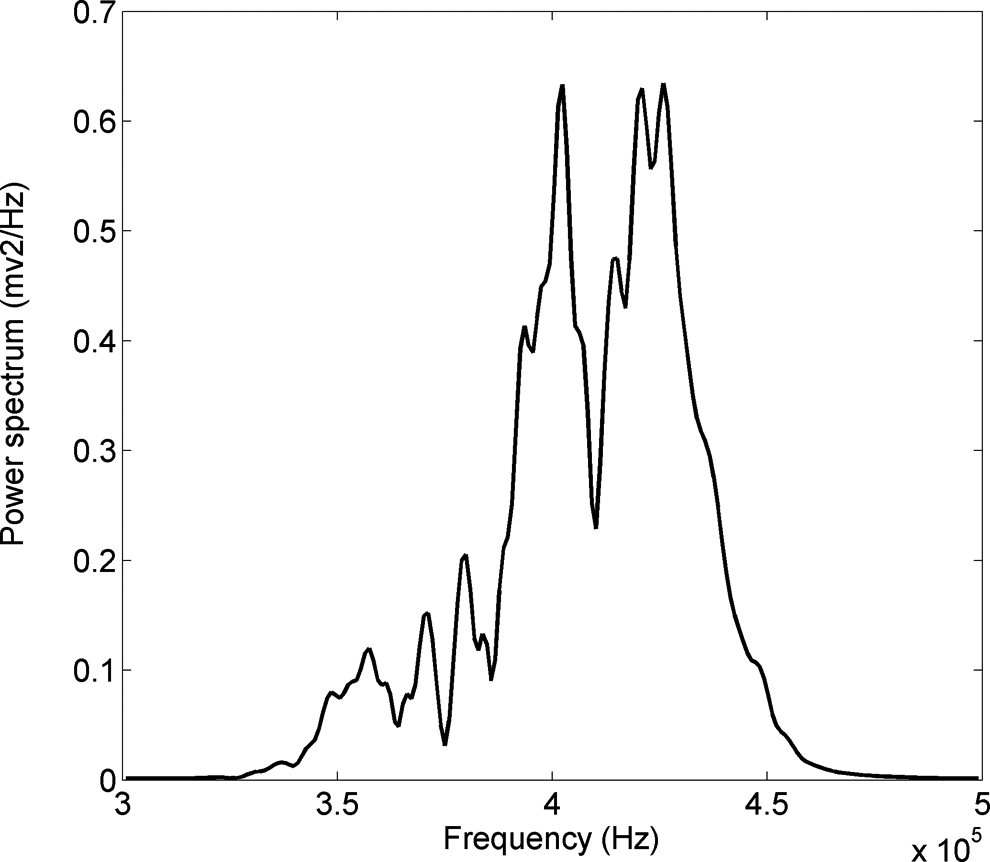
Typical frequency content of fiber breakage under tensile loading.
Dominant frequency range of pure failures.
Analysis in the initiation stage of delamination (point A)
The first AE signals were detected at point A. Before point A, strain is being stored (stored energy in load–displacement diagram), when this stored strain reaches the critical strain, which is needed for initiation of delamination, the initiation event takes place. Since initiation corresponds to sudden release of energy, in all cases there is a sudden drop trend in the sentry function diagram at point A. The signal characteristics at the beginning of the second region (minor initiation) are shown in Figures 11 to 13 for specimens T1, T2, and T3, respectively.
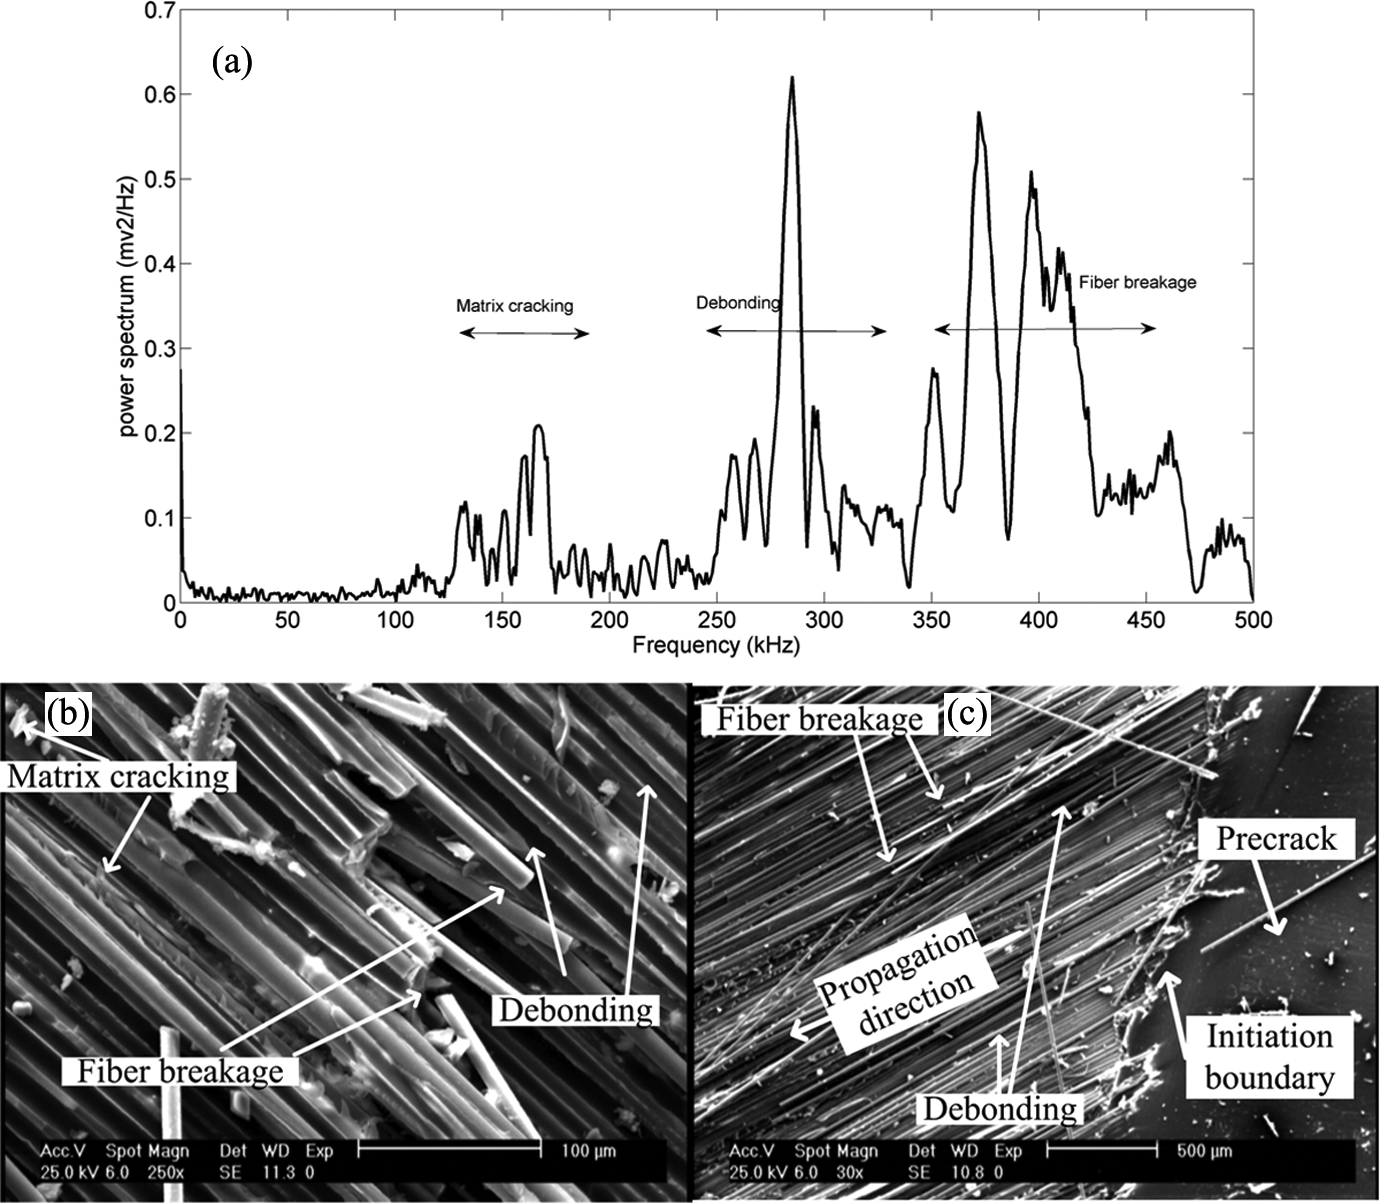
(a) Typical FFT analysis in the minor initiation stage for specimen T1; (b,c) SEM observation of specimen T1 near the minor initiation stage. FFT: fast Fourier transform; SEM: scanning electron microscopy.
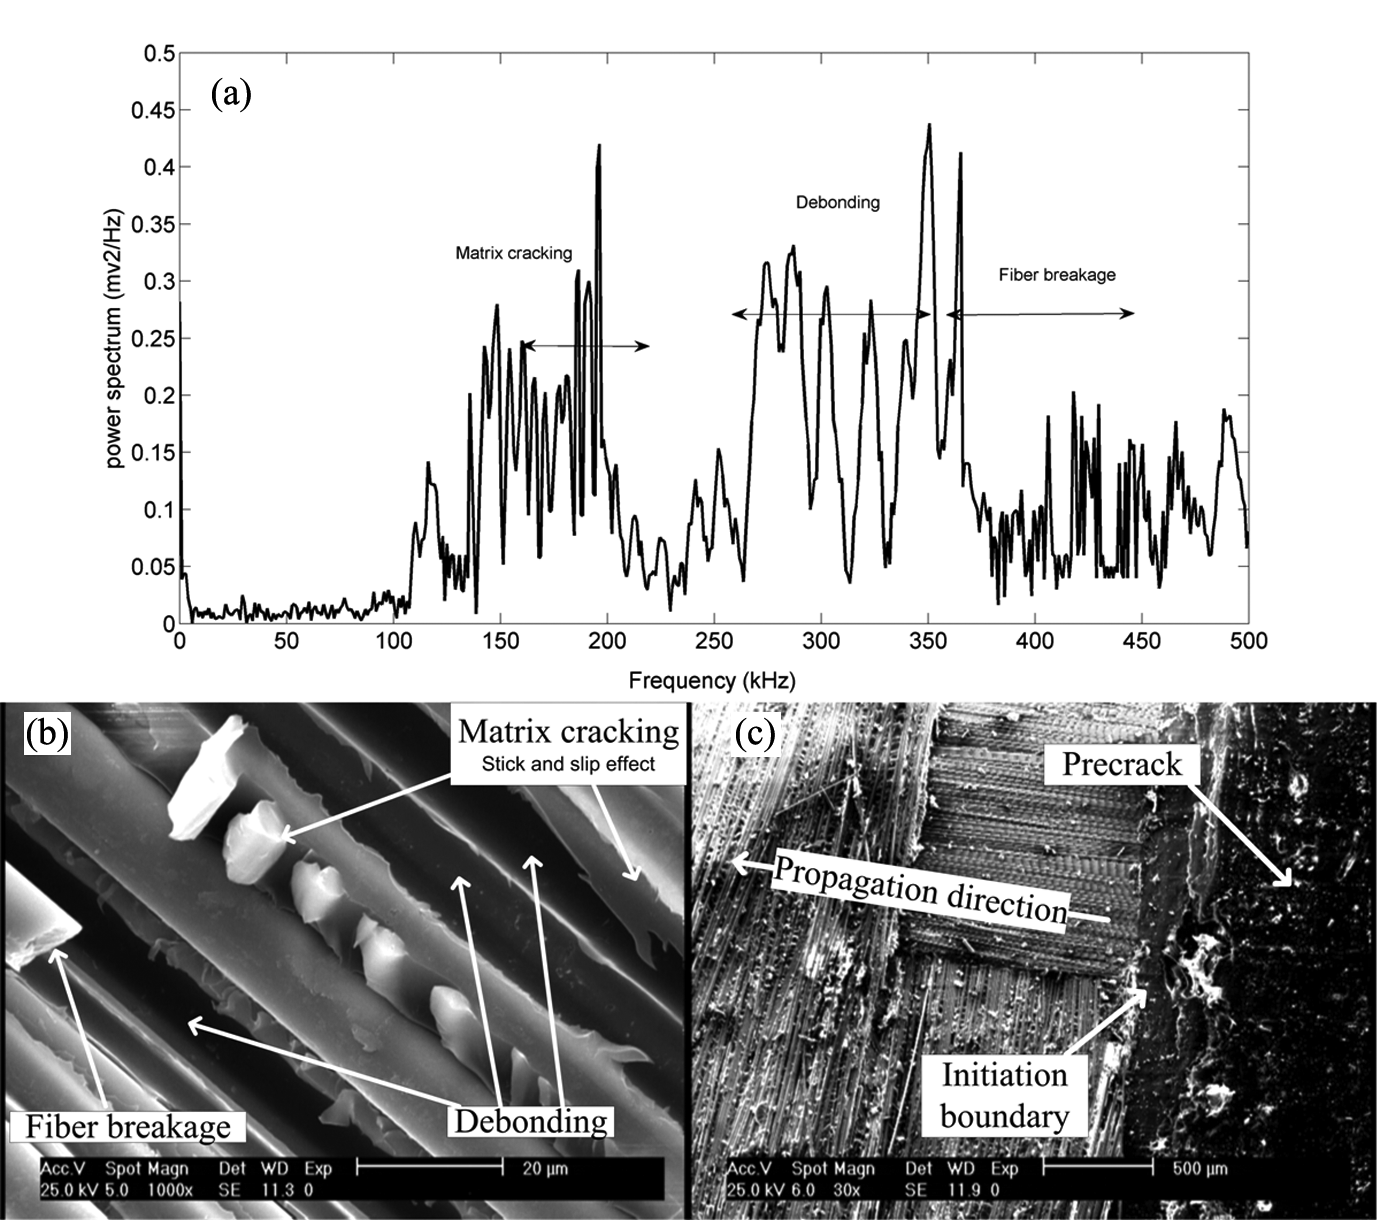
(a) Typical FFT analysis in the minor initiation stage for specimen T2; (b,c) SEM observation of specimen T2 near the minor initiation stage. FFT: fast Fourier transform; SEM: scanning electron microscopy.
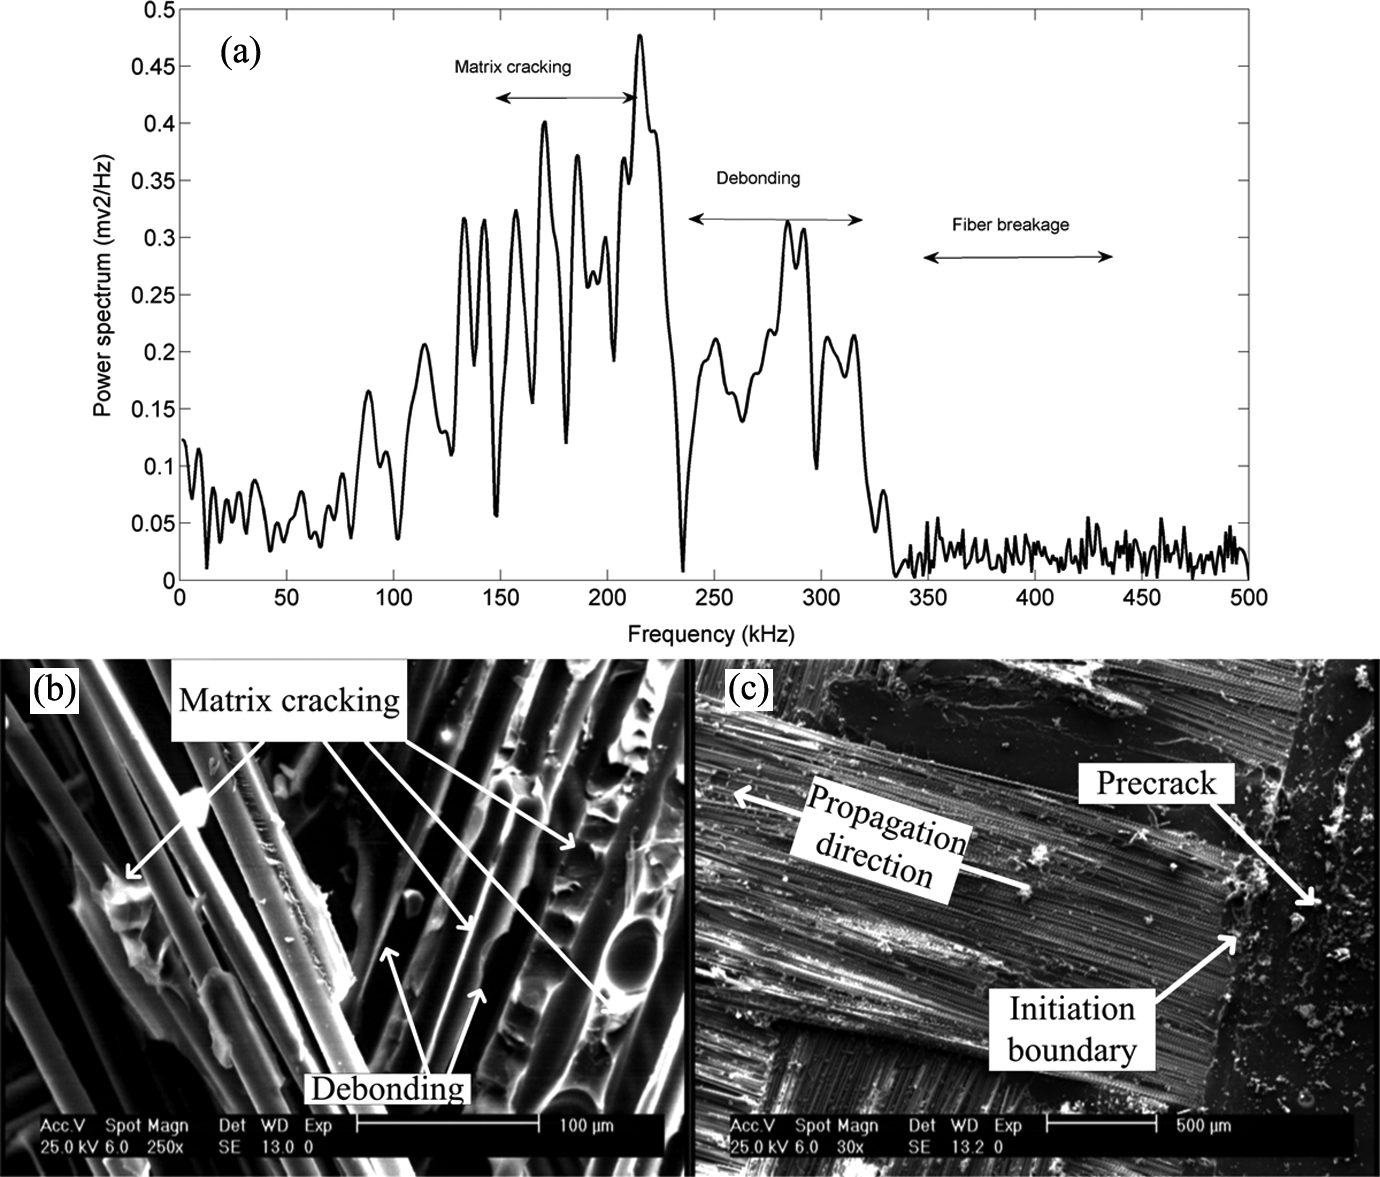
(a) Typical FFT analysis in the minor initiation stage for specimen T3; (b,c) SEM observation of specimen T3 near the minor initiation stage. FFT: fast Fourier transform; SEM: scanning electron microscopy.
The FFT analysis shows that specimen T1 has a dominant frequency range from 250 to 310 kHz or from 350 to 460 kHz. In specimen T2, most signals have a dominant frequency range from 110 to 200 kHz and 260 to 360 kHz. Peak frequency ranges in T3 occurred in 110–240 kHz and 200–320 kHz ranges. Several failure mechanisms, such as matrix cracking, fiber–matrix debonding, and fiber breakage, have been detected using SEM at the initiation stage (Figures 11 to 13). Consequently, these frequency ranges are associated with the failure mechanisms that were observed. Matrix cracking and fiber–matrix debonding are related to lower frequencies, and fiber breakage is related to higher frequencies. This conclusion is based on the results of the AE reference pattern which was obtained in the case of fiber bundle and a matrix under tensile loading. Therefore, in accordance with the power spectrum analysis, the frequency range of fiber breakage is dominant in T1, whereas the dominant frequency ranges of T2 and T3 are matrix cracking and fiber–matrix debonding. According to SEM observation, dominant damage mechanism in T1 is fiber breakage. Better adhesion of T2 also causes some fiber breakage failure in this specimen (rarely observed), whereas there are no fiber breakage events in T3. Dissimilar fiber breakage event arises from different structure of the specimens. Partial debonding of transversely oriented fiber bundles contributed to delamination resistance. Fiber breakage may result from fracture of debonded fibers referred to as “fiber bridging” in specimens with weft/fill structure (T2), but this event was not observed in specimens with fill/fill structure (T3). Also, fill and weft fibers disallowed the extensive fiber bridging phenomenon usually observed in unidirectional laminates. Therefore, there is less fiber breakage in specimens T3 and T2 compared with specimen T1. The length of the second region, that is, the domain from the minor delamination until the major delamination, for T1 and T2 is larger than T3 (Figures 5 to 7 and further references are reported in the study by Bakhtiary Davijani et al. 20 ). This difference is due to different micro failures, especially fiber bridging event, for specimens T1 and T2. 29
High strain energy-storing phases of T1, 20 at initiation stage of delamination, in the sentry function diagram is related to these types of fracture mechanisms. Initiation stage of T2 begins from the matrix and not the fibers, thus, results in minor strain-storing phases in comparison with T1. 20 Also, initiation stage in T3 begins from the matrix and not the fibers therefore strain-storing phases are small in comparison with T1 and T2. The difference between the behavior of T2 and T3 can be attributed to better intralaminar adhesion in T2, since it has a weft/fill structure rather than T3 which has a fill/fill structure. 30,31
Analysis in the major failure of delamination (point B) and maximum load
Point B (Figure 5) is considered as the initiation stage of major delamination. This fact is observable by the sudden drop of the sentry function diagram. Usually this sudden drop is larger than the sudden drop in minor initiation and other sudden drops. The onset of the macroscopic delamination growth is detected after this point. This point corresponds with reduction of the slope of load–displacement diagram (Young’s modulus reduction). In this stage, the structure is weakened and principally loses its ability to accumulate more strain energy, leading to a decreasing trend in the sentry function diagram. 20 The signal characteristics in this stage are shown in Figures 14 to 16 for specimens T1, T2, and T3, respectively.
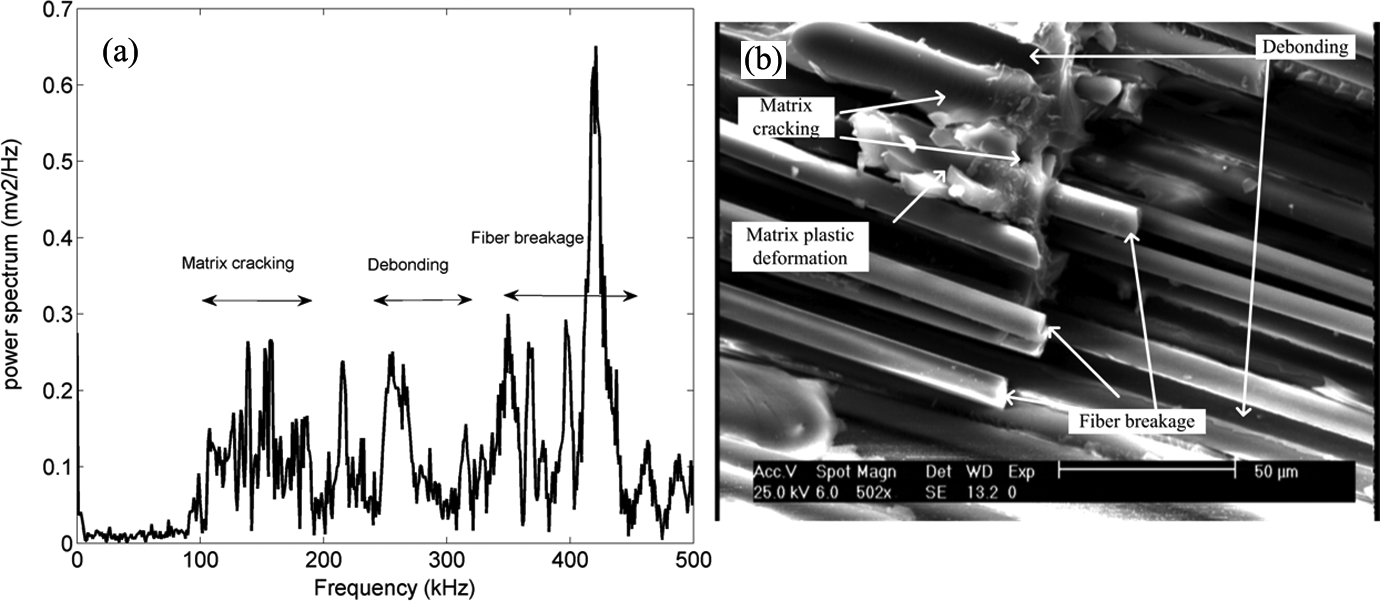
(a) Typical FFT analysis in the major initiation stage for specimen T1; (b) SEM observation of specimen T1 near the major initiation stage. FFT: fast Fourier transform; SEM: scanning electron microscopy.
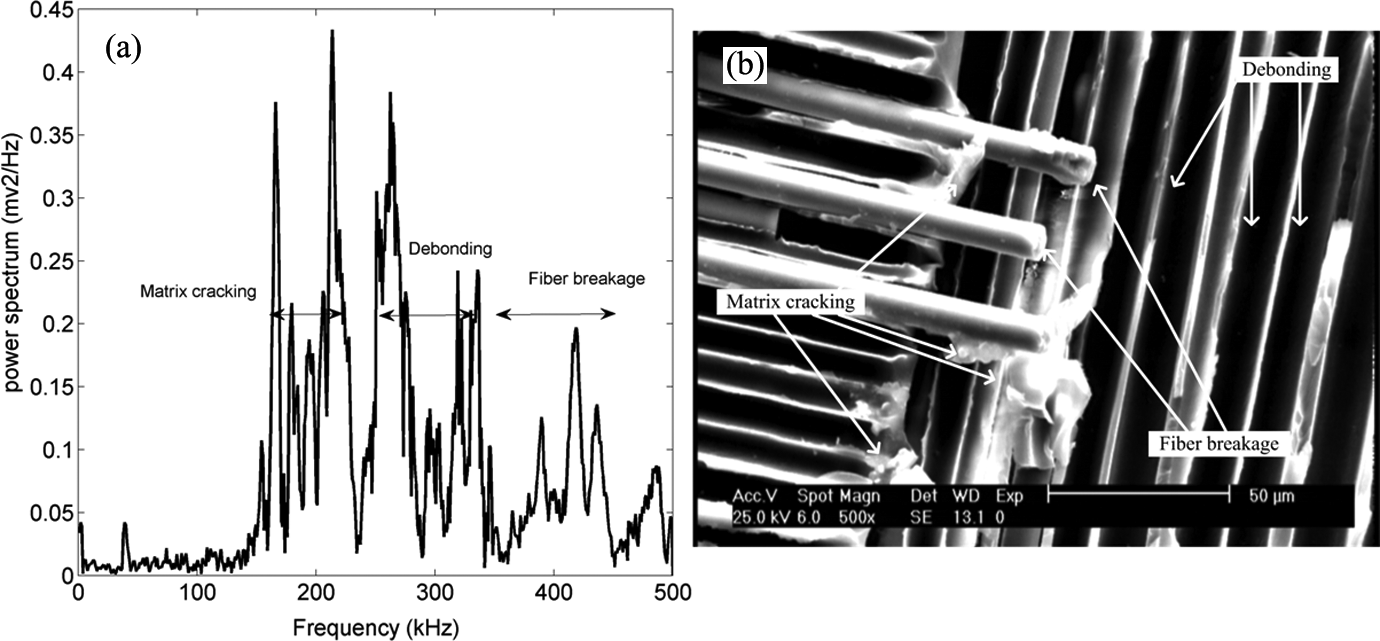
(a) Typical FFT analysis in the major initiation stage for specimen T2; (b) SEM observation of specimen T2 near the major initiation stage. FFT: fast Fourier transform; SEM: scanning electron microscopy.
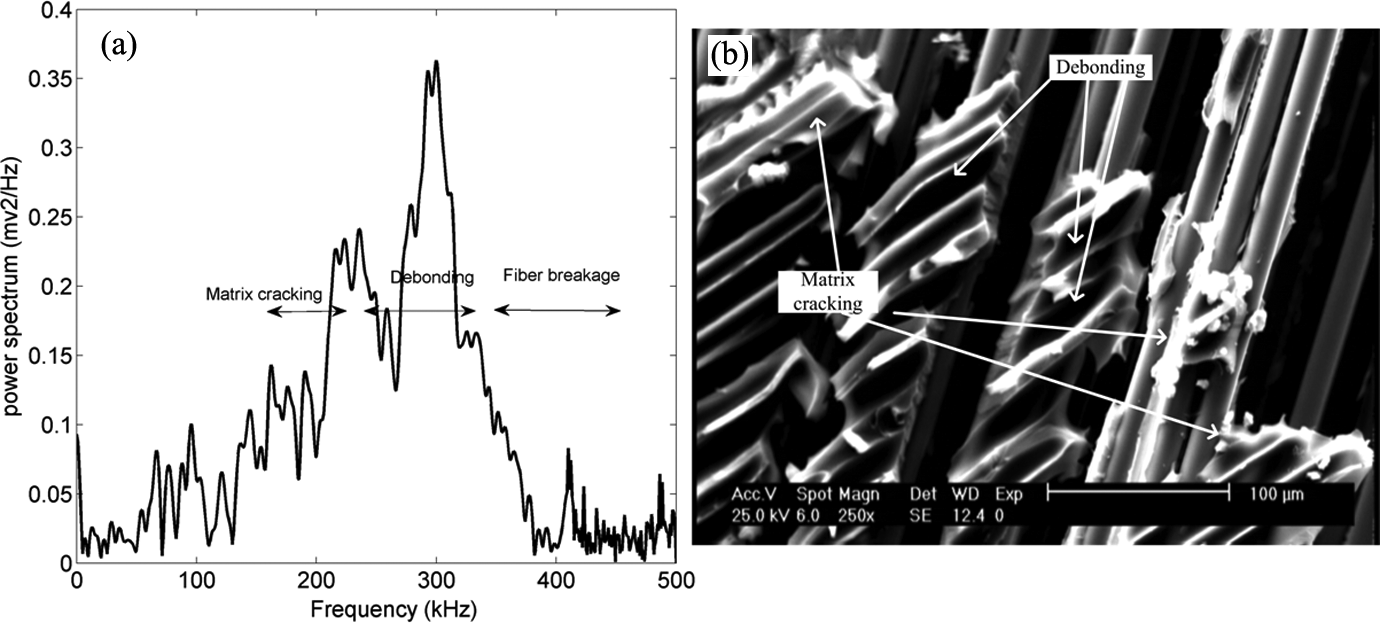
(a) Typical FFT analysis in the major initiation stage for specimen T3; (b) SEM observation of specimen T3 near the major initiation stage. FFT: fast Fourier transform; SEM: scanning electron microscopy.
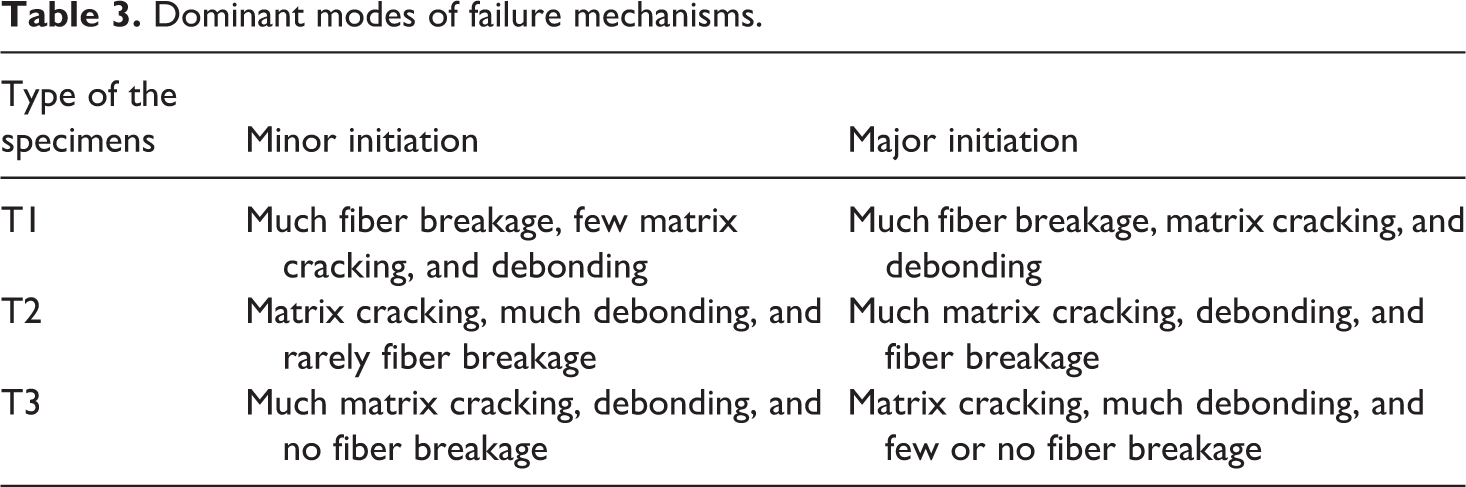
The frequency content of AE waveforms in this stage is extensively distributed, since three dominant damage mechanisms are activated at major initiation of delamination (Figures 14 to 16). In specimen T1, most signals have a dominant frequency range from 110 to 200 kHz, 200 to 300 kHz, or 340 to 450 kHz. Specimen T2 has a dominant frequency range from 150 to 240 kHz, 250 to 340 kHz, or 360 to 450 kHz. For specimen T3, the dominant frequency range is extended from 130 to 350 kHz. Several damage mechanisms, related to these frequency ranges, such as matrix cracking, fiber–matrix debonding, and fiber breakage, have been observed in SEM images near point B (Figures 14 to 16). According to SEM and frequency analysis, fiber breakage event in T2 is dominant compared with T3 and this event in T1 is dominant compared with T2 and T3. In all cases, debonding and matrix cracking failures are observed. This type of failure in T2 and T3 is prevailing. Dominant modes of damage are summarized in Table 3.
Dominant modes of failure mechanisms.
Also there is some other frequency content, in power spectrum analysis, indicating different damage mechanisms. Different factors may affect failure mechanisms differently. Several factors such as variations in local material properties, fiber-rich or resin-rich areas along the propagation direction, localized damages in the DCB beam specimen, undesired resin between two adjacent layers along the precrack region, misalignment of the fibers, and voids may also affect the delamination behavior and cause various failure mechanisms.
Different distribution in the dominant frequency range, for dissimilar failures, can be clarified by the fact that elastic acoustic velocities of relaxation processes and intrinsic frequencies are related to the density and elastic moduli according to equation (2)
32
:
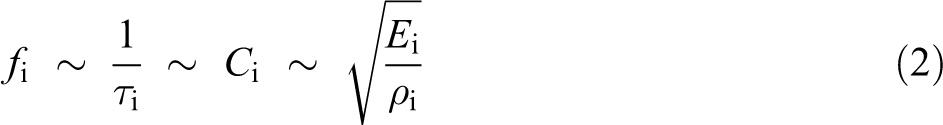
where
As a result, the epoxy–matrix cracking creates lower frequency ranges compared with the glass–fiber/matrix interface debonding, and the highest frequency ranges will be achieved during fiber breakage.
The results of frequency analysis are in good agreement with the results of sentry function analysis. 20 It can be concluded that the combination of sentry function analysis and frequency analysis using FFT can be applied in research and development of delamination behavior.
Conclusion
This article is focused on the discrimination of various fracture mechanisms in the initiation stages of delamination. Investigation of initiation of mode I delamination in composite materials with different layups, which were 0/0, woven/woven in fill/fill, and fill/weft layups, was carried out by applying the combination of sentry function analysis and frequency analysis using power spectrum. According to sentry function analysis, there are two stages in the initiation of delamination, minor initiation, and major initiation. Before minor initiation no AE events were recorded which is the free failure region. Major initiation is associated with considerable damage in the material which leads to a major sudden drop in the sentry function. The combination of sentry function analysis, determination of important and effective regions during propagation of delamination using sentry function trends, and frequency analysis using FFT was applied to determine micro events of crack in minor and major initiation stages of delamination. It was found that different layups may result in different kinds of micro failures and consequently different kinds of initiation behavior in composite materials. According to power spectrum analysis at minor initiation stage the frequency range of fiber breakage is a dominant one in T1, whereas dominant frequency ranges of T2 and T3 are matrix cracking and fiber–matrix debonding. This different failure mechanism is due to different structure of the specimens, which affect the fracture of debonded fibers referred to as “fiber bridging”. High strain energy-storing phases of T1 at this stage, in the sentry function diagram, are related to these types of fracture mechanisms. The initiation stage of T2 and T3 begin from the matrix and not the fibers; therefore, this leads to minor strain-storing phases in comparison with T1. Power spectrum analysis at major initiation stage showed that fiber breakage event in T1 is dominant compared with T2 and T3. In all cases debonding and matrix cracking failures are observed. These types of failure in T2 and T3 are prevailing. According to SEM observation, several damage mechanisms, such as matrix cracking, fiber–matrix debonding, and fiber breakage, have been observed using SEM at the initiation stages of different specimens. These observed failures were in good agreement with the results of power spectrum analysis. Therefore, AE monitoring accompanied with this combined method appears to be a useful tool to study the initiation behavior and to characterize micro events of these stages in delamination.
Footnotes
Acknowledgment
The authors wish to thank the Department of Mechanical Engineering at Amirkabir University of Technology, Tehran, Islamic Republic of Iran, for providing the facilities for this study.
Declaration of Conflicting Interests
The author(s) declared no potential conflicts of interest with respect to the research, authorship, and/or publication of this article.
Funding
The author(s) received no financial support for the research, authorship, and/or publication of this article.