
Abstract
This article aims to accomplish research’s that has been achieved recently in the scientific community on the manufacturing monitoring and structural health monitoring (SHM) of composite materials using in-situ piezoelectric sensors. A series of specimens of flax/Elium composite laminates with and without integrated piezoelectric sensors were subject to static and fatigue tensile tests. The effects of introducing the sensor into the composite materials were studied. Moreover, the Acoustic Emission (AE) method was used during experimental tests to follow the gradual degradation and damage evolution in the bio-composites. The AE data were analyzed by the k-means unsupervised pattern recognition algorithm. Moreover, the characteristics of the acoustic signals detected from specimens with and without integrated sensors were compared. The experimental results show that the integration of piezoelectric sensors within the flax/Elium composite without degrading its mechanical properties is possible. In addition, the integrated sensor shows good results regarding class detection and separation. The in-situ health monitoring methods performed on bio-composites presents an excellent alternative to the conventional technique in which sensors are generally bonded to the material surface.
Keywords
Introduction
Thermoplastic composites reinforced with natural fibers are distinguished from other synthetic composites by specific properties that allow them to replace parts actually made of fiber glass.1,2 Researches realized on bio-composites have shown various types of natural fibers such as flax, 3 hemp, 4 bamboo, 5 jute, 6 and kenaf fibers. 7 The composites reinforced with these fibers have presented good thermal and mechanical properties, and offer greater design flexibility at a relatively low price, compared to conventional materials.8,9
Several sectors of activity are integrating these materials in the design of their products such as aeronautic and automotive engineering. In these industrial fields, the corresponding composite structures are exposed to severe environmental conditions such as mechanical fatigue, outside corrosion, thermal ageing, radiation, etc.…. This can lead to multiple types of damage mechanisms and consequently the materials degradation. In this context, the development of in-service Structural Health Monitoring (SHM) systems is necessary in order to rapidly check the health state of bio-composite structures. Several Non-Destructive Techniques (NDT) are developed for SHM such as Acoustic Emission (AE) technique, 10 electromagnetic testing 11 and ultrasonic methods. 12 The AE technique, which is generally external, presents one of the most widely used methods that permits to control the damage evolution in materials through the detection of transient ultrasonic waves generated by damage development under load.13,14
Many approaches are proposed in the literature.15–17 De Rosa et al. 17 present a review study on the AE applications in the field of composites reinforced with natural fibers. They highlight the damage progression, the crack evolution and the failure mechanisms detection. In addition, they establish a correlation between the acoustic emission bursts and the microscopic observations to identify the damage mechanisms. A number of studies also exist, in which AE features analysis is assisted by unsupervised method and associated with principal component analysis (PCA).18,19 Huguet et al. 19 classify the detected acoustic signals with the Kohonen Self- Organising Map (KSOM) methods. They prove that the pattern recognition technique can lead to a reliable classification of AE events into specific damage modes. Monti et al. 18 use the K-mean algorithm to classify the different acoustic signals detected during tensile tests carried out on flax/Elium composites. They show high repeatability of the data clustering by using five classification parameters: amplitude, duration, rise time, number of counts to peak and absolute energy. Their results show that matrix cracking and fiber-matrix debonding are the first effects observed. Then, fiber pullout and fiber breakage accumulate to cause final failure. Monti et al. 18 summarized also some research’s that have classified the AE signals based on the events amplitude. Several amplitude ranges were related to matrix cracking ([35–45], [42–60] dB, etc.), fiber–matrix debonding ([45–60], [60–70] dB, etc.), matrix–matrix friction (MMF) ([40–55] dB), fiber–matrix friction (FMF) ([55–85] dB), fiber pullout ([60–80] dB), fiber cracking ([35–60] dB) and fiber breakage ([70–100], [80–96] dB, etc.).
The AE technique is very useful to detect external and/or internal defects in composite materials. However, it’s generally an external technique in which the AE sensors must be coupled to the surface of the part. This can be very cumbersome and incompatible with functioning parts, without forgetting also that some structures are difficult to be accessed and traditional AE sensors cannot be instrumented. In addition, the AE tests are generally applied in a particular period and not continuously therefore the exact time of damage initiation cannot be revealed. To surmount the aforementioned problems, in-situ SHM techniques are developed. The AE sensors can be directly integrated inside the composite during the manufacturing stage that allows to perform continuous monitoring. Different kinds of AE sensors can be used such as piezoelectric sensors 20 and optical fiber sensors. 21 However, the in-situ SHM techniques come also with disadvantages such as the manufacturing/embedding difficulties. The integrated device causes geometrical discontinuities and may degrade the monitored material performance. 22 Therefore, it is important to investigate the effects of the integrated sensors on the host materials.
Tuloup et al. 23 present a literature review on the use of in-situ piezoelectric sensors for structural health monitoring of polymer matrix composites. They highlight a lot of scientific contributions deal with the use of piezoelectric materials for the in-situ SHM technique, such as lead zirconate titanate (LZT or PZT) or polyvinylidene fluoride (PVDF).24–26 The results show that PZT sensors show much more important actuation than PVDF sensors. The piezoelectric materials, specifically the PZT, are largely used for the SHM technique 27 because they could be applied as either active or passive sensors due to their electrical-mechanical coupling behavior.28,29 The effects of the integrated piezoelectric PZT sensors on mechanical behavior of the laminated composite materials are studied by Masmoudi et al. 26 Static and fatigue tests are performed on composite specimens with and without integrated sensors. All tests are monitored by the AE technique in order to identify the damage mechanisms of the specimens. The results show that the embedding of sensors caused a negligible influence on the mechanical properties of the host materials if the dimensions of the sensors did not exceed certain limits. The AE analysis shows that the integrated sensor presents advantages of the detection of the acoustic bursts and highlight the presence of three or four types of damage during tests. Ghezzo et al.22,30 present an experimental study on composite laminates with integrated SHM sensors. Quasi-static tensile tests associated with AE monitoring are realized. Results show that the mechanical properties are substantially the same of the composite with and without integrated sensors. AE results show that the amplitude of the events detected is usually higher than those acquired from the composite without integrated sensors.
This work presents an experimental research in-real time and in-situ health monitoring structure (SHM) of integrated bio-composites subject to static and fatigue tensile loads. The tests are realized on the specimens with and without integrated piezoelectric sensor to study the effect of implanting an external object in the host material. Then, the AE technique is used to follow the progression of damage during the tensile tests. The AE activity detected during specimen’s tests are analyzed. The K-means algorithm and principal component analysis (PCA) are applied to identify the different damage mechanisms.
Materials and experimental procedure
Materials
Mechanical properties of flax fiber and Elium resin.
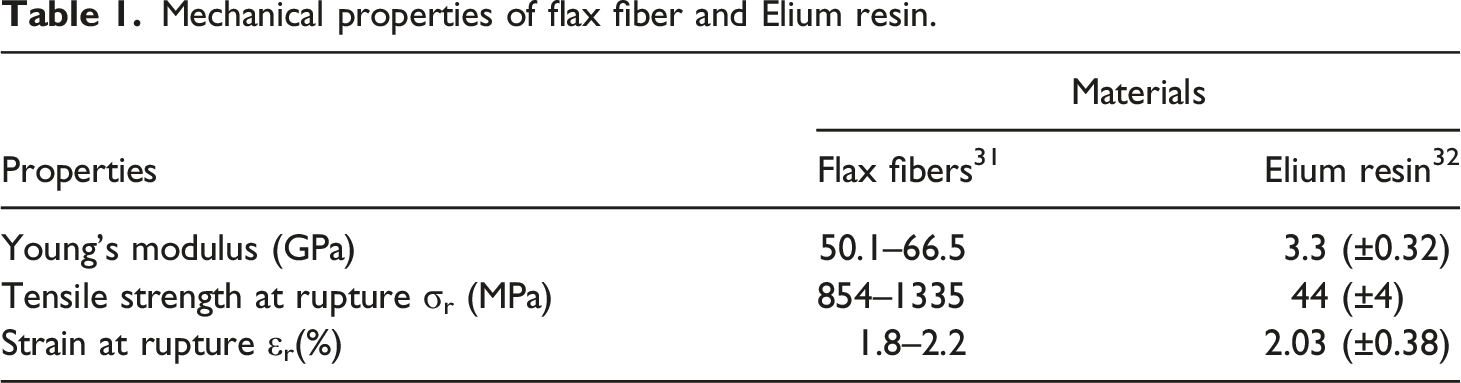
The integrated sensor is a PZT disc commercialized by Pi-ceramic company and denoted by PIC255. It has an extremely high curie temperature, high permittivity, high coupling factor and a high charge constant. A detailed explanation of PIC 255 can be found in the Pi-ceramic company catalog.
38
The sensor is integrated during the manufacturing stage within the plies on the neutral plane of the composite laminates as shown in Figure 1(a). Two dimensions of the sensors are used in order to study the effect of integration as well as the dimension of the sensor on the mechanical properties (Figure 1(b)). Thus, three types of specimens are elaborated: (a) Piezoelectric sensor position within the composite and (b) the dimensions of the piezoelectric sensors.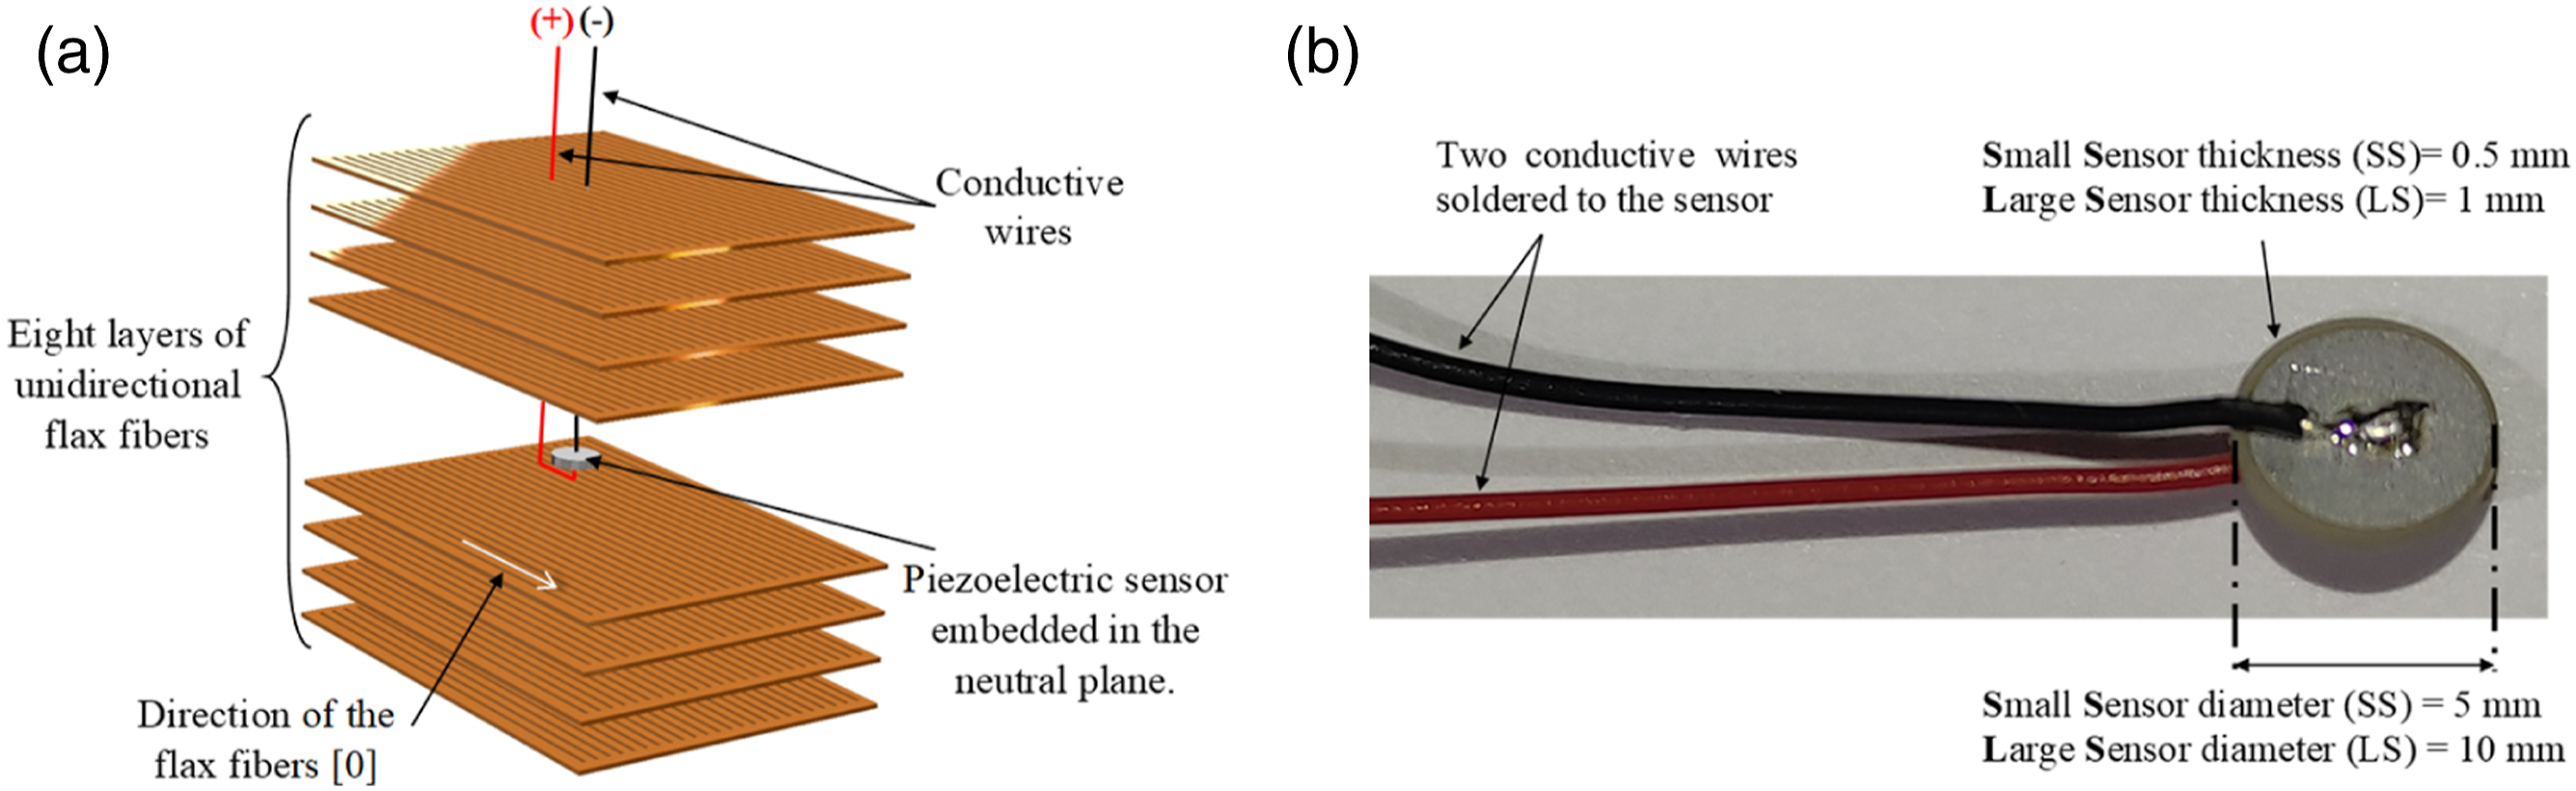
Experimental procedure
Tensile tests
Specimens are subjected to uniaxial loading in static and fatigue tensile tests according to the standard test method ASTM D3039/D3039M.
39
The static tests are carried out with a tensile machine equipped with a 100 kN load cell. The experimental set-up is shown in Figure 2. Minimum of five specimens are tested at a strain rate of 1 mm/min at room temperature. The fatigue tests are performed using sinusoidal waveform at controlled load with a frequency of 10 Hz according to ASTM D3479 standard.
40
The loading ration R (σmin/σmax) is equal to 0.1, where σmax and σmin are respectively the maximum and minimum applied stress. Different level of loading r (σmax/σf) are applied for each material where σf is the stress at failure measured by the static tensile test. Experimental setup of acoustic emission technique realized on the integrated specimens.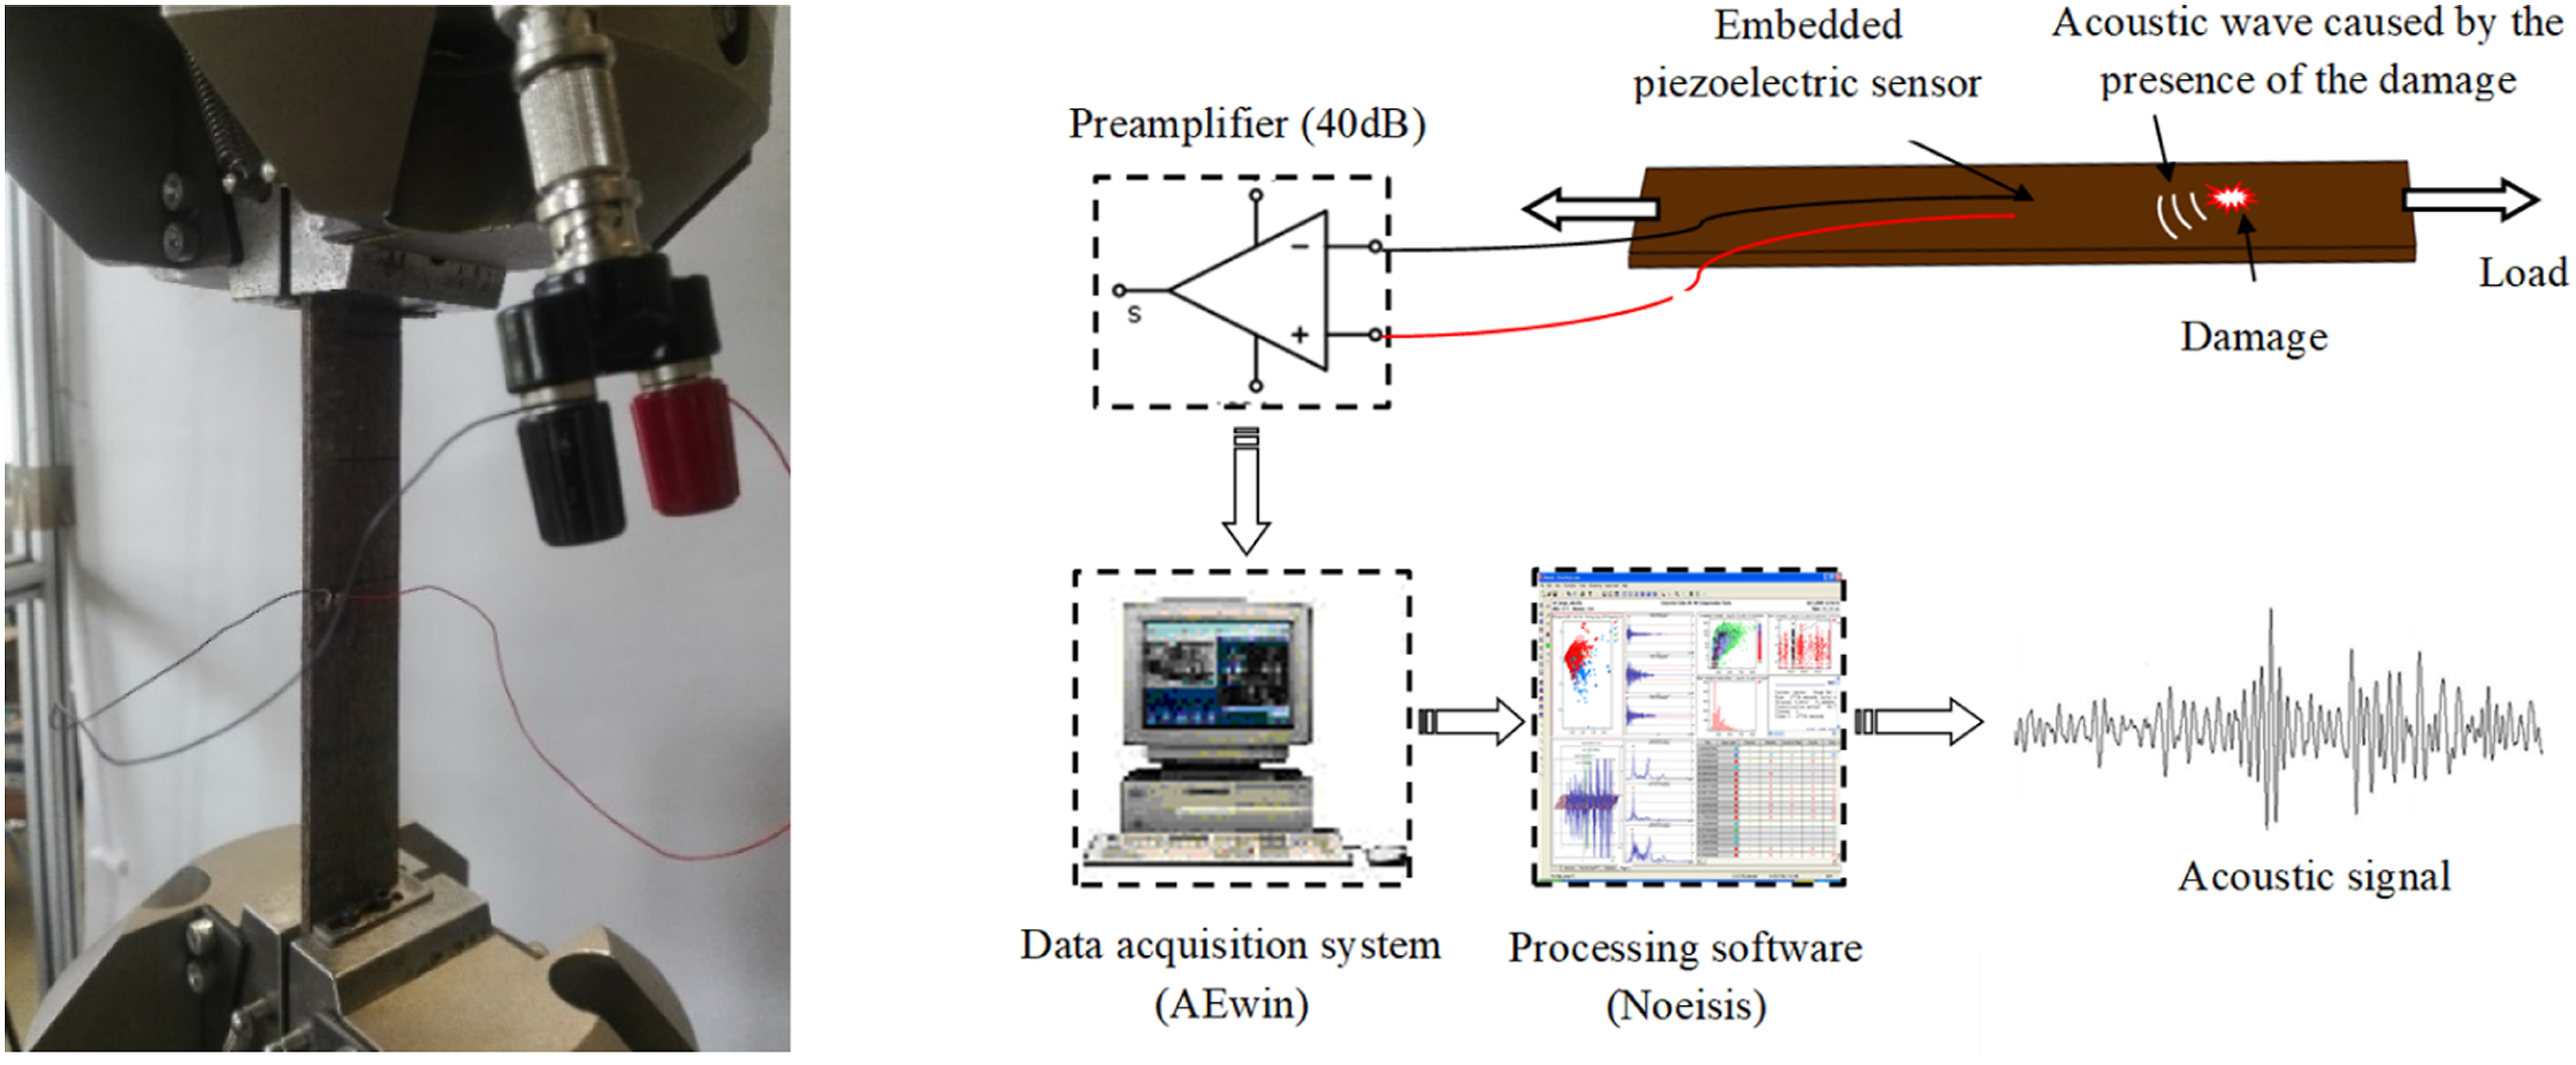
Acoustic emission
During static and fatigue tensile tests, the damage evolution is analyzed and identified by the AE technique. Tests realized on NI specimens are monitored by two traditional piezoelectric sensors with a bandwidth of 100 kHz to 1 MHz and a resonance peak of 300 kHz, which are bonded on the specimens. A coupling agent (silicon grease) is used between the sensors and the material surface. Only events recorded in the gauge length delimited by the two sensors (100 mm) were recorded. In the case of integrated materials, tests are monitored using the integrated sensors PIC255 (Figure 2).
For all configurations, the recorded AE events are registered with a sampling frequency of 5 MHz. During structure loading, the output of each sensor is amplified through a low-noise preamplifier with a 40 dB gain. It is used to amplify the signals received and to remove any extraneous noise. Signals are further processed by the AEwin software. Pencil lead break tests are performed before each test. The role of these tests is to verify that the system is functioning properly and also to define an amplitude acquisition threshold. This parameter is set at 38 dB during the static tests and 45 dB during the fatigue tests.
The threshold parameter allows to avoid all detection of parasitic signals coming from the test machine or other external sources (noise). The AE data are dependent on temporal acquisition parameters, namely: PDT (Peak Definition Time), HDT (Hit Definition Time) and HLT (Hit Lockout Time). These temporal parameters are set to: PDT = 50 μs, HDT = 100 μs and HLT = 200 μs.
The AE data is processed with NOESIS.
41
The K-mean algorithm
42
is used for unsupervised pattern recognition for classifying processes. Five temporal parameters are selected: amplitude, duration, rise time, number of counts to peak and absolute energy (Figure 3(a)). The k-mean algorithm was applied with Euclidian distance and a random initial partitioning. It was repeated several times with 1000 iterations each time, for a range of classes varying from two to seven. The accumulated acoustic data are separated into an optimal number of k clusters. (a) Characteristic of AE signals and (b) the Davies and Bouldin criterion R
ij
(D&B) with number of classes.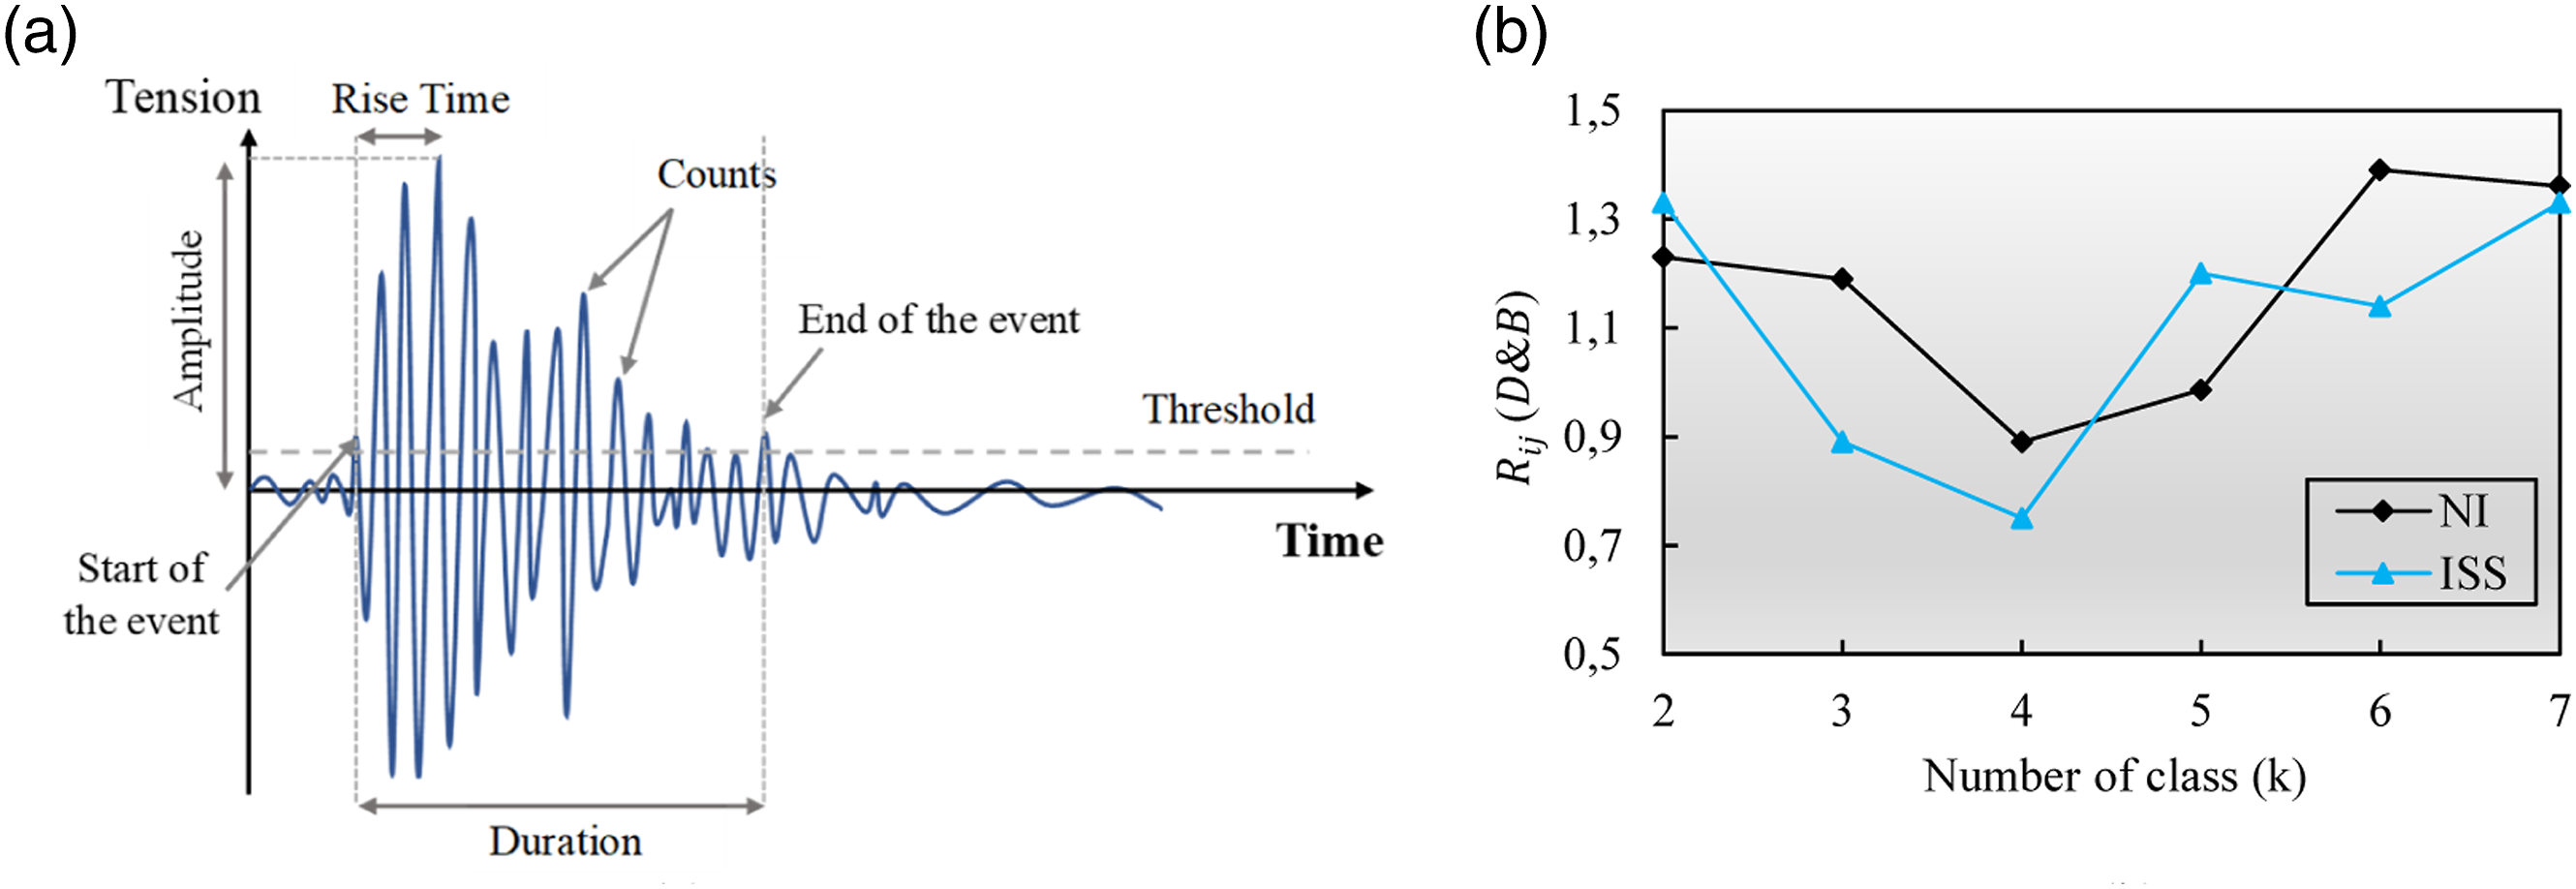
Before the application of the algorithm, data sets are normalized by the following transformation
After each application of the algorithm, an average value of the Davies and Bouldin criterion Rij (D&B)
36
is calculated using equation (2)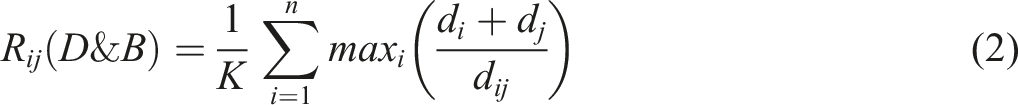
The optimal number of class k is the one that minimizes the average value of the Davies and Bouldin criterion
Results and discussion
Effects of the integrated piezoelectric sensor on the mechanical properties
Static tests
The results of the static tensile tests performed on the NI, ISS and ILS specimens are presented in Figure 4. These figures give the evolution of the stress versus strain for all specimens. Similar mechanical behavior is observed and characterized by the presence of two zones (Figure 4(a), (b) and (c)). Stress-strain curves: (a) NI specimens, (b) ISS specimens, (c) ILS and (d) the effect of the integrated sensors on the static behavior.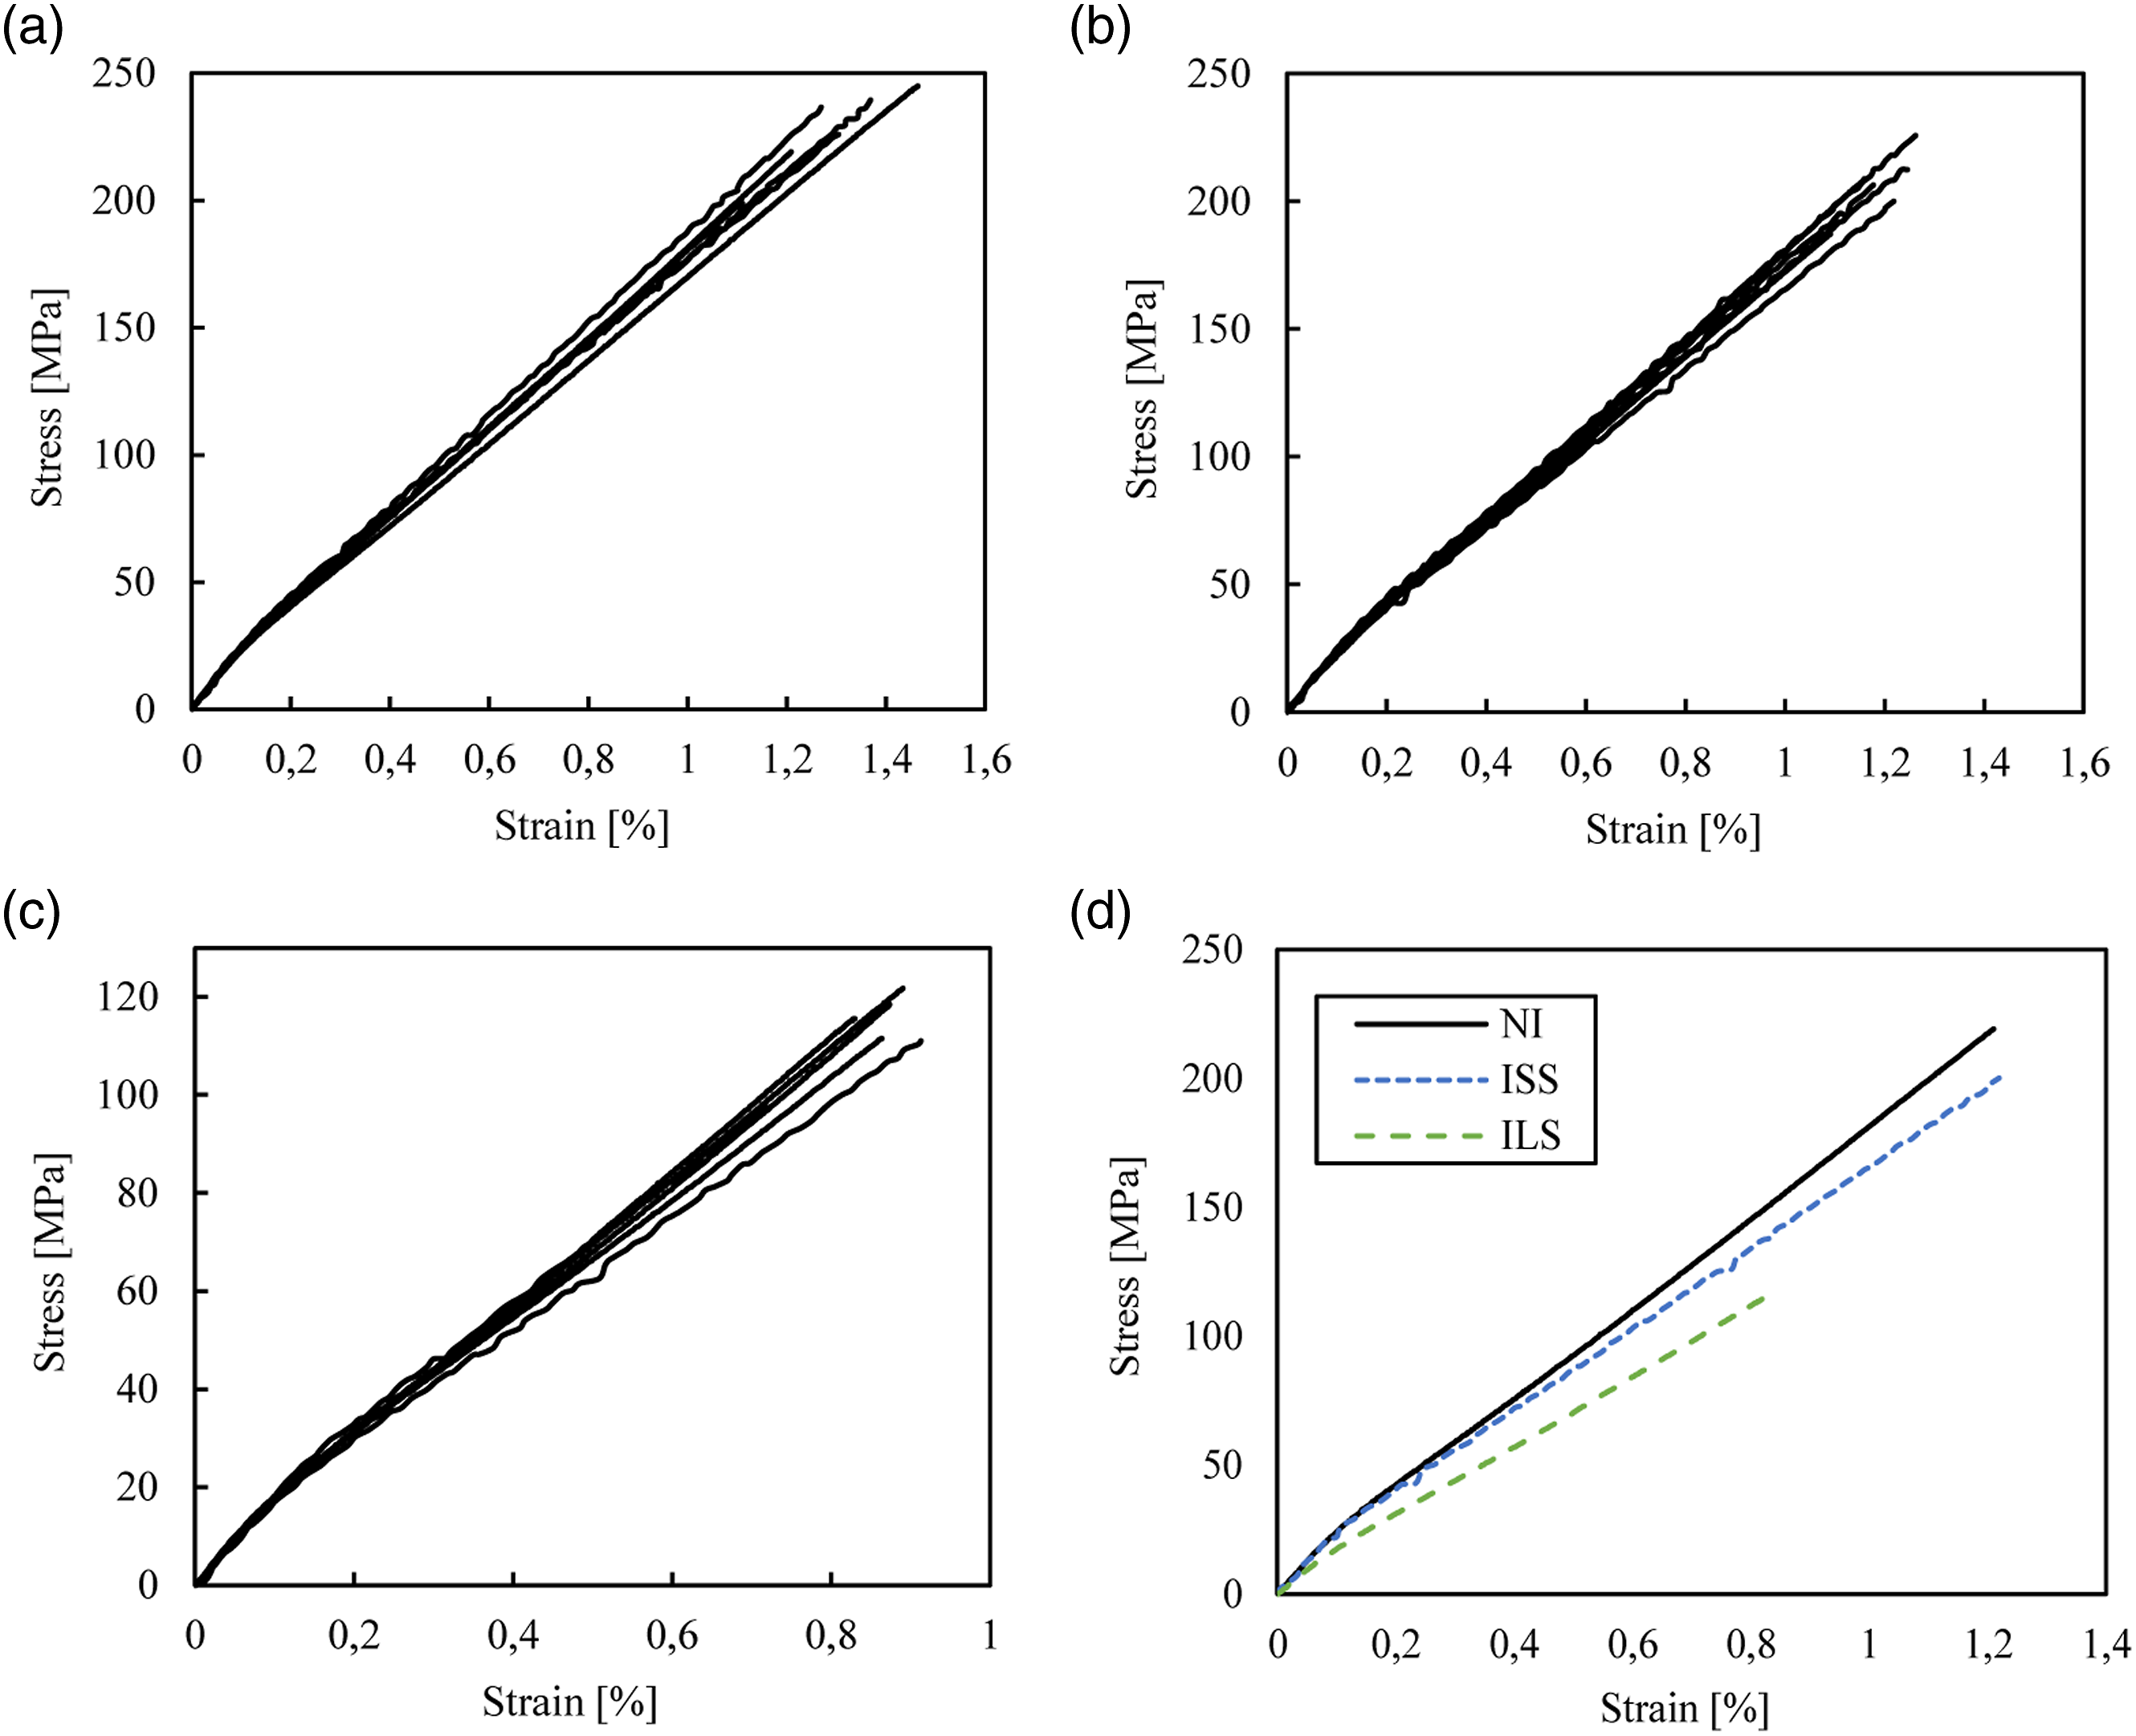
Mechanical properties of the different types of specimens studied (NI, PC and GC).
Fatigue results
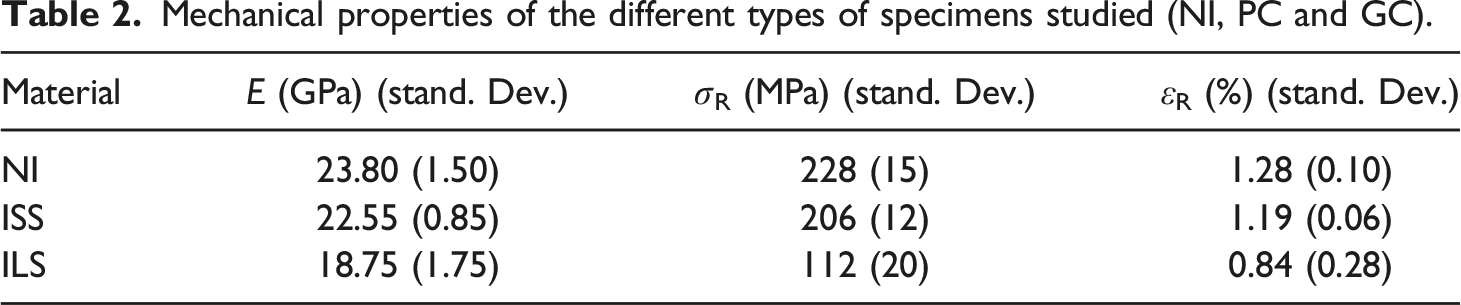
In fatigue tests, a loading level r = 90% is imposed for all specimens. During loading, the maximum displacement dmax according to the number of cycles is recorded. The stiffness is measured by the ratio of the initial maximum displacement and the maximum displacement at each cycle (d0max/dmax). The stiffness evolution versus the number of cycles for NI, ISS and ILS specimens is given in Figure 5 with a semi-logarithmic scale. All specimens tested in cyclic fatigue are broken before one million cycles. The analysis of the results shows that the specimens integrated with PZT sensor (ISS and ILS specimens) have similar fatigue behavior as that of specimen without integrated sensor (NI specimen). The stiffness loss takes place in three phases as follows: − The first phase: this phase is characterized by a sharp reduction of the stiffness during the first cycles of the fatigue life. This is due to the appearance and multiplication of microcracks in the composite during loading. In the case of the ILS specimen, this phase is more important than the other specimens. The ILS composite shows 15% of the stiffness loss at the first 100 cycles, while the ISS and NI specimens lose only 7%. − The second phase: the stiffness loss becomes progressive and quasi-linear. This phase corresponds the near total consumption of the fatigue life of the material and it’s characterized by a stable propagation of the damage mechanisms. − The third phase: a very short phase characterized by an acceleration of the stiffness loss just before the total failure of the specimens. This is due to the appearance of much more localized cracks such as the macro-cracks and fibers breaking leading therefore to the complete failure of the material. Normalized displacement versus number of cycles in fatigue tests for NI, ISS and ILS specimen.
The results show also that the complete failure of NI and ISS specimens occurs in the same order of number of cycles, while the ILS specimen survived a less fatigue cycle. This reveals the effect of the integrated sensor dimensions on the fatigue behavior of flax/Elium composites. The residual stresses in the cavity created by the large sensor have a significant influence on the lifetime and the mechanical characteristics of the material. On the contrary, the small sensor has a slight effect on the composite properties. Therefore, in the rest of the work, the AE tests are applied only on the NI and ISS specimens.
Damage analysis
Classification results
Static results
Figures 6 and 7 present the classification results of the AE signals detected during static tensile tests realized on specimens with and without integrated sensors (NI an ISS). Four classes are obtained from the different materials. Figure 6 presents the amplitude property of the time-based AE events, superposed with the evolution of the applied load. The results show a very small area of intersection between the four classes in the amplitude signal distribution. This confirms the use of five temporal parameters in the classification methodology. In addition, it can be seen that the damage evolution depends on the applied load level, which increases progressively until failure. During three-quarters of the time-tests (until 12 kN load), signals are characterized by an amplitude between 38 and 70 dB for NI and ISS specimens. Three classes A, B and C, with amplitude characteristics between [38 dB, 45 dB], [45 dB, 55 dB] and [55 dB, 75 dB], appear so early during the tensile tests and remain until the failure of the specimens. At high load (higher than 12 kN), the amplitude distribution becomes more important and it’s between 38 and 85 dB. At this load level, the events of class D are detected. This class contains very energetic signals with amplitudes higher than 75 dB.The occurrence of these signals is followed by the total failure of the specimen. Distribution of amplitude versus time of the AE classes detected during static tensile tests: (a) NI specimens and (b) ISS specimens. AE classification and analysis results under static tensile tests: (a) chronology of apparition of different classes and (b) PCA visualization.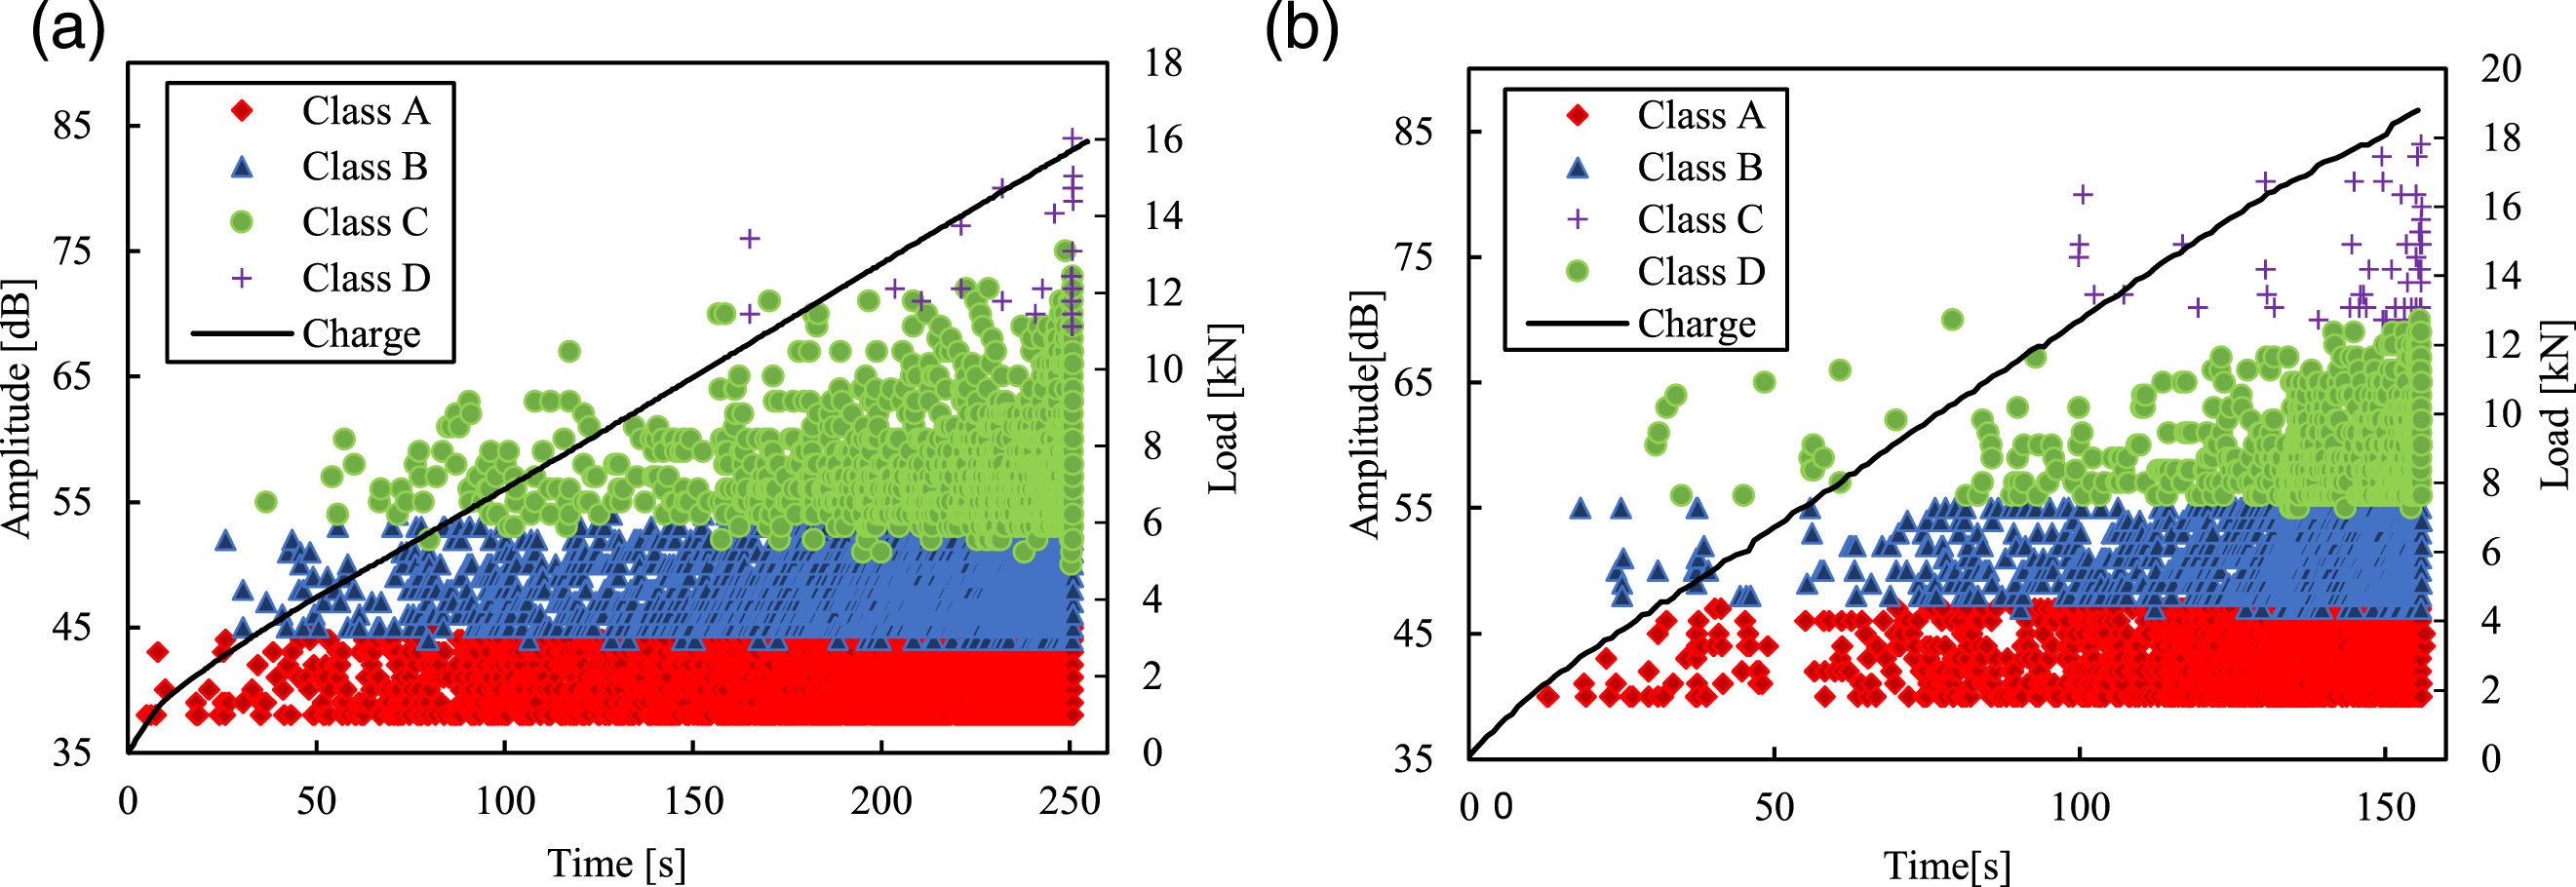
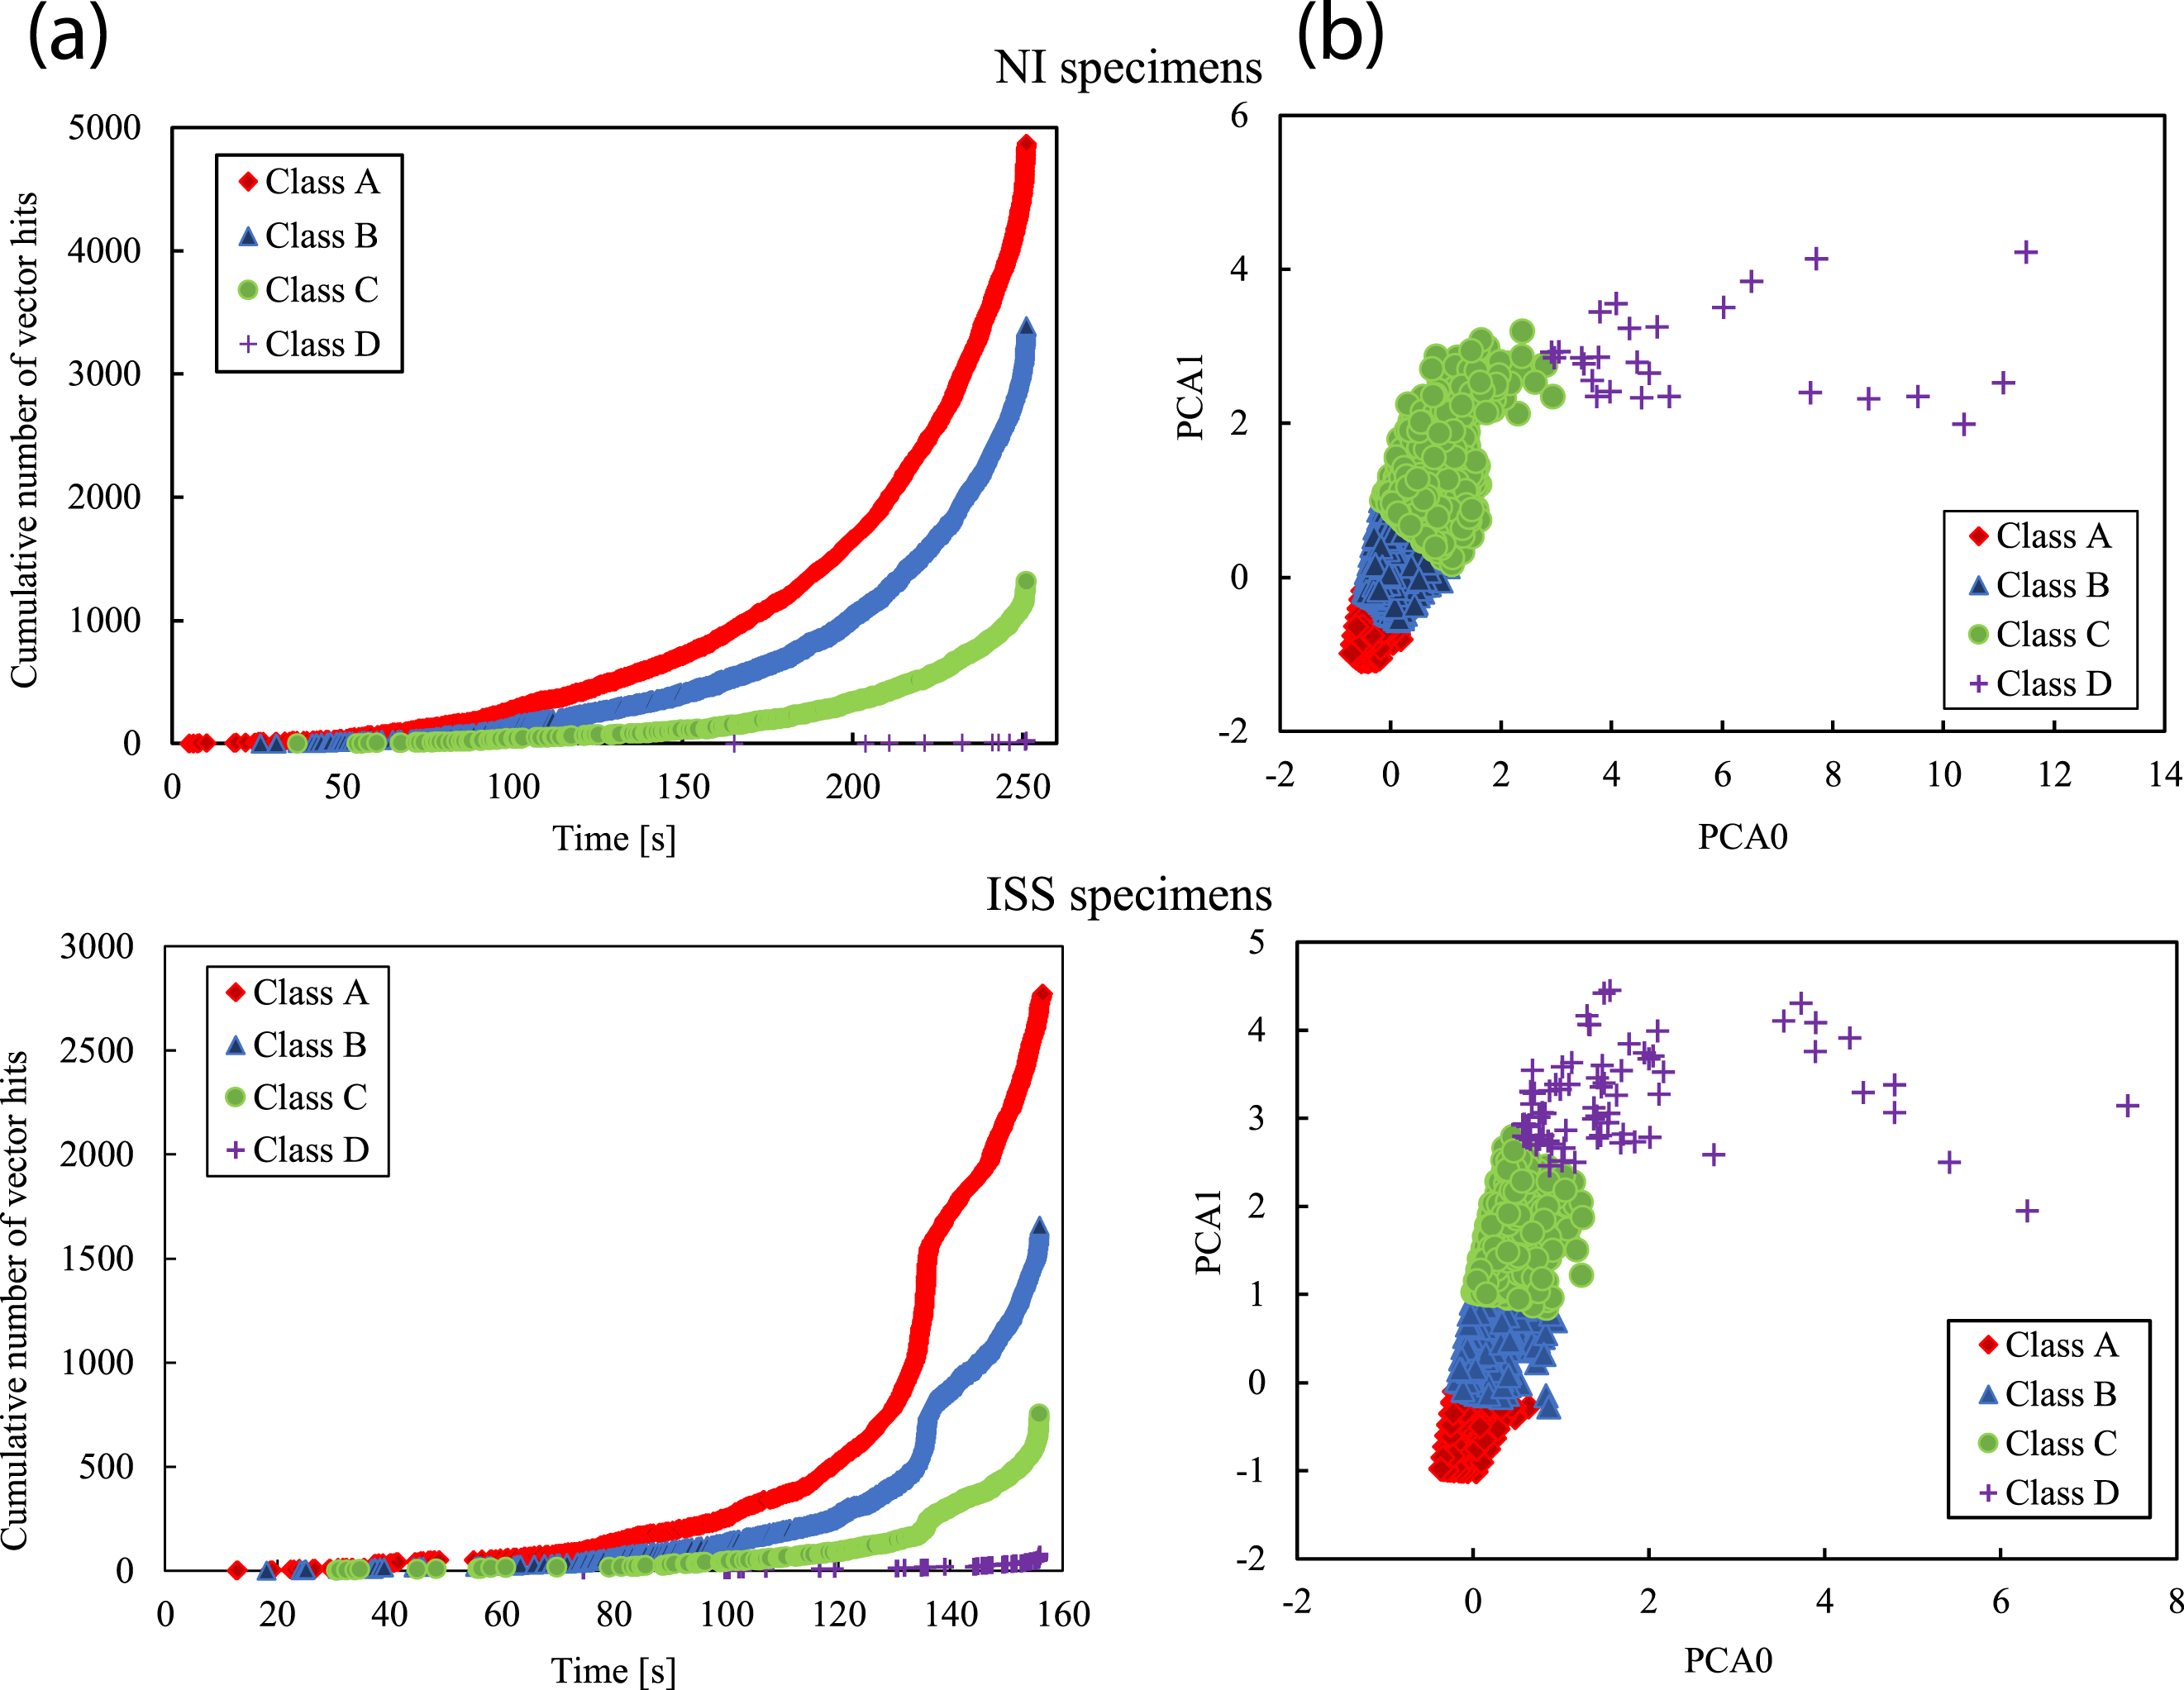
For each obtained class, the evolution of the cumulative number of vectors of hits versus the time is presented in Figure 7(a). It gives a good idea on the chronology of apparition of the acoustic signals. In addition, it allows to quantify and differentiate, in terms of weight, the damage mechanisms. For each material, the results show that the number of hits of each class detected increases progressively and propagates until the failure of the specimen. It can be seen also that the class A contains the most dominant signals that appear so early during the tensile test. However, the results show that class D presents events with a lower number of cumulative hits than the other classes.
The principal component analysis (PCA) is also carried out in order to take into account the possible separation or overlapping of the different classes. AE data are projected into the plane carried by the two principal components with the highest weight. This representation permits to visualize the results in a two-dimensional subspace, as shown in Figure 7(b). PCA analysis is an easy and acceptably accurate way of classifying the data. 43 The representation shows a clearer partition of the events in the PCA1 versus PCA0 plots. Most of the patterns are concentrated into four classes for the specimens with and without sensors (NI and ISS).
In order to compare the AE data detected by the integrated sensor (ISS specimens) and those collected by the traditional sensors fixed on the material surface (NI), the statistical spread and the average properties of the four classes are determined and presented in Figures 8 and 9 respectively. Statistical dispersion of the AE classes for every classification feature. (a) Amplitude, (b) absolute energy, (c) duration, (d) rise time and (e) counts to peak. Average properties of AE classes according to the five selected features.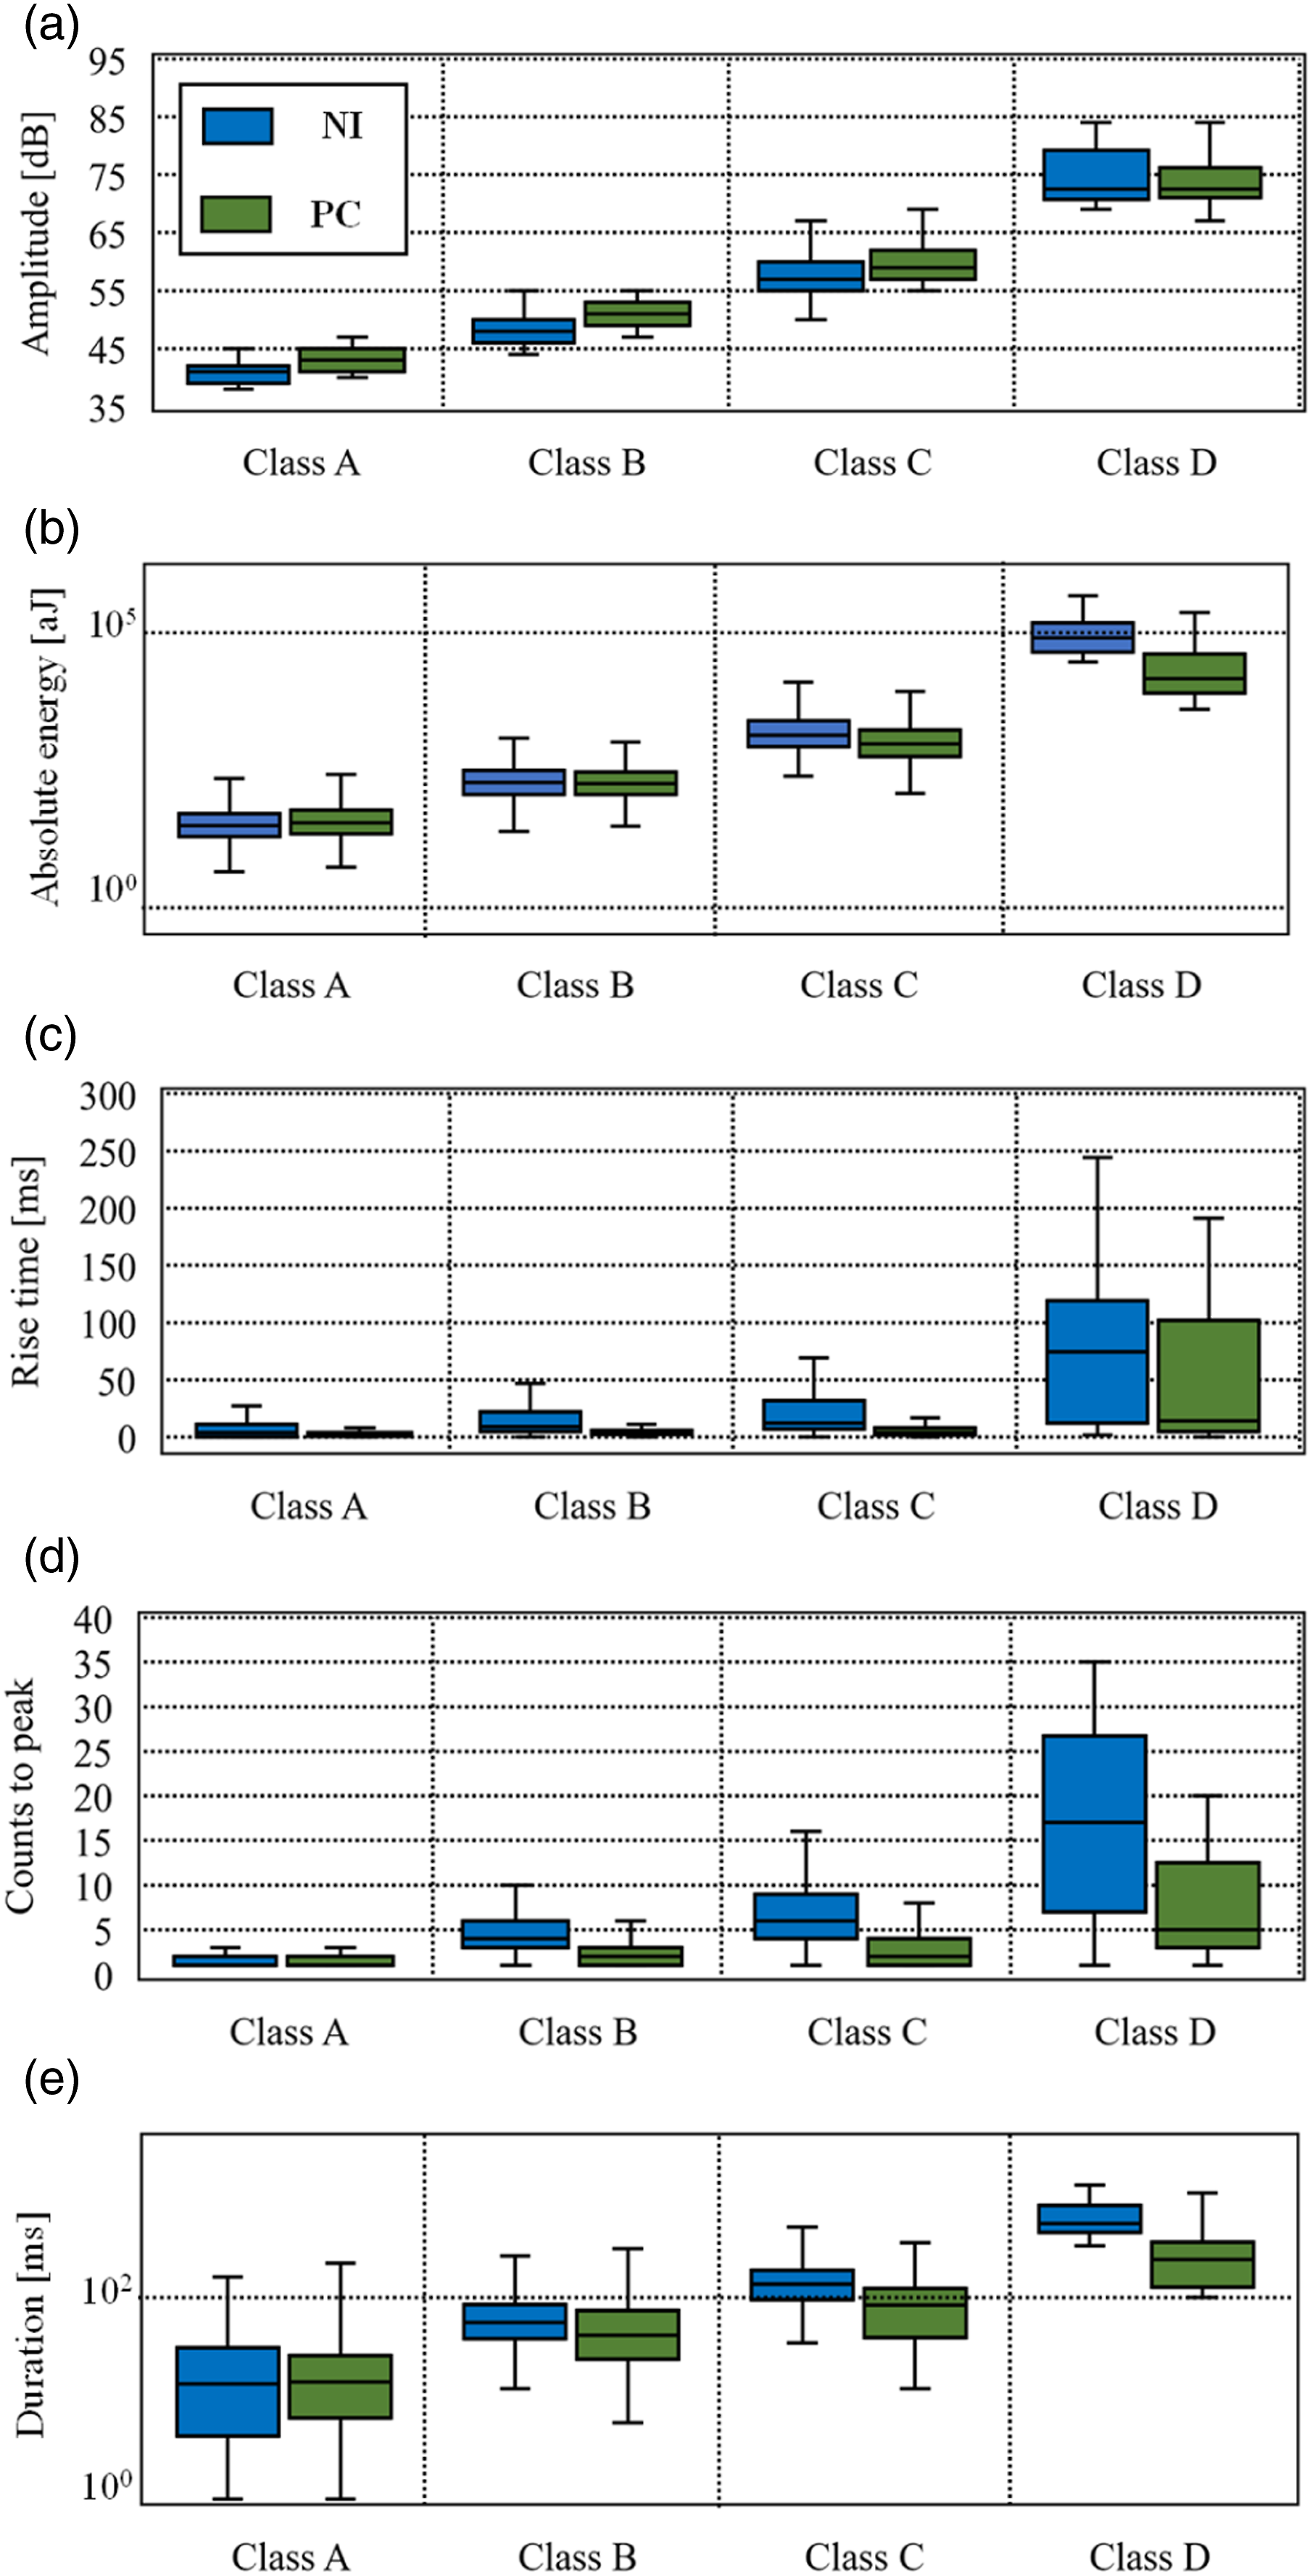
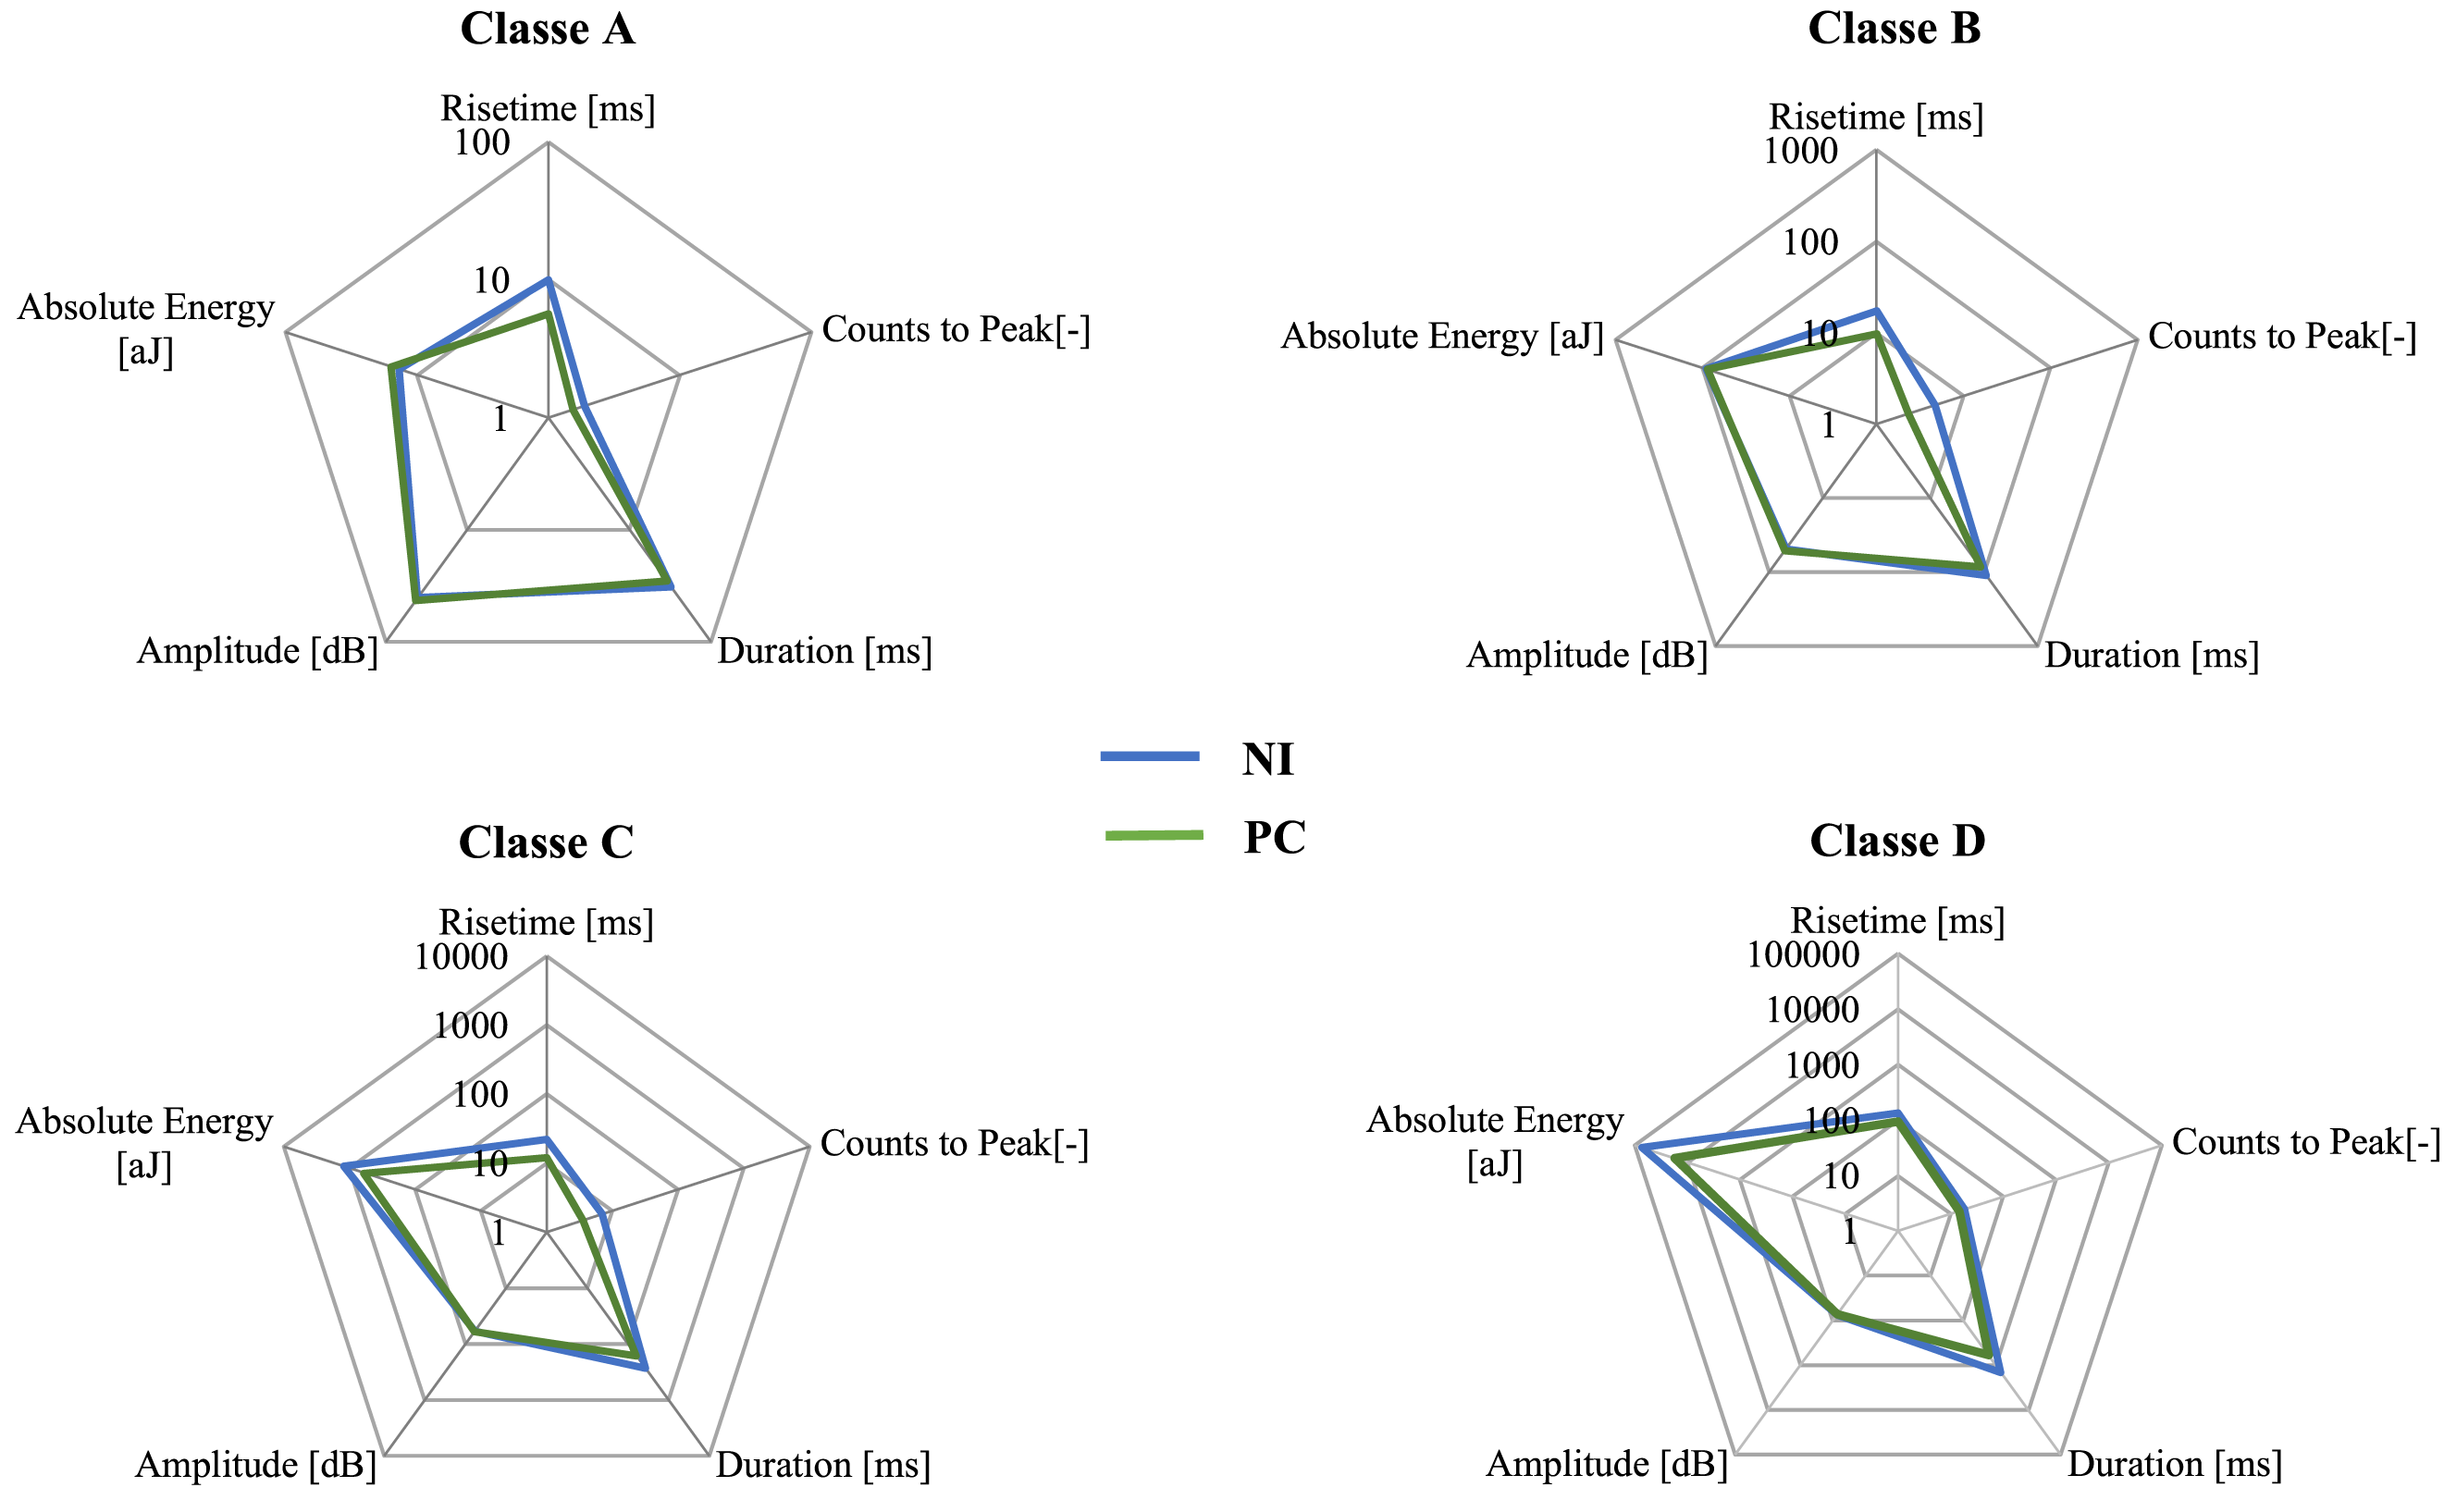
Figure 8 shows box and whisker plots for the five chosen classification features with respect to the four AE classes for all materials (ISS and NI). The borders of the box correspond to the first quartile q1 and the third quartile q3. The second quartile q2 is the median and correspond to the line cutting through the box. The whiskers indicate the lower and upper values located in the interval [q1–1.5 (q3–q1), q3 + 1.5 (q3–q1)]. Values outside this interval, considered as outliers, are not printed. The results show that classes A, B and C present quite similar statistical characteristics for the two specimens NI and ISS. Class D, which appears just before the complete failure, presents more differences regarding the number of counts to peak. This parameter is very sensitive to undesired signals which may not have been fully filtered by the timing acquisition parameters.10,18 Thus, this irregular dispersion is probably related to the extreme values of the classification parameters.
Figure 9 reports the average values of the five selected features for the specimens with and without integrated sensor (NI and ISS materials). The radar chart shows clearly that the acoustic signatures can be attributed to each class. For each specimen’s, the average values of the amplitude, absolute energy, rise time, counts to peak and duration are very similar. Therefore, the class A (same classes B, C and D) detected by the integrated sensor corresponds obviously to the class A (same classes B, C and D) collected by the traditional sensors fixed on the material sensors. This result is particularly important in order to identify the acoustic emission signature to the damage mechanisms.
Fatigue rests
Damage monitoring using AE is also applied during the fatigue tests until specimen’s failure. The tests are performed at a loading ratio about 65% of maximum tensile stress measured by static tests. The classification results of the AE events detected during fatigue test are reported in Figure 10. They present the amplitude distribution and the number of vector of hits evolution versus number of cycles of the AE data. The results show, as in the case of static tests, four classes are detected for both composites NI and ISS. It can be seen a very small overlapping domain between the four classes in the amplitude signal distribution. However, each AE class can be defined by an amplitude range. The results allow perceiving a first-class A with a high number of events and an amplitude characteristic between [45 dB, 50 dB]. A second-class B that occurs between [50 dB, 65 dB] and a third-class C appears with amplitudes between 60 and 75 dB. Then a fourth-class D that present the lowest acoustic activity during fatigue cycles and the highest amplitude (greater than 75 dB). AE classification and analysis results under fatigue tensile tests: (a) Amplitude of the events and stress versus time and (b) chronology of appearance of different classes.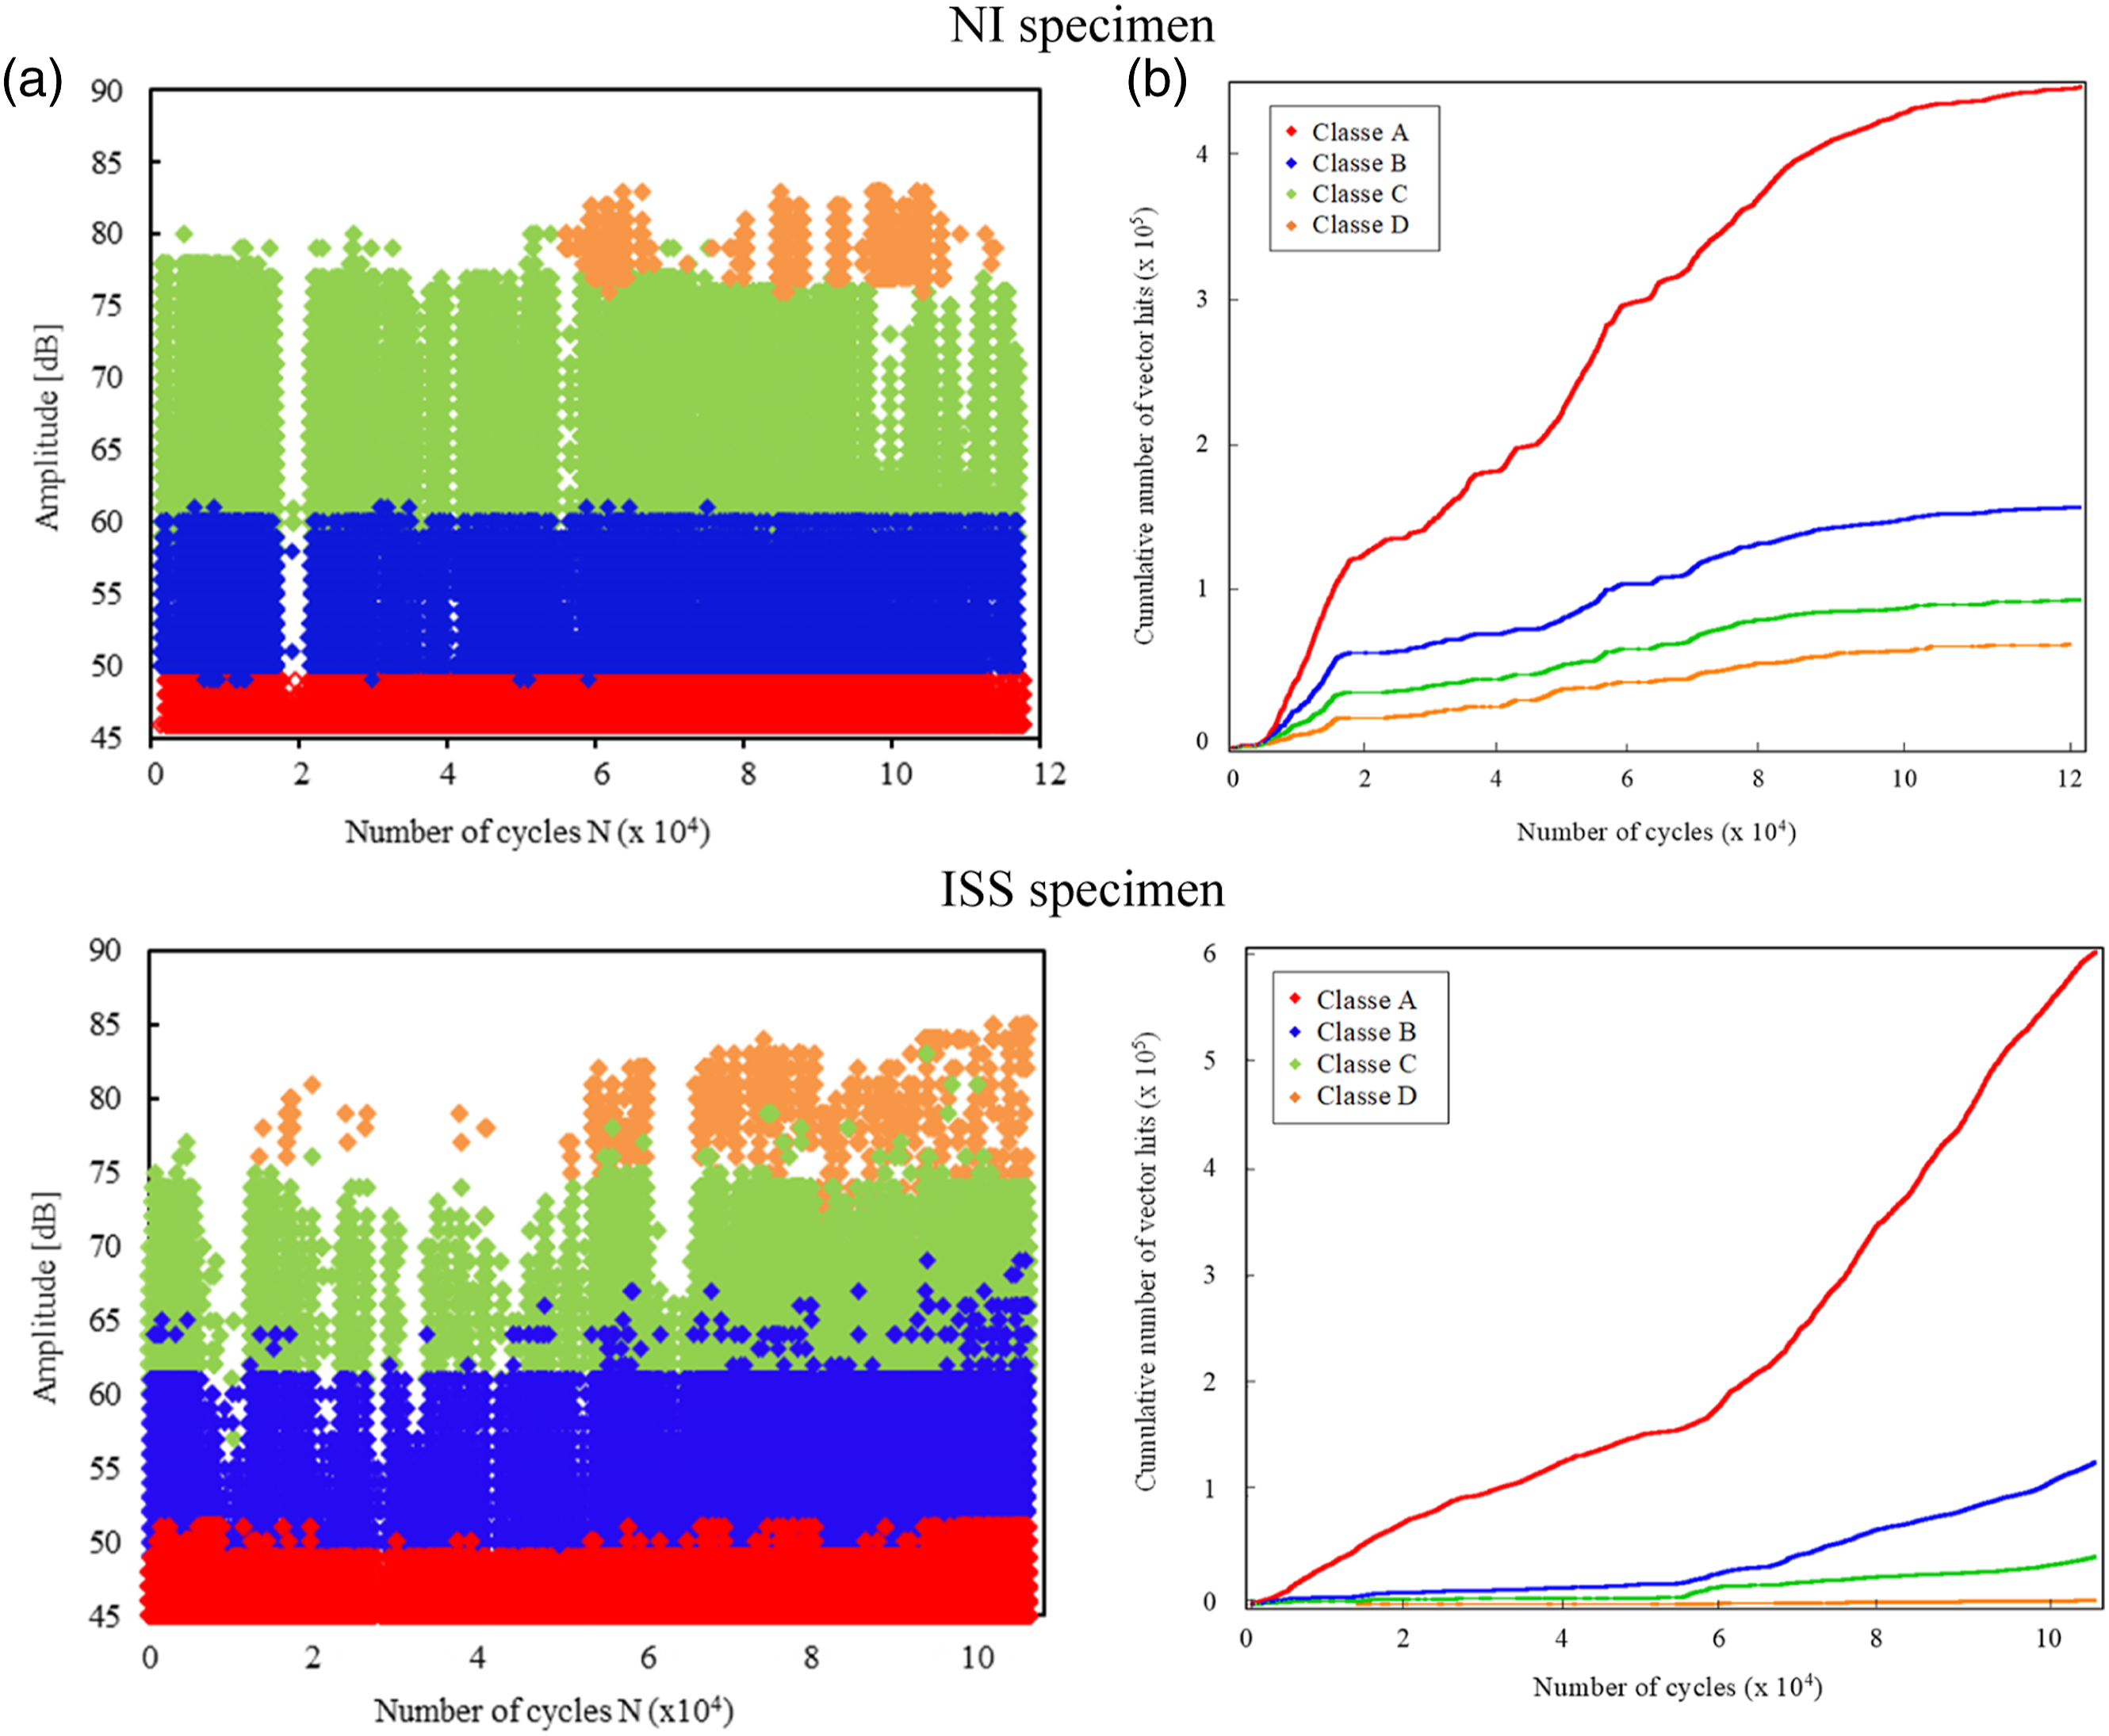
Macroscopic and microscopic analysis
Figure 11(a) presents the two kinds of specimen (NI and ISS) after breakage. At the macroscopic scale, it can be seen that the two specimens show similar failure mechanisms. The specimens (NI and ISS) failed linearly along the longitudinal direction. Initial cracks a few millimeters long are observed, followed by an evolution of long cracks along the loading direction. In fracture zone, a whitening of the material is noticed. It is related to a strong plasticization of the Elium resin. In this zone, fiber/matrix debonding and fibers pull-out are observed. Regarding the failure profile of the ISS specimens, it can be noticed that the fracture zone appears far from the integrated sensor position. This confirms that the sensor does not contribute to the damage mechanisms propagation. Figure 11(b) presents the integration area of the piezoelectric sensor within the composite. It shows a good composite/sensor adhesion and characterized by high interfacial properties. The integration area of the piezoelectric sensor is not damaged and no cracks are observed. (a) Breakage profiles of the NI and ISS specimens and (b) Macroscopic observations of the integrated sensors position.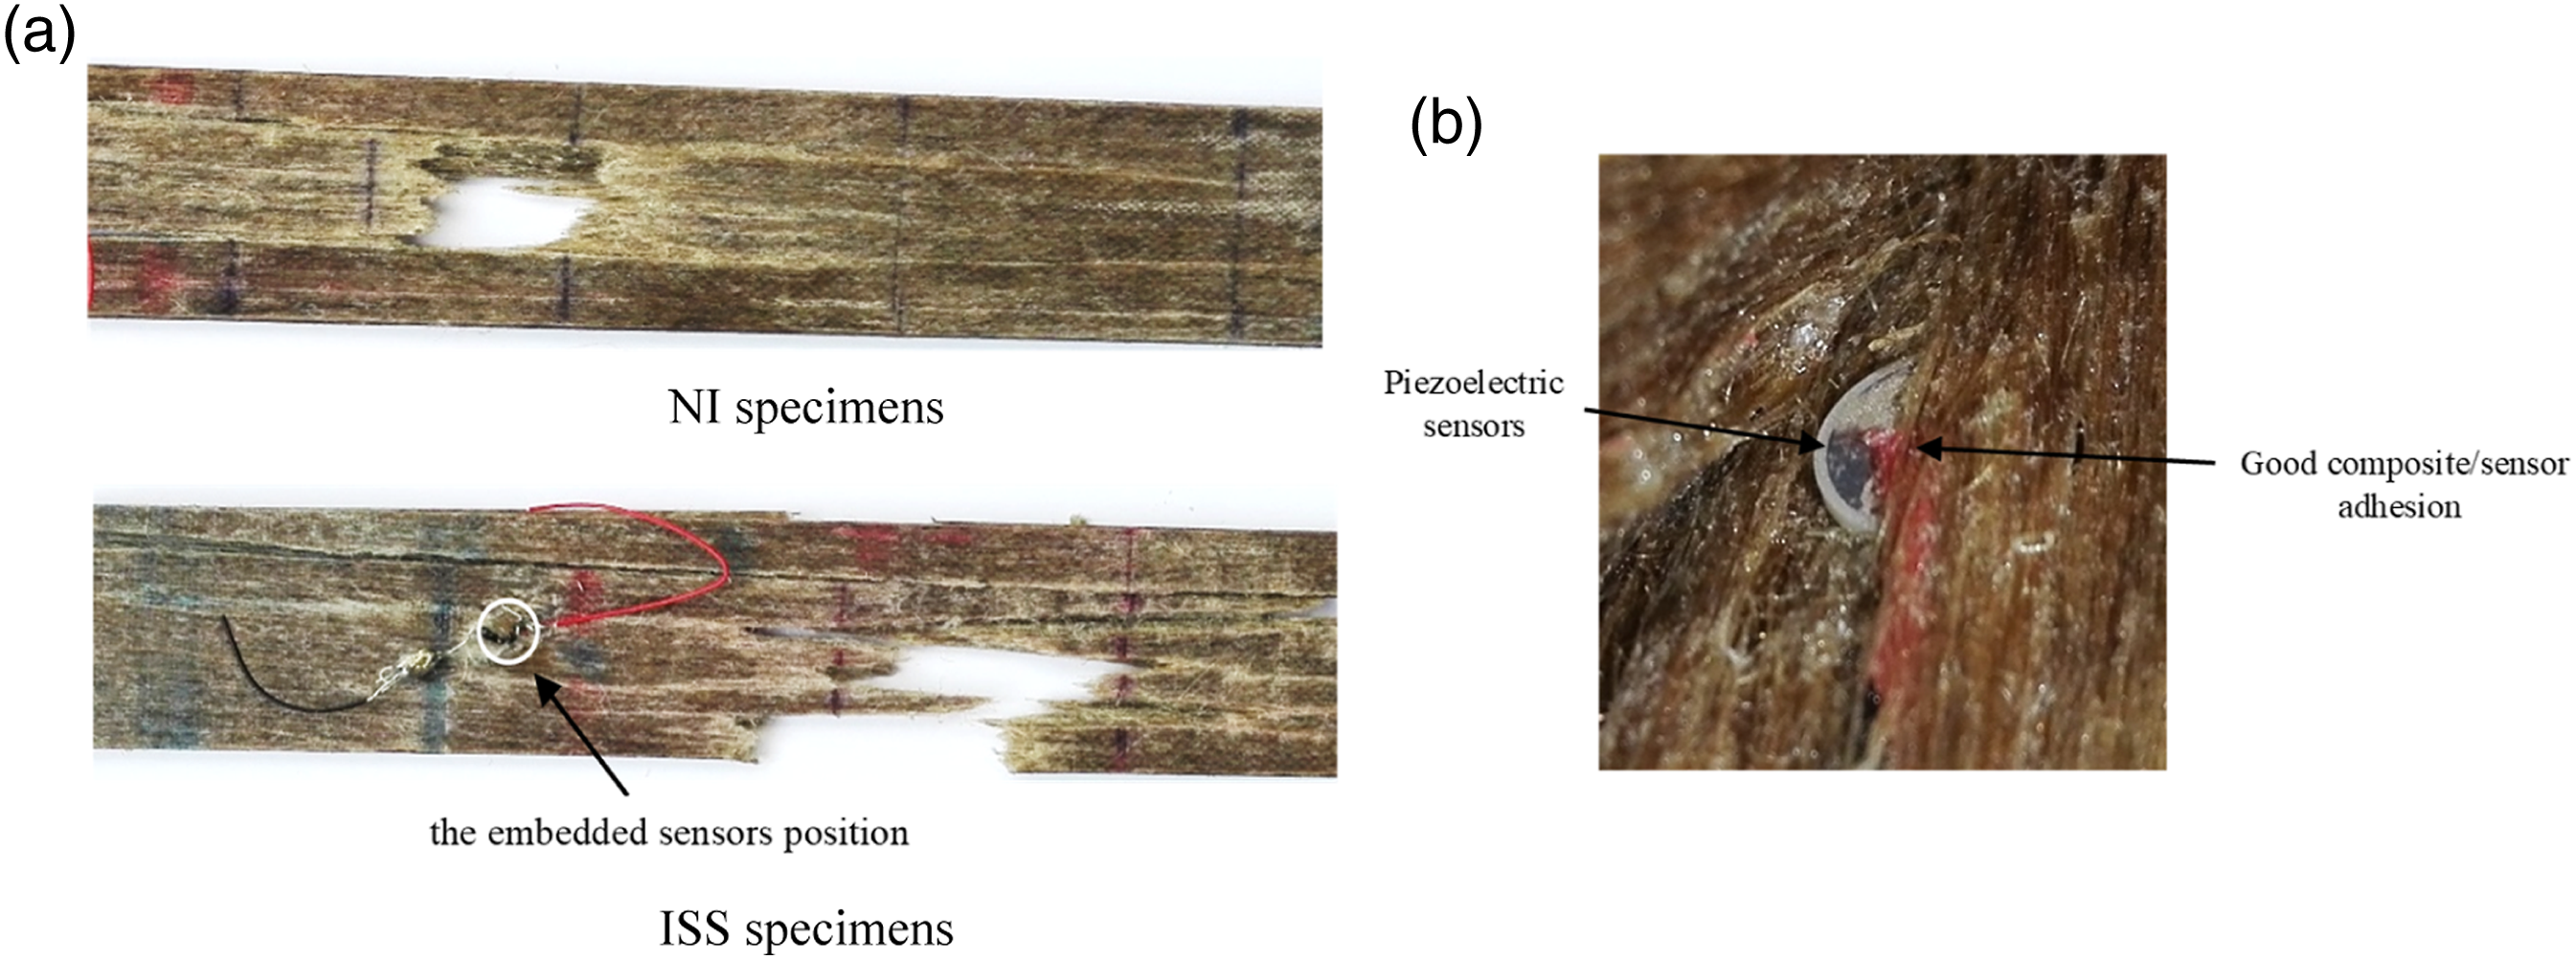
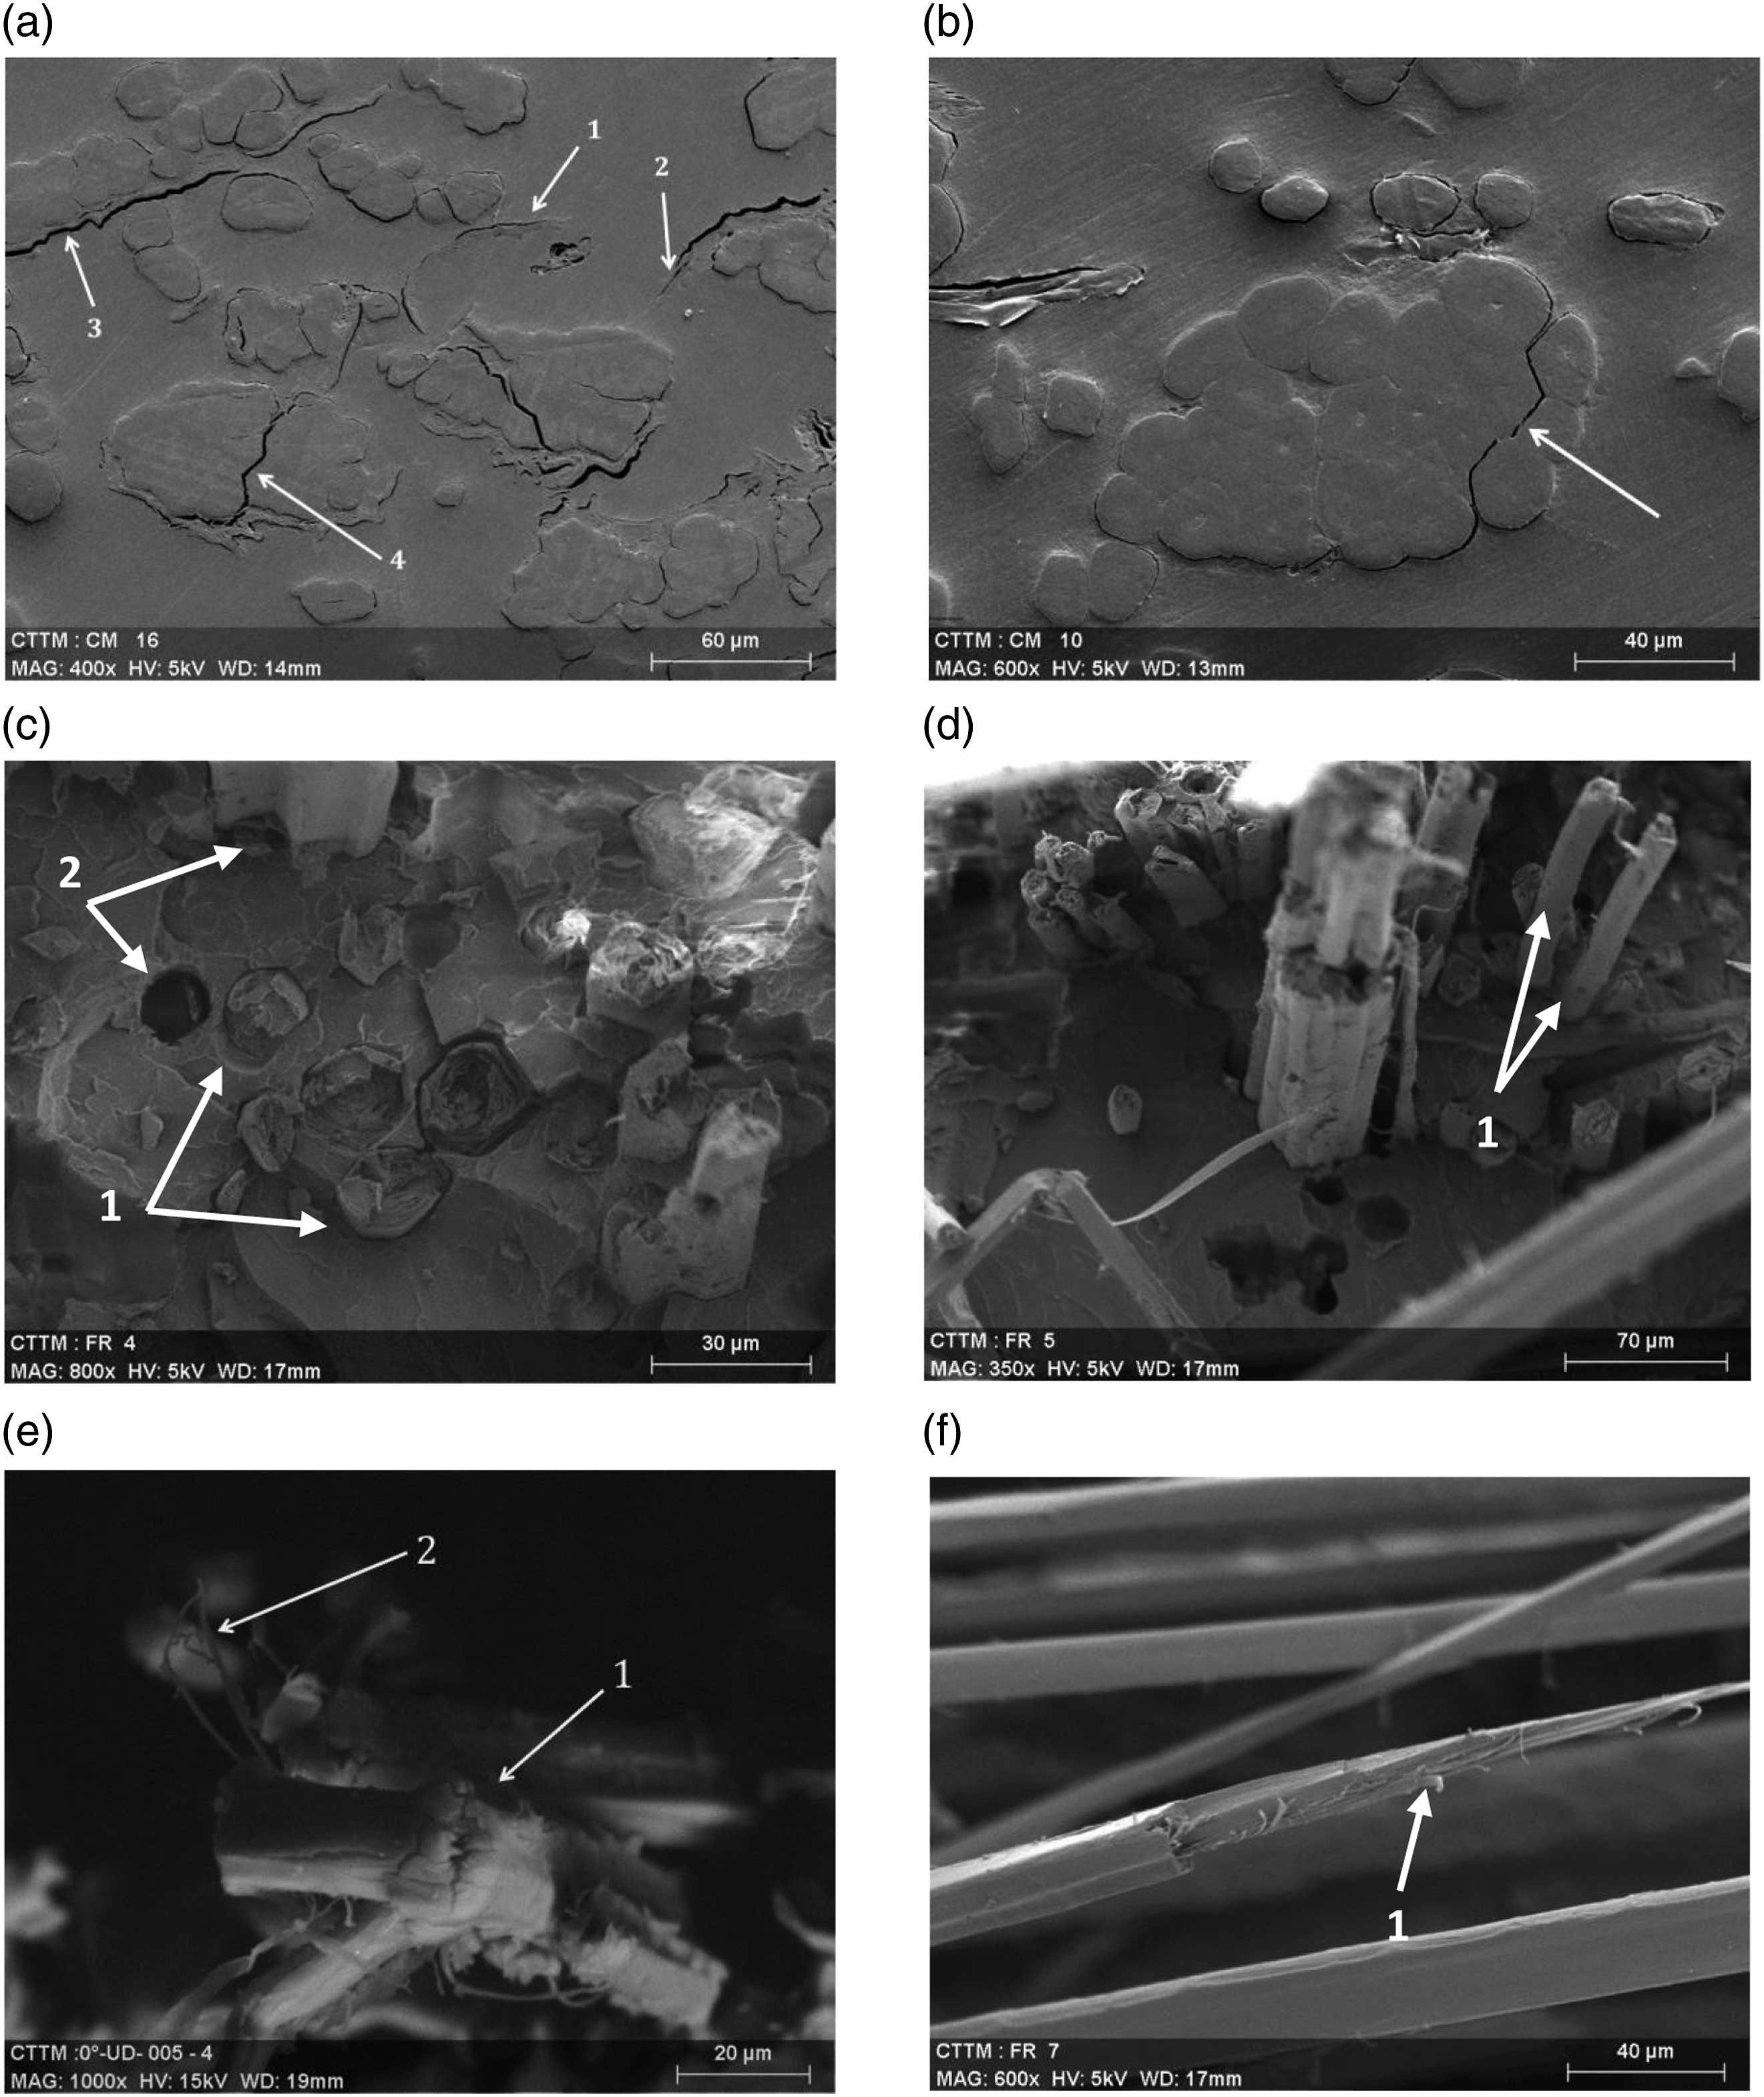
At the microscopic scale, several microscopic analyses are performed at the LAUM laboratory on failure profile of flax/Elium composite by scanning electron microscopy (SEM) by Monti et al.
18
(Figure 12) They provide an insight on the exact defect in the material. First of all, samples of UD-0 specimen loaded to 50% of the breaking load are analyzed in order to identify the first damage mechanisms occurring during the tensile test. Their observations show the appearance of cracks in the matrix (Figure 12(a) label 1). The SEM photos show also some unbounded interfaces, where the matrix cannot impregnate the fibers due to their very high density (Figure 12(a) Label 2). Several cracks in matrices are observed around them, but are quite hard to detect. Most of the time, they appear to be propagations of microcracks in the defects zone, which can be present in the matrix (inclusions, porosities). The propagation of microcracks in this zone can cause fiber/matrix interface debonding (Figure 12(a) Label 2). In addition, some broken fibre-matrix interfaces (Figure 12(a) label 3 and Figure 12(b)) are observed. Their observation shows also the appeance of cracks inside the fiber bundles (Figure 12(a) label 4). These observations are completed by several microscopic analyses of failure profiles. Some well separated fibers broken very close to the matrix are observed (Figure 12(c) label 1), indicating that the fibre-matrix interface is good for elementary fibres. Several pulled-out fibers are also present in the failure profiles (Figure 12(c) label two and Figure 12(d) label 1). Complex defects at the fiber scale (Figure 12(e) and (f)) are also observed such as peeled fibers and torn fibers. SEM observations of failure profiles and micrographs: (a) and (b) micrograph of a specimen loaded to 50% of the failure load and (c)–(f) SEM views of different breakage profiles.
18
Identification results
The AE classification, already shown, is obtained using the K-mean method which is an unsupervised pattern recognition algorithm. It offers the best separation of data with regard to mathematical considerations, without really taking physics into account. The results show the appearance of four classes during static tensile tests carried out on specimens without and with integrated sensors (NI and ISS) (Figures 6 and 7). According to the literature,18,44 each class corresponds to a damage mechanism: matrix micro-cracking (class A), fiber/matrix debonding (class B), fiber pull out (class C) and fiber breakage (Class D). Figure 13 present the typical waveforms of each damage mechanism detected by the integrated sensors. The AE signals induced by the matrix micro-cracking (class A) are characterized by a waveform with slow rise time, low amplitude, and low energy. This damage mechanism favors the appearance of the fiber/matrix debonding (class B) characterized by higher amplitude, higher energy, and higher rise times but shorter duration. Interface debonding usually causes acoustic emission events with amplitudes higher than those of matrix cracking.
45
Typical waveforms of AE classes obtained by the integrated sensor: (a) Class A: matrix micro-cracking, (b) Class B: fiber/matrix debonding, (c) Class C: fiber pull out, and (d) Class D: fiber failure.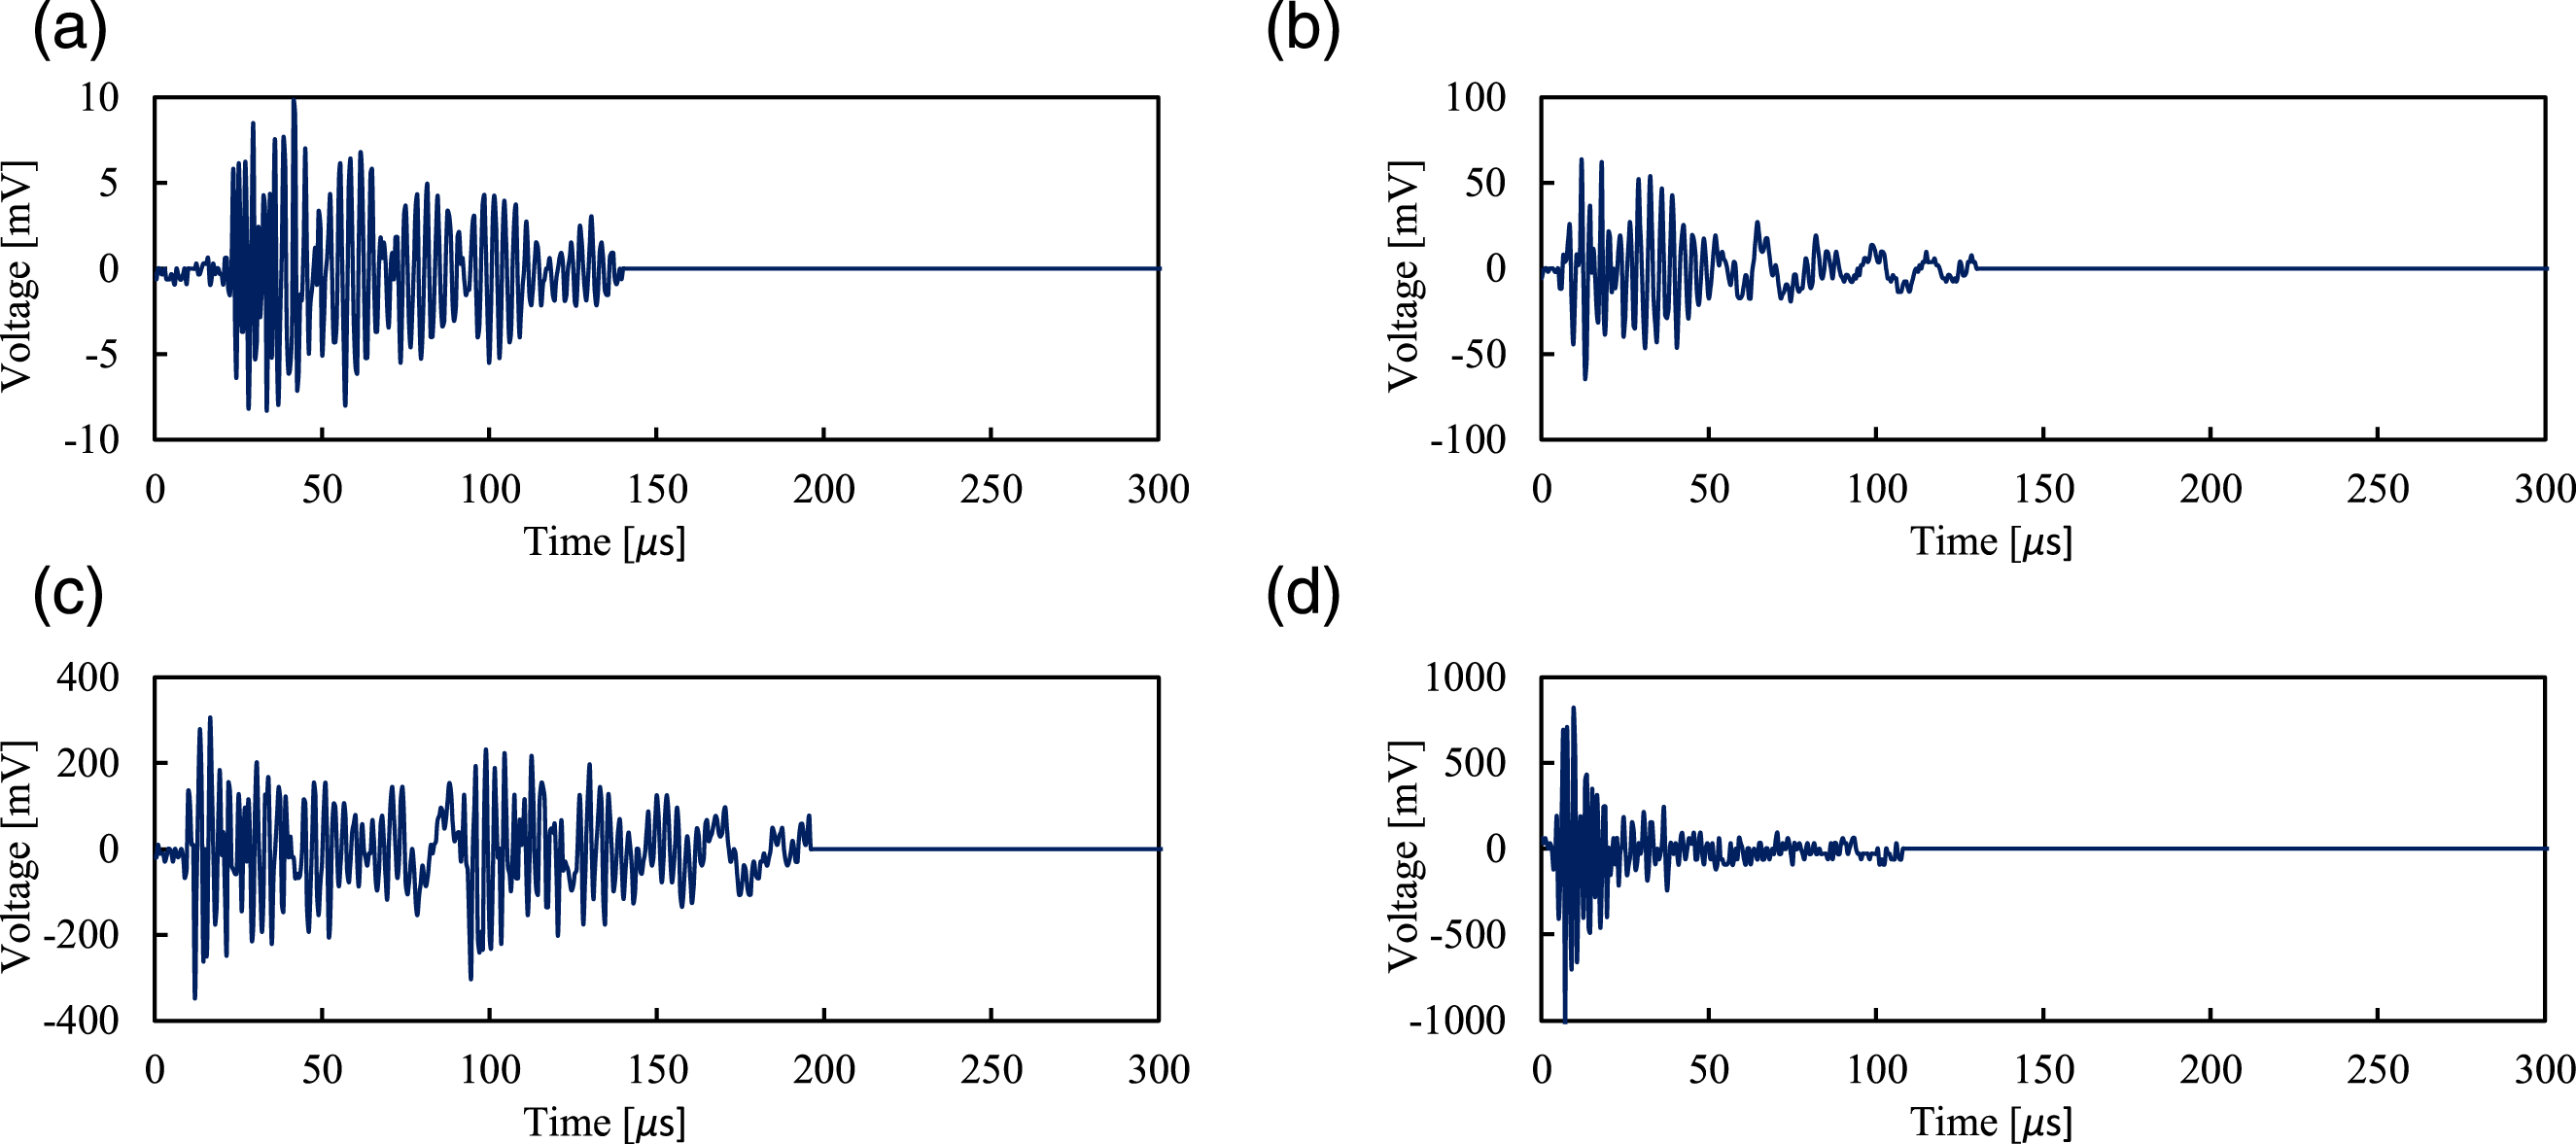
The AE signals created by fiber pull out (class C) are characterized by a higher amplitude, higher energy and higher duration. Finally, the fourth-class D, which is attributed to fiber breakage, contains very energetic signals with amplitudes higher than 75 dB and appear for higher stress values. Waveforms in this class are characterized by the highest amplitude, short rise time, short duration and greater energy compared to classes A, B and D. The appearance of these types of damage mechanisms announces imminent specimen rupture.
During the fatigue tensile tests, the results show that the acoustic activities take place in three phases (Figure 10). The first phase is characterized by a high rate of acoustic activity related to a significant reduction in stiffness (Figure 5). This activity corresponds essentially to the initiation and the multiplication of micro-cracks (class A). Fiber/matrix debonding (class B) and fiber pull out (class C) appear also in the first phase but with lower activity. It can be seen also from Figure 10, unlike in static tensile test, the fiber breakage (class D) appears from the first stage but with the lowest activity. In the second phase, a progressive propagation of the damage mechanisms is observed during almost the whole test duration. This phase corresponds to a progressive decrease of the stiffness material. Finally, the third phase appears for high numbers of cycles. In this phase, the acoustic activity follows the acceleration of the stiffness loss just before the total failure of the specimens. Indeed, macro-cracks, fiber/matrix decohesion’s and more intense fibers breakages are developed which announces the total rupture of the composite. It can be seen from Figure 10 that the hits resulting from matrix cracking (class A) and fiber-matrix debonding (class B) are widely greater than hits generated by other mechanisms (Class C and D). During the cyclic loading, the fiber matrix adhesion or the weak interfacial properties are considered as an important factor that contributes to damage propagation. In fact, the fiber/matrix debonding and frictional sliding develop upon crack extension, however, the fibers remain relatively intact during crack propagation in the matrix. 46
The identification of the acoustic classes proposed in our study can be justified by the works carried out in the LAUM laboratory by Monti et al. 18 and Haggui et al. 44 on damage mechanisms analysis of a flax/Elium composite by acoustic emission. In addition, it can be justified by the works in the literature such as those of Bravo et al., 45 and Aslan et al. 47 on the acoustic properties of the main damage mechanisms detected in composites reinforced with natural flax fibers.
Regarding the previous observations, it appears that the acoustic activities detected by the integrated sensors show slightly different from those detect by the traditional sensors fixed on the material surface. For example, the number of acoustic events detected during fatigue tensile tests is about of 7 × 10⁵ and 7.3 × 10⁵ for the NI and ISS composites respectively. The integration of the piezoelectric sensor within the material shows good results regarding class detection and separation. This confirms that the in-situ SHM methods performed on bio-composites presents an excellent alternative to the conventional technique in which sensors bonded to the surface are used.
Conclusion
This experimental study investigated an in-situ health monitoring of a thermoplastic composite reinforced with flax fibers using the AE technique. Static and fatigue tensile tests are carried out on the manufactured specimens with and without integrated sensors. The results show that the dimensions of the integrated sensor have a significant influence on the mechanical behavior of the composites. The integration of the large sensor (diameter 10 mm and thickness 1 mm) causes a significant degradation on material properties. However, the results show a slight effect of the small sensor (diameter 5 mm and thickness 0.5 mm) on the mechanical behavior compared to that without integrated sensor. Therefore, only the small sensor is used for in-situ health monitoring of flax/Elium composite.
The tests realized on specimens without integrated sensor are monitored by two traditional piezoelectric sensors fixed on the material surface. The detected AE data are processed using an unsupervised algorithm based on five classification parameters: amplitude, absolute energy, duration, counts to peak and rise-time. Four classes of damage mechanisms are obtained (matrix cracking, fiber/matrix debonding, fiber pull out and fiber breakage). The integration of the PZT sensor within the material shows good results regarding class detection and separation. This confirm that the in-situ health monitoring methods performed on bio-composites presents an excellent alternative to the conventional technique in which sensors bonded to the surface are generally used. The major advantage of this method is the real time health monitoring of the structures. In addition, the integration of sensors within the material can protect it from the service environment thanks to its encapsulation, which can improve the durability of the measurement devices.