
Abstract
The current study was aimed to design a thiolated chitosan (TC) based mucoadhesive nanoparticle (NP) formulation for enhancing the oral bioavailability of an anti-coagulant, Ticagrelor (TG). Nanoparticles (NPs) containing naturally occurring biodegradable polymers have been revealed as promising carriers for the controlled delivery of various therapeutic agents through the oral route. Ionic gelation technique was adopted to prepare thiolated chitosan nanoparticles of TG (TCNPs/TG) and chitosan (CH) nanoparticles of TG (CHNPs/TG) by varying the concentration of polymers with respect to TG and cross-linker i.e. tripolyphosphate (TPP). The prepared CHNPs/TG and TCNPs/TG were subjected to assessment for their particle size, the zeta potential, shape and morphology along with loading capacity (LC) and entrapment efficiency (EE). Formed TCNPs/TG showed a particle size of 190.3 nm, zeta potential of 16 mv along with the polydispersity index (PDI) of 0.375 as compared to CHNPs/TG, displaying particle size of 147.3 nm, zeta potential of 22.6 mv and PDI of 0.364. Likewise, during Fourier transform infrared spectroscopy (FTIR) analysis, the emergence of a characteristic peak at 2495 cm−1 in TC, has confirmed the successful modification of CH. Moreover, in-vitro drug release studies have disclosed a good sustained release behavior of the drug, both from CHNPs/TG and TCNPs/TG. However, the in-vivo pharmacokinetics have illustrated the superiority (p < .05) of the TCNPs/TG (494.96 ng/mL) over the CHNPs/TG (438.73 ng/mL) in terms of bioavailability. Ultimately, the findings have indicated that TCNPs/TG might help to improve the oral bioavailability of TG and hence, its therapeutic effects.
Keywords
Introduction
The oral route of drug administration is the most preferred method of drug delivery due to various advantages it exhibits including safety, convenience, good patient compliance and ease of ingestion. However, due to some reasons it can be an inefficient and troublesome mode of delivery for many drugs. 1 It is well known that from biopharmaceutical classification system (BCS) candidates, class II and class IV drugs face solubility (Class II) and permeability (Class II and IV) related issues, because of which their bioavailability is poor. Low aqueous solubility is one of the major problems confronted during the formulation development of new chemical moieties. 2 Recent research trends are focused on improving the oral bioavailability of drugs by utilizing various solubility and permeation enhancing techniques such as size reduction and solid dispersion technique, polymeric nanoparticle and micellar technology, liposomal encapsulation approach, bioadhesive polymer approach etc. 3 Bioadhesion is an interaction that results from the attractive forces developed between the mucoadhesive polymer and biological membrane surface, enabling it to stick tightly for a specific time. Nanoparticles composed of naturally occurring biodegradable polymers have been revealed as efficient drug delivery systems. 4 Chitosan (CH) is well known for its non-toxic, biodegradable and biocompatible nature. It acts as a penetration enhancer, as it opens the tight epithelial junctions by promoting paracellular as well as transcellular transport of therapeutic agents. 5 Recently, CH derivatives have been evolved as better candidates due to greater drug retention capability, enhanced permeation, improved mucoadhesion and sustained release of medicinal agents. 6 CH-based polymers include cyclodextrin complexes, quaternized CH derivatives, pegylated CH, thiolated chitosan (TC) and peptide derivatives of CH. Thiolation improves the mucoadhesive potential of CH by adhering tightly to mucosal epithelium via covalent bonding of muco-glycoproteins through thiol-disulfide linkage. 7 TC possesses other several dominant features compared to native chitosan such as solubility enhancement and cellular permeation enhancement due to improved mucoadhesion. The inclusion of the thiol group results in improved internal interactions, due to the formation of external and internal bi sulfide linkages, resulting in improved mucoadhesive potential. 6 It is widely accepted that by increasing viscosity of a formulation, its clearance can be limited; and by prolonging the contact time due to mucoadhesive interactions, its bioavailability can be enhanced. 7
Ticagrelor (TG), an anticoagulant agent used to treat the acute coronary syndrome, is a cyclopentyl-triazolo-pyrimidine, belonging to a class of chemically noncompetitive, reversible antagonists of the platelet P2Y12 receptor. TG possesses a very low aqueous solubility at all pH levels i.e. less than 10 μg/mL, and also has a low intestinal permeability, resulting in its low oral bioavailability. Hence, a mucoadhesive nanoparticle formulation has been developed to overcome such bioavailability-related issues and to enhance its anti-platelet activity. A comparative study was performed as well upon two nanoparticle fomulations, one containing chitosan based NPs (CHNPs/TG) and the other having thiolated chitosan based NPs (TCNPs/TG) of TG to assess which formulation displays enhanced mucoadhesion and oral bioavailability.8,9
Materials and methods
Materials
Low molecular weight chitosan, CH (100,000 g/mol, 75–85% deacetylated, 20–300cP viscosity) (Sigma Aldrich, USA), glacial acetic acid (GAA) (Merck, Germany), thioglycolic acid (TGA) (Sigma Aldrich, USA), ethyl 3-(3-dimethyl aminopropyl) carbodiimide hydrochloride (EDAC) (Sigma Aldrich, USA), hydrochloric acid (HCl) (Supelco, USA), sodium hydroxide (NaOH) (Sigma Aldrich, USA), sodium chloride (NaCl) (Supelco, USA), tripolyphosphate (TPP) (Sigma Aldrich, USA), methanol (Sigma Aldrich, USA), ethanol (Sigma Aldrich, USA), acetonitrile (Sigma Aldrich, USA), ammonium acetate (Sigma Aldrich, USA), potassium dihydrogen phosphate (KH2PO4) (Sigma Aldrich, USA), ammonium hydroxide (Sigma Aldrich, USA). Ticagrelor (TG) was given as a gift from CCL Pharmaceuticals, Lahore-Pakistan.
Modification of Polymer
Thiolation of CH was carried out by a previously reported coupling reaction [8]. Briefly, CH (500 mg) was dissolved in 50 mL of 1% Acetic acid solution. 100 mg of ethyl 3-(3-dimethyl aminopropyl) carbodiimide hydrochloride (EDAC), as a catalyst, was added in CH solution (to make final concentration of 125 m
Quantification of Thiol substitution by Ellman’s method
The modified polymer was assessed spectrophotometrically for the degree of thiol group substitution by using Ellman’s reagent. Ellman’s reagent (dithio bis nitro benzoic acid/DTNB) is used for quantification of free sulfhydryl (-SH) groups, due to its specificity for -SH groups at neutral pH. It reacts with free sulfhydryl groups and yields a mixture of disulfide and 2-nitro 5-thiobenzoic acid (TNB), indicated by the formation of a yellow-colored solution. Sulfhydryl groups can be estimated in the sample solution by simply comparing with a standard curve obtained by analyzing solutions of known concentration of sulfhydryl-bearing compound, such as TGA. Briefly, a 2 mg per ml solution of TC was prepared in deionized water. An aliquot of 250 μL of this conjugate solution was diluted with 250 μL of 0.5
Characterization of TC
FTIR spectroscopy
Fourier transform infrared spectroscopy (FTIR) spectra of pure CH and TC were recorded using a digital FTIR spectrometer (Bruker, Germany), covering a range of 500–4000 cm−1 and equipped with a diamond attenuated total reflectance (ATR) interferometer with a variable speed of 0.1, 0.2, 0.5, 1, 2, and 4 cm−1, with IR Beam diameter (from 2 to 11 mm). The IR spectra were collected with a spectral resolution (4cm−1) several times (10 times) and analyzed for molecular information about chemical structure. The average values of 10 scans for each sample were obtained to get precise results. The newly formed amide bond and thiol group substitution can be verified by the presence of specific peaks indicating amide bond formation and the presence of the thiol group. 10
Ex-vivo mucoadhesive strength
Modified polymer (TC) was subjected to mucoadhesion strength testing by using modified two pan physical balance method. The apparatus comprised of two pans. Three glass slides were taken and then one of the slides was attached to the bottom of one of the pans. The second slide was affixed to the base beneath that pan. The third slide was placed over the other pan to tare the balance. Freshly excised intestinal mucosa of rabbit was taken, washed with phosphate buffered saline, placed in 0.9% NaCl solution and used within 2 h. Intestinal mucosa was cut into 2 cm2 pieces and attached individually onto slide 1 and 2. TCH flakes were compressed, moistened and sandwiched between the two slides containing mucosal membrane. A pre load force of 50 g was applied over the pan containing TCH for 5–7 min so that the slides get attached properly. Weights were put on the other pan and were gradually increased until the two slides get detached from one another. The weight (g) required for separating the slides was measured and was later used to convert it into mucoadhesive strength index. Equations (1) and (2) given below were used to calculate mucoadhesive strength
12


Preparation of TG loaded nanoparticles (CHNPs/TG and TCNPs/TG)
Various formulations containing different concentrations of polymer i.e. CH with respect to the drug (TG) and cross-linker (TPP) were prepared using the ionic gelation technique, to assess the effect of polymer concentration on various parameters such as particle size, zeta potential, drug loading and release. The formulation with better results was selected for formulating nanoparticles with TC, i.e. having polymer concentration of 4:1 (CH:TPP). TG concentration was also kept constant with respect to CH i.e. 1:4 (TG:CH). CH (2g) was dissolved in 2% v/v acetic acid solution at a concentration of 4 mg per ml, which was left overnight under constant stirring. TG solution at 5 mg per ml concentration was prepared and added drop wise in the above solution. The pH of the solution was adjusted at 4.5 and was left on stirring for 20 min. Thereafter, a TPP solution having a concentration of 3 mg per mL was added drop wise under constant stirring at room temperature until the formation of an opalescent solution. It was left on stirring for 1 h. Later the opalescent solution was ultracentrifuged at 12,000 r/min for half an hour. The same procedure was followed to prepare TCNPs/TG, by adding TC instead of CH. Other steps and concentrations used were the same as mentioned above. The separated nanoparticles were lyophilized at −50°C and stored in air-tight containers for further characterization.11,13
Physical characterization of CHNPs/TG and TCNPs/TG
Particle size and zeta potential determination
Particle size and poly dispersity index (PDI) of TCNPs/TG were determined by using Zeta sizer nano (Malvern, UK) with a measurement range of 0.3 nm to 10.0 μm, equipped with auto correlator and temperature control set, based on photon correlation spectroscopy. The solutions were analyzed in triplicate after diluting TCNP suspensions.14,15
Zeta potential was also determined through Zeta sizer nano equipment having light source He-Ne laser (at 633 nm), with measurement position of 2 mm at 25°C, using dispersant refractive index of 1.33, the viscosity of 1.028 cP and dispersant dielectric constant of 78.5. The samples were analyzed in clean quartz cuvettes using a small amount of TCNP suspension. 14
Morphology of CHNPs/TG and TCNPs/TG
Structural morphology of TCNPs/TG, having a weight ratio of 4:1 corresponding to TC:TG, was evaluated by scanning electron microscopy, SEM (JSM-6480LV, JEOL). Briefly, the fixed amount of samples were coated in a thin layer on the silicon chip and placed on a platinum SEM stub in a vacuum. Then, the morphology of lyophilized TCNPs/TG i.e. particle’s shape and arrangements were observed.14,15
Entrapment efficiency and loading capacity
The entrapment efficiency (EE) and loading capacity (LC) of CHNPs/TG and TCNPs/TG were determined by ultrafiltration, measuring the amount of unentrapped TG in supernatant solution followed by centrifugation of dispersion, before lyophilization. Briefly, the TCNP dispersion was ultra-centrifuged at 12,000 r/min at 4°C for 30 min. The supernatant solution was analyzed by High-performance liquid chromatography (HPLC) and free drug concentration was calculated.
5
EE and LC of both CHNPs/TG and TCNPs/TG were determined using below-mentioned equations


Powder X-ray diffraction analysis
To ascertain the nature of TG, CHNPs/TG and TCNPs/TG was assessed by powder X-ray diffraction (PXRD) analysis using Ni filtered Cu-Kα radiation. Samples were analyzed at an angle of 2θ (from 5° to 120°), at room temperature, and recording the PXRD patterns. For continuous scan mode, a 0.02°/s step size was set. The observed changes in positions of diffraction peaks of TG will be used to make conclusions on how crystal structure has changed or not due to formation of NPs. 16
FTIR spectroscopy
Fourier transform infrared spectroscopy of CH, TC, CHNPs/TG and TCNPs/TG was performed using a Digital FTIR spectrometer (Bruker, Germany) covering a range of 500–4000 cm−1 and equipped with a diamond ATR interferometer with a variable speed of 0.1, 0.2, 0.5, 1, 2, and 4 cm/s, with infrared (IR) beam diameter (from 2 to 11 mm). The IR spectra were collected with a spectral resolution (4 cm−1) several times (10 times) and analyzed for molecular information about chemical structure. The average values of 10 scans for each sample were obtained to get precise results.16,17
DSC analysis
Thermal analysis was conducted by diffraction scanning calorimetry (DSC) to evaluate the energy changes in pure TG, CHNPs/TG and TCNPs/TG, using a thermal analyzer (DSC Q2000 V24, T zero technology, Seoul, Korea). DSC is a thermo-analytical procedure that evaluates the difference in the amount of heat needed to increase the temperature of a sample and reference material as a function of temperature. A small quantity of samples (5–10 mg) was added in separate aluminum pans that were heated from 30 to 310°C. DSC thermograms were recorded at a heating rate of 20 °C/min under nitrogen flow (20 mL/min). 18
In-vitro release study of CHNPs/TG and TCNPs/TG
In-vitro release study was conducted using dialysis membrane diffusion method in pH 1.2 and pH 7.4 buffers. 50 mg of NPs were weighed and dispersed in a 2 mL release medium, and were added in a pre-soaked dialysis membrane (Mw cutoff 12 kDa). The closed dialysis bag was immersed in a 100 mL release medium under constant stirring at 150 r/min, maintaining the temperature at 37°C. After appropriate intervals, samples were withdrawn for analysis and replaced by the same volume of fresh medium. The concentration of TG released from the CHNPs/TG and TCNPs/TG was evaluated by photometric analysis at 254 nm, using ultraviolet (UV) visible spectrophotometer (Shimadzu, Japan). 18
The calibration curves of TG were drawn at both pH 1.2 and pH 7.4, to find unknown drug concentrations in sample solutions.
In vitro kinetic modelling of drug release
Various in vitro kinetic models such as first order, zero order, Higuchi, Korsmeyer-Peppas and Hixson Crowell were applied to the obtained data to assess drug release pattern and kinetics of CHNPs/TG and TCNPs/TG. 18
Pharmacokinetic study
Animal study
A pharmacokinetic study was carried out to compare the bioavailability of pure TG, CHNPs/TG and TCNPs/TG formulations, following oral administration of 10 mg per kg dose. The study was approved by the Institutional Animal ethical committee (Pharmacy Research Ethics Committee, PREC) of the University of Lahore (UOL), Pakistan Vide ref. no. IREC-2017.142 A. The study was performed on 15 albino rabbits, weighing about 1.5 to 2 Kg each. The animals were kept in standard laboratory conditions maintaining the temperature at 25 ± 2°C and relative humidity of 55 ± 5%. The animals were divided into three groups, group 1 was given pure TG dose (10 mg/kg), group 2 was given CHNPs/TG, while group 3 was administered TCNPs/TG at equivalent dose, by oral gavage. Blood samples (∼0.5 mL) were withdrawn from the orbital sinus at intervals of 0.5, 1, 2, 4, 6, 8, 12 and 24 hours, and collected in microfuse tubes containing Sodium citrate (3.3%w/v) solution. Blood samples were ultracentrifuged at 15,000 r/min at 4°C to separate plasma. Plasma samples were frozen and stored at −20°C for analysis. 14
Plasma sample analysis
Then 0.5 mL of plasma samples were taken into centrifuge tubes and 1 mL methanol was added to each tube; and was vortexed for 2 min. Samples were ultracentrifuged at 10,000 r/min for 10 min, at 4°C. The supernatant was transferred to glass centrifuge tubes and was dried at 45°C under a nitrogen stream. Furthermore, the dried residue was reconstituted with 0.5 mL of mobile phase and filtered through 0.45 μm membrane filter (syringe filter). An aliquot equivalent to 20 μL was injected into the HPLC injection port for analysis.
High performance liquid chromatographic analysis
A previously described HPLC method with slight modification was adopted for analyzing samples. The mobile phase comprised of acetonitrile and 50 m
Pharmacokinetic data analysis
Various pharmacokinetic parameters, such as maximum plasma concentration (Cmax), time to reach maximum concentration (Tmax), elimination half-life (T1/2), the area under the curve (AUC0–∞), were determined by constructing plasma level time curves at different time intervals by using PK-solver software.
18
The oral relative bioavailability (RBA) of the CHNPs/TG and TCNPs/TG was calculated using equation (5)

Statistical analysis
Statistical analysis was carried over the obtained data, represented as mean ± SD (n = 5). One-way analysis of variance (ANOVA) was performed for statistical comparisons. A p value <.05 was considered significant statistically. Graphpad prism version 9.2 software was used for processing the data. 18
Results and discussion
Quantification of thiol content
The amount of thiol moieties has been quantified from the standard curve of TGA solutions prepared in water in a concentration range of 0.25–2 m
Ex-vivo mucoadhesive strength
Mucoadhesive strength of chitosan (CH) and thiolated chitosan (TC).
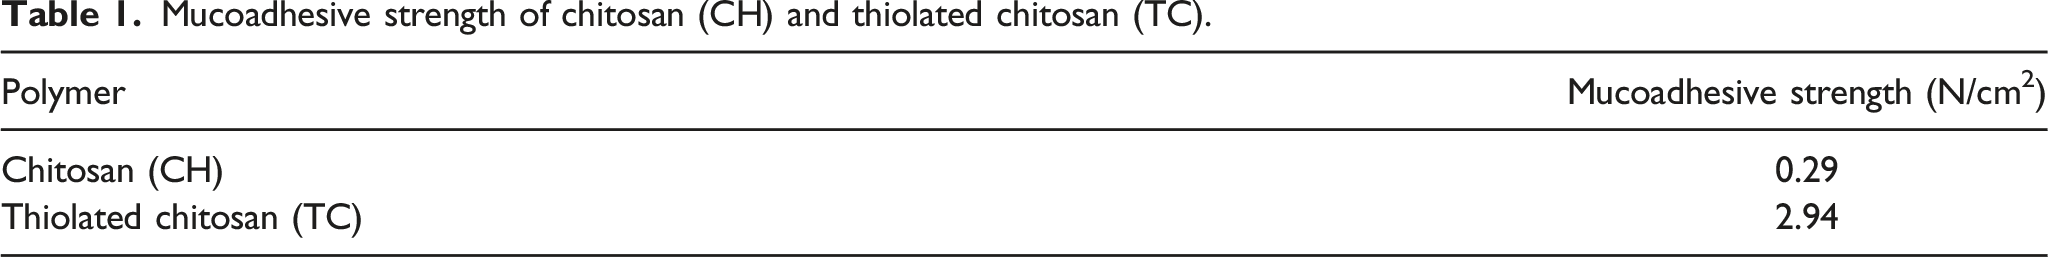
Similar findings have been reported by Puri et al. where both anionic and cationic thiomers displayed significantly improved mucoadhesive properties of 2-20 fold and 100 to 140 fold, respectively. Furthermore, the mucoadhesive ability was observed to be indirectly proportional to the polymer’s molecular mass. 12
Particle size and zeta potential
Preliminary studies indicated that by increasing the CH concentration, the particle size of nanoparticles decreased markedly as indicated below in Figure 1. The observed particle size at 1:1 concentration of CH:TPP was 646 nm which decreased to 147.3 nm at 4:1 concentration of CH:TPP (CHNPs/TG). Similar response has been reported earlier by Lazaridou, M., et al., who demonstrated a reduction in formed NP’s size by incrementing the CH concentration. A similar trend has been demonstrated by Stoica who reported a reduction in the size of NPs upon increasing the CH and TPP mass ratio from 2:1 to 8:1.22,23 By using the same concentration of TC and TPP, (TC:TPP) i.e. 4:1, (TCNPs/TG), the resulted nanoparticles demonstrated a particle size of 190 nm. This feature indicated that even at low polyanion concentration of TPP as compared to CH’s cations, enough ionic interactions occurred that resulted in small-sized nanoparticles formation due to ionic gelation. CH chains are comprised of large number of reactive amine groups that act as prospective crosslinking positions for negatively charged polyanions (phosphate groups) of TPP. Therefore, molar concentration of TPP and CH is interlinked to degree of crosslinking, but that shows limitation due to phenomena of aggregation at large polyanion concentration. Effect of CH-TPP mass ratio on particle size and zeta potential.
Comparison of CHNPs/TG and TCNPs/TG for particle size, zeta potential, polydispersity index (PDI), entrapment efficiency (EE) and loading capacity (LC).

Entrapment efficiency and loading-capacity
The EE of TG loaded CHNPs/TG and TCNPs/TG as calculated by the above-mentioned equation, was observed to be 84.1% and 94.3% respectively. Loading capacity of CHNPs/TG and TCNPs/TG was found to be 42.05% and 38%, respectively (Table 2). An entrapment efficiency of 98% has been reported earlier by Bo Fan for thiolated chitosan based NPs. 10 Ideally, an efficient delivery technique must possess a greater degree of association with drugs. Such a high entrapment efficiency has become possible due to the hydrophobic nature of TG that helped it to enter efficiently into the hydrophobic interior of CHNPs and TCNPs. EE of both formulations was fairly good, indicating the fact that enough ionic interactions were present between positively charged CH and negatively charged TPP that resulted in efficient entrapment of drug within the formed NPs.
Surface morphology
SEM images of TG loaded chitosan nanoparticles, CHNPs/TG and TG loaded TCNPs/TG are shown below in Figure 2. CHNPs/TG showed a slightly oblong-shaped particles, whereas, TCNPs/TG demonstrated a smooth and round surface morphology having particle size uniformity. These images indicated that TG was successfully incorporated into TCNPs/TG. The surface morphology of dried powder of CHNPs/TG displayed clusters and agglomerates with somewhat slightly oblong shape as depicted in Figure 2(a); whereas, in dilute solution (Figure 2(b)), NPs were dispersed homogeneously displaying nanosized particles with smooth surface. Similarly, dilute solution of TCNPs/TG displayed a homogeneous distribution of smooth spherical particles (Figure 2(c) and (d)). SEM images of CHNPs/TG (A, B) and TCNPs/TG (C, D), describing nanosized particles.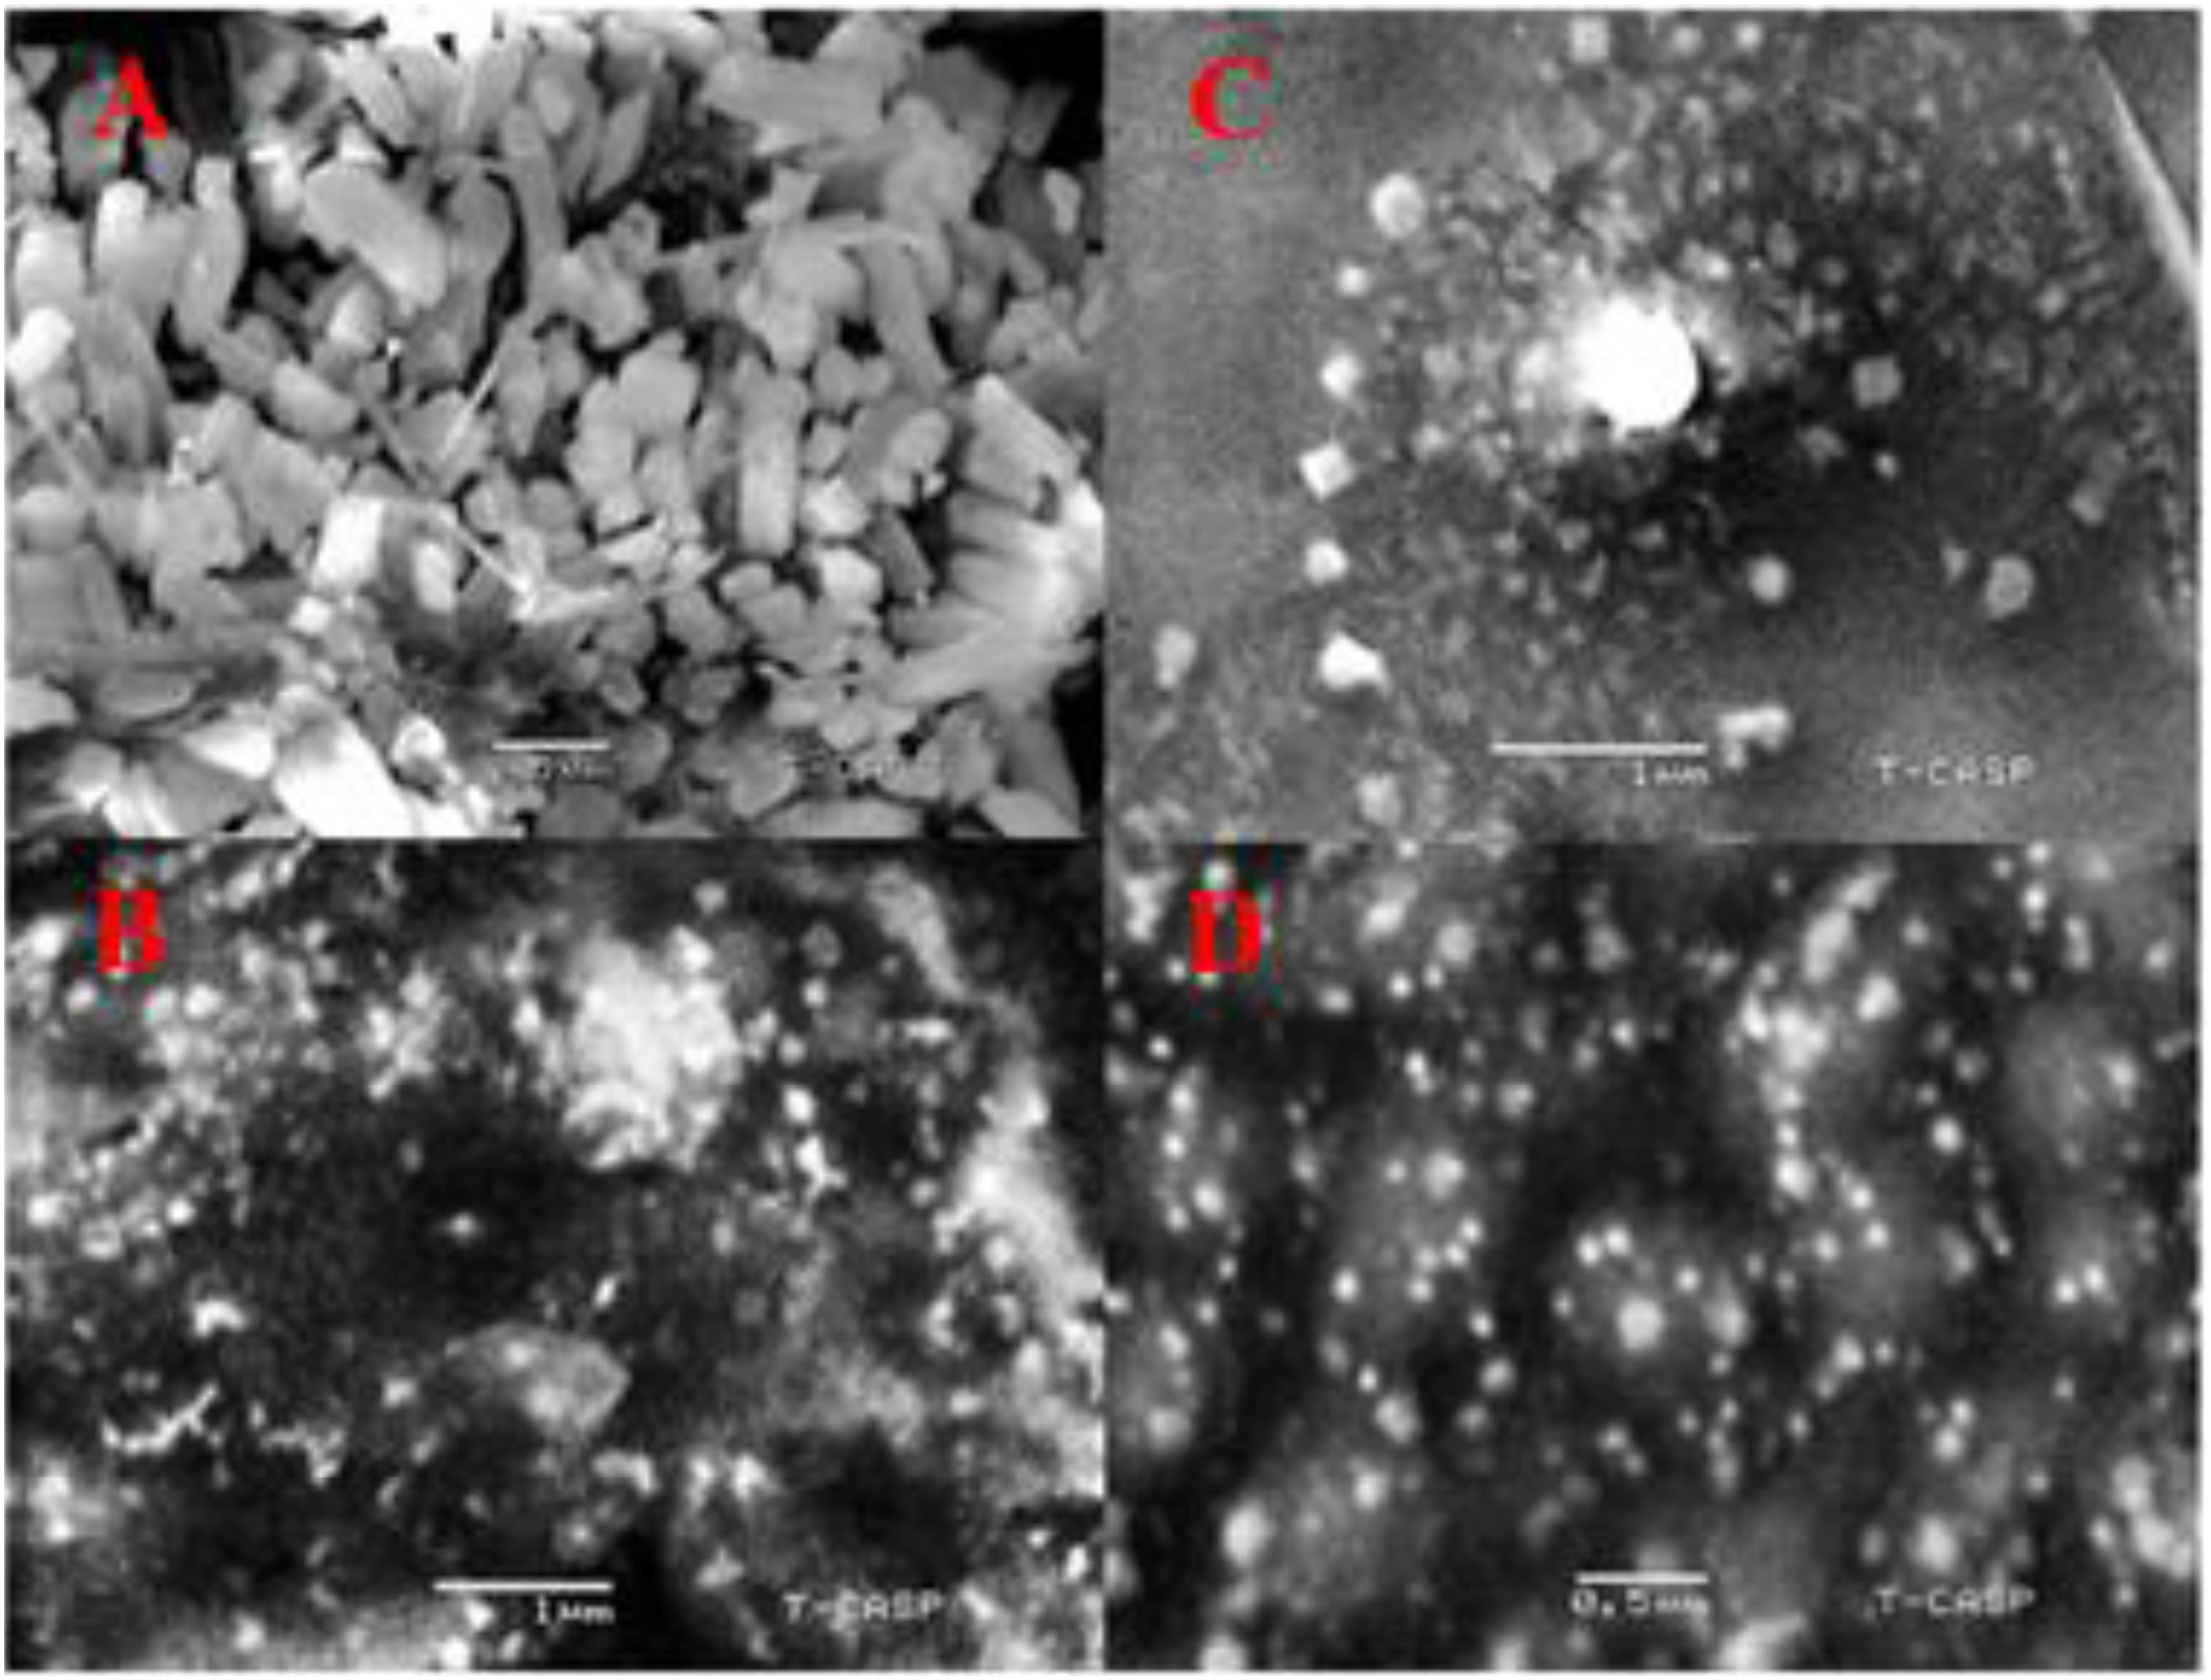
Powder X-ray diffraction
A number of high intensity peaks were observed in the raw TG, indicating its crystalline nature. The characteristic diffraction peaks demonstrated by both CHNPs and TCNPs containing TG reflected a reduction in crystalline nature of formed nanoparticles. In CHNPs/TG and TCNPs/TG, the peak intensity of TG was remarkably reduced, indicating profound reduction in its crystallinity. The peak intensity of TG as observed at 13.35° was remarkably reduced in both NP formulations. Major high intensity peaks for CHNPs/TG were observed at 10.06, 18.38, 21.66, 22.64, 24.4 and 30°angle. The major peaks with high intensity as observed for TCNPs/TG were at 5.3, 6.6, 11.35, 17.85, 18.25, 21.75, 22.5 and 23.9° angle. Moreover, TCNPs/TG displayed peaks with slightly high intensities as compared to those observed with CHNPs/TG. Therefore, reduction in peak intensities as displayed by PXRD diffractograms demonstrated the successful entrapment of TG in the nanoparticles (Figure 3). PXRD spectra of TG (A), CHNPs/TG and TCNPs/TG (B) and comparative spectra of TG, CHNPs/TG and TCNPs/TG (C).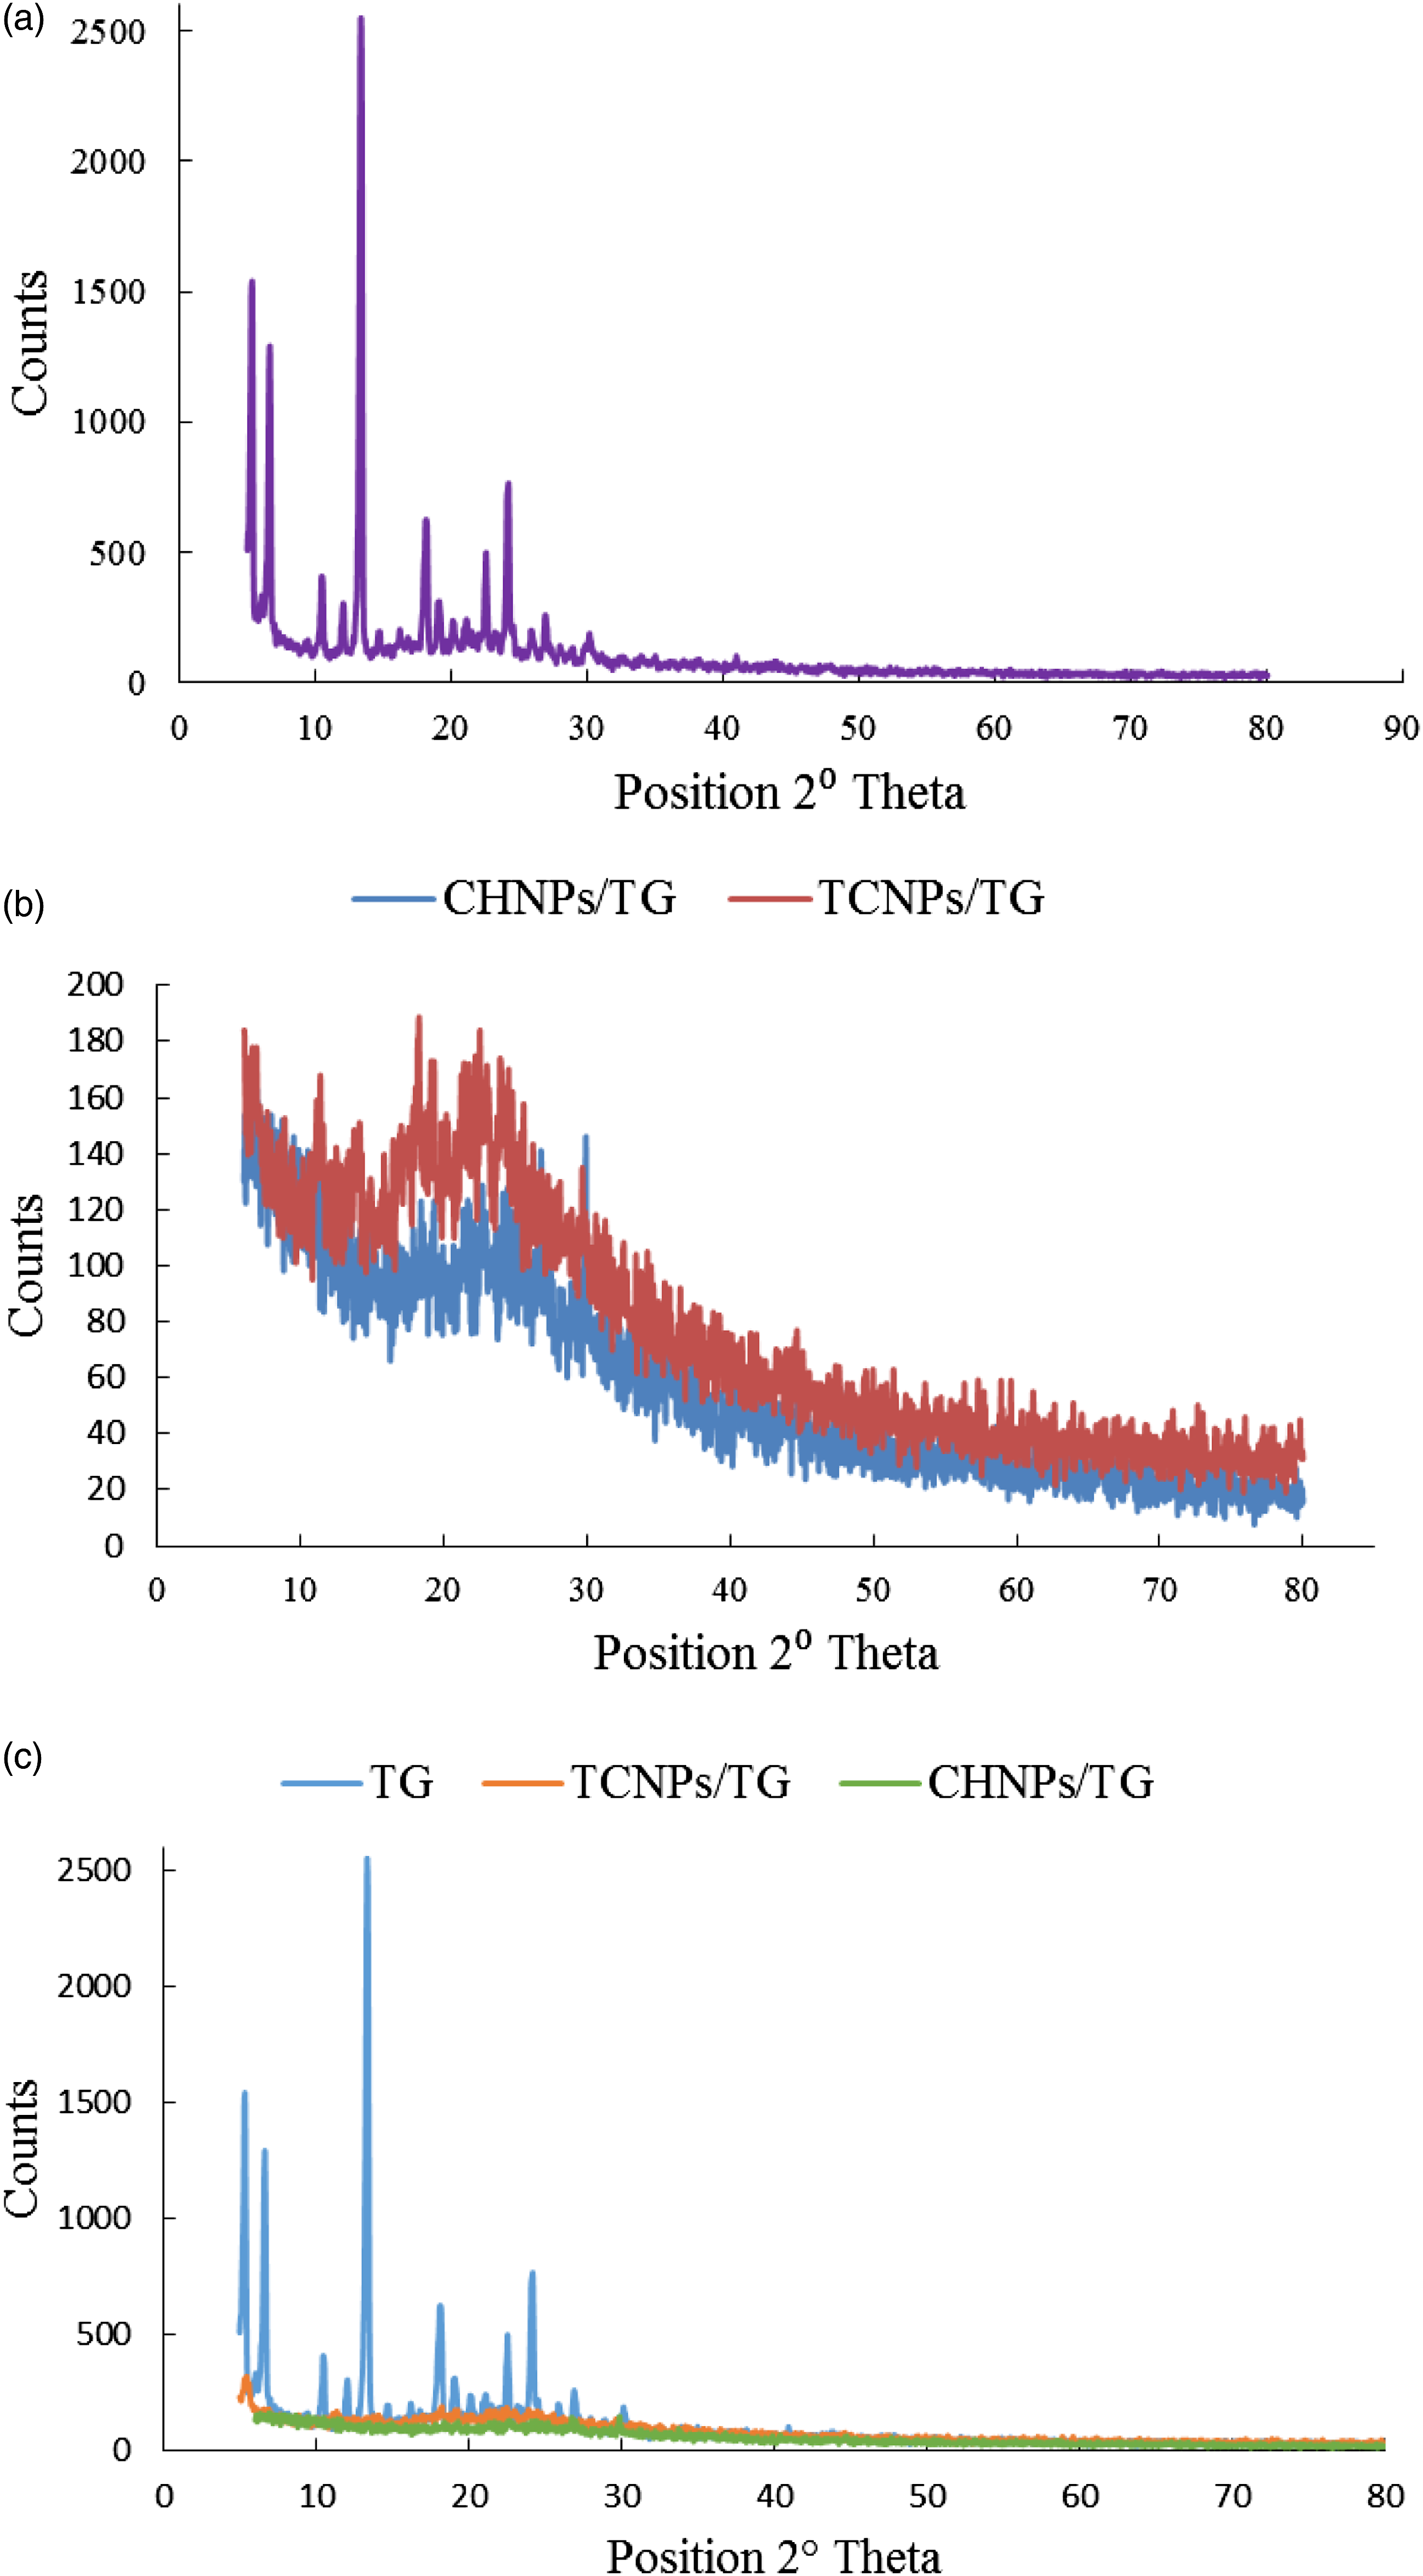
FTIR spectroscopy
The FTIR spectra of pure CH, pure drug (TG), thiolated chitosan (TC), and both formulations CHNPs/TG and TCNPs/TG were observed to find the chemical compatibilities and structure modifications (Figure 4). The FTIR spectrum of pure CH reflected major peaks at 3406, 3340, 2870, 1622, 1585, 1400, 1378, 1028, 1015 and 896 cm−1. The absorption bands at 3406 and 3340 cm−1 indicated the presence of hydroxyl groups (-OH) while the peak at 2870 cm−1 indicated the methyl stretch (-CH), and intense peaks at 1622 and 1585 cm−1 reflected presence of the amine stretch (-NH2). FTIR spectra of A), CH, B) TC, C) pure Ticagrelor (TG) D) CHNPs/TG and E) TCNPs/TG.
FT-IR analysis of TC indicated successful modification of native chitosan specifically on the amine group. Deformation of a signal at 3220 cm−1, indicated –NH stretching and the peak at 1646 cm−1 indicated the presence of C=O stretching amide. Moreover, the peak at 2495 cm−1 reflecting –SH stretch confirmed the presence of the terminal thiol group. The peak at 1246 cm−1 reflected C-SH stretch and at 810 cm−1 indicated the disulfide bond (S-S stretch).
The FTIR spectrum of pure TG showed characteristic absorption peaks at 3403, 3288, 2933, 2854, 1605, 1558, 1505, 1455, 1316, 1274, 1256, 1210, 1110, 1091 and 761 cm−1. The absorption bands at 3403 and 3288 cm−1 specified the presence of -NH stretch and -OH stretch, while the peaks at 2933 and 2854 pointed to the presence of alkyl stretch (-CH). The absorption bands at 1605 and 1558 cm−1 reflected the presence of –N-H stretch, whereas the peaks at 1455 cm−1 indicated methyl bend, at 1256 and 1210 cm−1 showed –C-OH stretch. The intense peaks at 1110 and 1091 cm−1 signaled the presence of –C-O stretch.
The major peaks observed in CH, TC and raw TG were also observed in NP formulations, CHNPs/TG and TCNPs/TG. The observed intense band at 3315 cm−1 corresponded to –OH stretch while the intense peak at 2960 cm−1 indicated the presence of methylene (-CH stretch). The peak at 1646 cm−1 corresponding to the C-NH stretch was also observed in both NP formulations. The peak at 880 cm−1 demonstrated bisulphide linkage (–S-S).
Diffraction scanning calorimetry
Diffraction scanning calorimeter thermograms were recorded for pure TG, physical mixture (PM), CHNPs/TG and TCNPs/TG shown below in Figure 5. Pure TG displayed an endothermic peak at 142.74°C indicating the melting point of TG. It also displayed an exothermic peak at about 335.68°C indicating crystallization at further increase in temperature. The physical mixture showed the original peaks indicating no interaction among components. CHNPs/TG displayed a broader peak along with the reduction in melting point showing an endothermic peak at 122.13°C and TCNPs/TG displayed an endothermic peak at 124.93°C. This slight reduction in melting point may be attributed to the interaction between TG and TC, which led to the broadening of the TG melting peak as well as a shift towards lower temperature. This can also be attributed to the reduction in the degree of crystallinity of encapsulated TG due to the formation of nanoparticles. Moreover, the aim of performing DSC analysis was to observe the change or reduction in melting point as expected due to NP formation that ultimately displayed the transition from highly crystalline to less crystalline nature. DSC thermograms of TG, PM, CHNPs/TG and TCNPs/TG.
In vitro release study
A slow-release pattern was observed for both CHNPs/TG and TCNPs/TG at both pH 1.2 (Figure 6) and pH 7.4 (Figure 7) buffers, as compared to a pure drug, which has shown a fast release (∼100%) in less time (∼8 h) as previously reported.
18
In vitro release profiles of CHNPs/TG and TCNPs/TG at pH 1.2. In vitro release profiles of CHNPs/TG and TCNPs/TG at pH 7.4.

At pH 1.2 both formulations showed a maximum release of about 61.81% and 55.26%, respectively for 24 h. CHNPs/TG showed an initial release of about 17.7% followed by a prolonged release of about 61.81% for 24 h. TCNPs/TG showed a sustained effect from the start of the studies, as only 11% of the drug was released in first hour, and a similar effect has been sustained till the 24th hour of the studies, with 55.26% of the drug release. At pH 7.4, both formulations exhibited a slow release pattern with a maximum drug release of 38.42% and 69.81%, till 24 h, respectively. The slow release of the drug from the matrix has occurred due to slow diffusion as well as degradation of the polymer matrix. The slow release of TG at neutral pH might be due to the basic nature of TG, dissolving well at acidic pH as compared to neutral or basic pH [14]. Similarly, CH also dissolves well at acidic pH as its pKa value is about 6.5. Both these factors contributed to the slow and sustained release of CHNPs/TG at high intestinal pH (7.4). Similar slow and sustained pattern for in vitro drug release has been reported by Talaei et al. and Bo Fan et al. in a study related to chitosan-based drug delivery systems.10,24 Whereas, TCNPs/TG displayed a remarkable increase in cummulative drug release predominantly in a slow and uniform pattern probably due to increased swelling ability of the modified polymer i.e. TC that resulted in enhancing the drug release. A similar pattern for drug release was exhibited by thiolated chitosan NPs for the release of Sitagliptin as reported by Prabahar. 25
Evaluation of drug release kinetics
Correlation coefficients (R2) and release rate constants of TG loaded nanoparticle formulations.

Pharmacokinetic study
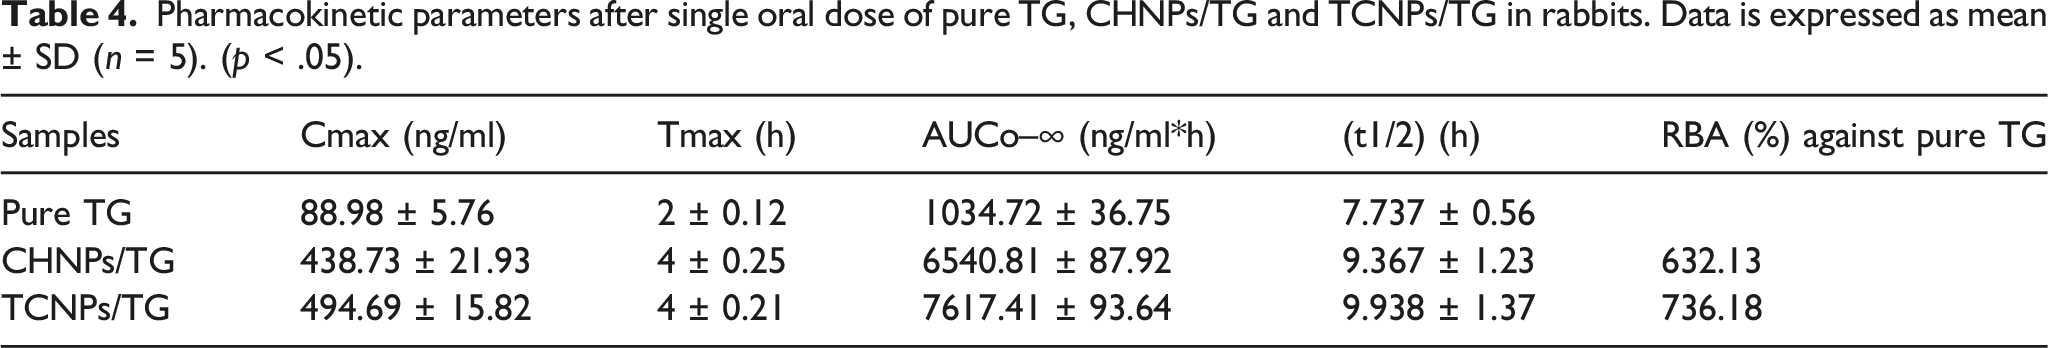
Pharmacokinetic parameters after single oral dose of pure TG, CHNPs/TG and TCNPs/TG in rabbits. Data is expressed as mean ± SD (n = 5). (p < .05).

Plasma concentration-time profile of TG in rabbits after equivalent single oral dose administration (10 mg/Kg) of pure TG, CHNPs/TG and TCNPs/TG.
Conclusion
TG containing CHNPs/TG and mucoadhesive TCNPs/TG have been successfully formulated that exhibited particle size in the range of 100–200 nm and high encapsulation efficiency of 85–91%. Both formulations showed a sustained release profile in the 24-h study. Furthermore, in vivo bioavailability studies indicated enhanced oral bioavailability of both formulations, CHNPs/TG and TCNPs/TG in comparison to that of pure TG. Hence, modified chitosan-based nanoparticle formulation, TCNPs/TG showed better results upon physical evaluation, as compared to CH-based nanoparticle formulation, CHNPs/TG. Therefore, TCNPs/TG can be utilized as efficient drug delivery systems for enhancing the anti-platelet activity of oral TG as expected due to its enhanced oral bioavailability. Further investigations regarding TCNPs/TG’s stability can be performed to evaluate their long-term stability and effectiveness.
Footnotes
Acknowledgements
The authors are grateful to Akhtar Saeed College of Pharmaceutical Sciences, Lahore and The University of Lahore for providing suitable lab facilities required for completion of the research work.
Declaration of conflicting interests
The author(s) declared no potential conflicts of interest with respect to the research, authorship, and/or publication of this article.
Funding
The author(s) received no financial support for the research, authorship, and/or publication of this article.