
Abstract
The growing emphasis on sustainability has driven research toward the recycling of polypropylene (PP) waste reinforced with natural fillers. This study investigates the development of rice husk–reinforced recycled polypropylene (RH-PP) composites for assistive applications using a cost-effective and scalable injection molding process. Nine composite formulations were developed by varying RH content (10–30 wt%) and particle sizes (125–500 µm), and their mechanical, thermal, chemical, and morphological properties were characterized. The optimal composite formulation (80 wt% PP, 20 wt% RH, 125 µm) exhibited enhanced performance with compressive strength of 57.3 MPa, bending strength of 45.3 MPa, tensile strength of 49.2 MPa, and impact energy of 4.2 KJ/mm2. Thermogravimetric analysis (TGA) showed a maximum degradation temperature of 407.6°C, while differential scanning calorimetry (DSC) revealed crystallinity values ranging from 38.8% to 40.7%. Scanning electron microscopy (SEM) confirmed improved interfacial adhesion and uniform filler dispersion. The integration of Grey Relational Analysis (GRA) enabled multi-response optimization, identifying the most influential parameters. The findings demonstrate that RH-PP composites offer a sustainable and mechanically robust alternative to virgin PP for use in orthotic and prosthetic applications.
Keywords
Introduction
Recycling and reusing polymer waste have become essential strategies for promoting environmental sustainability and conserving resources. 1 Among various thermoplastics, PP is one of the most widely used due to its versatility, cost-effectiveness, and favorable mechanical properties. 2 However, the extensive use of PP has led to substantial waste accumulation, necessitating efficient recycling methods to mitigate environmental concerns. 3 Polymer waste can be recycled through mechanical, chemical, or composite-based approaches, depending on the desired application. Mollnitz et al. 4 investigated different recycling methods, including extrusion-based homogenization and compression molding, to process polymer waste. Their findings indicated that homogenization did not enhance material properties, whereas pre-treatment steps such as washing significantly improved mechanical performance. Similarly, Rupinder et al. 5 examined the thermal and mechanical behavior of multi-layered recycled thermoplastics fabricated using fused deposition modeling (FDM). The results demonstrated that layered structures exhibited superior properties compared to single-layered samples, primarily due to enhanced bonding and load distribution.
Recycling PP waste into value-added products aligns with the principles of the circular economy, where waste reduction and resource efficiency are prioritized.6,7 Beyond its environmental advantages, recycling PP also offers economic benefits by reducing dependence on virgin polymers. Several studies have explored various recycling methods, including chemical dissolution and pyrolysis, to recover polymeric materials. 8 Achilias et al. 9 processed polyethylene and polypropylene using solvent-based dissolution and catalytic pyrolysis, successfully recovering over 90% of the polymers. Their research demonstrated that pyrolysis could produce valuable hydrocarbon compounds suitable for plastic manufacturing and fuel production. Similarly, Loredana et al. 10 investigated the structural modifications in PP after multiple recycling cycles and found that the molecular structure was altered, leading to changes in permeability and mechanical properties.
To enhance the properties of recycled PP, natural fibers are increasingly being used as reinforcing fillers. 11 These fibers are favored for their sustainability, cost-effectiveness, and ability to improve the mechanical and thermal stability of PP-based composites. The incorporation of natural fillers into polymer matrices has been shown to enhance structural integrity and minimize the degradation effects associated with multiple recycling cycles. 12 Srebrenkoska et al. 13 examined PP composites reinforced with RH and kenaf fibers (KF), revealing that PP-KF composites exhibited superior mechanical performance, whereas PP-RH composites demonstrated better thermal stability. Obasi et al. 14 investigated the impact of coconut shell fillers in PP composites and found that mechanical properties improved with a reduction in filler particle size, with the optimal result achieved at 63 µm. Yiga et al. 15 developed fiber-reinforced PP composites using NaOH pretreated rice and coffee husks as fillers and investigated their mechanical and thermal properties. The study revealed that alkali treatment improved interfacial bonding, resulting in enhanced tensile strength, impact resistance, and thermal stability of the biocomposites. Notably, treated fillers led to higher Charpy impact strength and delayed thermal degradation, confirming their suitability for applications requiring both mechanical robustness and thermal resistance.
To optimize the mechanical, thermal, and structural properties of polymer composites, researchers have employed advanced statistical and optimization techniques.16,17 Adediran et al. 18 applied the Taguchi method to optimize the fabrication of PP composites containing particulate snail shell (PSS) and kenaf fibers (KF), identifying the ideal filler composition to improve mechanical strength. Usman et al. 19 implemented a hybrid Taguchi and composite desirability function approach to optimize injection molding parameters for PP processing, achieving optimal results at injection pressure 60 MPa, mold temperature 313 K, injection temperature 513 K, and injection speed 70 mm/sec. Similarly, Ravikiran et al. 20 used Taguchi, WASPAS, and Ant Lion optimization methods to minimize weld line width and sink mark depth in injection-molded PP components, demonstrating that cooling time was the most critical factor affecting final product quality. PP has widespread applications across various industries, including the medical and rehabilitation sector. It is a preferred material for manufacturing assistive devices such as prosthetics and orthotics, because of its lightweight, durability, and ease of processing. 21 Shahar et al. 22 explored kenaf fiber composites as an alternative to PP in assistive device fabrication, citing their higher tensile strength and sustainability. Similarly, Hoque et al. 23 examined various polymer-based composites and nanocomposites for prosthetic manufacturing and highlighted the potential of 3D printing in customizing assistive parts. Abas et al. 24 applied multi-criteria decision-making techniques to identify the most suitable material for ankle-foot orthoses fabricated via fused deposition modeling (FDM), concluding that PLA and nylon were the most viable options.
Based on the above discussion, the push for sustainable alternatives in prosthetic and orthotic manufacturing is driven by the need for improved mechanical performance, customization, and environmental considerations. 25 While recycled PP-ortho offers a cost-effective option, its mechanical properties may not always meet the required standards. By reinforcing recycled PP with RH, this research aims to develop a composite with enhanced strength, durability, and thermal stability, making it a viable candidate for various engineering applications, including assistive device production.
While significant advancements have been made in PP recycling, the reuse of ortho-grade PP waste for assistive device manufacturing particularly in orthotics and prosthetics and its reinforcement with rice husk (RH) remains largely unexplored. Assistive components such as knee-ankle-foot orthoses (KAFOs), ankle-foot orthoses (AFOs) and prosthetic sockets require high mechanical strength and thermal stability, which are often difficult to achieve using recycled PP alone. Previous studies have investigated the incorporation of natural fillers like kenaf fiber, coconut shell powder, and hemp fiber into PP composites, demonstrating improvements in mechanical performance. However, to the authors’ knowledge, no prior research has utilized RH as a filler in the recycling of ortho-grade PP waste to develop a composite suitable for these specific assistive applications. Additionally, the production of prosthetic and orthotic components generates 25%–30% material waste, emphasizing the need for sustainable waste management solutions.
This study addresses these challenges by mechanically recycling ortho-grade PP waste and reinforcing it with RH to develop a high-performance RH-PP composite. The research evaluates the effect of filler content and particle size on the composite’s mechanical, thermal, chemical, and structural properties. Furthermore, advanced statistical techniques, including ANOVA and Grey Relational Analysis (GRA), are employed to identify the most influential parameters and optimize the composite formulation. By successfully integrating RH into recycled PP for assistive applications, this study not only promotes sustainable material utilization but also enhances the mechanical and thermal stability of the resulting composite, offering a potential alternative to virgin polymer-based materials in medical rehabilitation devices. These composites are particularly suited for use in orthotic and prosthetic components such as AFO, KFO, and transtibial sockets where a balance of lightweight, strength, and thermal resistance is essential.
Materials and methods
Materials
In this study, polypropylene (PP) waste was sourced from various paraplegic centers in Khyber Pakhtunkhwa, Pakistan. The material comprises Polystone® P ortho-grade PP, originally used in the fabrication of assistive parts for physical rehabilitation devices. Ortho-grade PP is a commercially available isotactic polypropylene specifically formulated for orthopedic and prosthetic applications. The term “ortho-grade” denotes a functional grade designed for medical use, characterized by high crystallinity, excellent elasticity, thermal stability, and mechanical strength, making it suitable for semi-structural biomedical components. The collected PP waste has a melt flow index of 4.3 ± 0.2 g/10 min, measured at 230°C under a 2.16 kg load, and follows the empirical formula (C3H6)
n
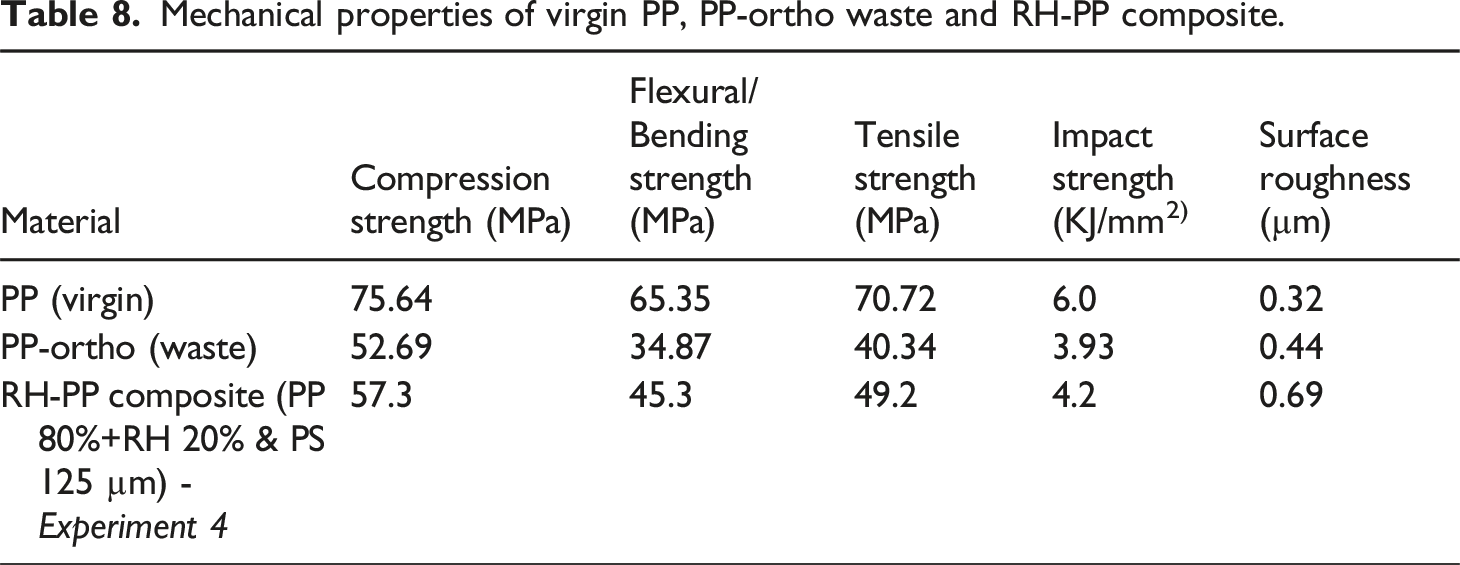
. Other mechanical properties are listed in Table 8. This research aims to recycle PP waste to make a RH-PP composite. For this purpose, first, extra material such as cotton and socks are removed from the collected PP waste and crushed using a plastic crusher (model: SML-PC-300) to reduce the size to approximately 1 mm making it suitable for the injection molding as shown in Figure 1. PP waste cleaning and crushing process.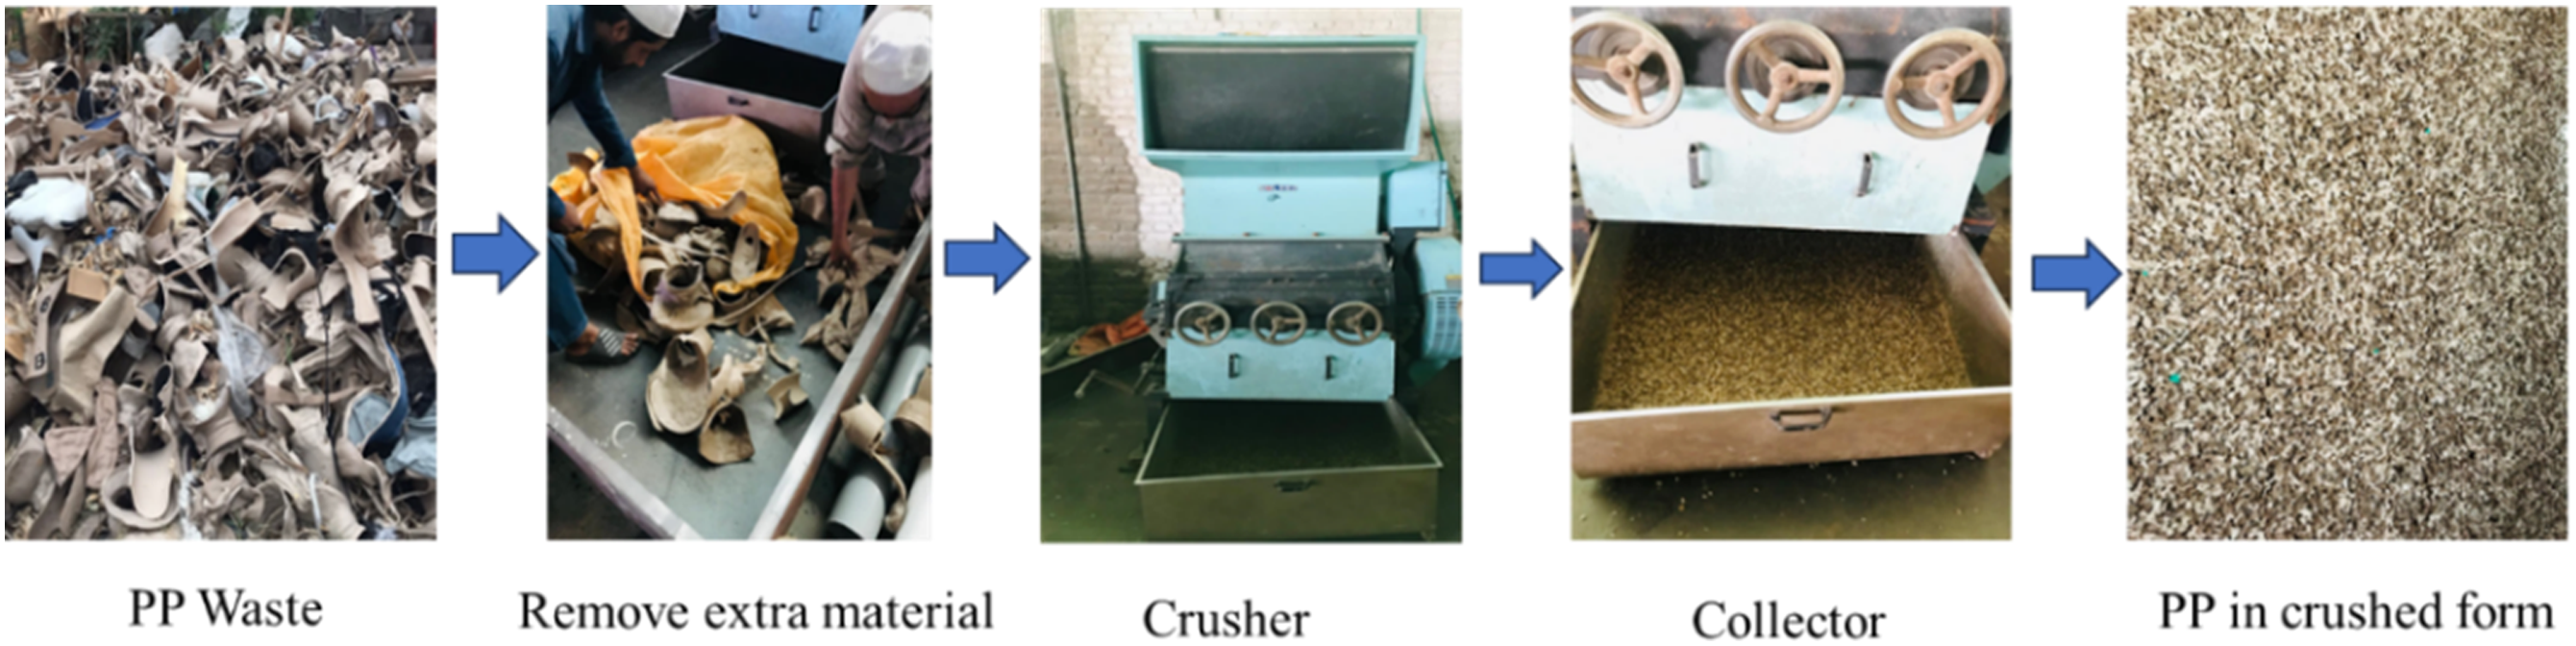
The filler material used in this study is RH, an agricultural byproduct abundantly available in Pakistan. Incorporating RH as a filler in PP offers several advantages, making it a sustainable and cost-effective alternative. RH is rich in cellulose, hemicellulose, and silica, which contribute to improved mechanical properties such as stiffness, strength, and impact resistance. 26 Additionally, the high silica content enhances thermal stability, making the RH-PP composite more resistant to heat degradation. The natural fiber structure of RH helps in reducing shrinkage and expansion, improving the composite’s dimensional stability. 27 In this research, RH is added during the recycling of ortho-grade PP waste to produce a RH-PP composite, promoting waste utilization and environmental sustainability. This approach not only minimizes plastic waste accumulation but also provides an economically viable method to repurpose agricultural residues, reducing dependence on synthetic fillers while lowering the overall environmental footprint. 28
The collected RH is grinded using powder grinder (silver crest, model: 400G) for 10 mins with RPM 28,000 rev/min to reduce the powder size as shown in Figure 2. In this research three sizes of RH filler are investigated that is, 125 μm, 250 μm and 500 μm. Figure 2 also shows the sieve shaker (Retsch, model: AS 200 digit) used to perform the particle size analysis of RH to separate the RH according to mentioned sizes. The RH was dried between 35°C and 38°C temperature under the sun for 48 hrs to reduce moisture content and improve adhesion, as dry RH have better interaction with the PP.
29
Grinding and particle size analysis of RH.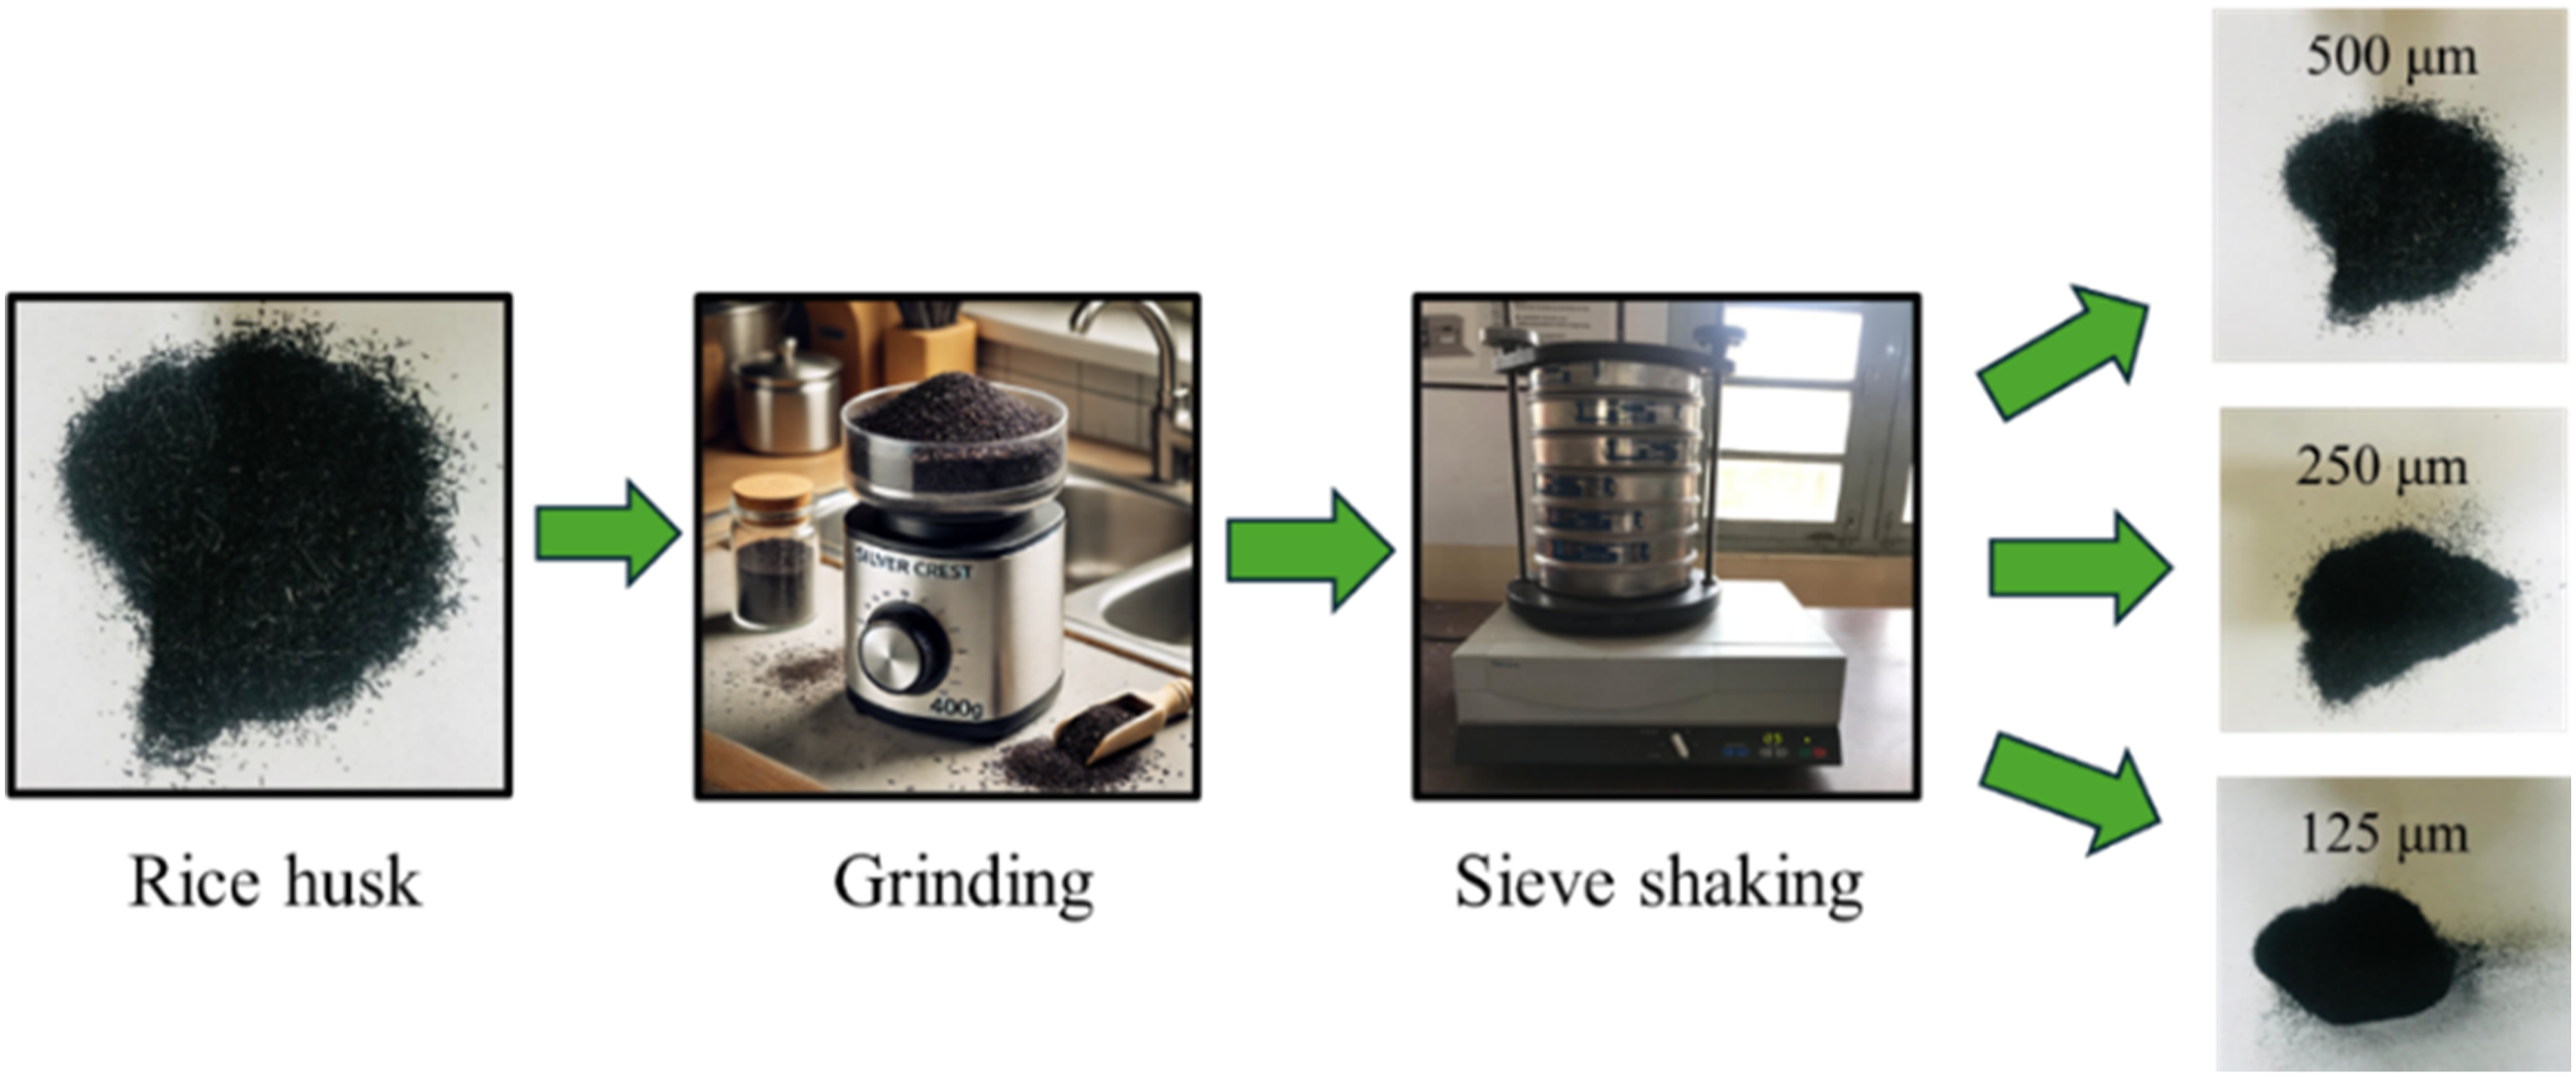
Preparation of samples and responses measurement
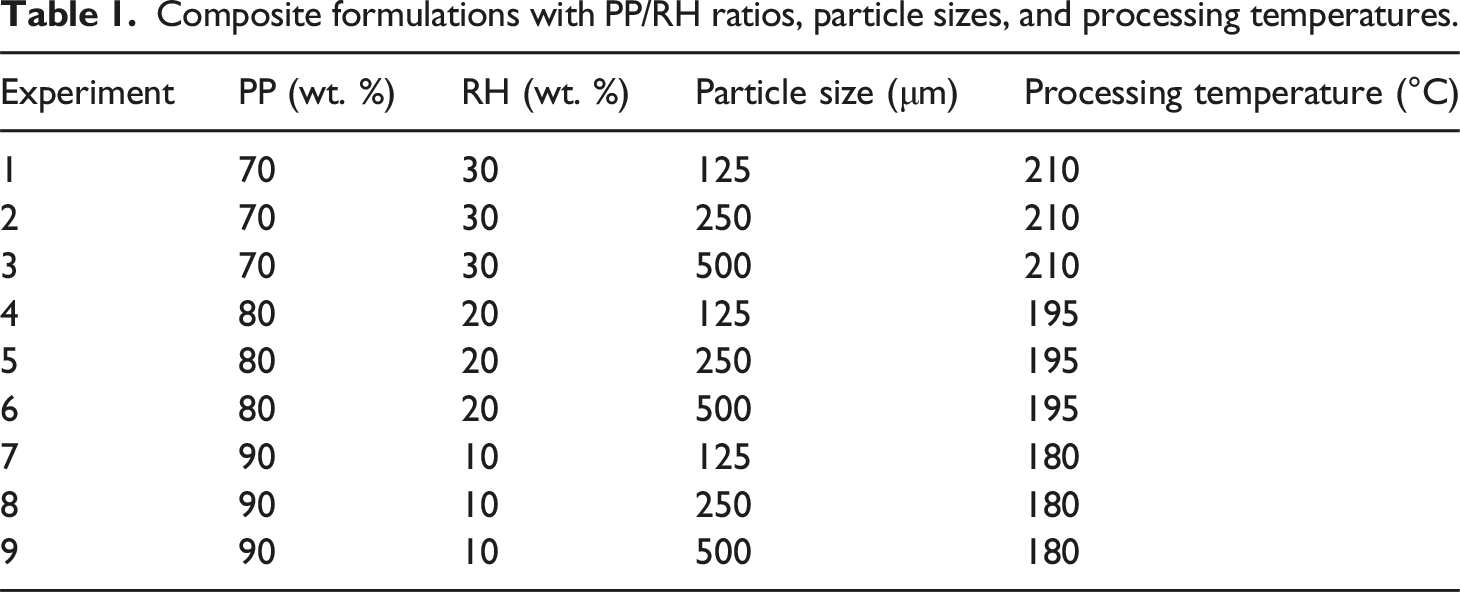
Composite formulations with PP/RH ratios, particle sizes, and processing temperatures.
Mechanical testing
The samples were prepared following the ASTM standard guidelines from the literature for testing the mechanical properties of the RH-PP composite. ASTM D695 for compression, ASTM D790 for bending, ASTM D638-IV for tensile testing and ASTM D256 were used for Izod impact testing.
35
Figure 3 shows the dimensions of the specimens as per these standards. Dimensions of ASTM standards used (a) Compression-D695 (b) Izod impact-D256 (c) Bending-D790 (d) Tensile-D638.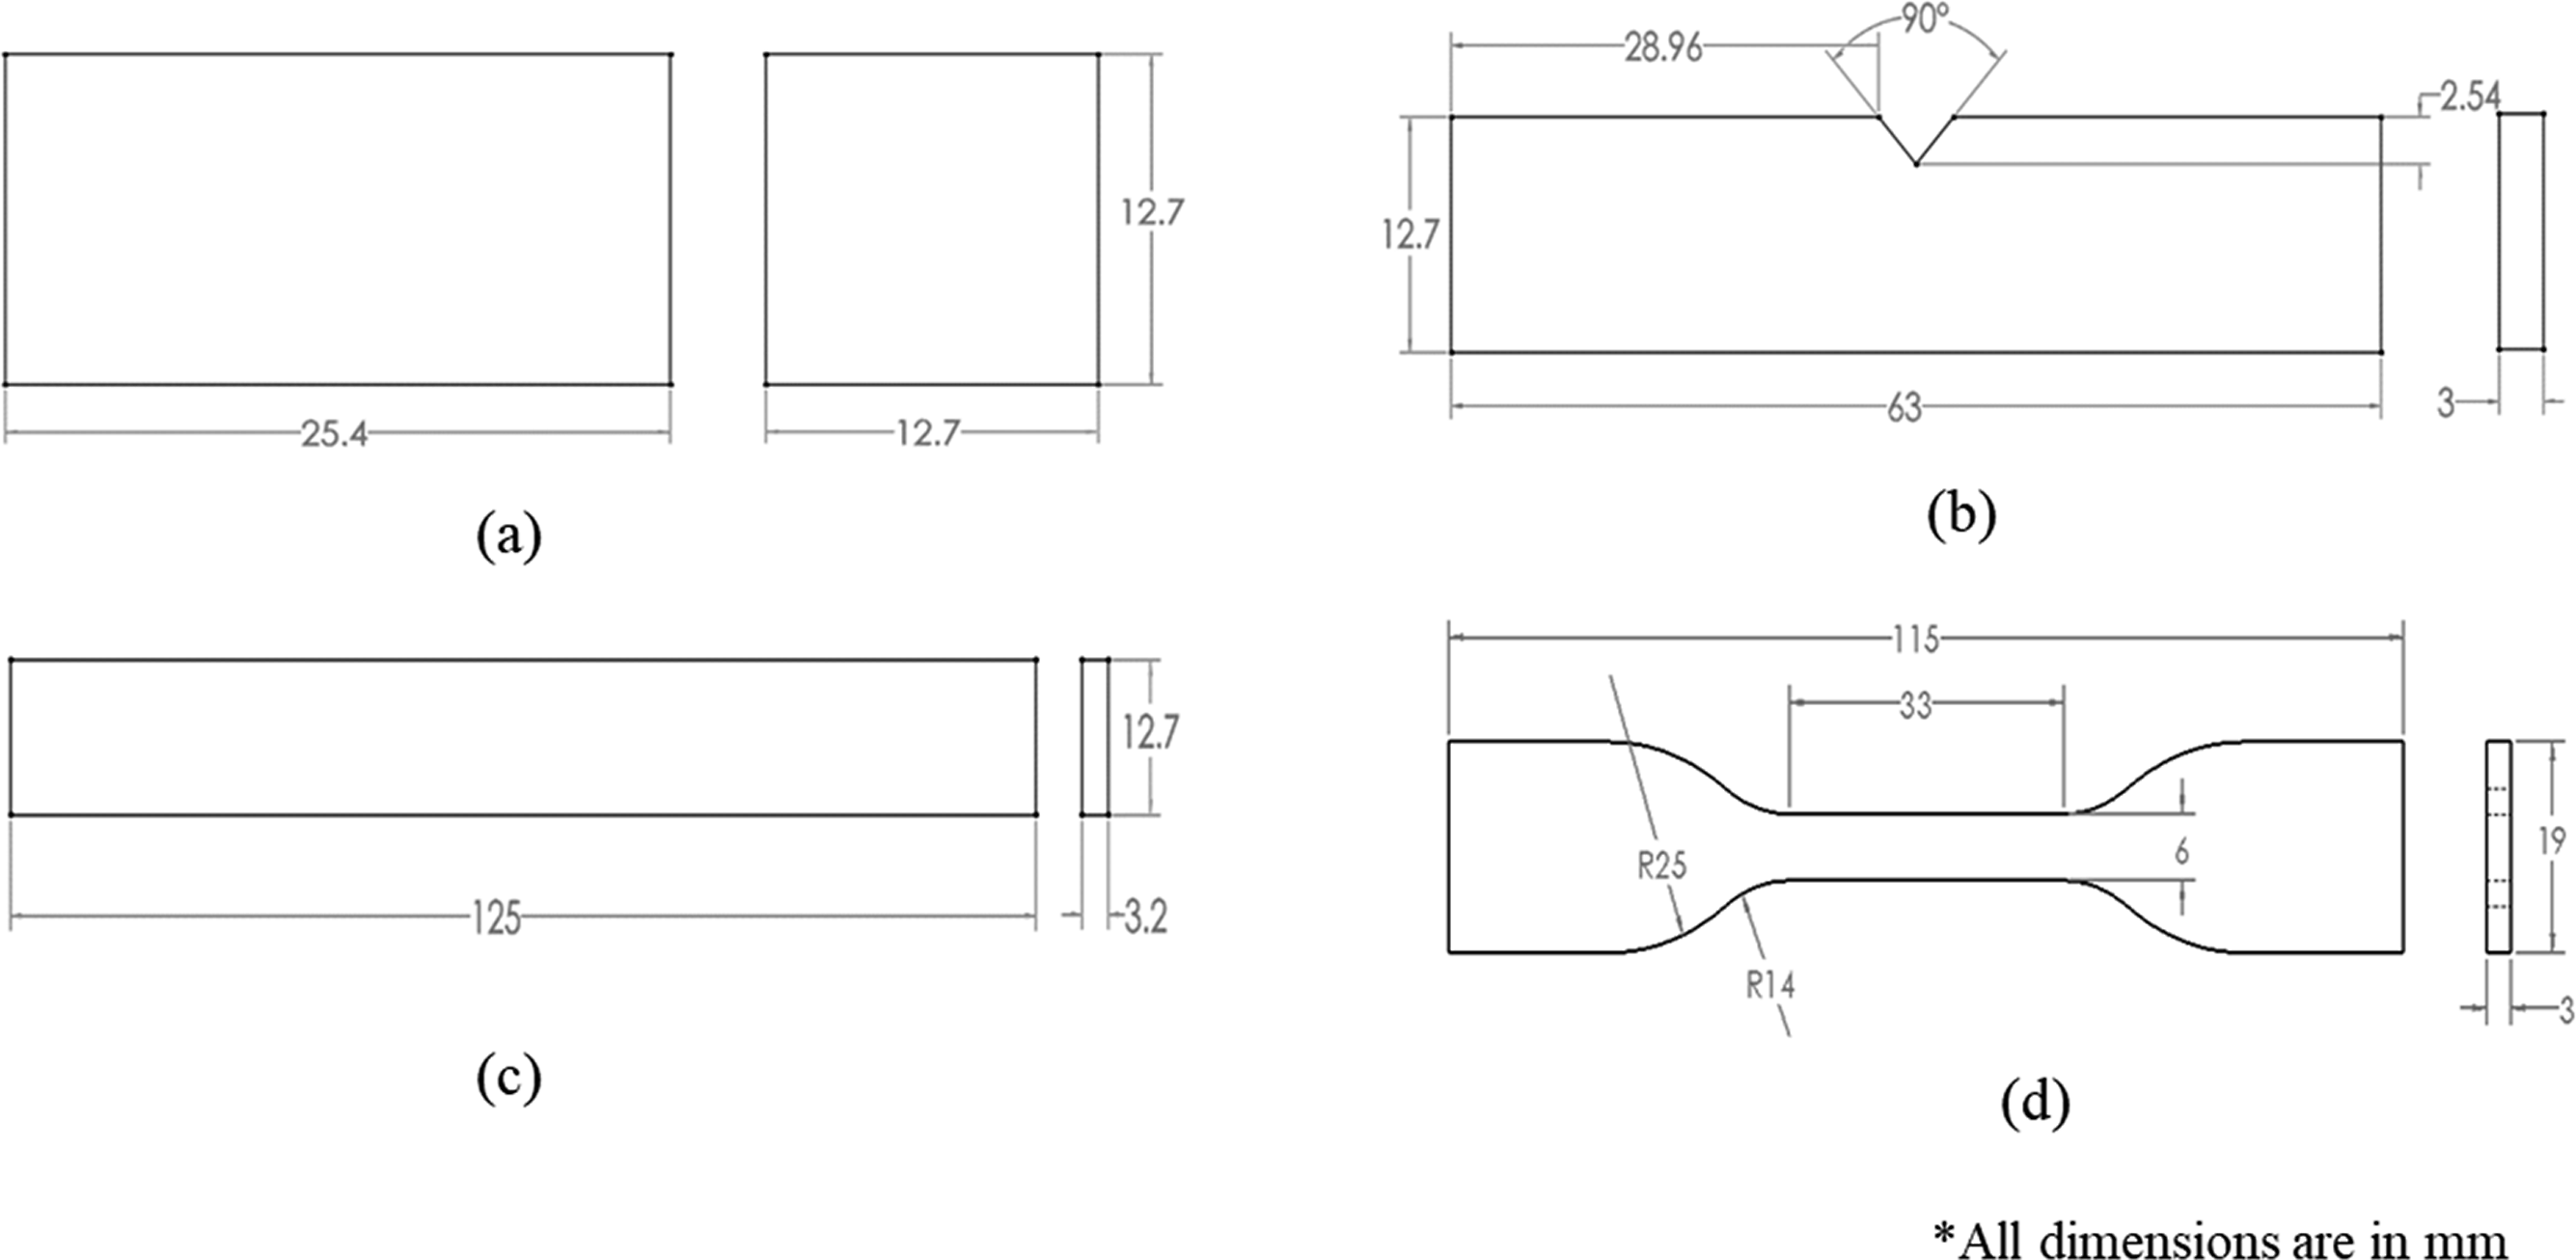
Figure 4 shows the produced samples. A universal testing machine (Testometric, model: M500-30CT) was used for compression, bending, and tensile tests, while an impact tester (Terco, model: MT3016) was used for the Izod impact test, and a surface roughness tester (Mitutoyo, model: SJ-201) was used for measuring the surface roughness of the samples. The testing parameters for the experiments were as follows: For bending, a 50 kN load cell was used with a crosshead speed of 1.3 mm/min. For tensile testing, a 50 kN load cell was used with a strain rate of 5 mm/min. For compression, a 50 kN load cell was used with a crosshead speed of 1.3 mm/min. For the Izod impact test, the hammer impact energy was set to 5.5 J. All tests were conducted at room temperature. RH-PP composite samples for (a) Compression (b) Bending (c) Tensile (d) Impact tests.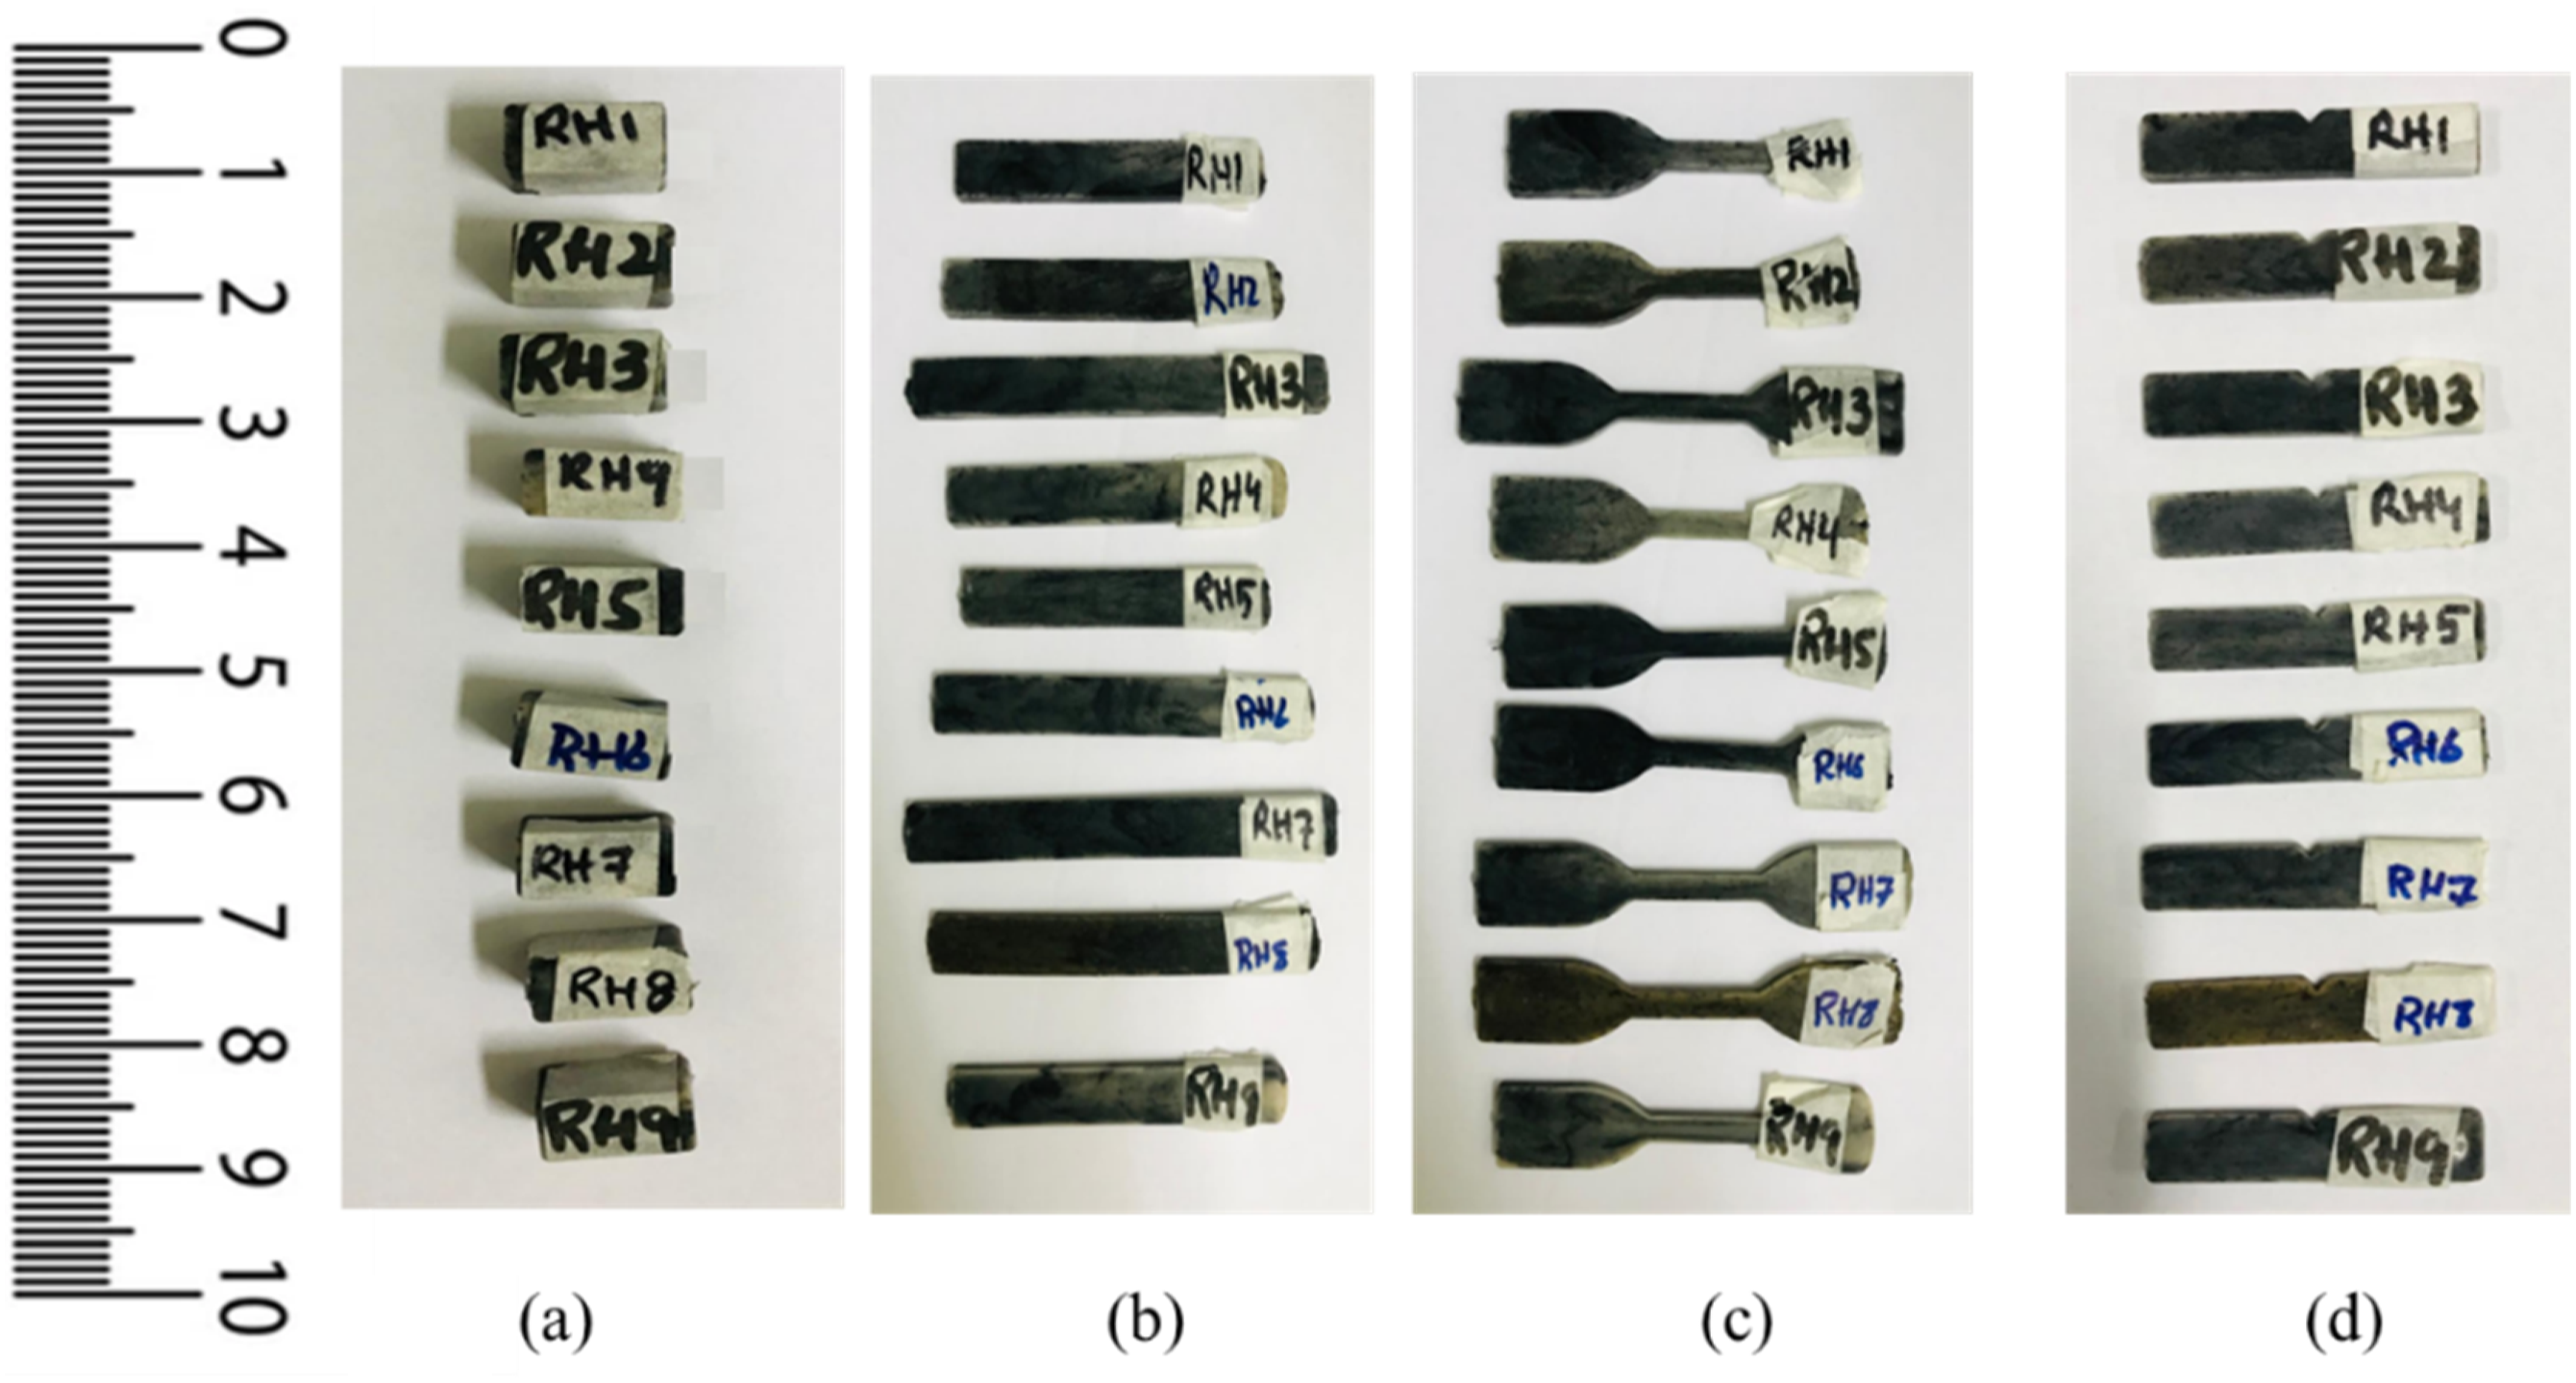
Mechanical testing results.
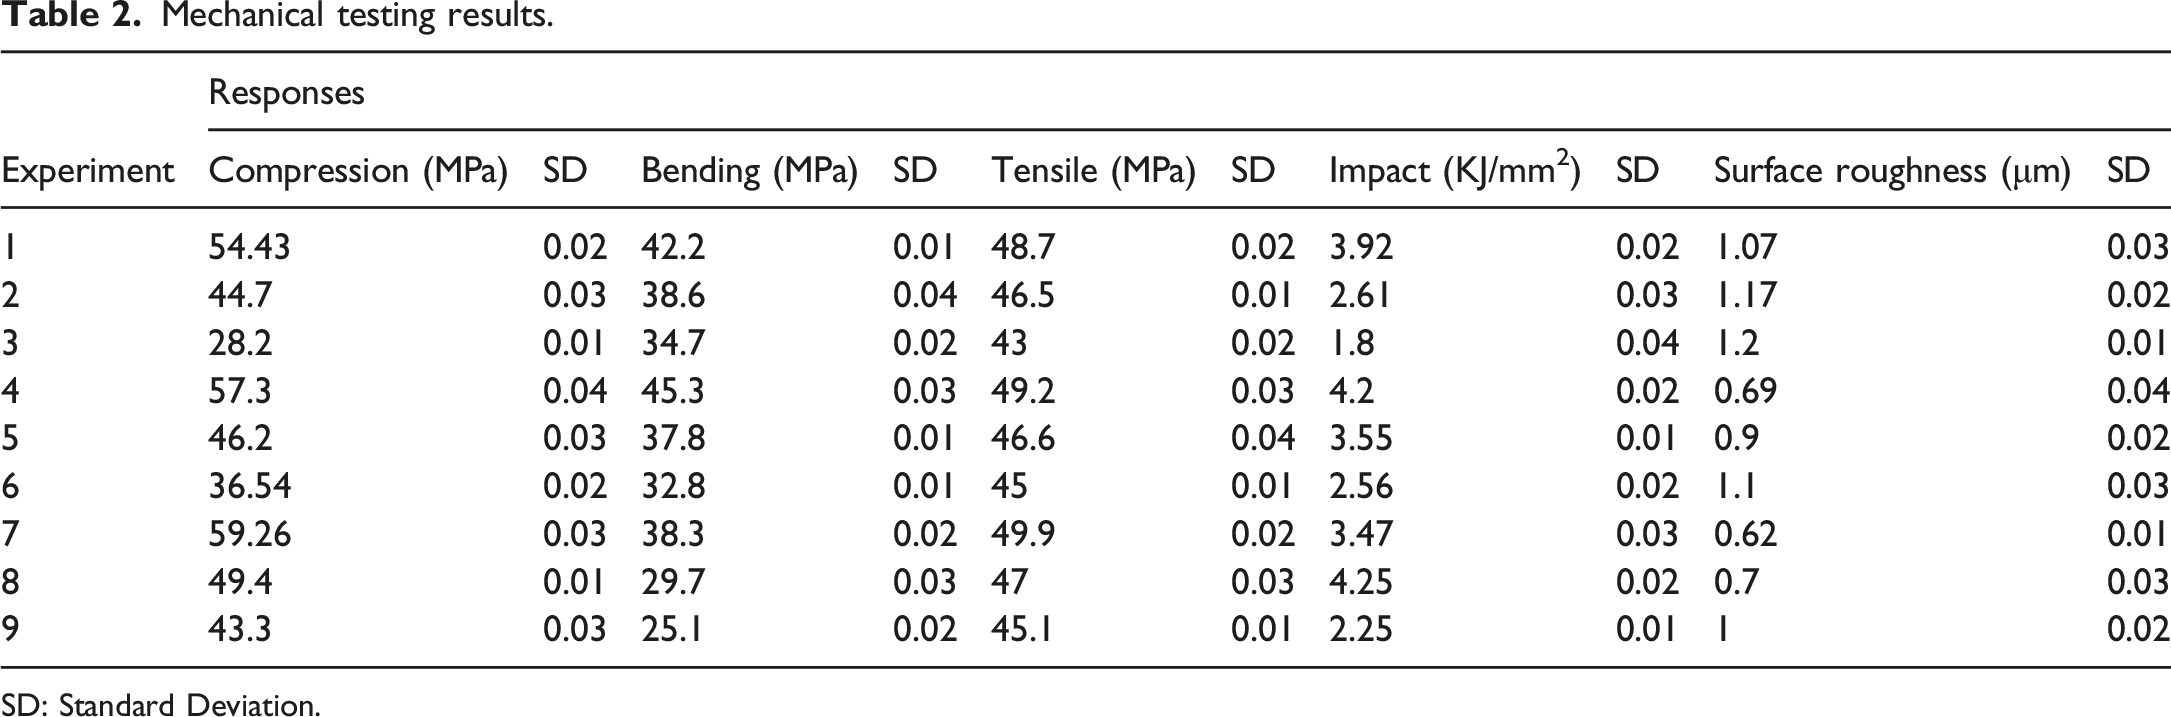
SD: Standard Deviation.
Thermal analysis
The thermal properties of the RH-PP composite were investigated using Differential Scanning Calorimetry (DSC, TA Instruments, Q200 model) and Thermogravimetric Analysis (TGA, NETZSCH STA 409PC/PG model). DSC is a widely used technique to measure heat flow, following ASTM standard D3418-15. 36 For this test, approximately 3 to 10 mg of the RH-PP composite sample was placed in a Tzero aluminum hermetic pan, which was then sealed using a sample press. The pan was transferred to the DSC machine, where it was heated, cooled and heated again at a constant rate of 10°C per minute, from room temperature to 250°C, then cooled to −50°C. This heat-cool-heat process allowed for the determination of the conversion profile and the total heat released or absorbed. The DSC data revealed the melting and recrystallization temperatures. 37
Thermogravimetric Analysis (TGA) was used to study the changes in weight of the RH-PP composite with respect to temperature investigating its thermal stability. Samples usually (5 to 10 mg) were prepared in an alumina (Al2O3) crucible following ASTM standard E1131, 38 and the analysis was conducted in an inert nitrogen gas environment at a heating rate of 10°C per minute. TGA provided data on weight change with respect to time and temperature, allowing the determination of thermal stability, decomposition temperature, and the amount of residual material left after heating. 39
Fourier transform infrared spectroscopy (FTIR)
The FTIR was used for the chemical analysis of RH-PP composite which shows the interaction between RH and PP, highlighting how the filler content and particle size influence the polymer structure, oxidation resistance, and bonding. The key absorption peaks show trends in polymer backbone stability, filler dispersion, and degradation. 40 For this purpose, the spectrophotometer (thermo scientific model: Nicolet 6700) was used.
Structural testing and surface morphology
For the surface morphology scanning electron microscopy and surface roughness tests were performed.
Scanning electron microscopy (SEM)
SEM analyses were performed on the RH-PP composite samples using an FEI Magellan model 400 XHR to examine the surface morphology of the composite. Since the samples were nonconductive, they were first painted with nickel paint to improve conductivity and then coated with carbon. A thin layer of conductive material, typically 5-10 nm, was applied. The images were taken at 5000x magnification under the following conditions: voltage of 3.0 kV, current of 25 pA, using an Everhart Thornley Detector (ETD) in secondary electron mode. These conditions revealed the overall structural integrity of the RH-PP composite. 41
Surface roughness
Surface roughness plays a significant role in the performance of PP composites, particularly in applications where surface contact and mechanical interlocking are important. 42 The surface roughness was measured using surface roughness tester (Mitutoyo, model: SJ-201) by considering the “Ra” surface profile which provides the average surface roughness of the sample and is widely accepted. 43 The surface roughness measurements, combined with SEM observations, were beneficial in understanding the interaction between the fillers and the matrix and assessing how surface topography affects the mechanical and thermal stability of the composites.
Response optimization
Response optimization was performed using Grey Relational Analysis (GRA) to identify the optimal combination of filler content and particle size for maximizing the mechanical and thermal performance of RH-PP composites. 44 GRA is a well-established multi-response decision-making technique that simplifies complex relationships by converting multiple outputs into a single grey relational grade. The method involved normalization of experimental data, calculation of grey relational coefficients, and determination of the grey relational grade for each experiment. This approach enabled a systematic ranking of composite formulations and highlighted the most influential parameters affecting composite performance. 45 During the process, the following steps were followed.
Step 1: Normalization:
Normalized the values of the multiple responses between 0 and 1, with the use of the following equations to eliminate the differences in magnitude, make them dimensionless for direct comparison and enhance its sensitivity to change. The normalized equations (1) and (2) are used for higher the better and smaller the better respectively.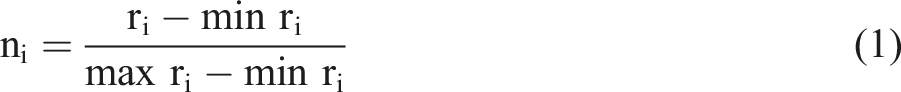

Step 2: Calculate deviation sequence:
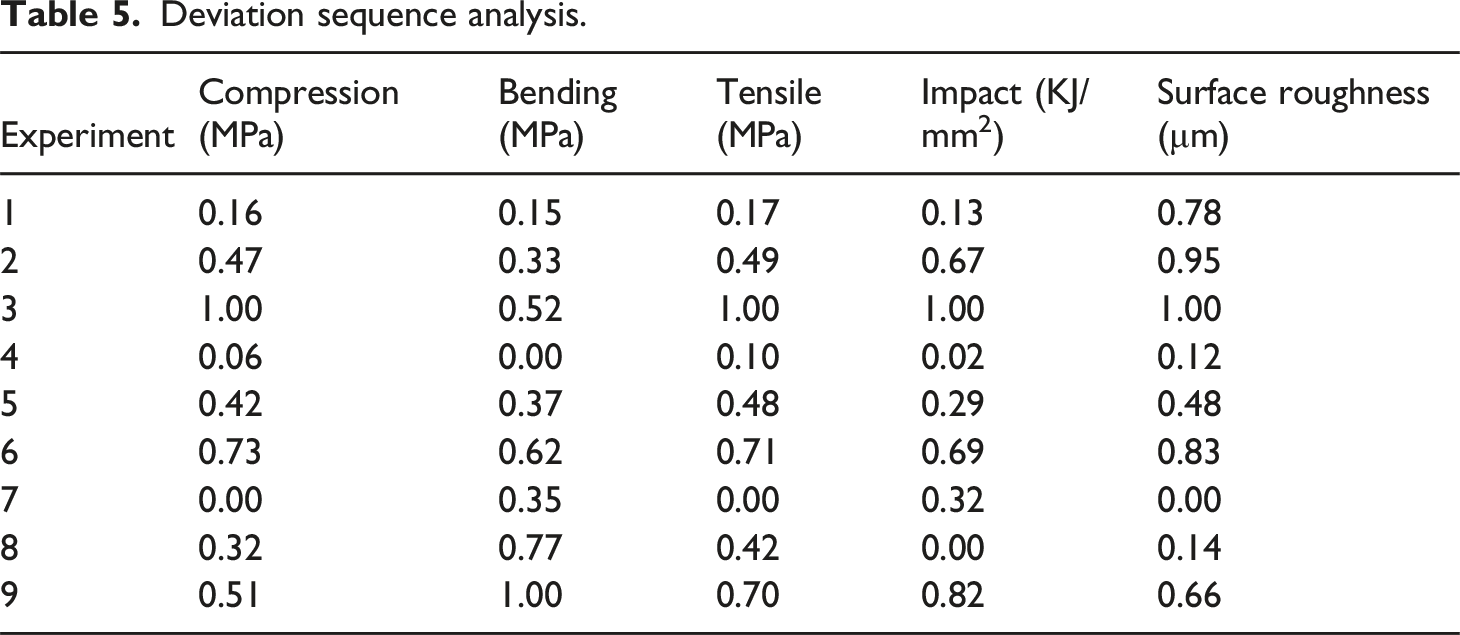
Using the normalized value of the responses, equation (3) results in a deviation sequence for a given reference and comparable sequence by taking the absolute difference.
Step 3: Calculate the Grey Relational Coefficient (GRC):
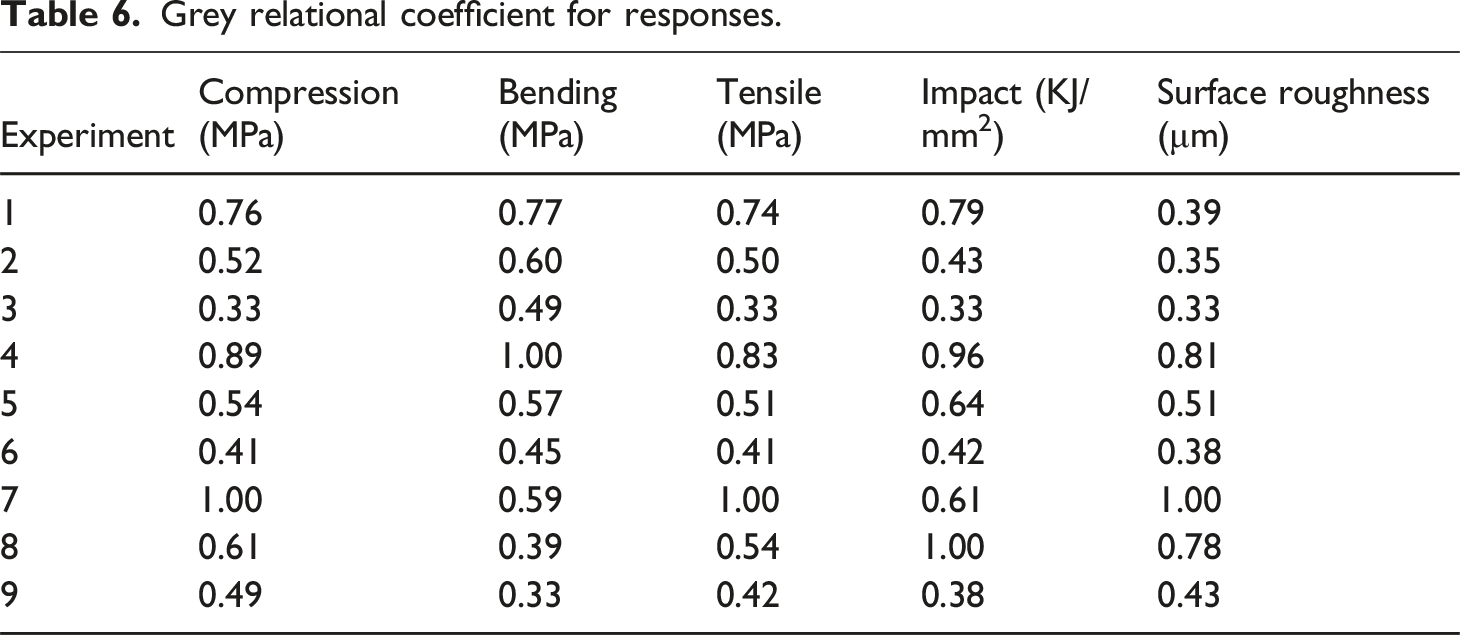
Equation (4) was applied for the calculation of GRC, which is utilized to guide the relationship that exists between ideal (finest) and the actual normalized experimental results. It can be expressed in the form of the equation as: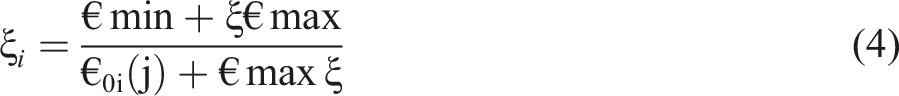
Step 4: Find Grey Relational Grade (GRG):
The GRG is calculated by averaging the GRC corresponding to each experiment. It is regarded that the basis of overall responses of the multiple performance characteristics is the GRG and is considered as the prime function. Thus, optimization of multiple complex characteristics is converted to a single GRG. Equation (5) shows how to find the GRG.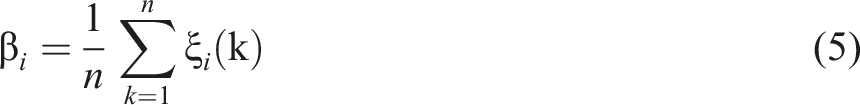
Results and discussion
Probability plots and ANOVA
Probability plots were constructed for each response variable of the experimental to check the normality of the data. All plots for the response variables were made at a 95 % confidence level.
46
Figure 5 shows that all data points for each test lie close to the fitted line and therefore an indication that data is normally distributed. But further validation is done through statistical testing named Anderson Darling (AD) to check the assumption of data normality. The input data is considered normal if the p-value of the AD test is greater than 0.05.
47
Hence, the results of AD test show that the p-value for all the responses are greater than 0.05 thus, shows that the data is normally distributed and are fit for further optimization and analysis.
48
Probability plots for responses of RH-PP composite.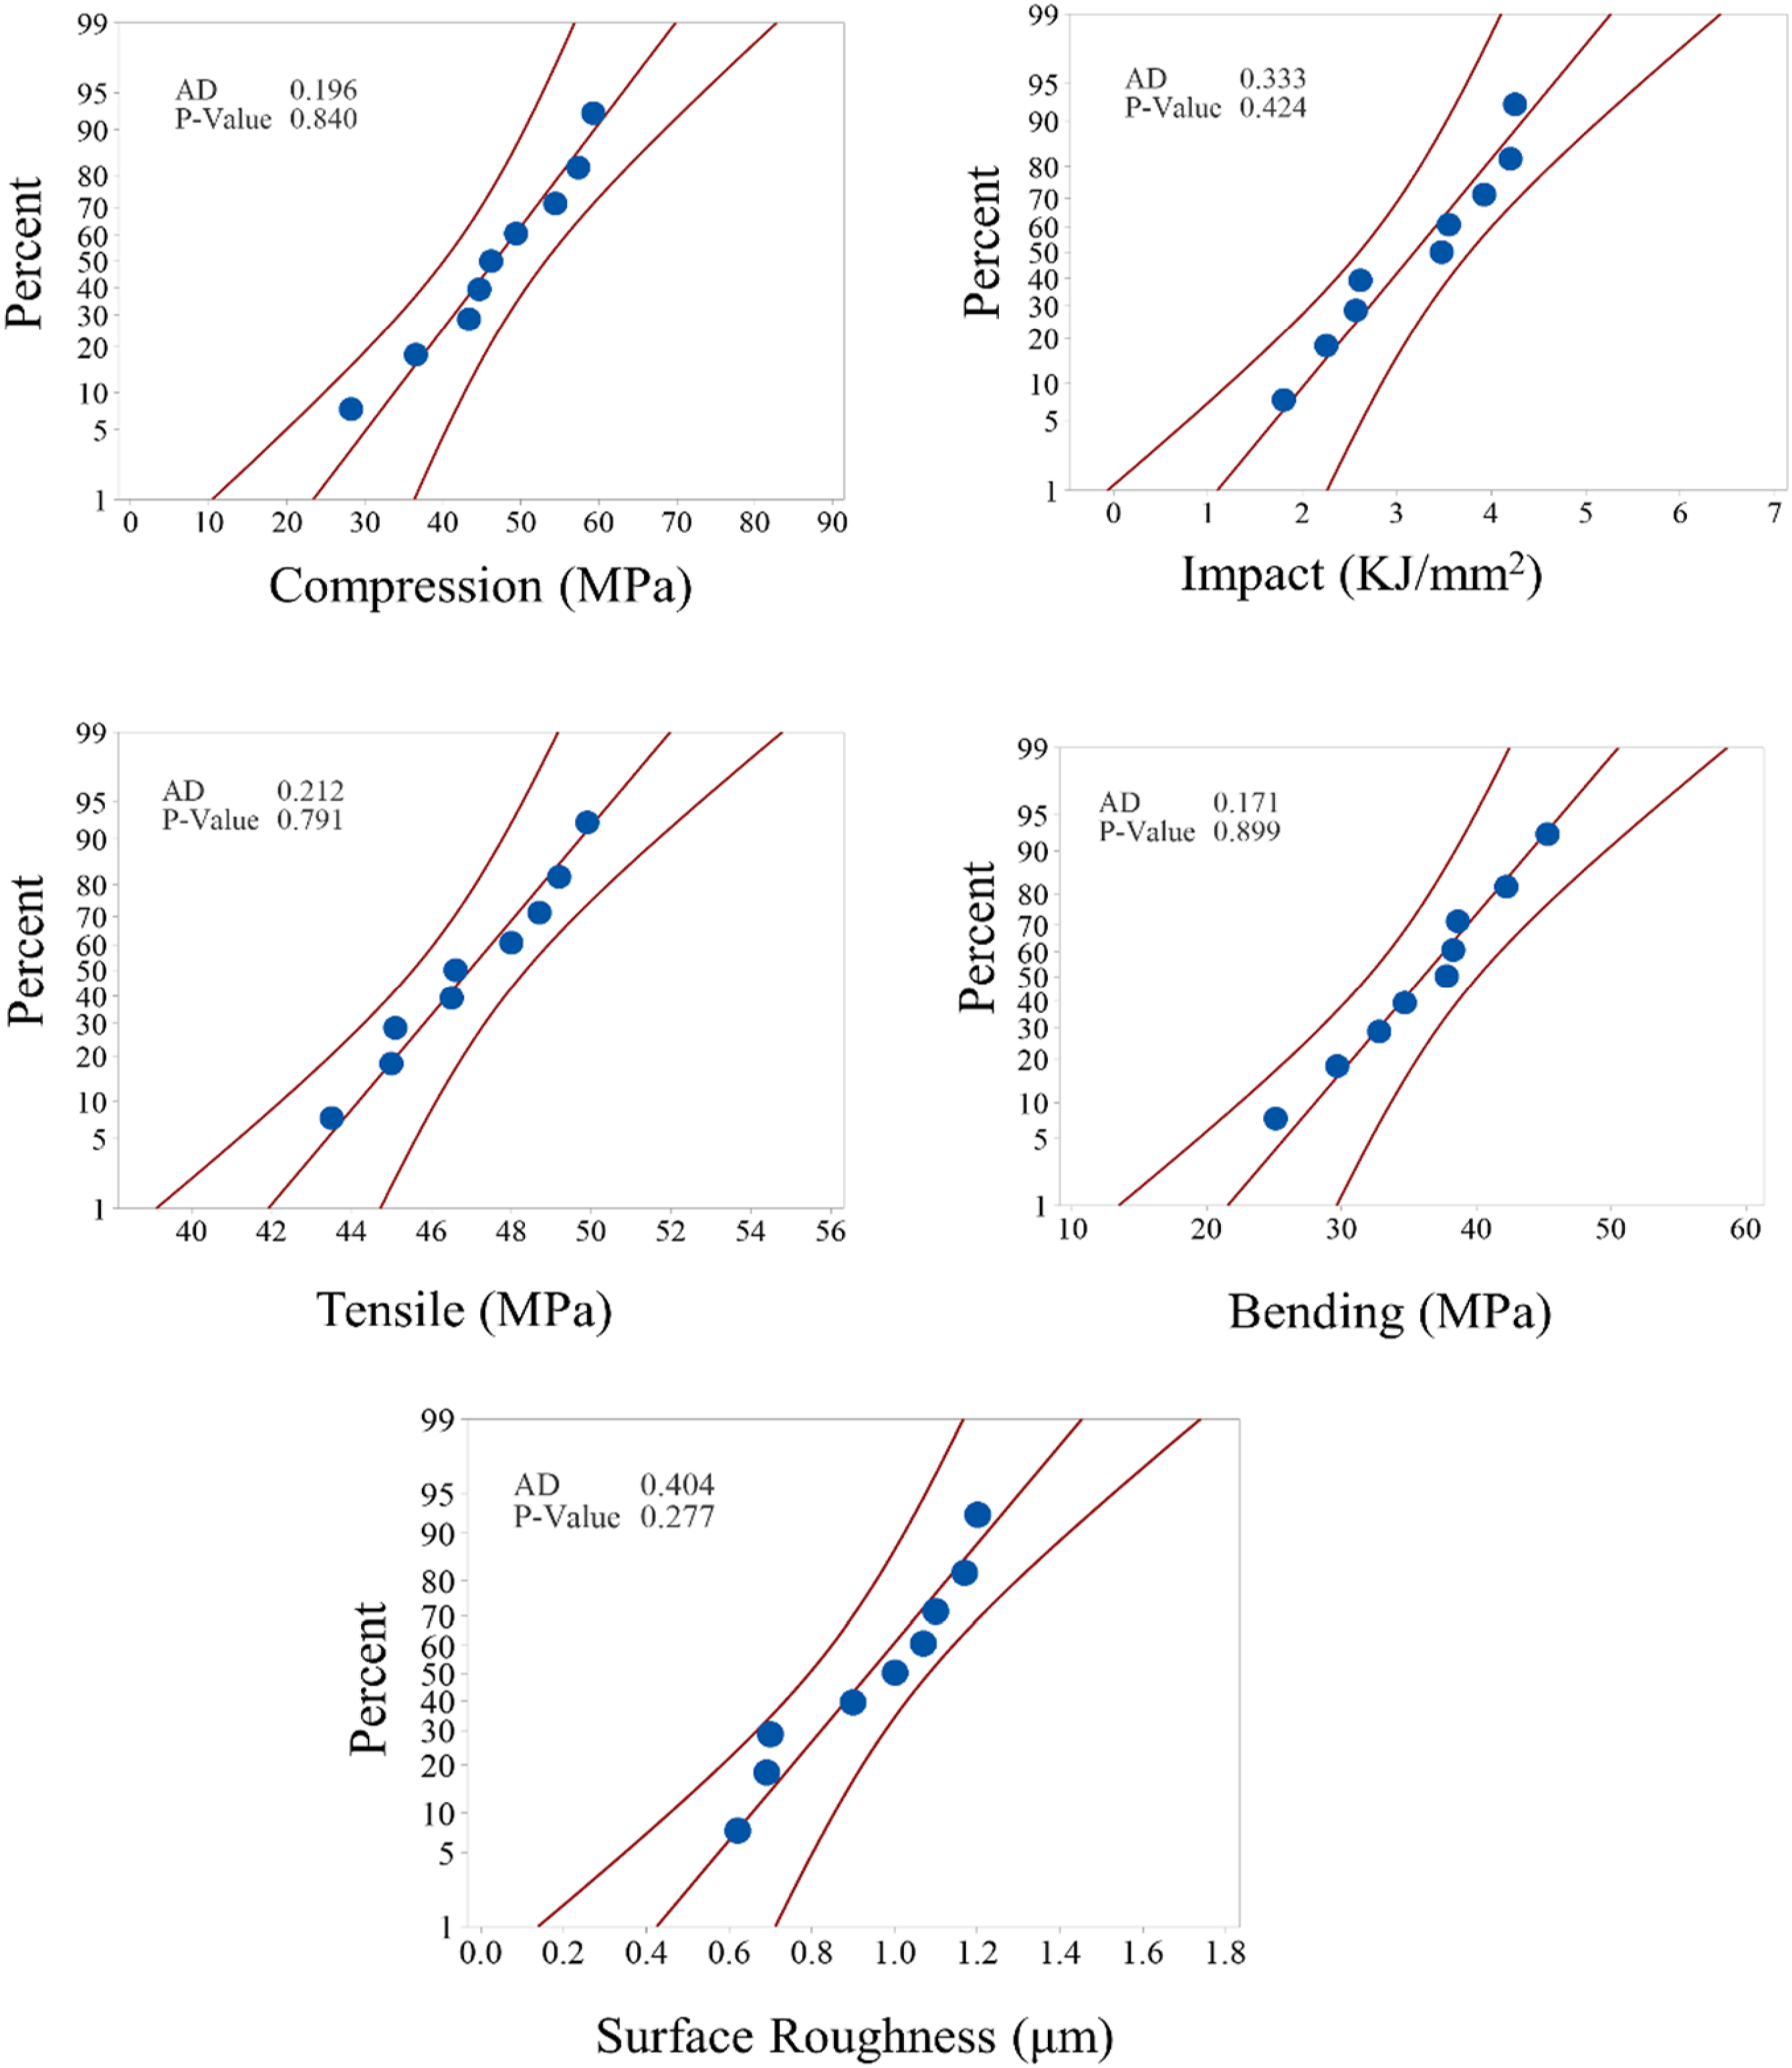
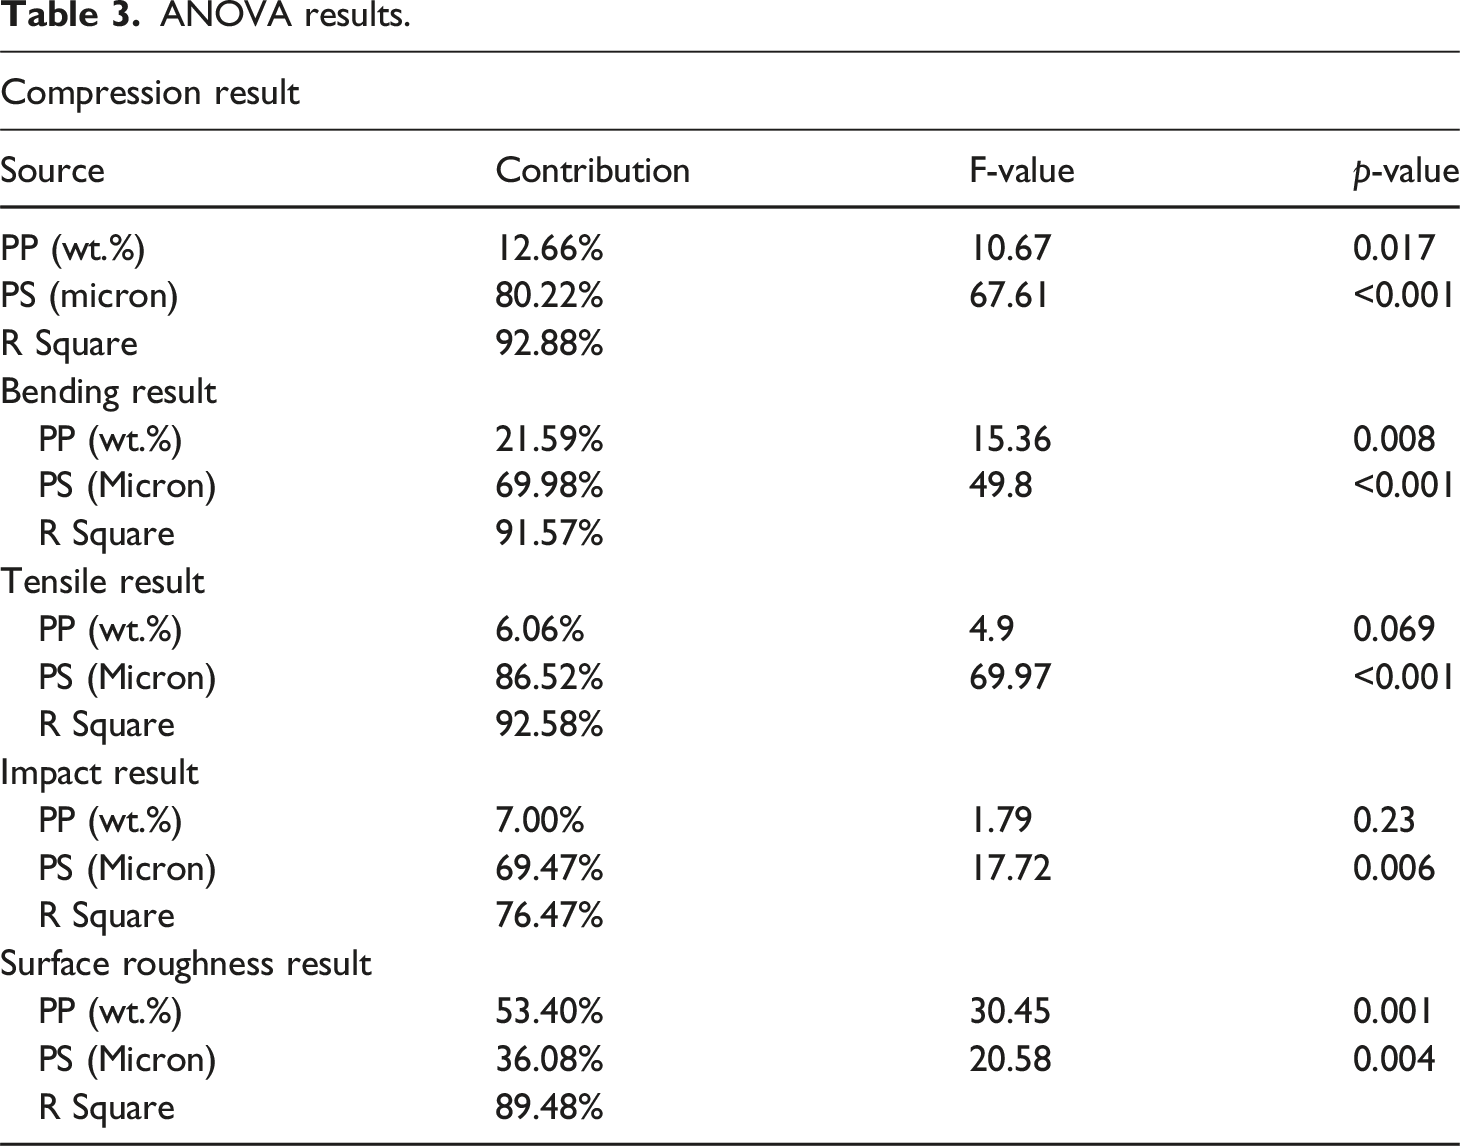
ANOVA results.
Main effect plots of responses based on mean values
Compression strength
Figure 6 shows the main effect plot for compression strength, which shows that the mean increases with the increased PP weight percentage ratio and decreased with the increase in RH weight percentage ratio. The particle size of RH greatly affects the mean as it increases the mean highly decreases which means that the larger particle size adversely affects the compression strength of RH-PP composite. The best result for compression strength is achieved when the PP is 90 wt %, RH is 10 wt % and particle size is 125 μm. The observed effects on compression strength in the main effects plots can be attributed to the material properties and interactions within the RH-PP composite. Increasing the PP content from 70 wt % to 90 wt %, enhances the compression strength because PP is a strong and durable polymer, and a higher PP content results in a denser and more continuous matrix that effectively transfers and distributes stress.
50
Additionally, better interfacial adhesion between the PP matrix and the RH coupled with a more homogeneous material structure with fewer voids and defects, contributes to improved strength. Conversely, increasing the RH content from 10 wt % to 30 wt %, reduces compression strength. This is because a higher RH content decreases the proportion of PP, weakening the beneficial effects of the polymer matrix. Moreover, Larger particle sizes negatively impact compression strength due to stress concentration, poor dispersion within the PP matrix, and reduced interfacial bonding surface area.
51
Larger particles tend to create agglomerations and weak spots, while smaller particles provide a larger bonding surface area, enhancing the overall strength. Main effect plot of compression strength of RH-PP composite.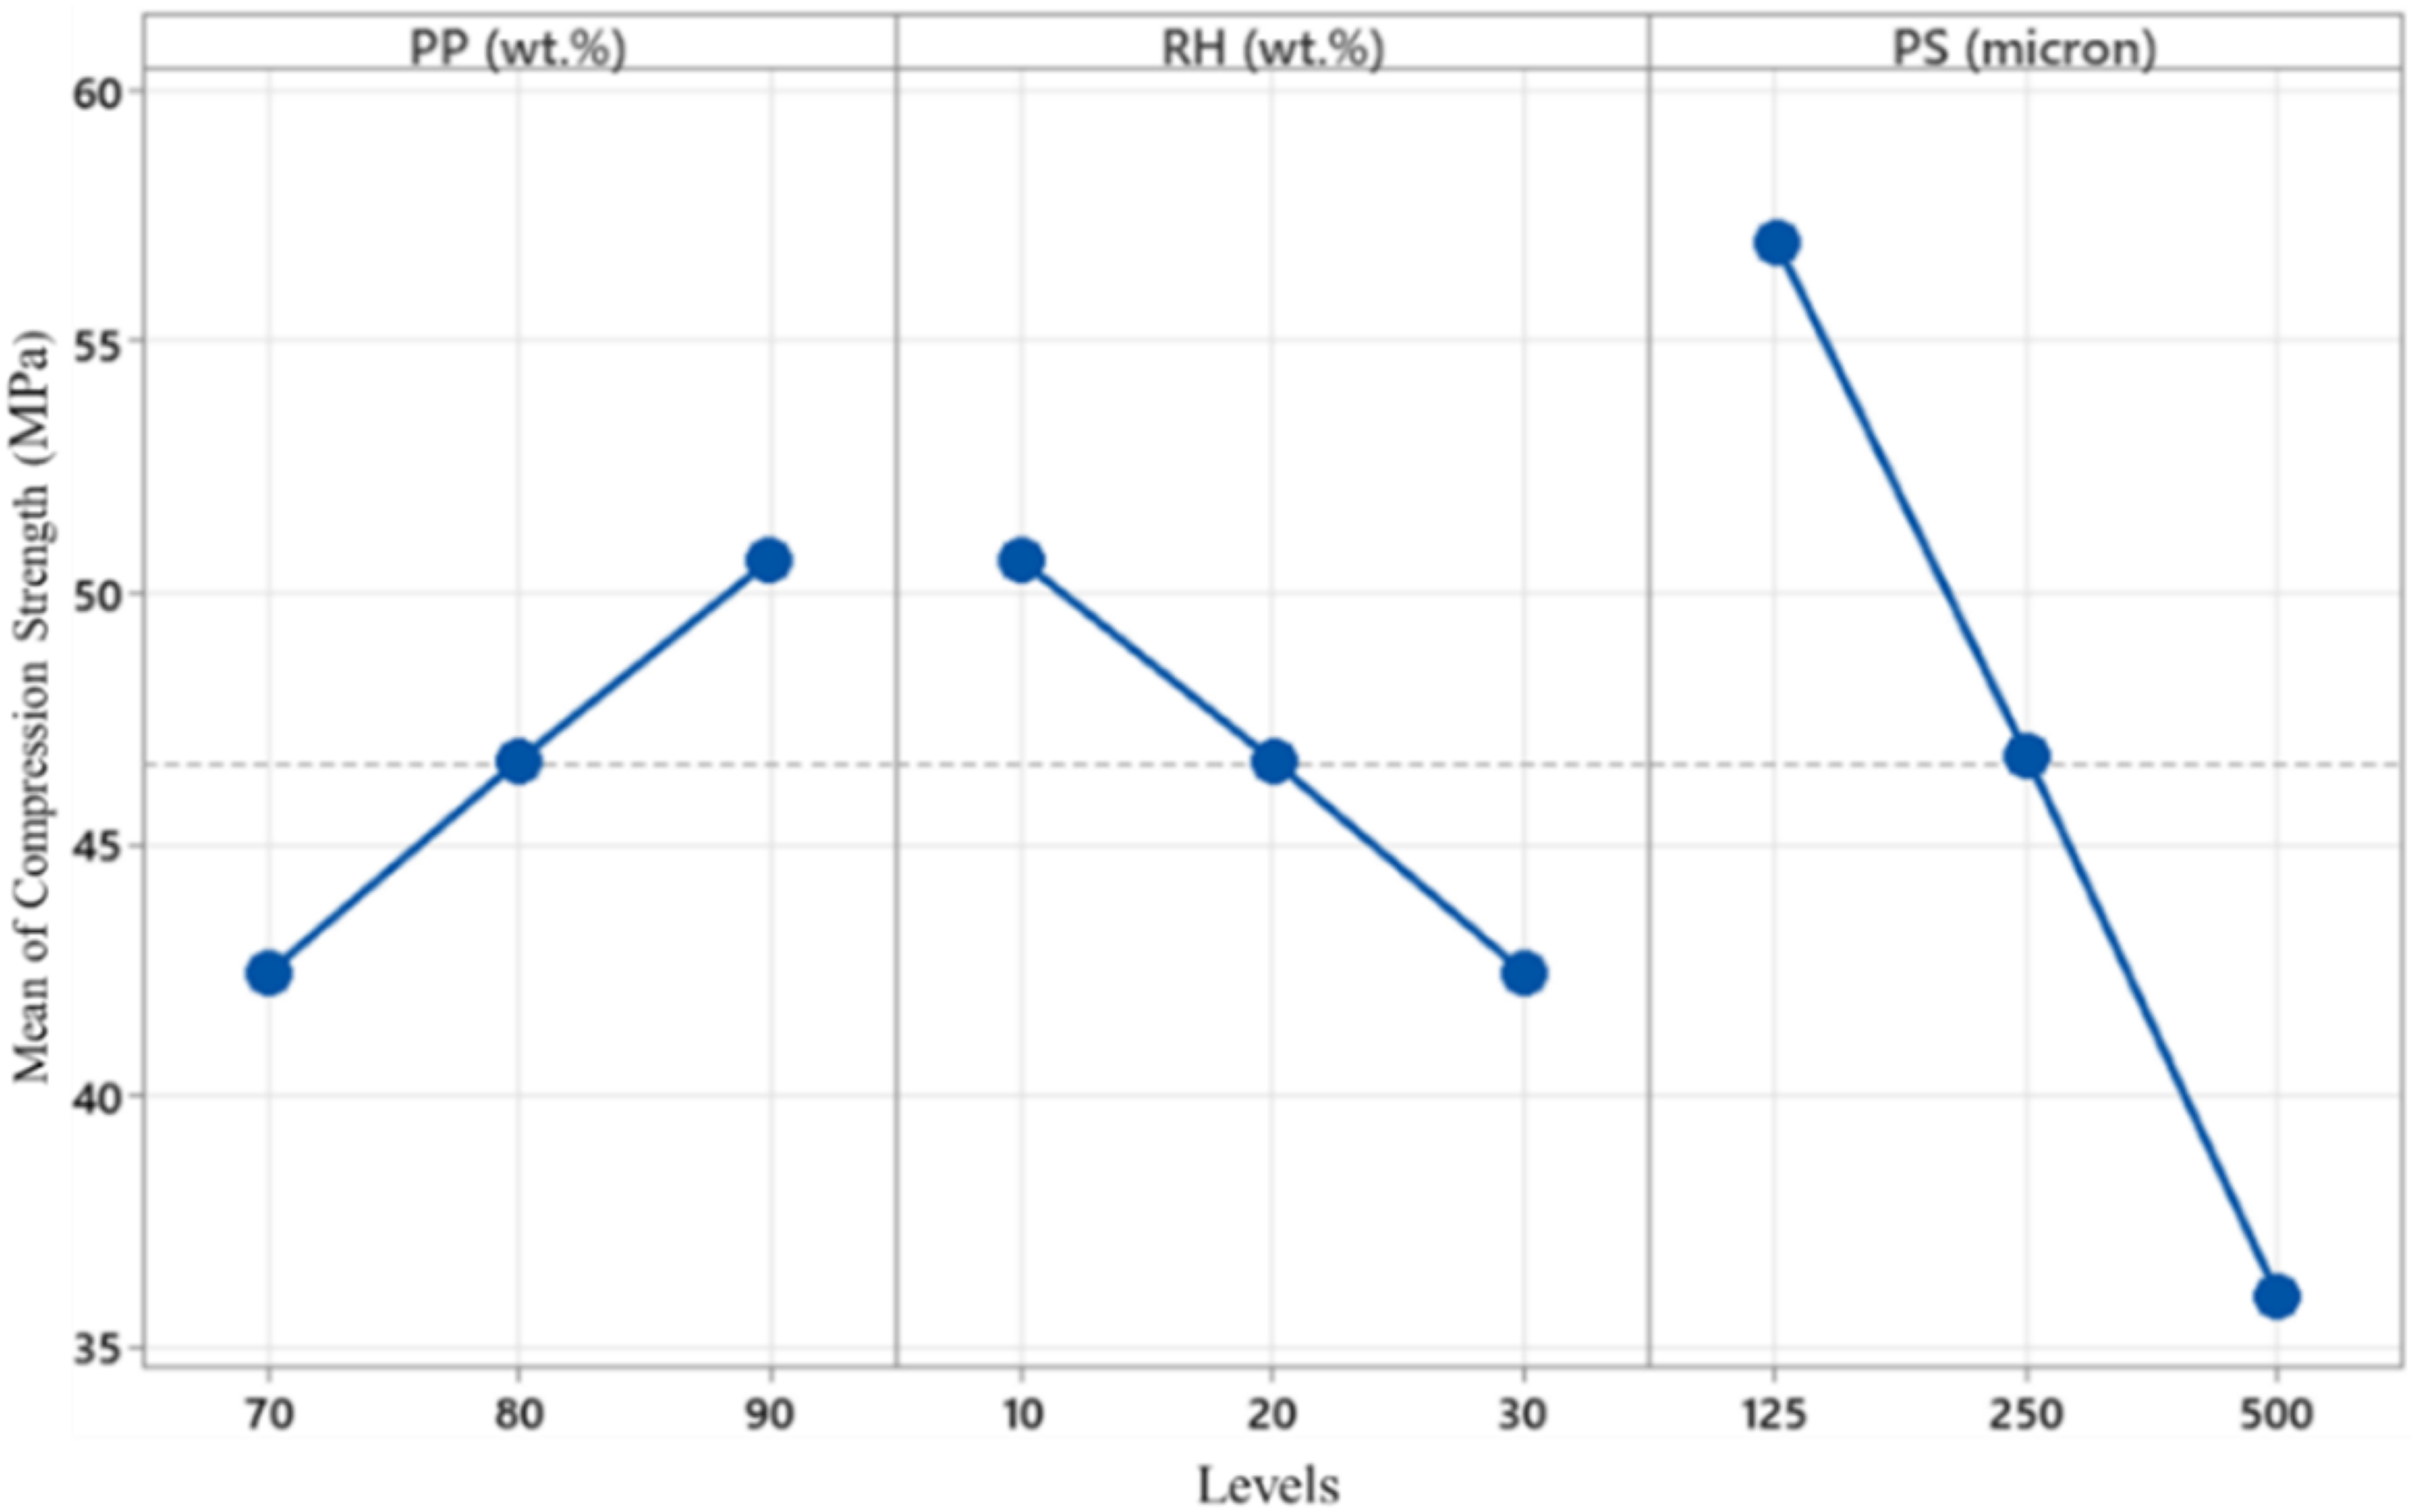
Figure 7 illustrates the compressive stress–strain behavior of RH-PP composites developed from nine formulations tested according to ASTM D695. All curves exhibit a distinct linear elastic region up to approximately 0.7%–1.0% strain, followed by a yielding transition and subsequent plastic deformation. The ultimate compressive strength (UCS) is observed at the peak of each curve, with values corresponding to those reported in Table 2. Composites with smaller RH particle sizes (125 µm) and lower RH content (10–20 wt%) demonstrate higher compressive strength and better plastic deformation characteristics, attributed to improved filler dispersion and stronger interfacial bonding. Conversely, increasing RH content to 30 wt% or using larger particle sizes (500 µm) reduces compressive strength due to filler agglomeration and weaker matrix–filler adhesion. Notably, the formulation with 90 wt% PP, 10 wt% RH, and 125 µm particles (Exp 7) exhibits the highest compressive strength (59.26 MPa), validating the optimization findings from grey relational analysis. These curves provide insight into the load-bearing behavior of RH-PP composites and highlight the influence of compositional parameters on compressive performance, which is critical for applications such as prosthetic and orthotic components. Compressive stress–strain curves for RH-PP composites under ASTM D695 standard.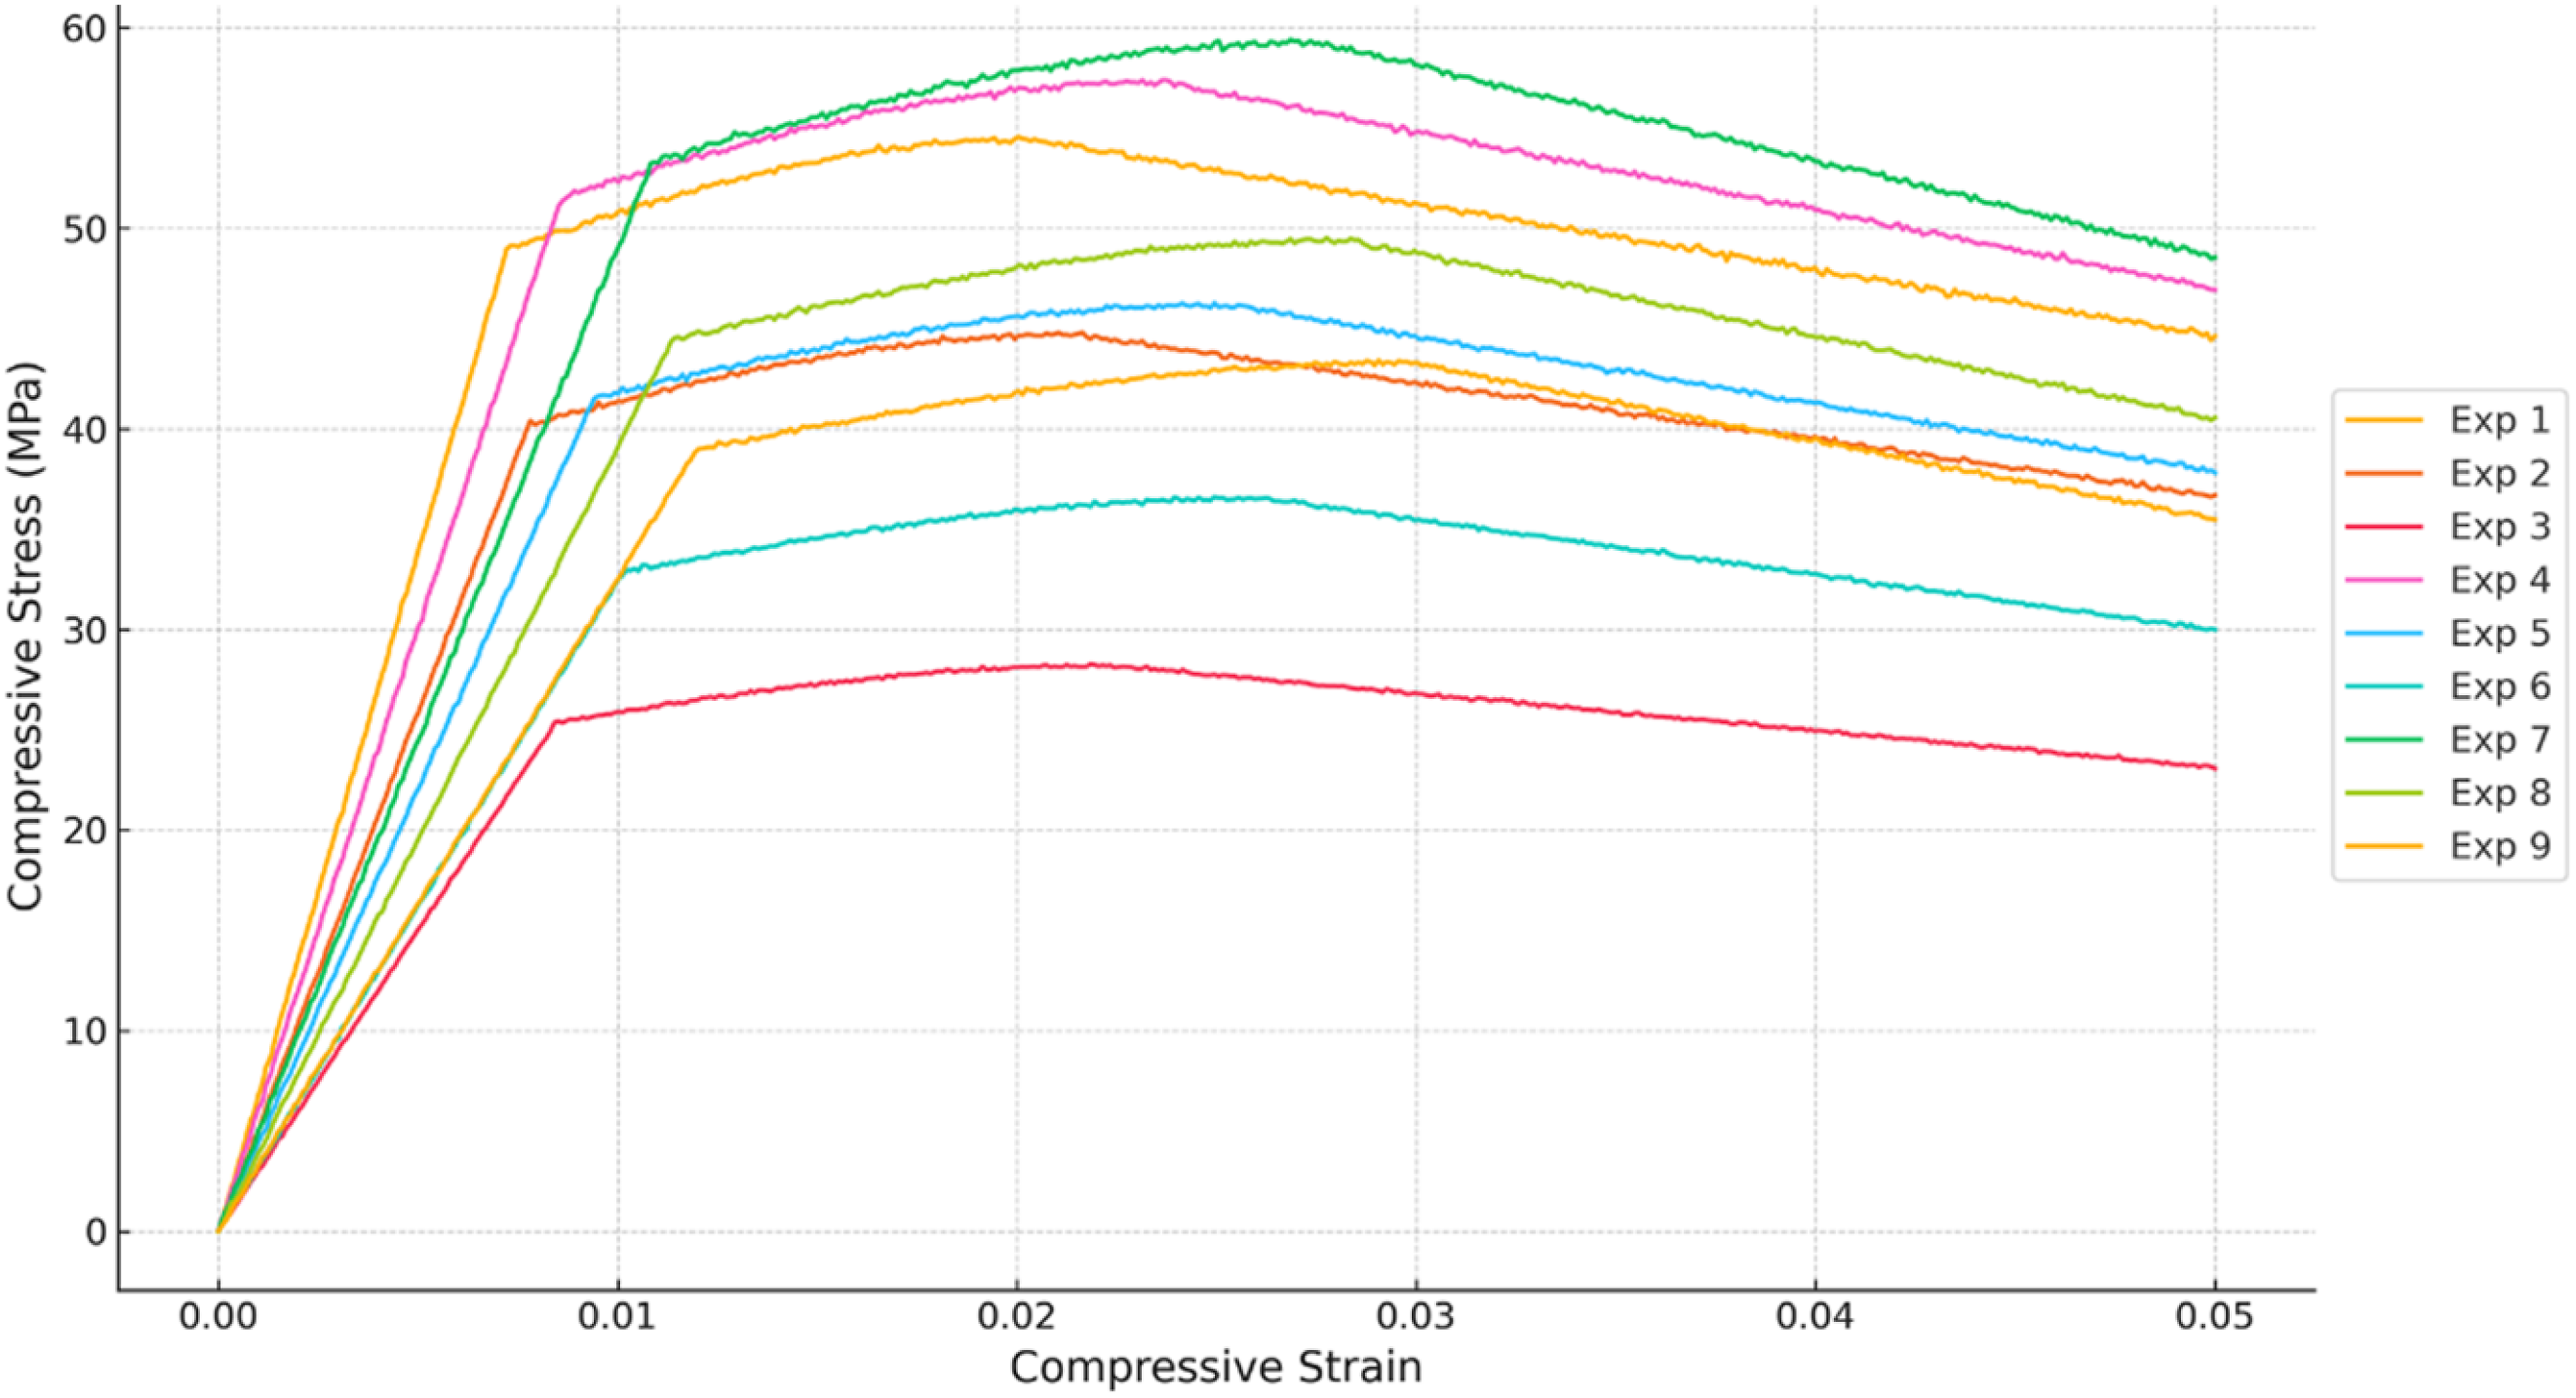
Bending strength
Figure 8 shows the main effect plot for bending strength and indicates that the mean decreases with increasing PP weight percentage ratio and increase with an increase in weight percentage of RH. The particle size of RH greatly affects the mean as it increases, the mean highly decreases which means that the larger particle size adversely affects the bending strength of RH-PP composite. The best result for bending strength is achieved when the PP is 80 wt %, RH is 20 wt % and particle size is 125 μm. For PP weight percentage, the bending strength is relatively high and stable at 70% and 80%, but it decreases significantly at 90%. This decline suggests that an excessive amount of PP reduces the reinforcement effect of the filler, leading to poorer bending properties.
52
Similarly, for RH weight percentage, the highest bending strength occurs at 20%, indicating an optimal balance between filler and matrix for effective load transfer. At 10% RH, the insufficient filler reduces the reinforcement, while at 30%, excessive filler may lead to clustering or void formation, weakening the composite. As for particle size, larger particles negatively impact bending strength. This is because larger particles tend to create unevenness in the composite material, leading to areas where stress can concentrate and cause the material to fail under bending forces. Moreover, larger particles offer less surface area for bonding with the PP matrix, resulting in weaker overall adhesion. Main effect plot of bending strength of RH-PP composite.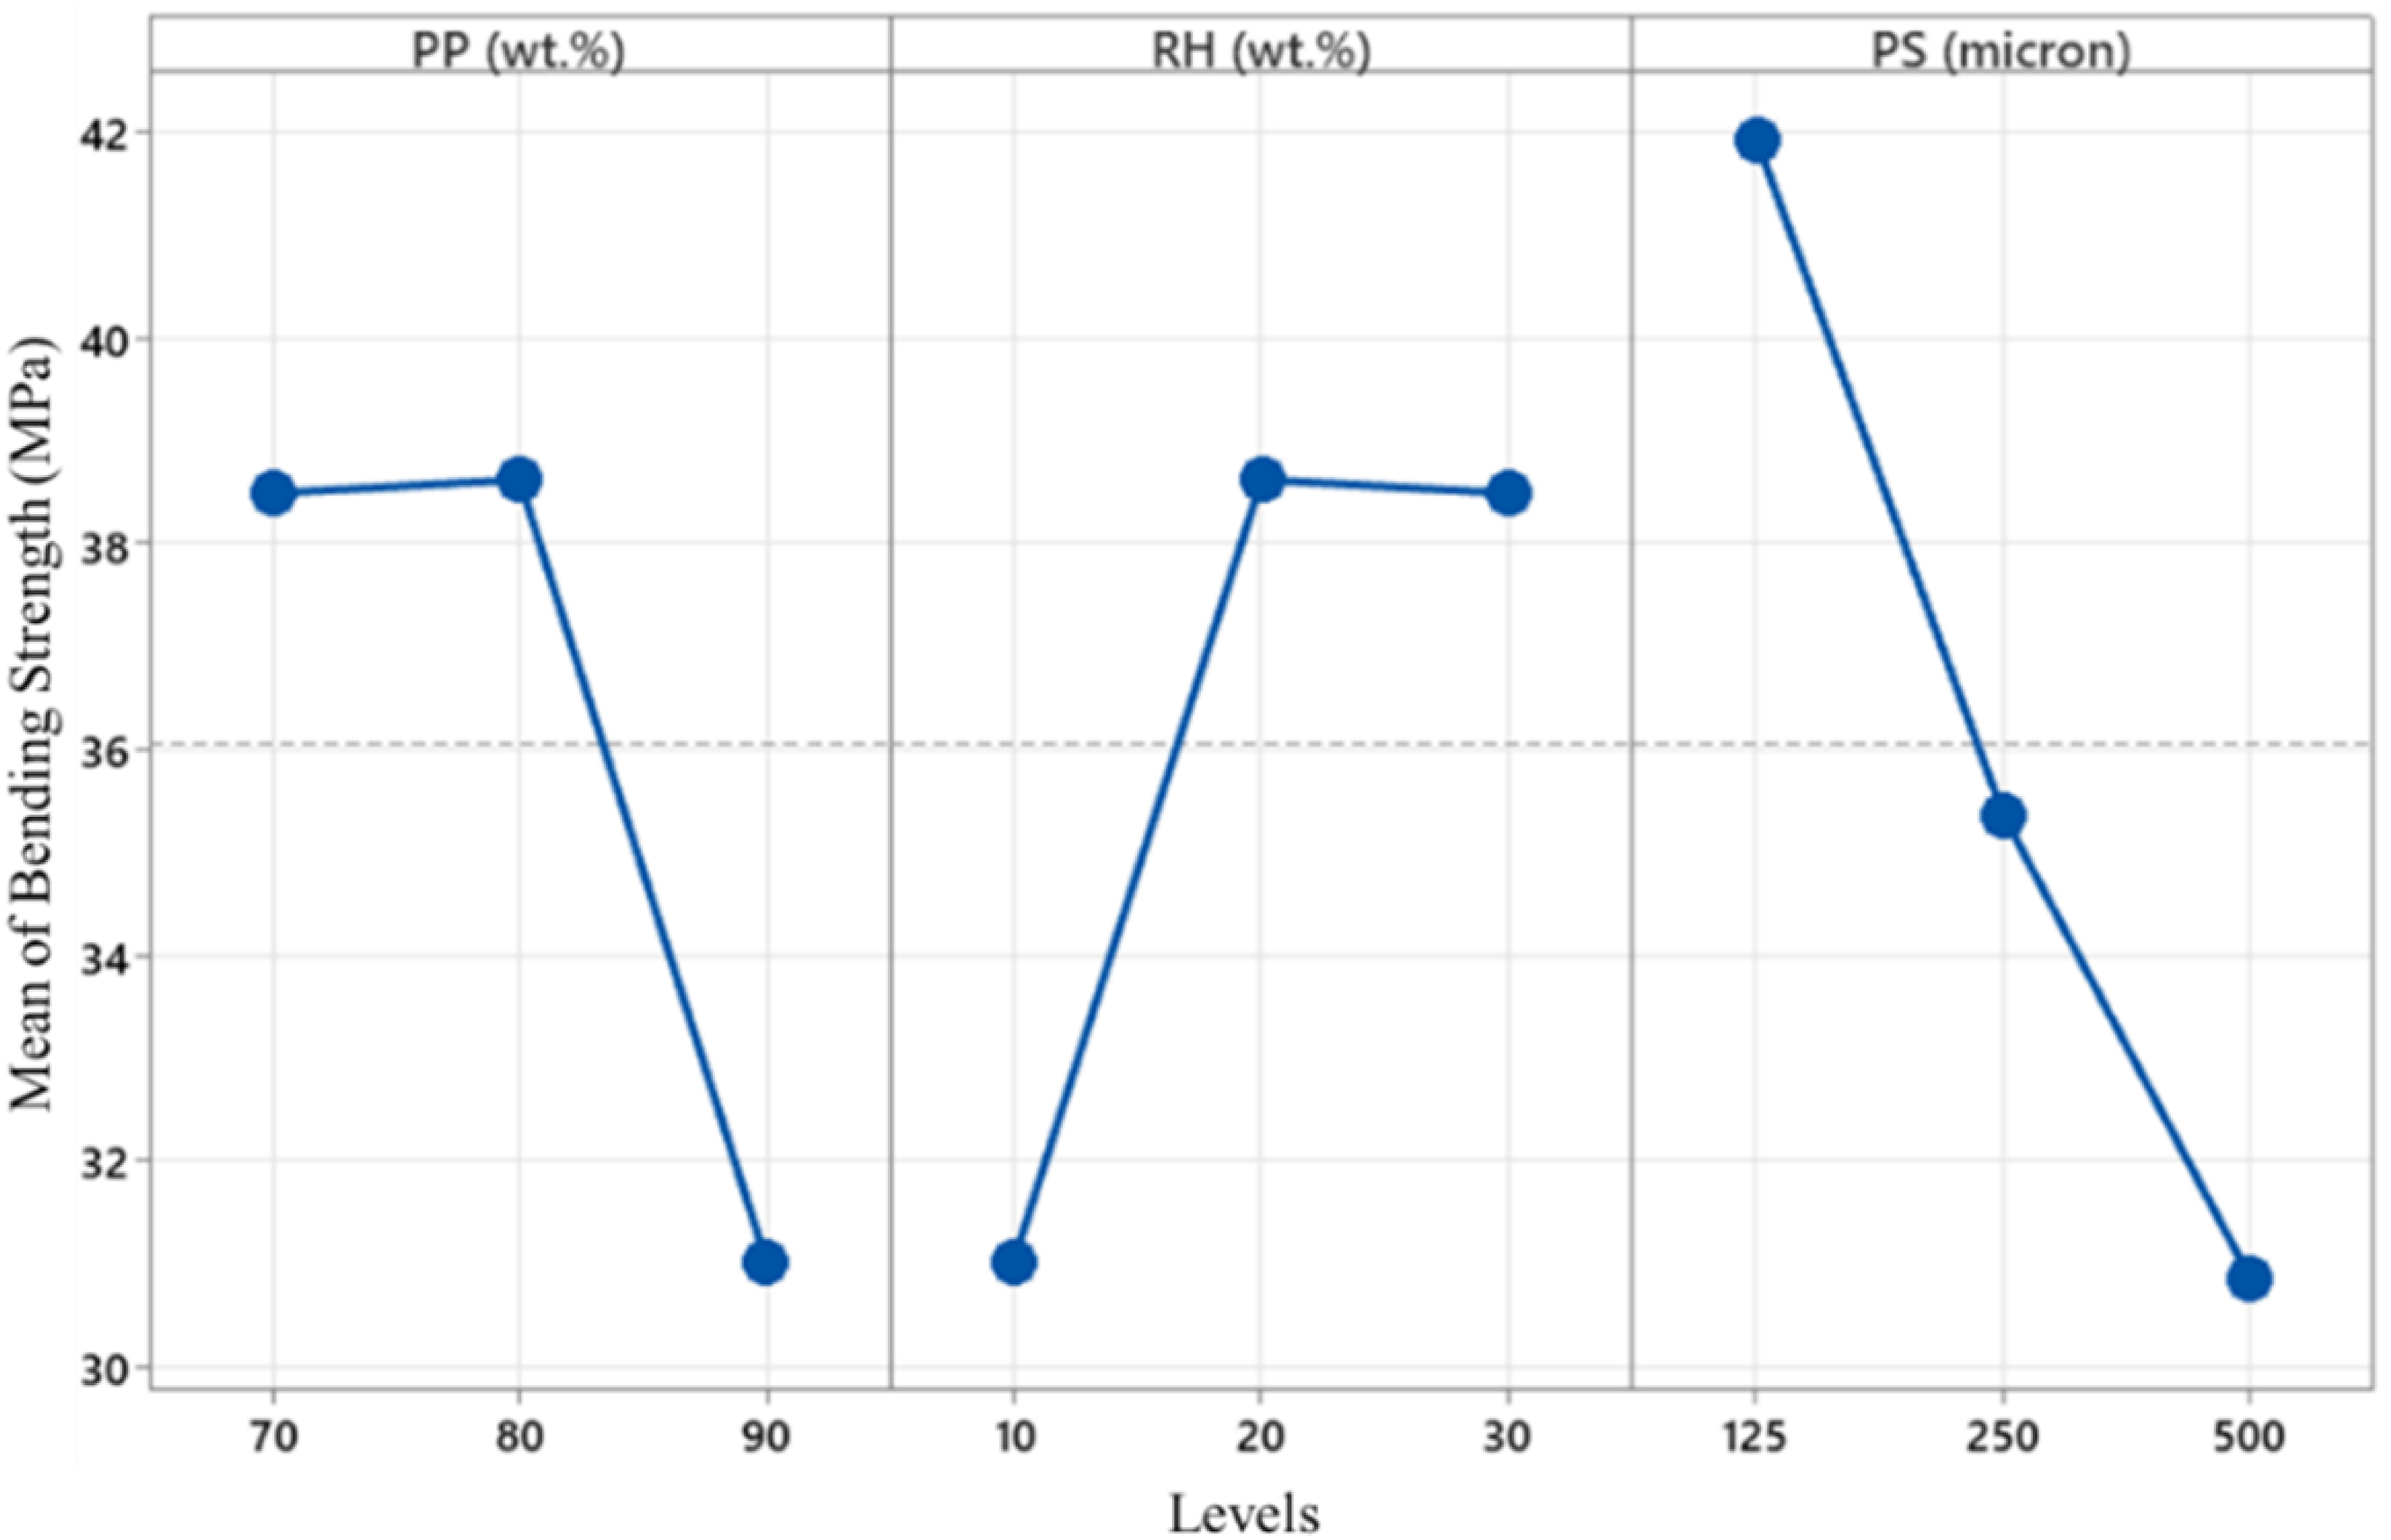
Figure 9 presents the flexural stress–strain behavior of RH-PP composites evaluated using the ASTM D790 three-point bending method. All formulations display a linear elastic response up to approximately 2% strain, followed by a smooth yielding transition and gradual softening beyond 4% strain as the material approaches failure. Minor fluctuations in the post-yield region are characteristic of natural fiber composites and reflect microstructural inconsistencies and interfacial friction. Among all samples, the composite with 80 wt% PP, 20 wt% RH, and 125 µm particle size (Exp 4) demonstrates the highest flexural strength (45.3 MPa), aligning with the values in Table 2 and optimization results from grey relational analysis. Composites with higher RH content (30 wt%) or larger filler sizes (500 µm) show lower flexural strength due to reduced interfacial bonding and increased filler agglomeration. Despite a relatively lower stiffness compared to synthetic composites, the RH-PP composites exhibit stable post-yield behavior with moderate ductility, making them suitable for semi-structural applications. This flexural response is characteristic of polypropylene reinforced with natural fillers, where the variability in fiber structure and interfacial bonding influences load-bearing performance. The gradual softening beyond the yield point reflects the deformation behavior typical of lignocellulosic filler systems. Overall, RH-PP composites offer a balance of strength and flexibility, supporting their potential in environmentally sustainable engineering applications. Flexural stress strain curves of RH-PP composites under ASTM D790 standard.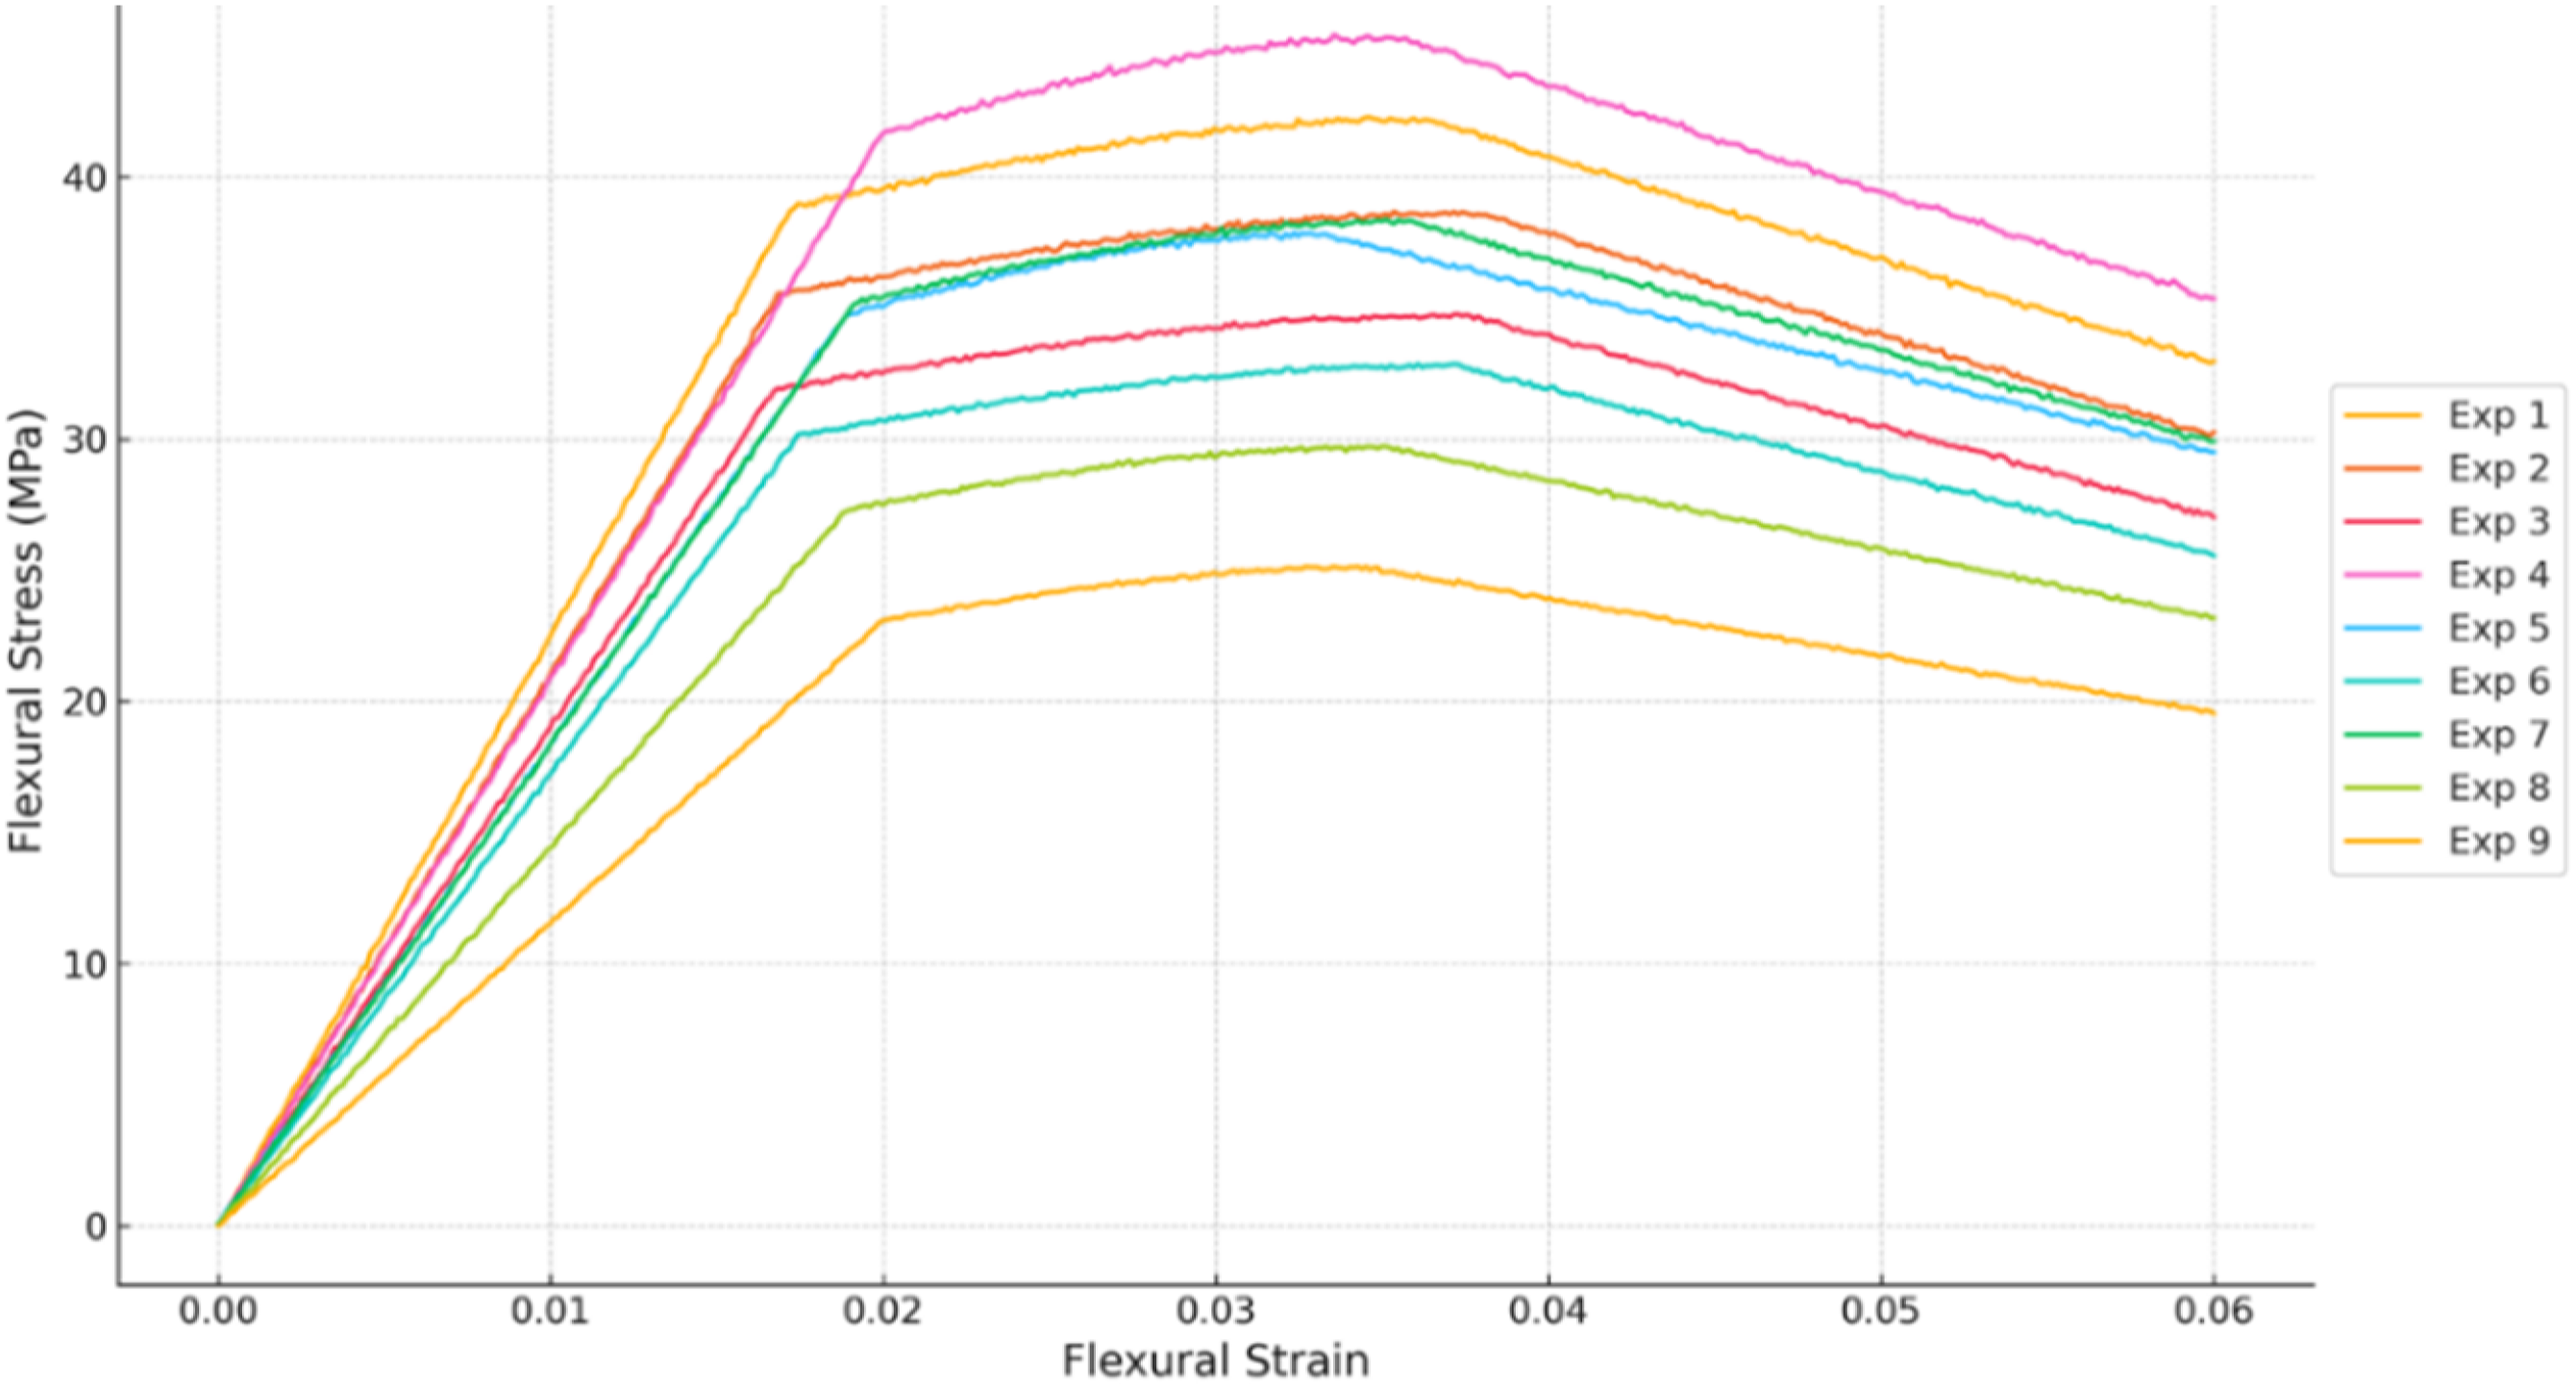
Tensile strength
Figure 10 presents the main effect plots for tensile strength, illustrating the influence of PP content, RH content, and particle size on the mechanical behavior of the composite. The tensile strength shows a slight increasing trend with higher PP content (70 wt% to 90 wt%), indicating that a higher polymer fraction improves matrix ductility and stress distribution under tensile loading.
53
However, the relatively small variation in tensile strength across different PP levels suggests that PP content alone does not strongly influence tensile performance. This may be due to a trade-off between polymer continuity and filler reinforcement, where an excess of PP reduces the structural contribution of the filler phase. RH content has a more significant negative effect, as increasing RH content from 10 wt% to 30 wt% progressively reduces tensile strength. This decline is primarily due to poor interfacial adhesion between the hydrophobic PP matrix and the hydrophilic lignocellulosic RH particles, leading to weak interphase regions. Poor bonding promotes the formation of voids and stress concentration points, which reduce the composite’s ability to bear tensile loads.
54
Additionally, higher RH content increases particle agglomeration, further impairing load transfer and promoting brittle failure mechanisms. Among all factors, particle size has the most significant impact on tensile strength. The highest tensile strength is observed at a particle size of 125 µm, which provides an optimal balance between surface area and interfacial bonding. Smaller particles ensure better stress transfer efficiency, while larger particles (250–500 µm) disrupt matrix homogeneity, create voids, and act as stress concentration sites, leading to a sharp decline in tensile strength.
55
The best result for tensile strength is achieved at PP 90 wt%, RH 10 wt%, and a particle size of 125 µm, confirming that optimal filler dispersion and interfacial bonding are key to improving tensile performance. Main effect plot of tensile strength of RH-PP composite.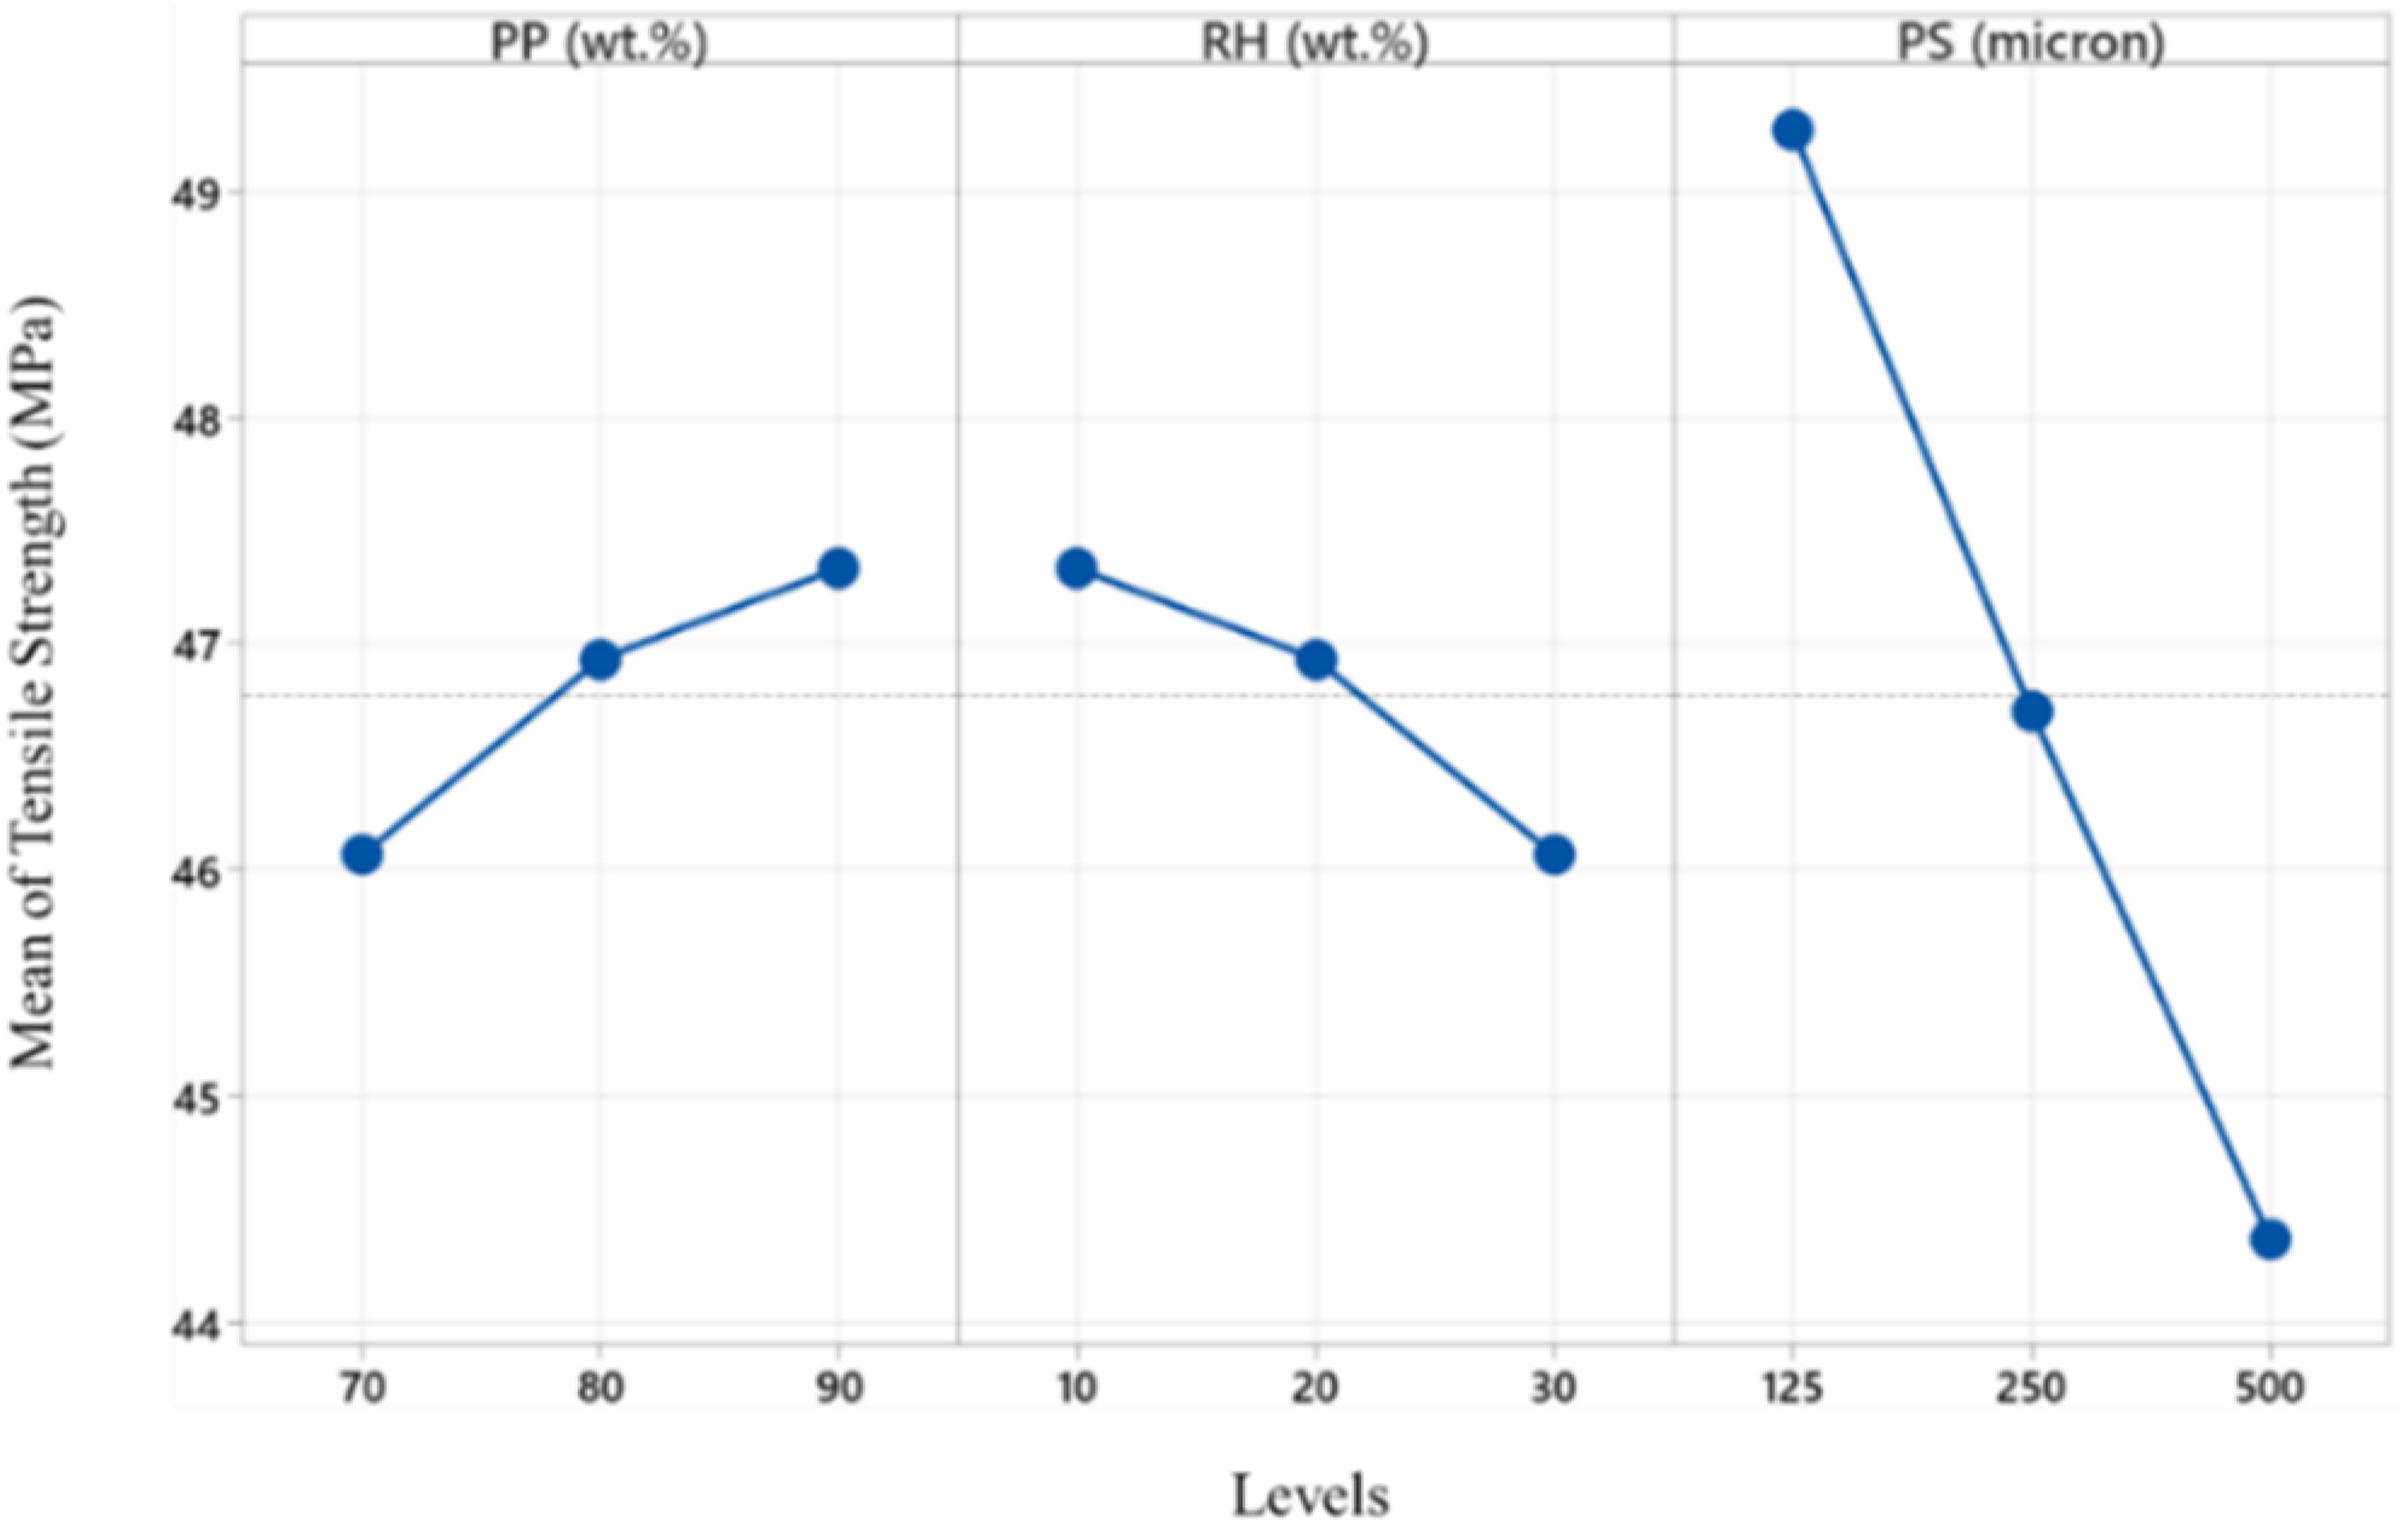
Figure 11 shows the tensile stress–strain curves of RH-PP composites tested according to ASTM D638. The curves exhibit an initial linear elastic region up to approximately 2% strain, followed by a smooth yielding phase extending to around 5% strain. After reaching their ultimate tensile strength, the composites undergo gradual stress reduction, ultimately failing by 8% strain. This behavior indicates a moderately ductile fracture mode typical of semi-crystalline thermoplastics reinforced with natural fillers. The tensile response varies across formulations due to differences in PP–RH ratios and RH particle sizes. The highest tensile strength is observed for the composite with 90 wt% PP, 10 wt% RH, and 125 µm particle size (Exp 7), corresponding with Table 2 and optimization results. In contrast, formulations with higher RH content and larger particle sizes show reduced tensile strength due to poor interfacial bonding and filler agglomeration. Overall, the RH-PP composites demonstrate mechanical properties suitable for semi-structural and lightweight applications. The smooth post-yield softening and delayed fracture suggest that these composites can sustain moderate deformation before failure, a desirable trait in impact-prone or fatigue-sensitive components. The tensile profiles support the feasibility of RH-PP composites in eco-friendly engineering solutions where balanced strength and flexibility are needed. Tensile stress–strain curves of RH-PP composites under ASTM D638 standard.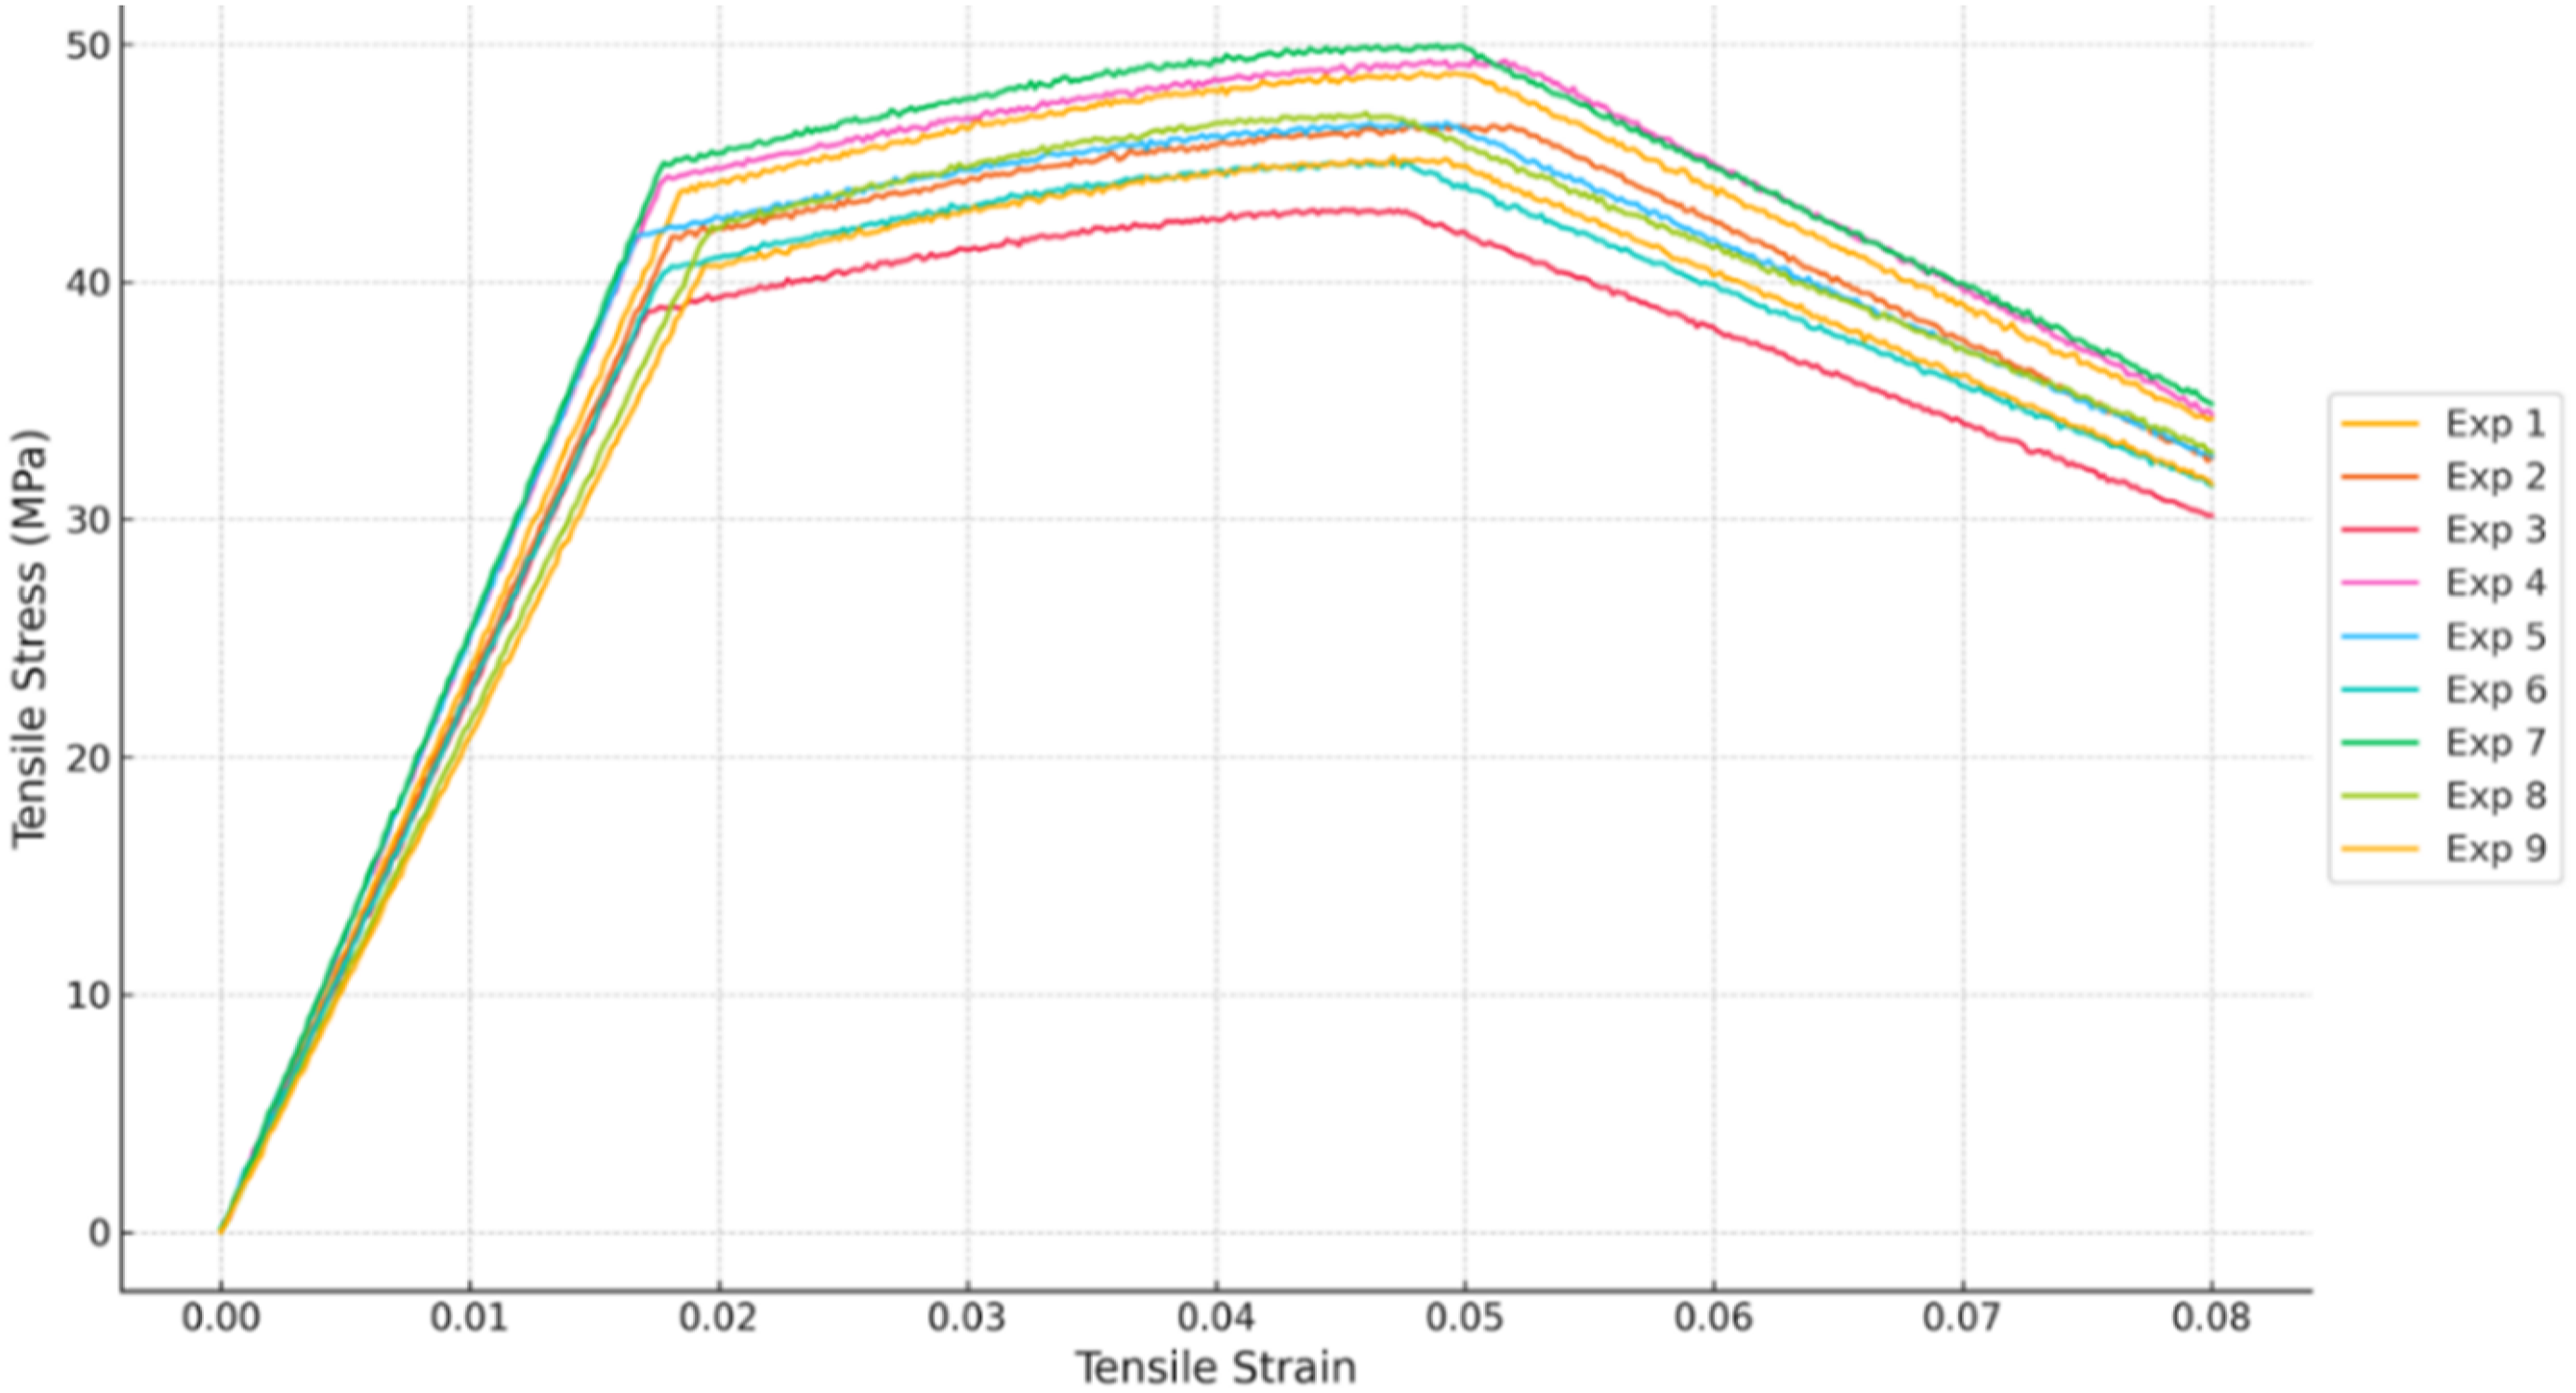
Impact strength
Figure 12 presents the main effect plots for impact strength, highlighting the influence of PP content, RH content, and particle size on the composite’s ability to absorb and dissipate impact energy. PP content significantly affects impact strength, with a noticeable increase observed when PP is increased from 70% to 80%, indicating improved energy absorption due to an optimal matrix-to-filler ratio. However, at 90% PP, impact strength slightly declines, suggesting that an excess of polymer reduces the reinforcing effect of the filler, limiting the composite’s ability to dissipate impact energy effectively.
56
The RH content also follows a distinct trend, where increasing RH from 10% to 20% enhances impact performance, likely due to crack deflection and energy dissipation at the filler-matrix interface. However, at 30% RH, impact strength declines, possibly due to filler agglomeration or poor dispersion, leading to stress concentration points that weaken the composite’s resistance to impact forces.
57
Among all factors, particle size has the most significant effect on impact strength. The highest impact strength is observed at 125 µm, where the larger surface area of smaller particles promotes strong bonding and efficient stress transfer. As particle size increases to 250 µm and 500 µm, impact strength declines sharply, likely due to poor dispersion and the formation of weak spots or voids that act as failure initiation sites under impact loading.
58
The optimal combination for maximizing impact strength is 80% PP, 20% RH, and a particle size of 125 µm, achieving the best balance between matrix-filler interaction, stress transfer efficiency, and defect minimization. Main effect plot of impact strength of RH-PP composite.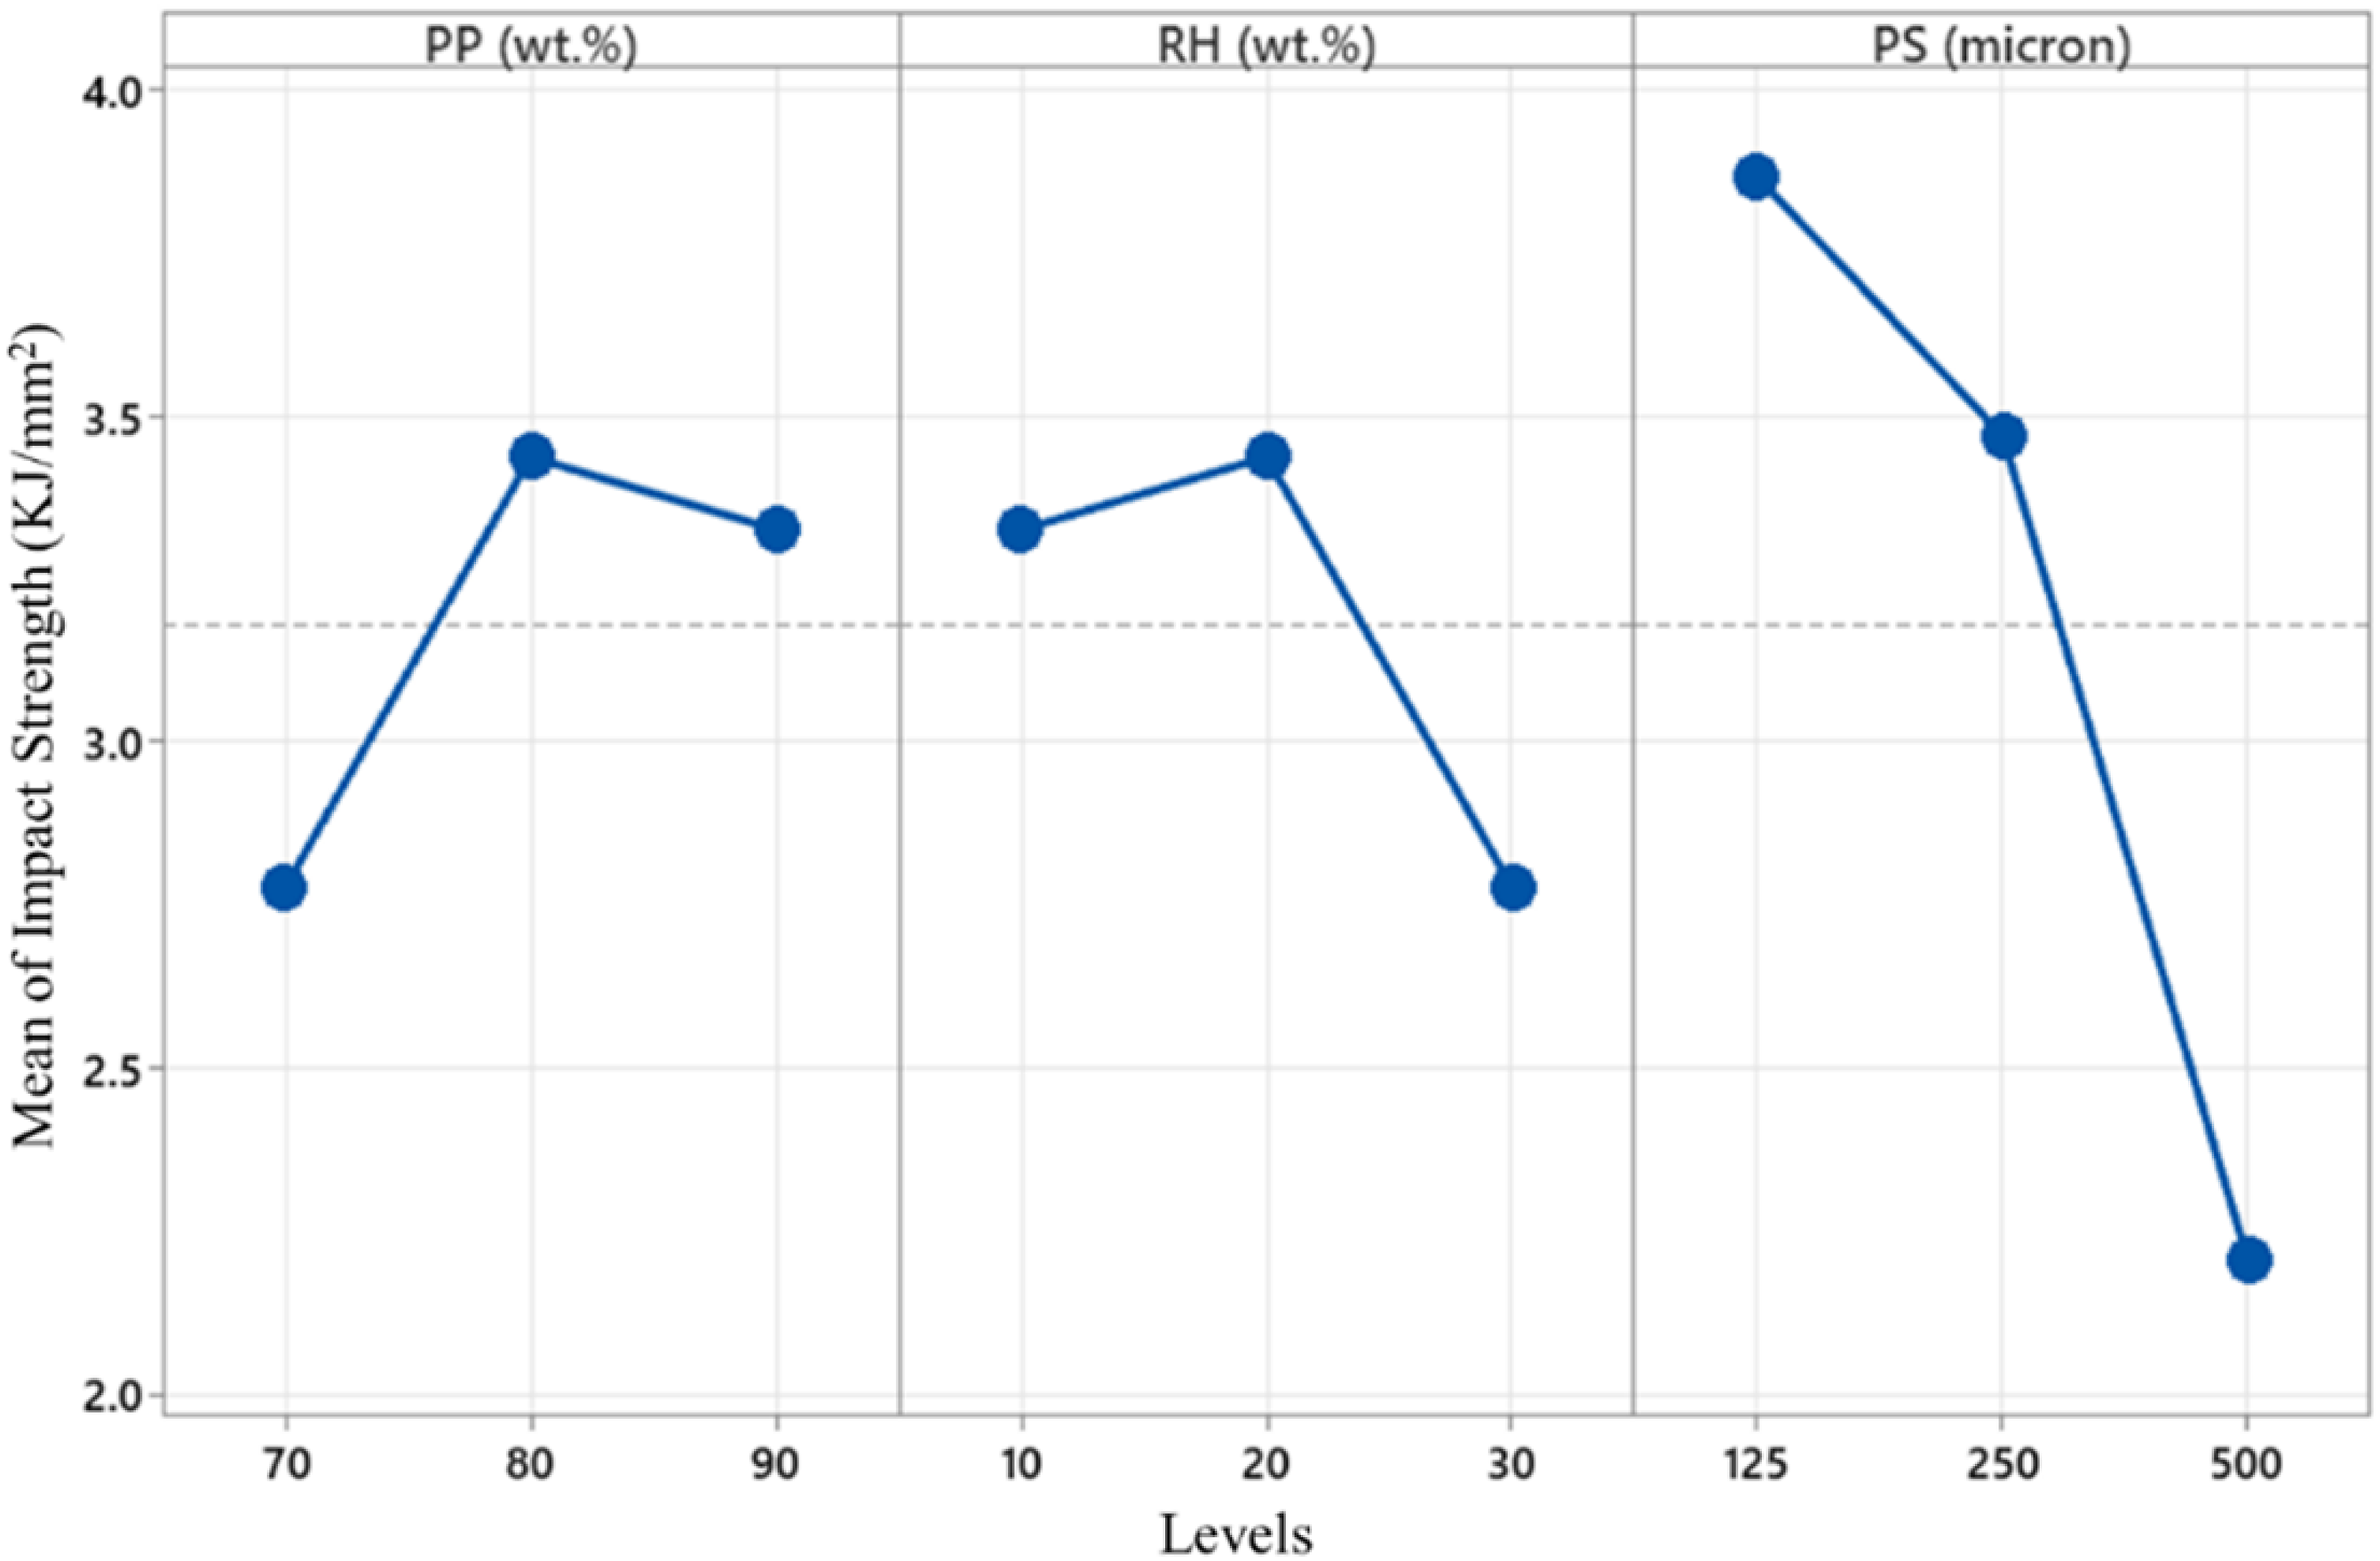
Surface roughness
Figure 13 represents the main effect plots for surface roughness, expressed in terms of means of surface roughness of RH-PP composite. For surface roughness, where smaller values are preferred, the plots indicate that increasing the PP weight percentage from 70 % to 90 % significantly enhances surface smoothness, as evidenced by lower mean surface roughness values. Conversely, increasing the RH weight percentage from 10 % to 30 % leads to a rougher surface, as the mean surface roughness increases with higher RH content.
59
Additionally, the particle size of the RH has a significant effect on surface roughness; larger particle sizes (250 to 500 μm) result in greater surface roughness, while a smaller particle size of 125 μm yields the smoothest surface. Therefore, to achieve the best surface finish with the lowest roughness, the composite needs to be formulated with 90 % PP, 10 % RH, and particle size of 125 μm. These conditions optimize the material’s surface properties by minimizing roughness. Main effect plot of surface roughness of RH-PP composite.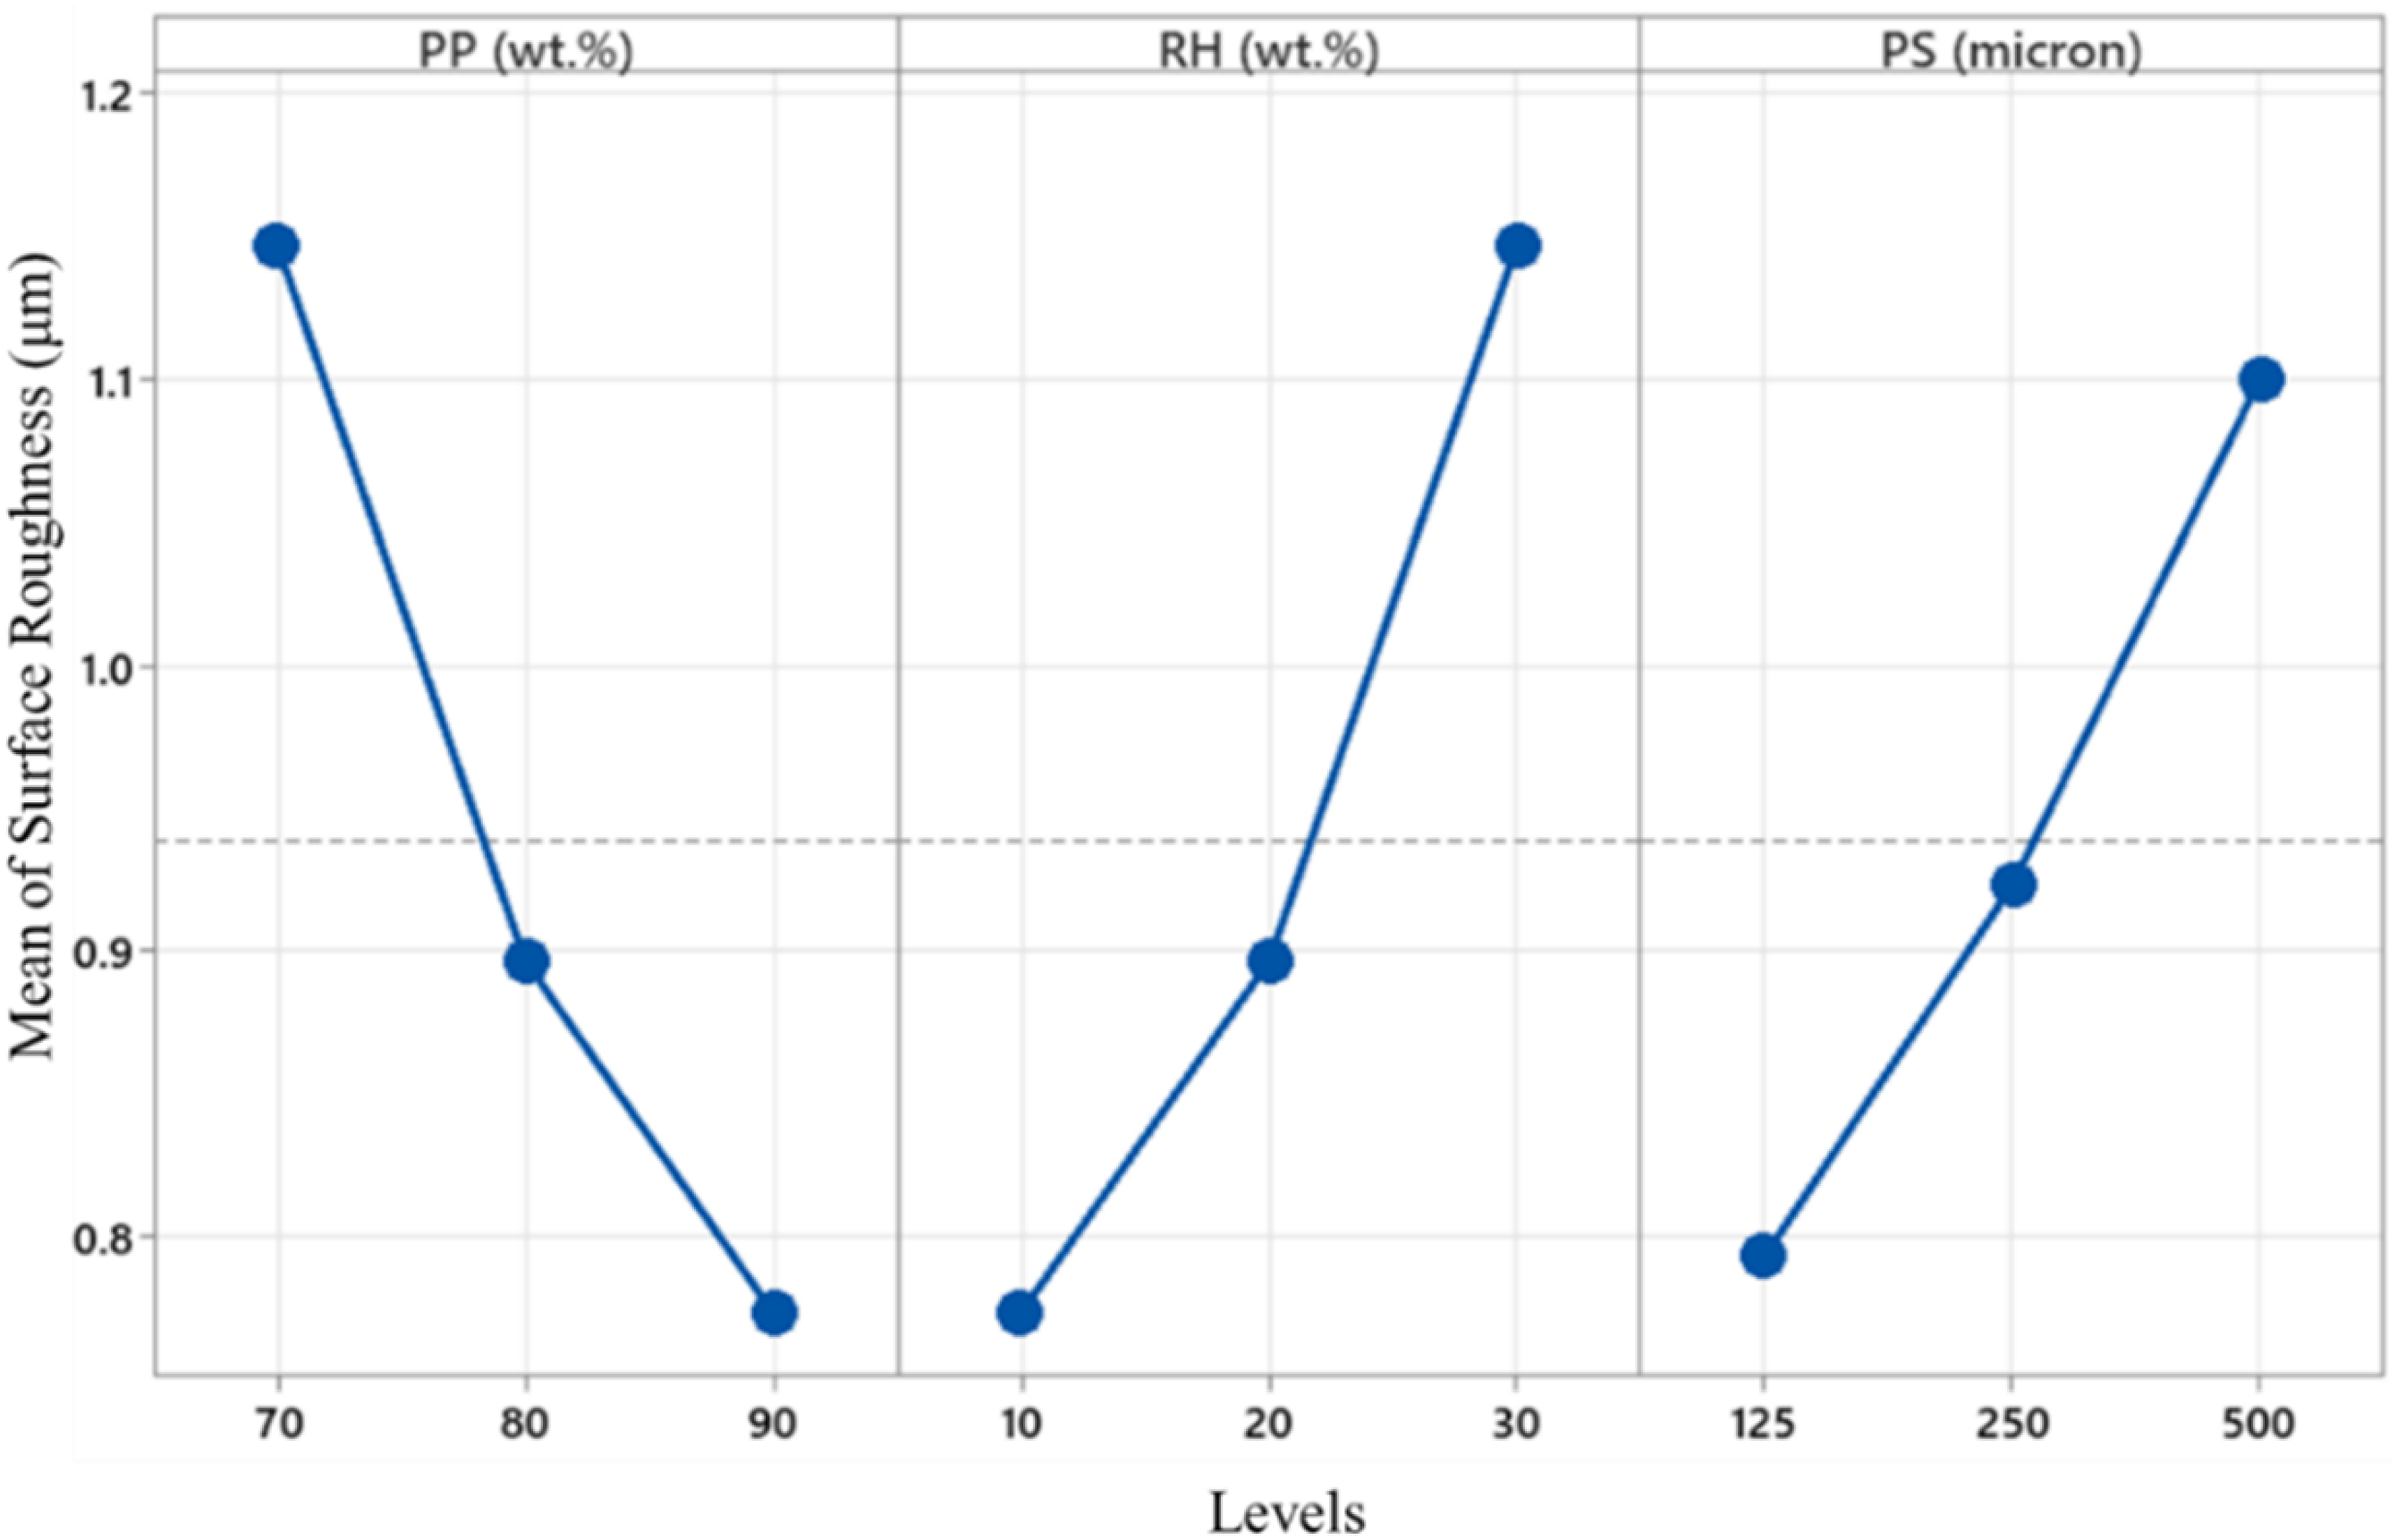
The mechanical properties of the RH-PP composite exhibit varying optimal values across different formulations. Compression strength, tensile strength, and surface roughness achieve their best results at PP 90 wt%, RH 10 wt%, and particle size 125 µm, whereas bending strength and impact strength attain their highest values at PP 80 wt%, RH 20 wt%, and particle size 125 µm. This variation arises due to the complex interactions between RH and PP bonding, load transfer efficiency, and dispersion uniformity, where different properties respond differently to changes in filler content and particle size. Since no single formulation maximizes all mechanical properties simultaneously, Grey Relational Analysis (GRA) has been applied as a multi-response optimization technique to determine the best possible combination of PP and RH content that provides an optimal balance across all mechanical properties. 60
Grey relational analysis for optimization
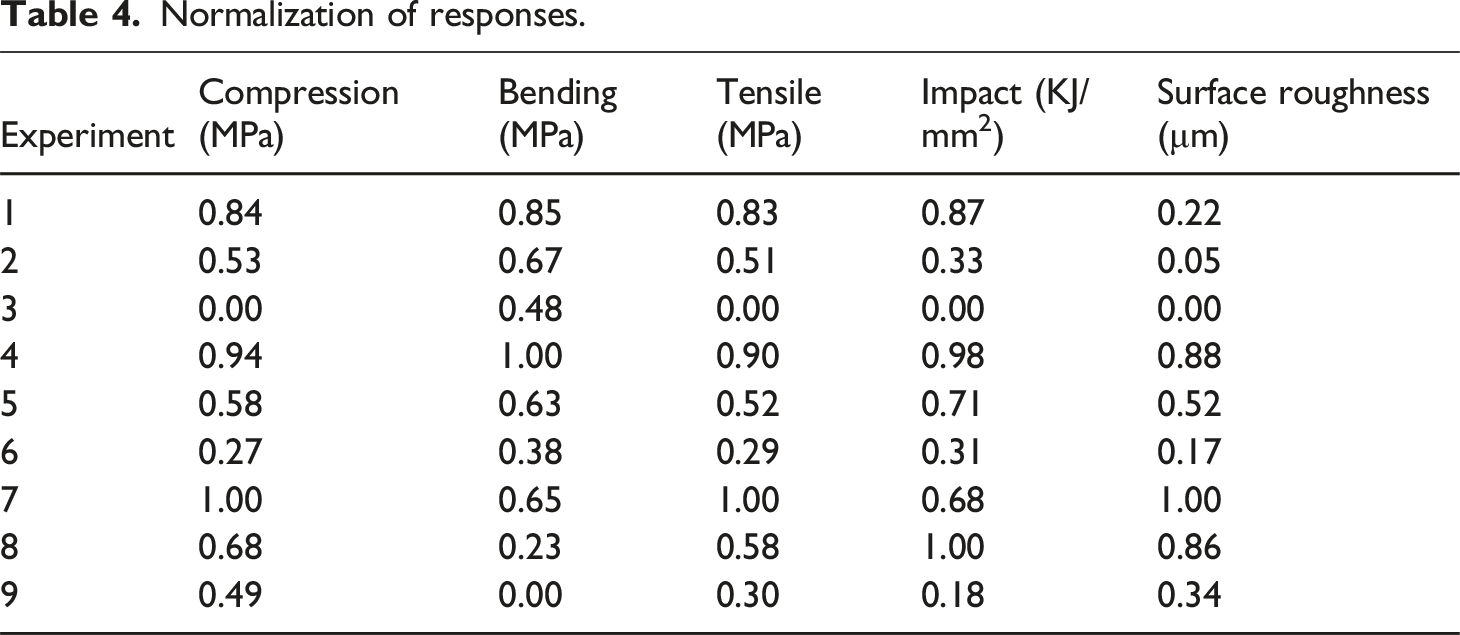
Normalization of responses.
Deviation sequence analysis.
Grey relational coefficient for responses.
Grey relational grade (GRG) and ranks.
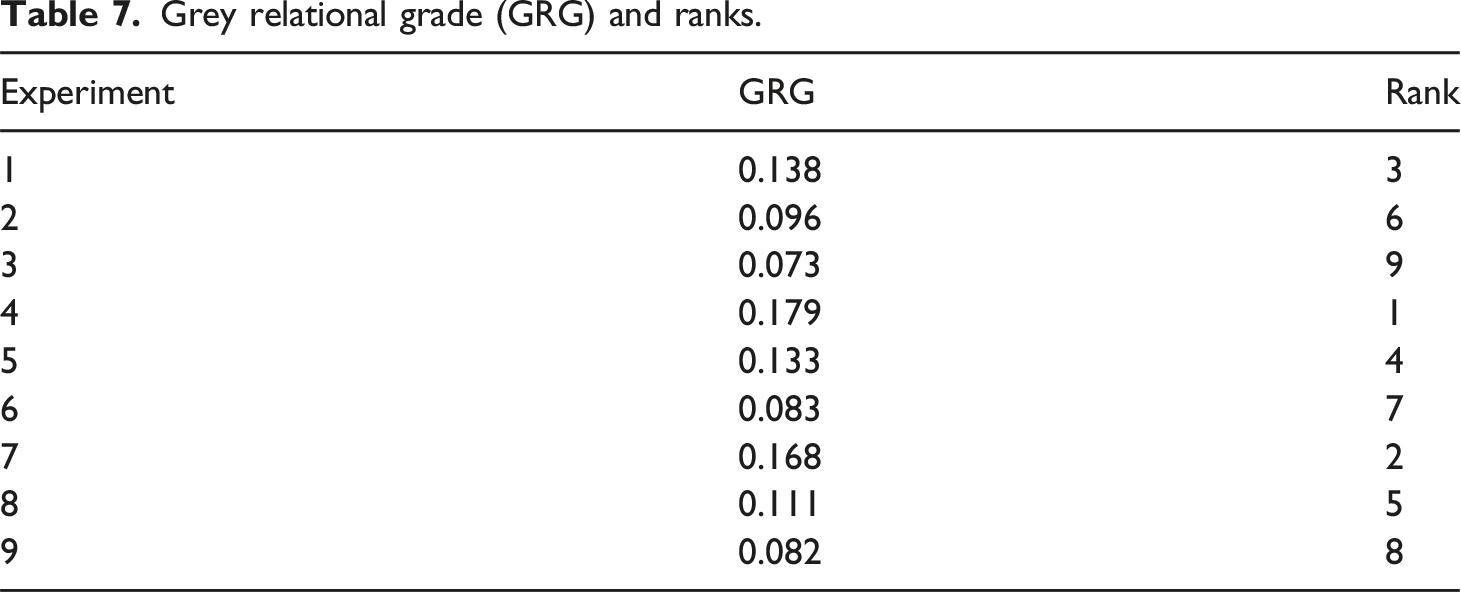
Based on the rankings from GRA analysis, the samples with high, moderate and low mechanical strength were selected for investigating their thermal, chemical and structural behavior. The high mechanical properties of the sample produced in Experiment 4 (80% PP, 20% RH, 125 µm), as identified through Grey Relational Analysis, can be attributed to its lower oxidation levels and stronger RH and PP interaction, as confirmed by FTIR analysis shown in Figure 14. The reduced oxidation in this sample ensures better polymer chain integrity, leading to improved stress transfer between the polymer and filler, thereby enhancing tensile, impact, and bending strength. DSC analysis showing melting and recrystallization temperatures of PP and RH-PP composites.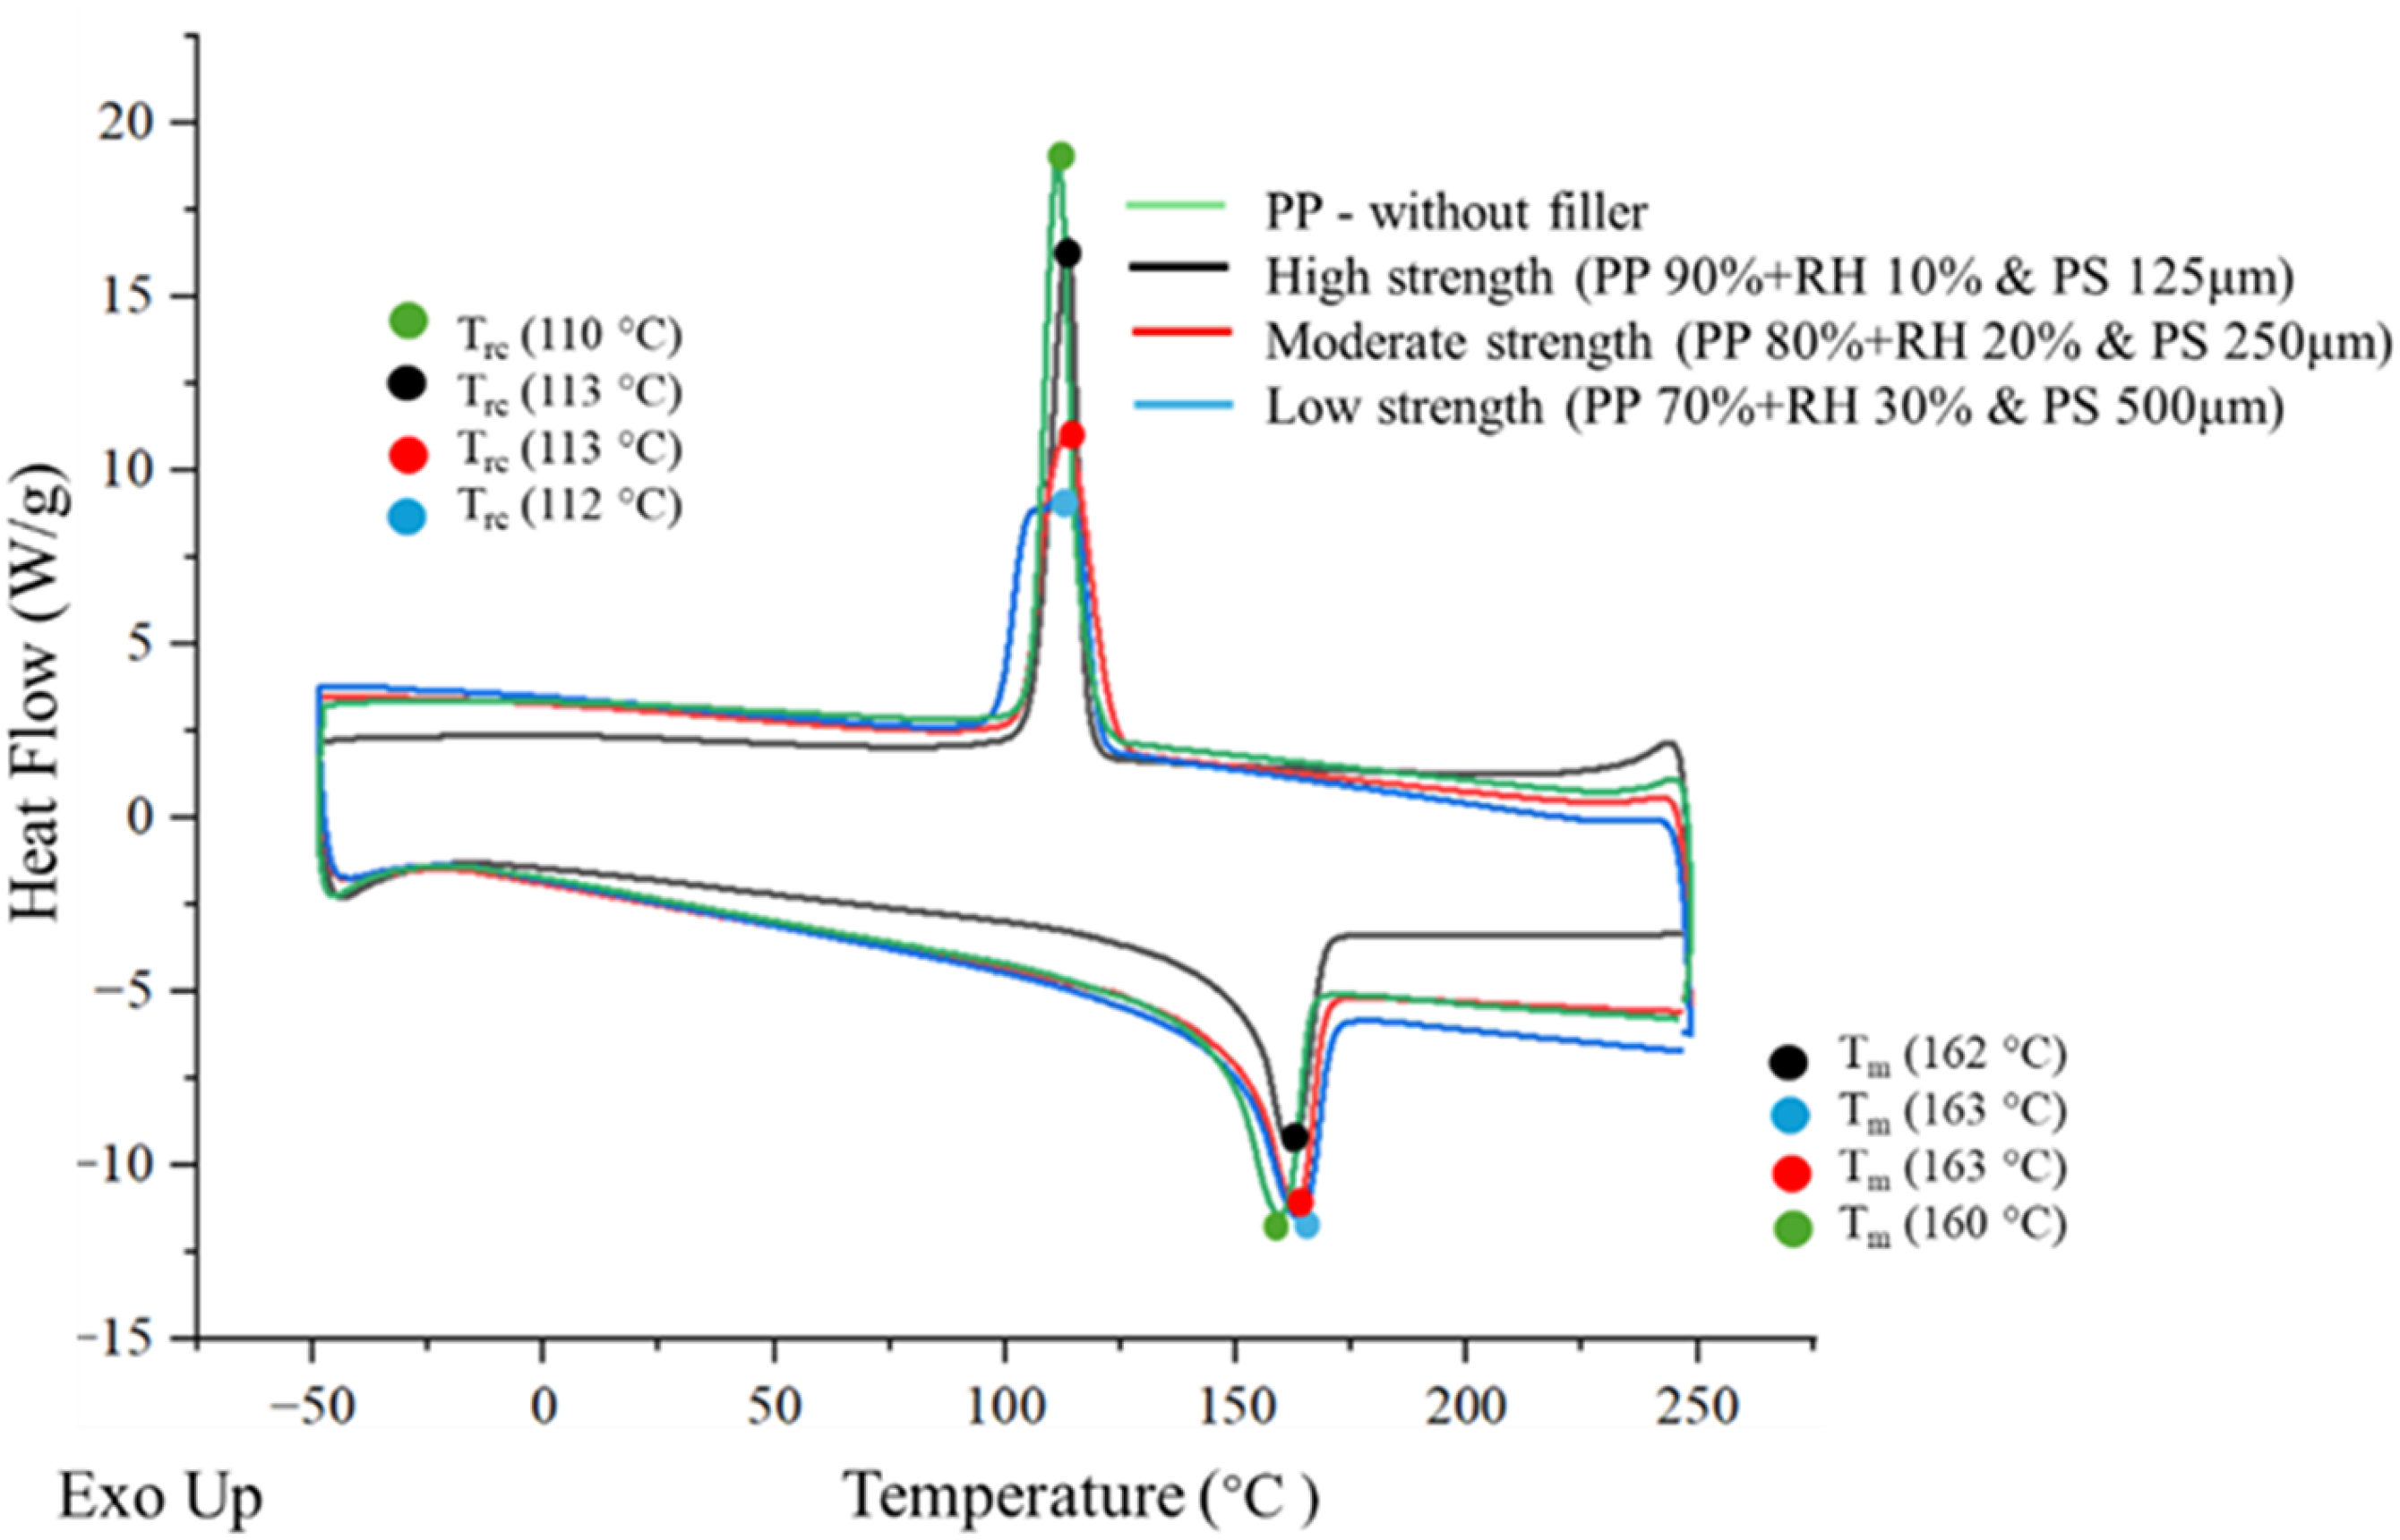
Comparative analysis
Mechanical properties of virgin PP, PP-ortho waste and RH-PP composite.
Thermal analysis
Differential scanning calorimetry (DSC)
The DSC thermograms presented in Figure 14 reveal the thermal behavior of PP and three RH-PP composites selected based on their mechanical properties and have different RH concentrations and particle sizes. A heat–cool–heat cycle was used to assess intrinsic thermal transitions, ensuring that previous processing effects were eliminated. During the heating phase, all samples exhibited endothermic melting behavior, with peak melting temperatures (Tm) ranging from 162°C to 163.6°C. The high strength composite (black curve), containing 90% PP and 10% RH (250 µm), displayed the highest Tm at 163.6°C, suggesting a slightly more thermally robust crystalline structure. The moderate strength composite (red curve), made with 80% PP and 20% RH (125 µm), had a Tm of 163°C, while the low strength composite (blue curve), composed of 70% PP and 30% RH (500 µm), exhibited a Tm of 162°C. All of them are identical to the thermal behaviour of PP (green curve) with a slight variation indicate that RH incorporation does not significantly disrupt the thermal stability of the polymer matrix in terms of melting behavior. 61
In contrast, the cooling cycle reveals the crystallization efficiency, as reflected in exothermic recrystallization peaks. The recrystallization temperature (Trc) of pure PP was found at 110°C, while both the high and moderate strength composites displayed elevated Trc values of 113°C. This suggests that RH particularly when well-dispersed and present in smaller particle sizes acts as a nucleating agent, promoting earlier onset of crystallization by providing heterogeneous nucleation sites. The smaller RH particles (125–250 µm) likely improved filler–matrix interaction and increased chain mobility during cooling, leading to this enhanced crystallization. 62 Conversely, the low strength composite showed a Trc of 112°C, slightly lower than the others. This marginal reduction could be attributed to agglomeration of larger RH particles (500 µm), which tend to reduce the effective surface area for nucleation and create stress concentration zones, impeding orderly chain folding. The limited chain mobility and poor matrix filler interaction at higher RH adversely affect the crystallization kinetics. 63
Despite these differences, the overall variation in Tm and Trc is minimal, indicating that the thermal stability of RH-PP composites remains unaffected by filler modifications. Furthermore, none of the samples exhibited any signs of degradation up to 250°C, confirming the composites’ suitability for industrial applications operating within this temperature range.
Degree of crystallinity and melting enthalpy of RH-PP composites from DSC analysis

Heat of melting enthalpy and degree of crystallinity of RH-PP composites.
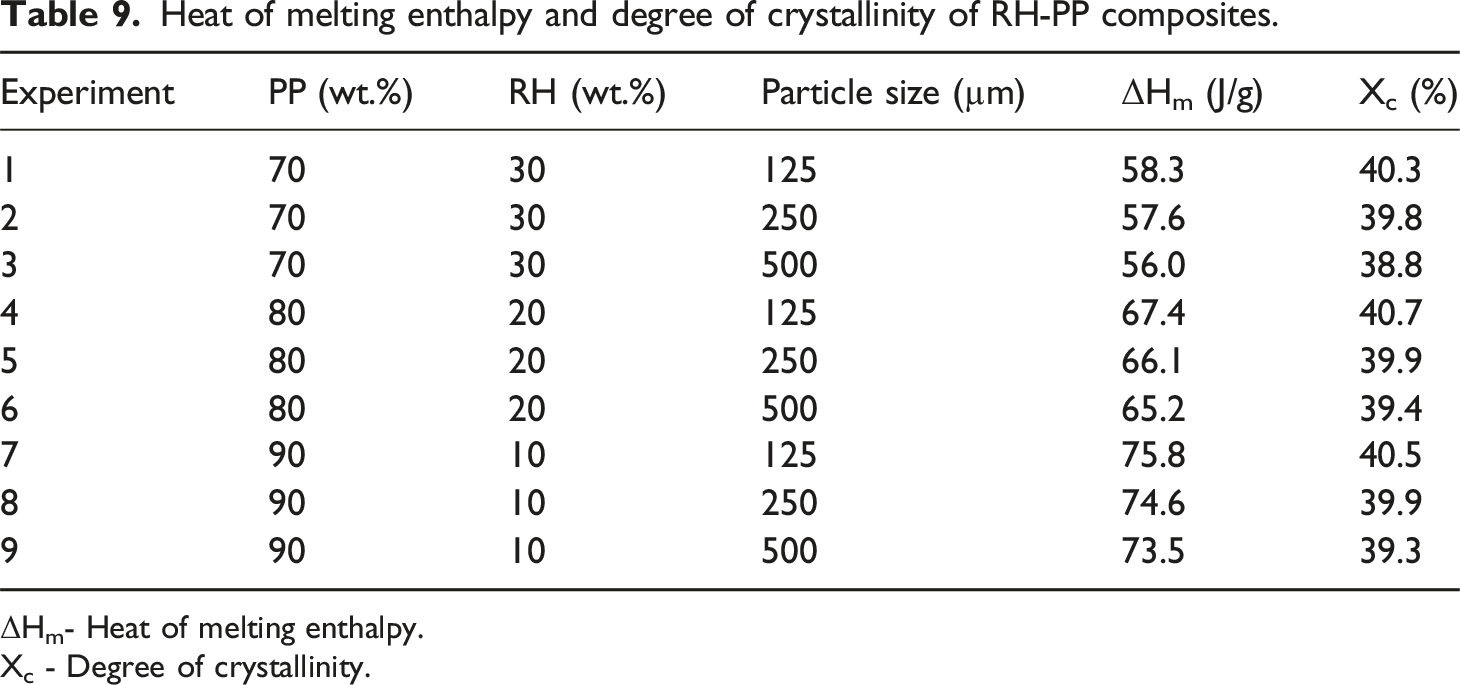
ΔHm- Heat of melting enthalpy.
Xc - Degree of crystallinity.
Thermogravimetric analysis (TGA)
The TGA curves illustrate the thermal degradation behavior of PP, and the same three RH-PP composites analyzed in the DSC, selected based on their mechanical properties and identical RH concentrations and particle sizes. As shown in Figure 15, the weight loss (%) was recorded as a function of temperature. The green curve represents PP, while the black, red, and blue curves correspond to the high strength (90% PP + 10% RH, 250 µm), moderate strength (80% PP + 20% RH, 125 µm), and low strength (70% PP + 30% RH, 500 µm) composites, respectively. PP exhibited a sharp thermal degradation profile, with an onset of decomposition around 350°C and complete degradation by 450°C, resulting in negligible residual weight. In contrast, the RH-PP composites began to degrade slightly earlier, with thermal decomposition primarily occurring between 330°C and 410°C. This earlier onset is attributed to the decomposition of lignocellulosic constituents in RH, including cellulose and hemicellulose, which are thermally less stable than the PP matrix.
64
Additionally, RH-PP samples retained a significantly higher char residue ranging from 10% to 15% at 700°C compared to PP, which suggests the presence of thermally stable inorganic content, such as silica and ash, within the RH.
65
TGA analysis of PP and RH-PP composite showing weight loss curve.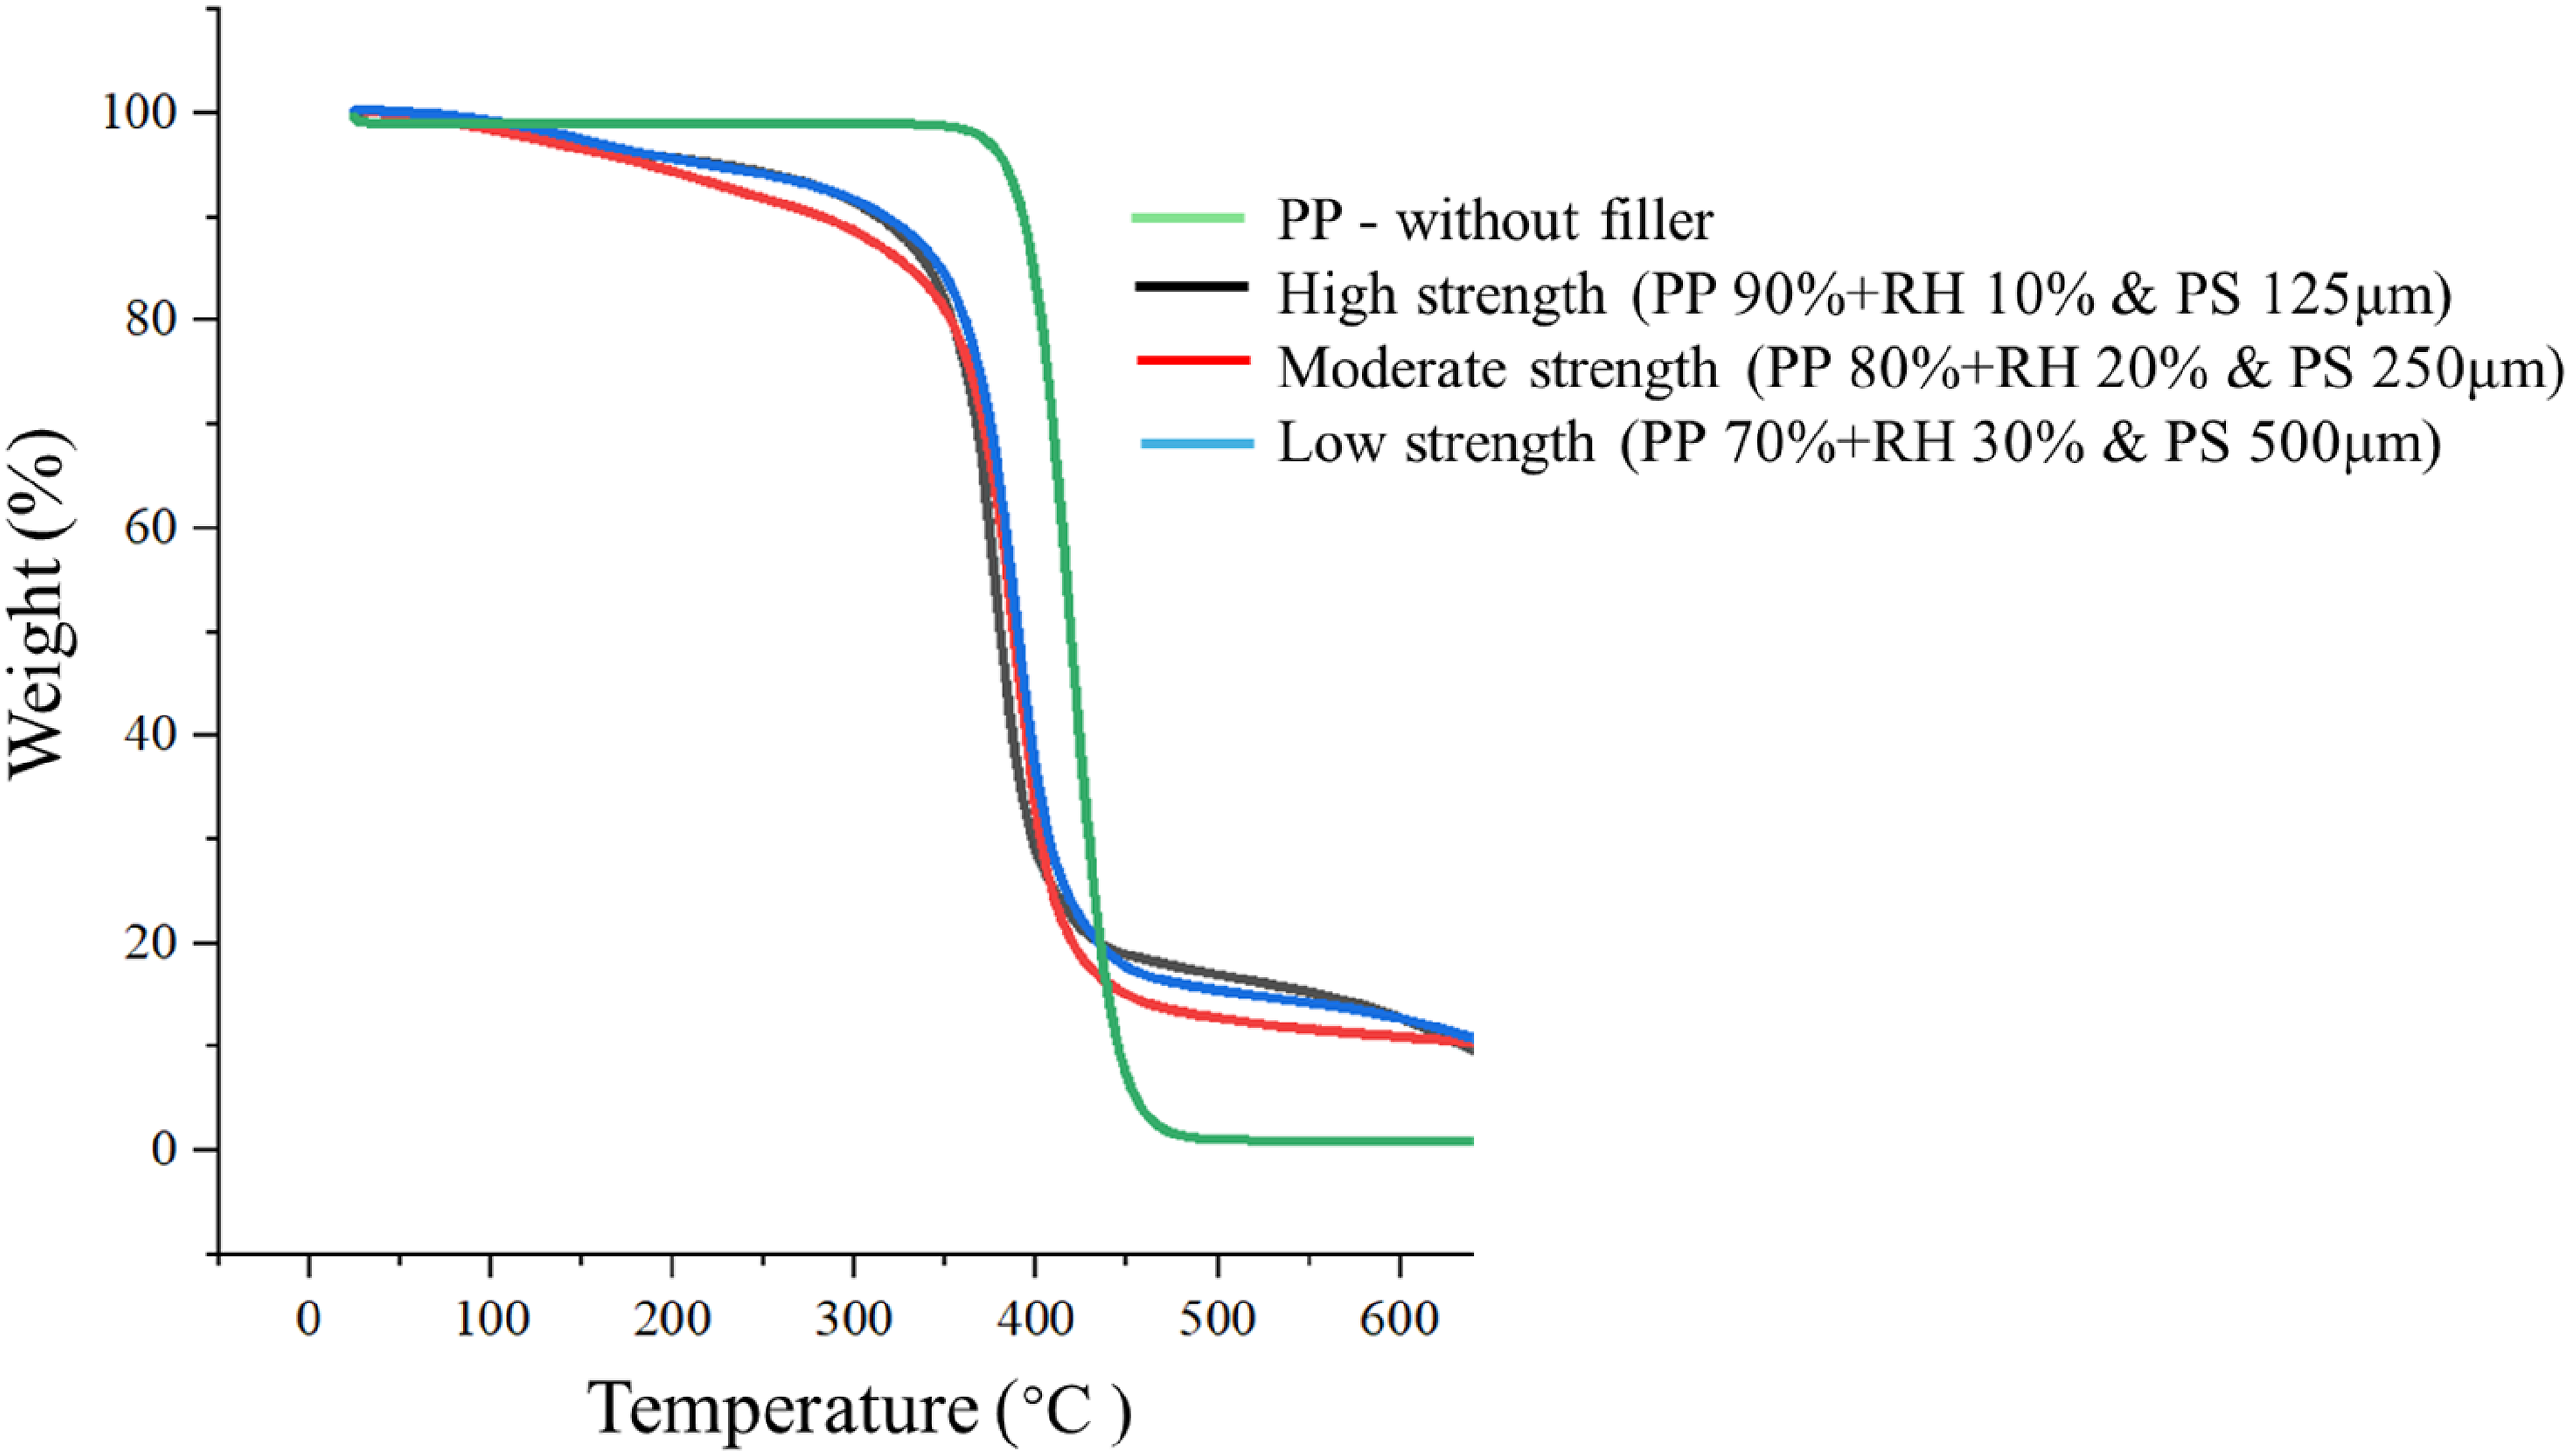
Despite the earlier degradation onset, the overall thermal degradation profiles of the composites remain relatively close to that of PP, indicating that RH incorporation at 10–30 wt% does not drastically compromise thermal stability. Furthermore, the minor differences between the composite curves shows that increased filler content or particle size does not significantly accelerate degradation, although some reduction in thermal resistance is evident in the low strength (30 wt% RH, 500 µm) formulation. To further enhance thermal performance, strategies such as the use of compatibilizers to improve interfacial bonding, surface modification of the filler to reduce hydrophilicity, and the incorporation of antioxidants to suppress oxidative degradation may be considered. These modifications can promote uniform thermal stress distribution and increase the composite’s resistance to thermal decomposition in demanding applications. 66
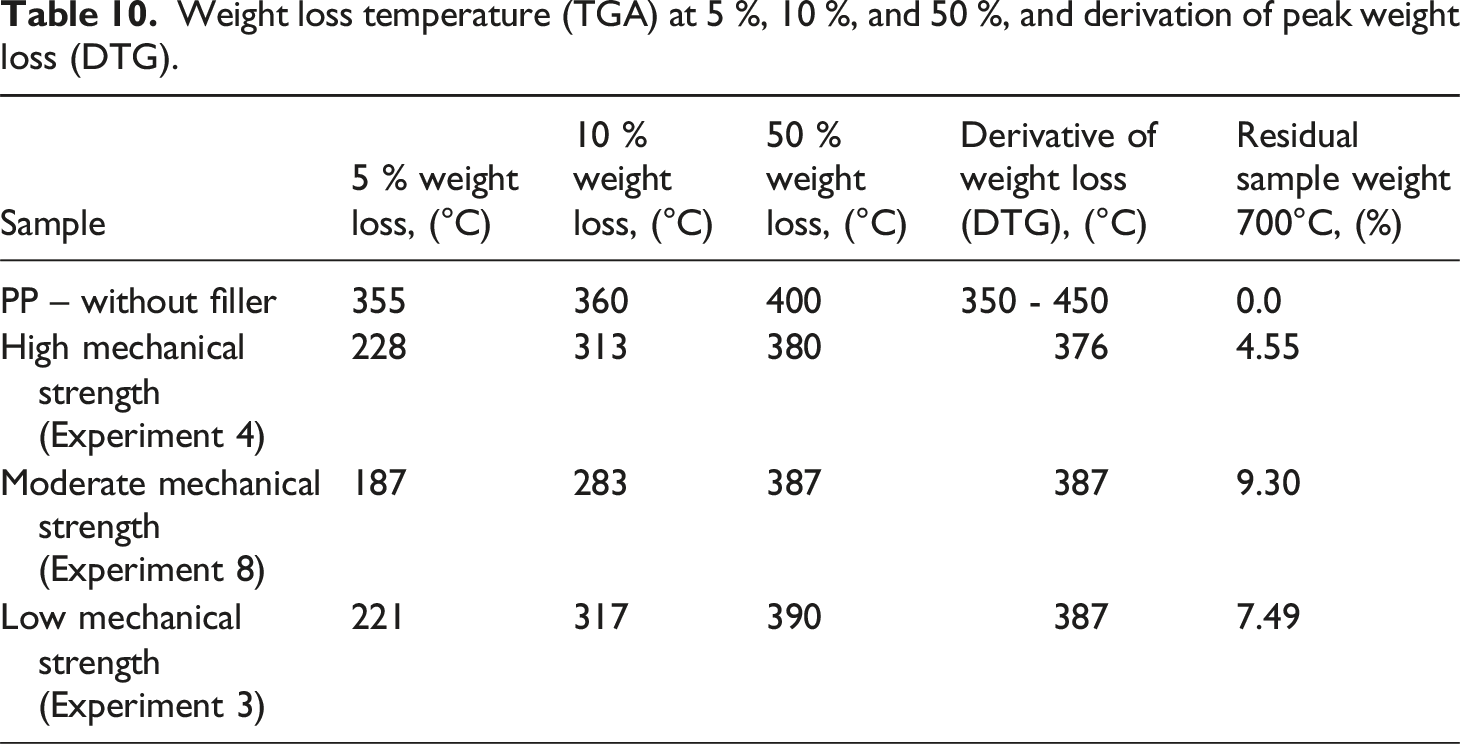
Weight loss temperature (TGA) at 5 %, 10 %, and 50 %, and derivation of peak weight loss (DTG).
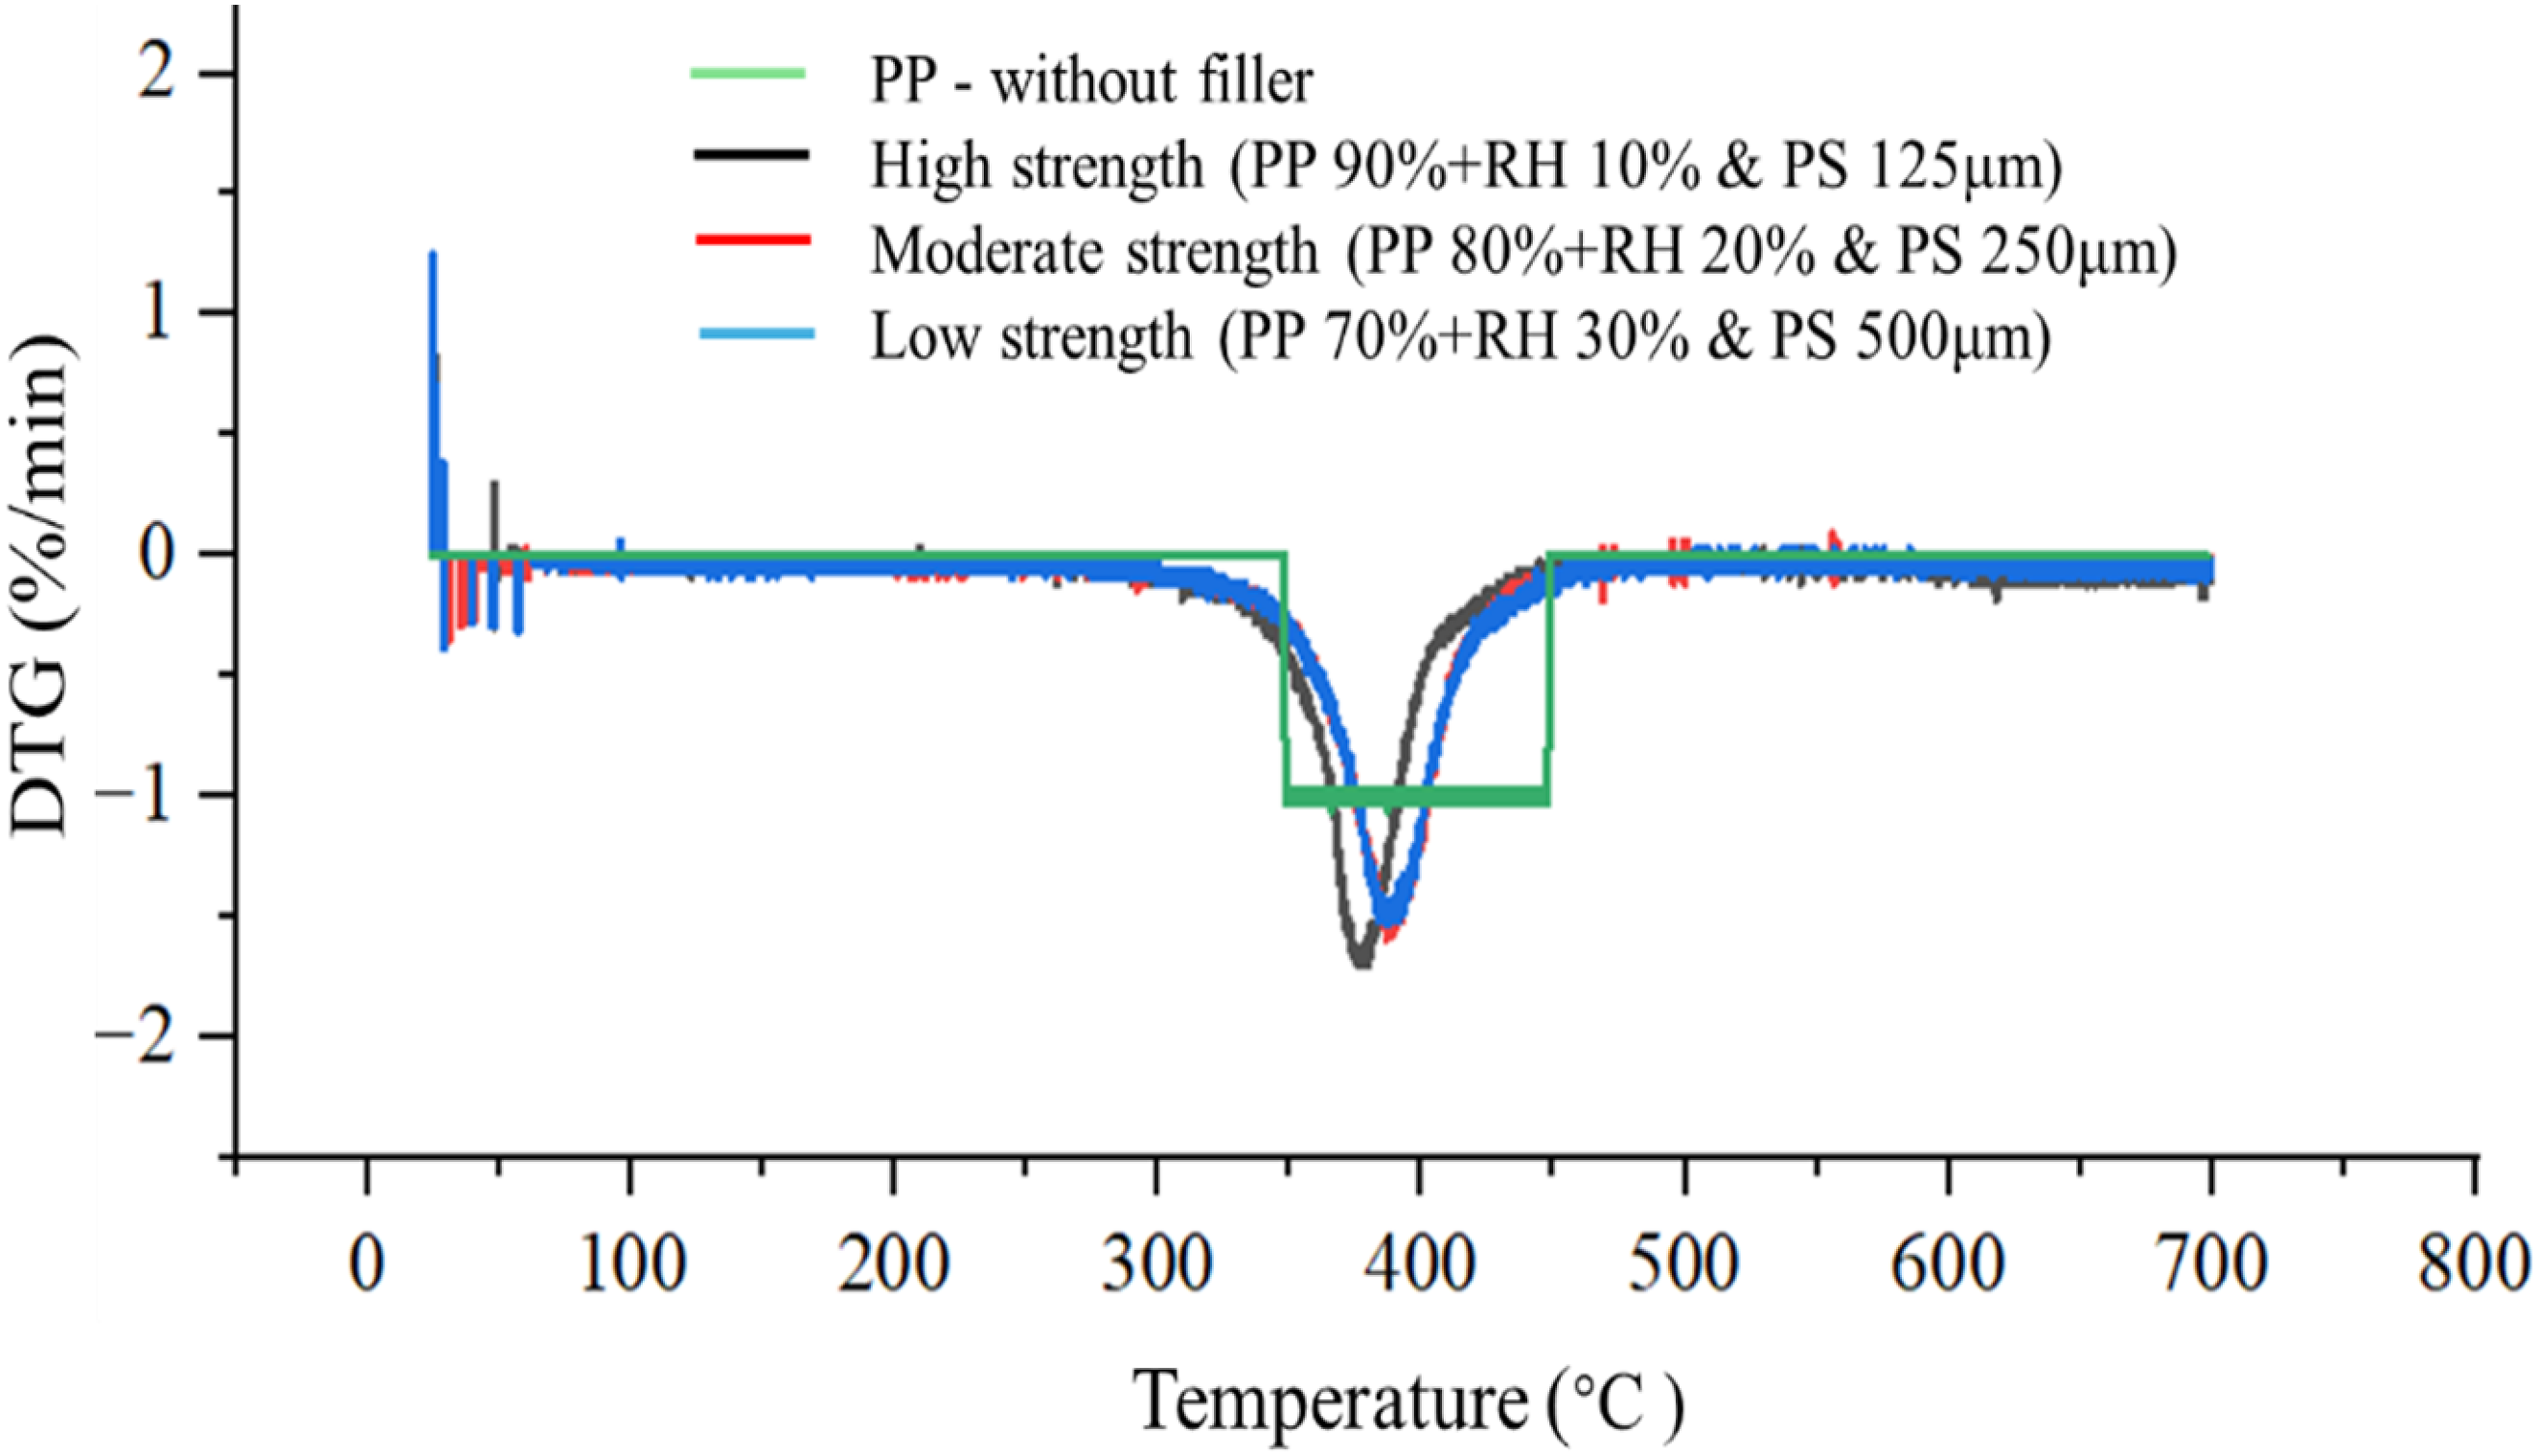
TGA analysis of PP and RH-PP composite showing derivate of weight loss DTG.
In contrast, the RH-PP composites show more complex degradation behavior due to the inclusion of lignocellulosic biomass. The initial degradation onset (5% weight loss) occurs significantly earlier at 228°C for the high strength composite, 187°C for the moderate strength composite, and 221°C for the low strength composite. This early onset is attributed to the thermal decomposition of hemicellulose and cellulose in RH, which degrade between 200°C and 400°C. 68 The DTG curves of the RH-PP composites display pronounced peaks above 370°C, with the highest DTG temperatures recorded for the moderate and low-strength composites (387°C) and slightly lower for the high-strength sample (376°C). These values indicate that despite the presence of thermally sensitive biomass, the composites retain good thermal stability in the range required for typical thermoplastic processing.
Moreover, the residual weight at 700°C confirms the formation of char in RH-PP composites which is not present in PP. The moderate strength composite shows the highest char residue (9.30%), followed by the low strength (7.49%) and high strength (4.55%) formulations. This residue results from the aromatic and carbon-rich structures in lignin and partially degraded RH, which undergo carbonization rather than volatilization. 69 The presence of inorganic ash in RH may also contribute to the residual mass. The increased char formation not only reflects the bio-filler’s thermal resistance but may also enhance flame retardancy and reduce smoke emissions in end-use applications. 70 Importantly, although RH reduces the onset degradation temperature, it does not critically affect thermal performance. All composites maintain thermal stability above 350°C, making them suitable for industrial applications such as prosthetics and orthotics, automotive components, interior building materials, and sustainable packaging where moderate thermal resistance is acceptable. To further improve thermal behavior, future formulations may consider coupling agents, surface-modified fillers, or antioxidant additives to enhance filler–matrix bonding, delay oxidative degradation, and uniformly distribute thermal stresses. These results demonstrate that RH-PP composites balance thermal functionality with sustainability, showing promise for value added polymeric materials in temperature sensitive applications.
FTIR spectral analysis
The FTIR spectra shown in Figure 17 reveals the key adsorption peaks in polymer backbone stability, filler dispersion, and degradation. Green colored curve shows the FTIR of PP without any filler material, black curve shows FTIR of high strength RH-PP composite developed in Experiment 4 with composition shown in Figure 17, Red curve shows FTIR of moderate strength RH-PP composite developed in Experiment 8, while blue cored curve shows the FTIR of low strength RH-PP composite developed in Experiment 3. Ftir spectra of PP and RH-PP composites.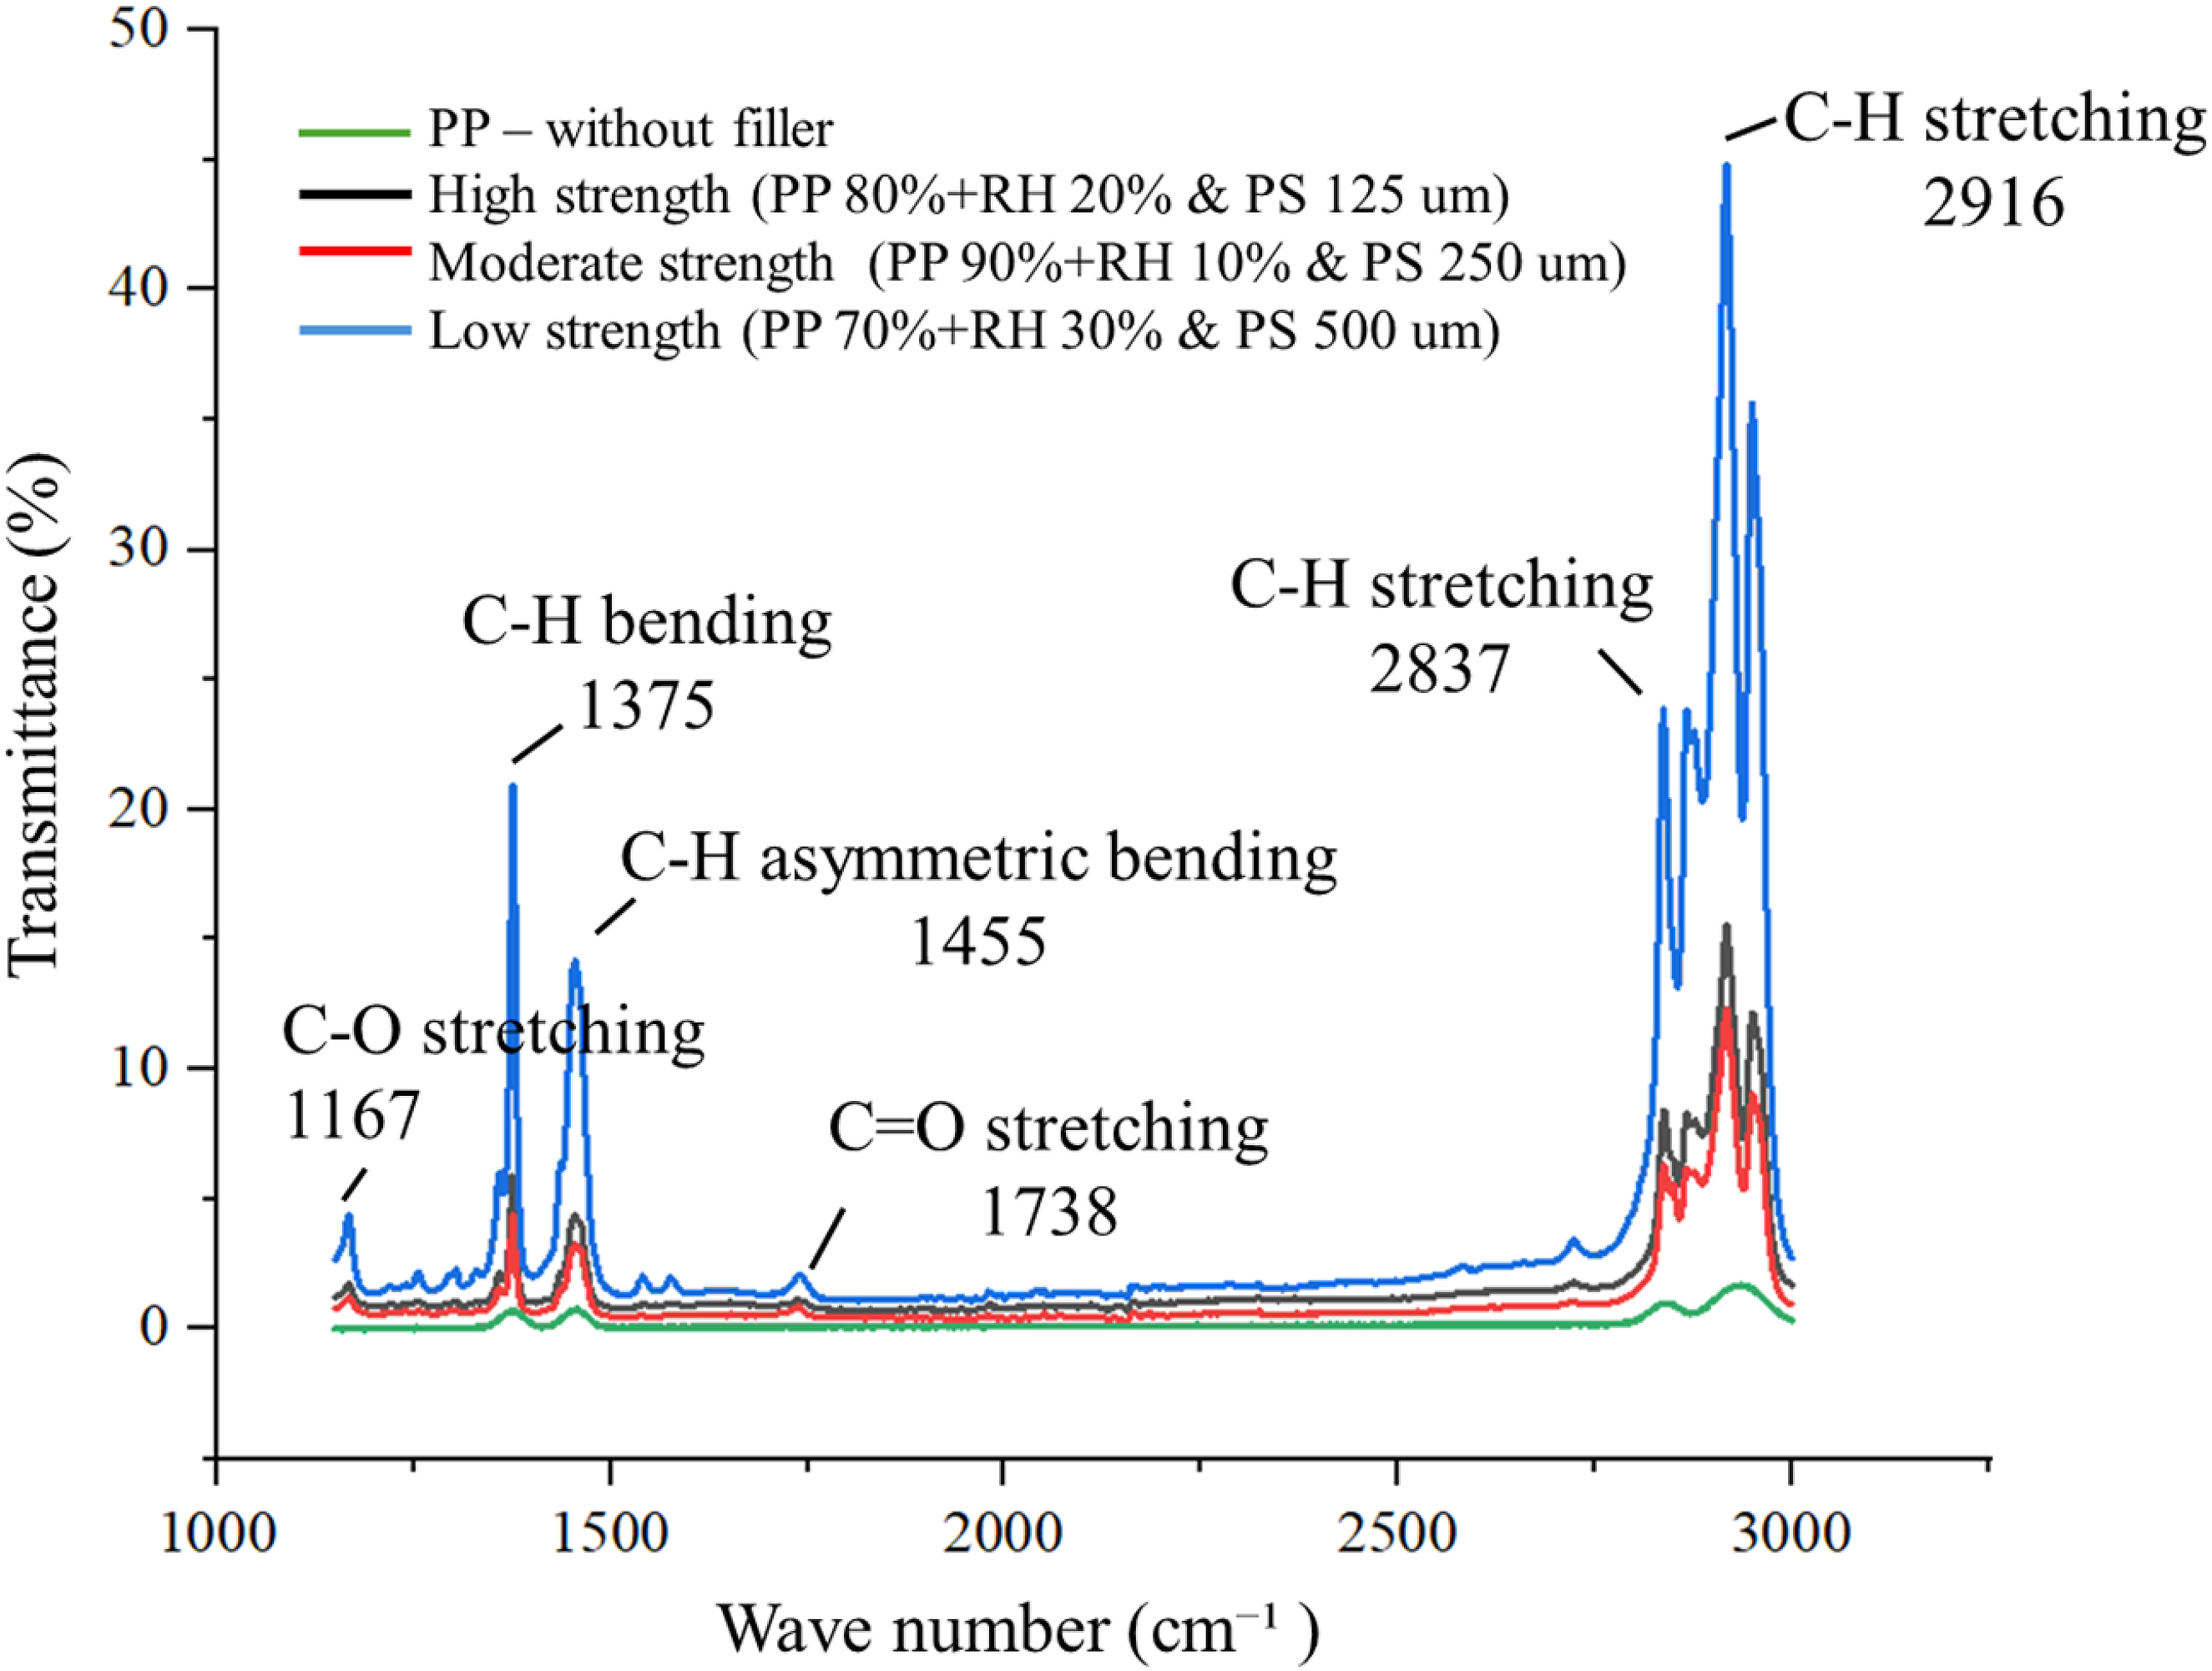
The C–H stretching peaks at 2916 cm−1 and 2837 cm−1, associated with polymeric vibrations, are most intense in the low strength RH-PP composite (70% PP, 30% RH, 500 µm, blue curve). This suggests that excessive filler content and larger particle size disrupt the polymer matrix, leading to weakened polymer chain interactions and phase separation. 71 In contrast, the high strength composite (80% PP, 20% RH, 125 µm, black curve) displays more stable and lower C–H stretching peaks, indicating improved polymer integrity and better filler-matrix compatibility, which aligns with its superior mechanical properties. The C–H bending vibrations at 1375 cm−1 and 1455 cm−1 also show higher intensities in the low strength sample, supporting the inference of poor filler dispersion and polymer-filler interfacial adhesion. 72 This poor adhesion likely contributes to voids and microstructural defects. The C–O stretching peak at 1167 cm−1, indicative of cellulose presence in RH, is again most pronounced in the low strength composite, reflecting higher content of unreacted or poorly bonded natural filler. This contributes to increased hydrophilicity and moisture uptake, corroborated by morphological observations such as fiber pull-out and porosity. Finally, the C = O stretching peak at 1738 cm−1 a marker of oxidative degradation is clearly more prominent in the low strength composite, suggesting increased polymer degradation due to higher filler loading and less thermal stability. 73 Conversely, the high strength composite exhibits a less intense C = O peak, indicating better thermal and oxidative resistance, correlating with improved crystallization behavior observed in DSC and better thermal stability reported in TGA.
Structural testing results
Structural analysis has been discussed below in detail with the help of SEM micrographs.
SEM micrographs of RH-PP composite
The SEM micrographs illustrated in Figure 18 show the tensile fracture analysis RH-PP composites with different weight percentages of RH and particle sizes. The tensile strength and other mechanical properties depend on the interfacial adhesion between the filler material and PP in the matrix.
29
It is not necessary that the addition of filler material will always improve the tensile strength because the interfacial adhesion not only depends on the nature of the filler material but also on the filler aspect ratio and processing procedures. From the results, it is observed that the quantity and particle size of RH play an important role in the interfacial bonding. With an increase in the weight percentage of RH to 30 wt% and particle size to 500 μm, the tensile strength of the RH-PP composite decreased.
71
This reduction is attributed to weak interfacial bonding between the RH and PP. RH contains high amounts of silica in its outer layer, along with cellulose and hemicellulose, which introduces hydrophilic polar groups, whereas PP is nonpolar, resulting in poor compatibility.
74
Poor interfacial adhesion leads to fiber pull-out and void formation,
75
as seen in Figure 18(b) and (c). Additionally, the larger particle size and higher weight percentage of RH act as stress concentrators, resulting in early failure and reduced tensile strength. The fiber pull-out and void formation observed in SEM images reflects its poor interfacial adhesion, as identified by the weak RH and PP bonding peak at 1255 cm−1 in FTIR spectra. SEM micrographs of tensile fracture (a) RH-PP composite (10 wt%+90 wt% & 125 μm PS) (b) RH-PP composite (30 wt%+70 wt% & 500 μm PS) (c) Void formation (d) Fracture.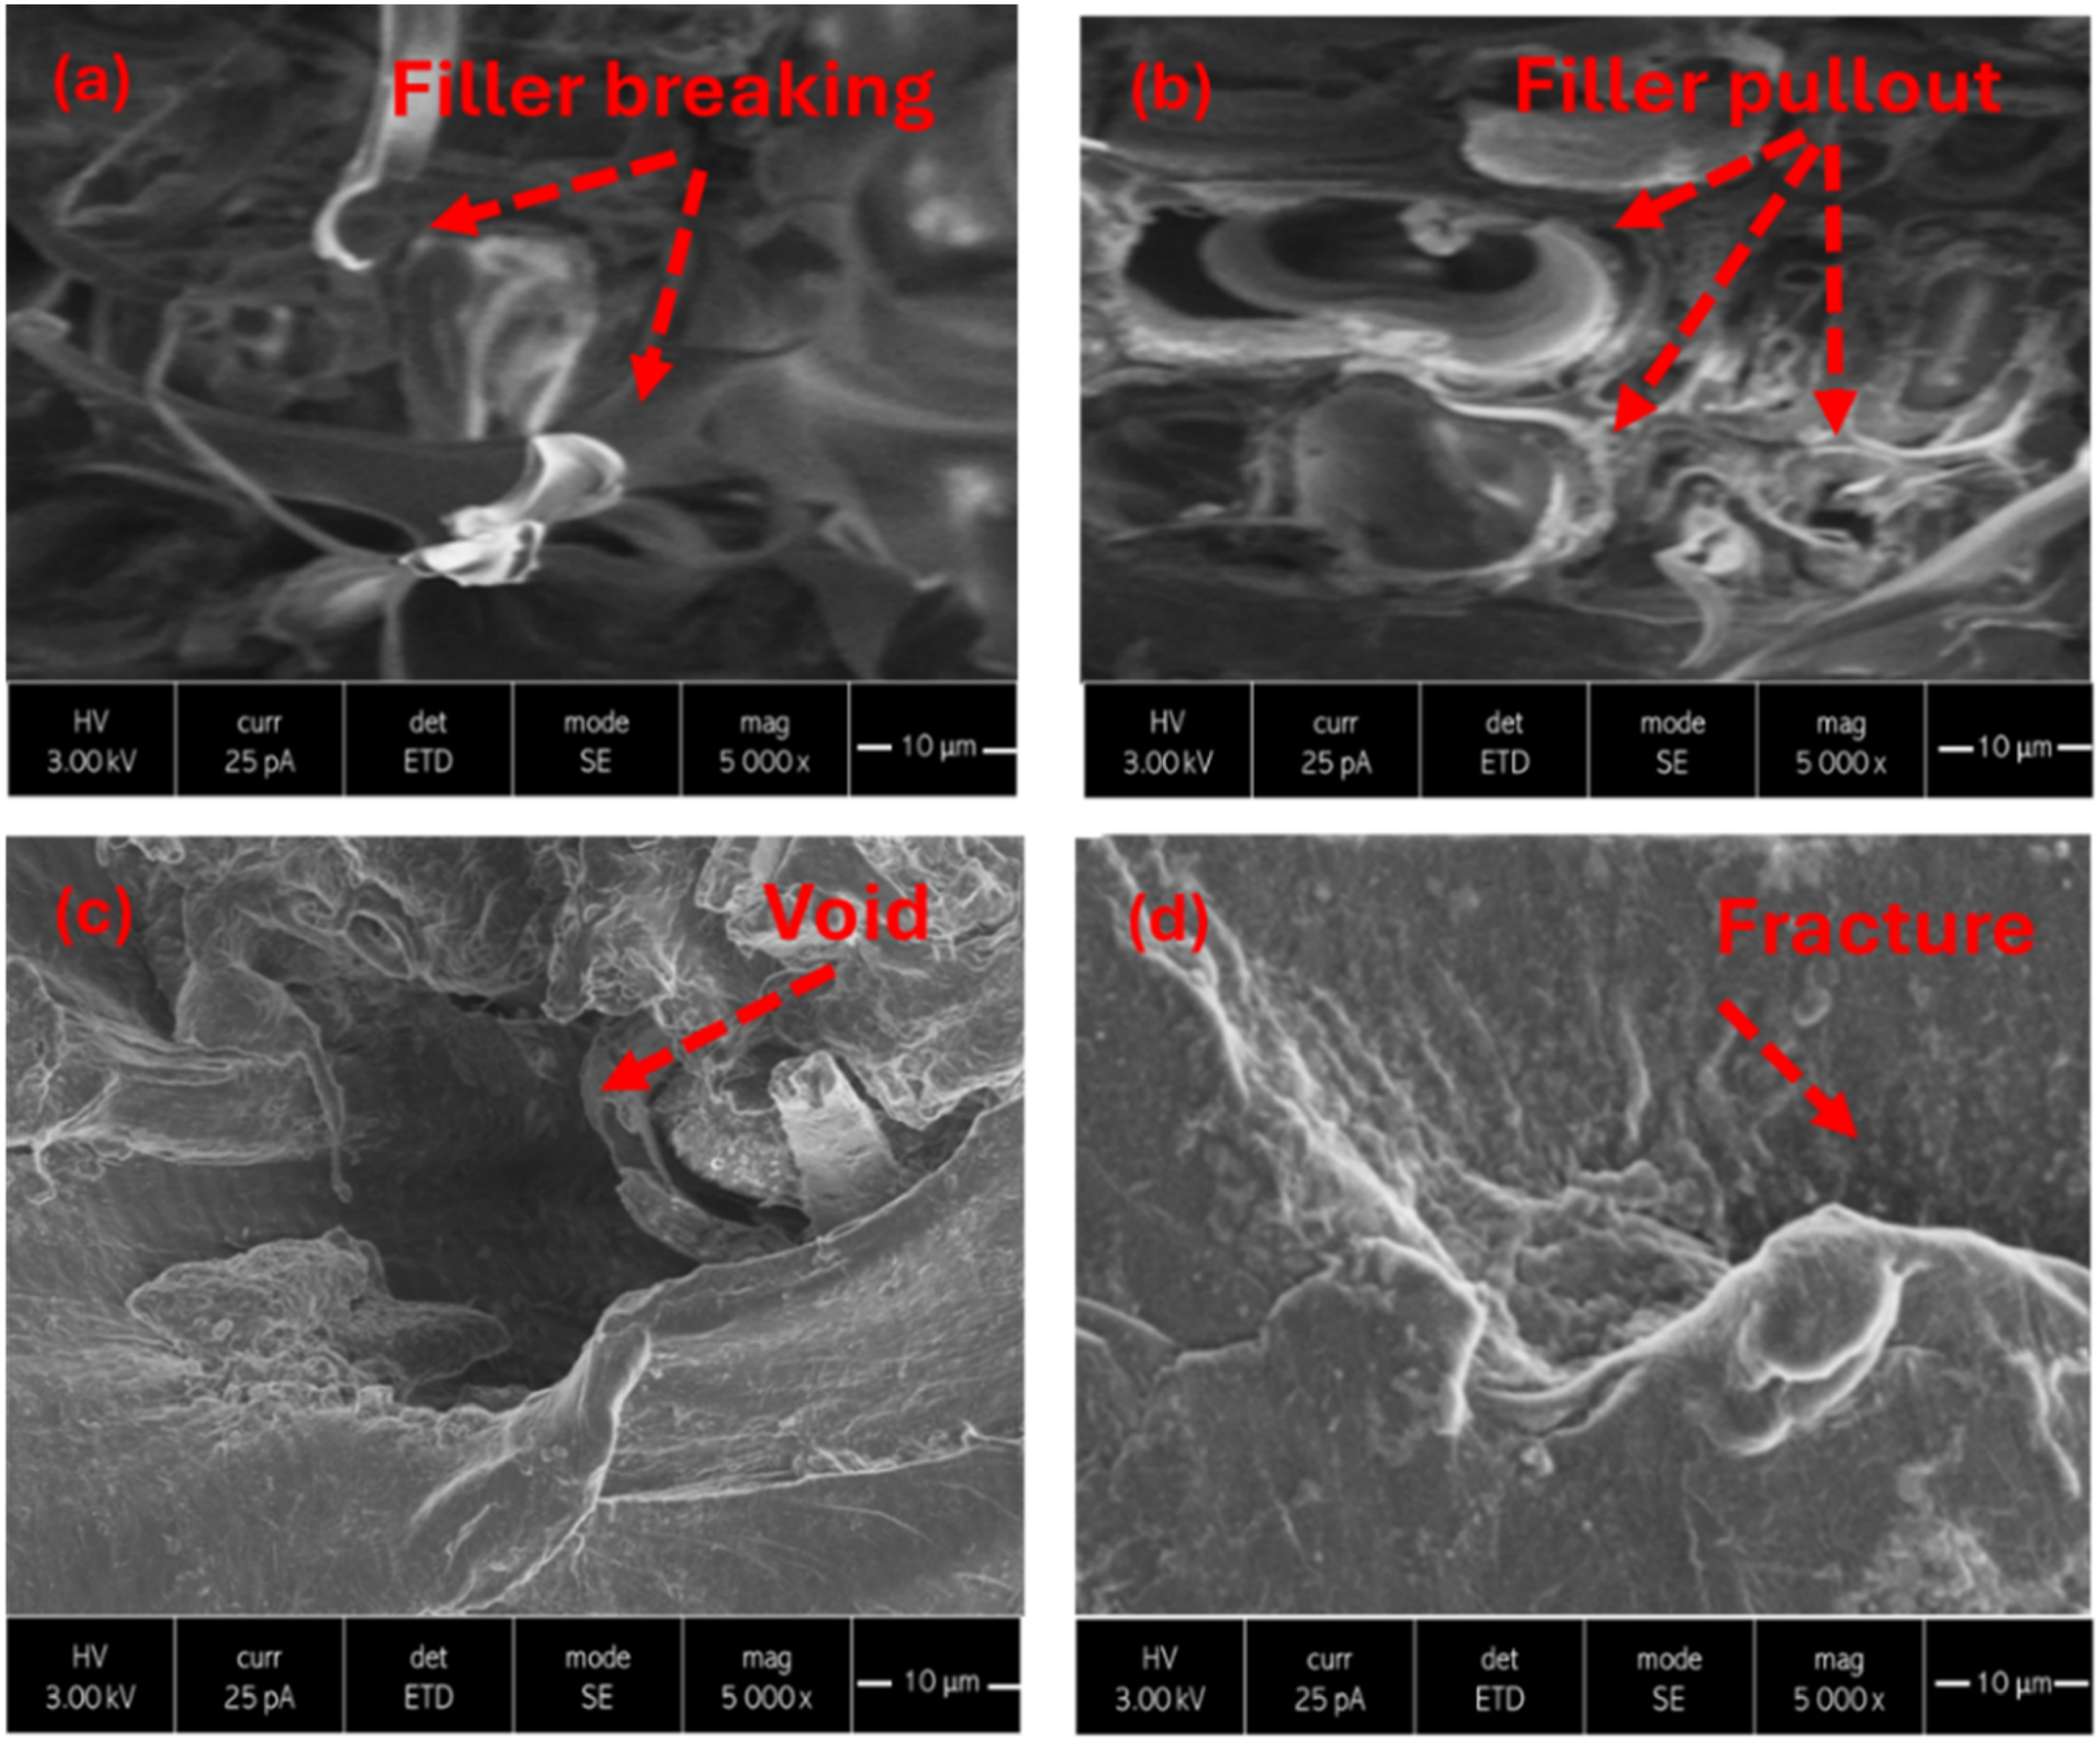
Conversely, a decrease in the weight percentage of RH to 10 wt% and particle size to 125 μm improved the tensile strength. This is because smaller particle-sized RH offers better dispersion within the matrix and provides a larger surface area for interaction, enhancing the bonding between RH and PP. 2 In this case, the likelihood of filler pull-out is reduced; instead, failure occurs due to the breaking of the RH particles, as shown in Figure 18(a). The inherent silica content in RH, when properly distributed, contributes to a slight reinforcement effect due to its stiffness, provided that the interfacial adhesion is sufficient. 76 From the sample profiles, all the composites fractured in a similar manner, displaying rough surfaces and conical marks. However, the RH introduced variations to the topographical features of the fracture surfaces. These variations are formed at the matrix surface and predominantly caused by transverse fractures in the matrix plane, as illustrated in Figure 18(d). The RH particles are randomly oriented within the PP matrix, and when adhesion between RH and PP is insufficient, the composites exhibit tendencies for fiber detachment and pull-out. 77 Another key fracture mechanism observed in these samples is fiber breakage, as seen in Figure 18(a), in addition to fiber pull-out.
Conclusion
This study successfully demonstrates the mechanical recycling of ortho-grade PP waste reinforced with RH to develop a sustainable and high-performance composite material. The experimental findings revealed that filler content, particle size, and polymer-filler interactions significantly influence the composite’s mechanical, thermal, and structural properties. The optimized composition of 80 wt% PP, 20 wt% RH, and a particle size of 125 µm exhibited the best performance, achieving enhanced tensile, impact, bending, and compression strength due to improved filler dispersion and interfacial adhesion. The integration of Fourier Transform Infrared Spectroscopy (FTIR), Thermogravimetric Analysis (TGA), Differential Scanning Calorimetry (DSC), and Scanning Electron Microscopy (SEM) provided key findings on polymer-filler bonding, degradation behavior, and structural uniformity. Moreover, the application of Grey Relational Analysis (GRA) enabled multi-response optimization, ensuring a well-balanced mechanical enhancement.
This research highlights a novel and practical approach to recycling PP waste while utilizing agricultural byproducts, contributing to sustainable material development. The experimental results confirm that the RH-PP composites possess the necessary mechanical strength, thermal stability, and structural uniformity required for semi-structural biomedical applications. Their performance makes them highly suitable for manufacturing assistive components such as prosthetic and orthotic parts, where a combination of lightweight, durability, and heat resistance is essential. Thus, these composites present a viable and eco-friendly alternative to virgin polymer-based materials in medical rehabilitation and mobility-support systems. Although no coupling agents or fiber surface treatments were applied in this study, the results demonstrate satisfactory performance. Future studies may further enhance this material by exploring surface modifications, coupling agents, or hybrid filler combinations to tailor it for broader engineering applications. Additionally, water absorption behavior, a critical factor in natural fiber composites will also be evaluated in future work to ensure durability and suitability under moist or humid conditions.
Footnotes
Declaration of conflicting interests
The author(s) declared no potential conflicts of interest with respect to the research, authorship, and/or publication of this article.
Funding
The author(s) received no financial support for the research, authorship, and/or publication of this article.
Data Availability Statement
All data is available within the manuscript.