
Abstract
Polyacrylonitrile (PAN) and Polyamide (PA)-6 based nanofibrous composite were prepared for air filtration application. PAN was electrospun on spun-bonded non-woven polypropylene which acts as a collector and the samples were coated with PA-6. Box-Behnken experimental design was used to design the experimental plan. As per the experimental plan, PA-6 coated samples were treated with different concentrations of an alkali solution (NaOH) (2%, 5% and 8%) and treatment temperature (60oC, 80oC and 100oC) to enhance the surface properties. As prepared nanofibrous composite was tested for its various properties such as surface morphology, particle filtration efficiency and air permeability. Fourier transform infra-red analysis and scanning electron microscope were performed to analyze the functional groups and morphology of the nanofibrous composite respectively. The air permeability of the control and treated samples was analyzed as per the standard procedure and the permeation level varies from 52.5 to 60 cm3/cm2/s for control samples, 65–195 cm3/cm2/s for treated samples. The overall filtration efficiency for treated samples varies from 36.54% to 78.56%. The sample which is treated with 5% NaOH at 60oC has a higher overall filtration efficiency of 78.56%.
Keywords
Introduction
Filtration is an effective process used to separate suspended solid particles from the air using a filter medium. The filter medium is usually a permeable material so that filtration can be achieved effectively. Thus, for better filtration, the filter media should have high permeability and efficiency. 1 For airborne particles, both fibrous and fabric filters were used to remove solid particulates from the air. Filters are classified into two types such as mechanical filters and electrostatic filters based on the principle of separation of particles. For mechanical filters, they are separated by specific filtration mechanisms such as interception, inertial impaction, diffusion and electrostatic interaction which depends upon the size of the particle and airflow velocity. As per the mechanism, 1–10 μm particles are filtered by gravitational settling and the maximum efficiency was achieved for bigger particle size. In the case of inertial impaction, the particles are filtered in the range of 0.1–1 μm, however, a bigger, particle size gives higher filtration efficiency. In the case of the interception mechanism, the particles are filtered from 0.05–0.5 μm. In the case of diffusion, the increase in particle size leads to a decrease in efficiency. However, while comparing all the mechanisms, the least filtration efficiency such as less than 50% was achieved for 0.3 μm particle, which is called as most penetrating particle. 2 Electrostatic filters are charged fibres that attract the particles by the application of an electric field. Synthetic polymer fibres were used as filters when the electrostatic interaction method is preferred.3,4 The existing air filters are produced from various polymeric materials such as polypropylene, 5 polyamide (PA), 6 polyester, 7 polyacrylonitrile (PAN) 8 etc. Nanofibres are produced by several methods however electrospinning is the widely used method to produce nanofibres for air filtration application. 9 Various surface modification methodologies are used to enhance the performance of membrane including chemical (chemical vapour deposition, alkali treatment and co-polymerization) and physical (high energy irradiation, heat and plasma treatments) methods. 10 PAN is an extensively used polymer for several applications due to its high abrasion resistance, inexpensive, porous nature and easy surface modification. 11 By alkaline solution hydrolysis, the conversion of –CN groups of the PAN membrane surface into –CONH2 and then into –COO– groups. Thus, the functional groups can be uniformly distributed along the PAN chain. Recently, PAN hydrolysis has been widely used for the preparation of composites for various applications.12,13
In this research work, nanofibre (PA) was collected on polypropylene non-woven fabric and PA-6/Polyethylene glycol (PEG) solution was uniformly coated over the electrospun web to increase the stability of the web. Then the developed nanofibrous composite was surface treated with alkali to enhance the roughness of the PA surface and exposed pan nanofibre. The effect of alkali treatment on various physical and functional properties of the nanofibrous composite was studied and discussed in detail.
Materials and method
Variables for box-behnken design.

Construction of nanofibrous composite
As per the plan, by varying the collection time, 15 samples of PAN electrospun nanofiber were prepared. Equal weight proportion (50:50) of PA-6 and PEG was dissolved in formic acid (85%) and coated uniformly on the as-prepared nanofibrous web. The samples were dried at room temperature and washed several times to remove the residual solvent and polymer. The prepared nanofibrous composite was treated with different concentrations of sodium hydroxide (NaOH) and placed in the shaking water bath at a constant period of 1 h, as per the temperature in the experimental plan. After alkaline treatment, the nanofibrous composite was washed with cold water and dried at room temperature. The construction of nanofibrous composite is represented in Figure 1. Schematic representation of the construction of nanofibrous composite.
Mass per unit area (grams per square meter)/thickness
As per the ASTM D 3776, the weight, length and width of the sample were measured and the GSM was calculated as per the below-mentioned equation.
L = length of the nanofiber sample (m)
W = width of the nanofiber sample (m)
Using a thickness gauge meter, the average thickness of the sample is calculated as per the ASTM D 1777.
Scanning electron microscope
The surface morphology of the nanofibrous composite was observed through a scanning electron microscope (SEM), (VEGAS TESCAN) with a magnification of 25kx and an accelerating voltage of 30 kV.
Fourier transform infra-red analysis
Fourier transform infrared spectroscopy (Shimadzu FT-IR spectrometer) was used and the spectrogram was observed in the range of 4000–500 cm−1, to study the functional groups of nanofibrous composite.
Air permeability
As per the ASTM D1776-90 Standard Test Method, the air permeability of the developed samples was analyzed and it was carried out with the pressure of 125 Pa (114 cm/4.5″) at different places in the test sample. Air permeability is calculated as per the formula given below.
A= area of the cross-section of the ring (10 cm)
Particle filtration efficiency
As per the ASTM F2299 standard test method, the filtration efficiency was determined for the developed samples. This test method utilizes the light scattering particle counter with the capacity of 0.3–10.0 μm to find out the input and output particle sizes with numbers. In this test method, the airflow velocity is maintained at 5 cm/s. The test procedure measures filtration efficiency by comparing the particle count in the feed stream (upstream) to that in the filtrate (downstream). Filtration efficiency is calculated as per the formula given below and the schematic diagram of the filtration efficiency tester in Figure 2. Schematic diagram of filtration efficiency tester.
14


Results and discussion
Surface modification
Hydrolysis is to transform surface nitrile groups into carboxylic groups, which improves the web’s stability. This occurs in two phases; the first phase involves the hydrolysis of nitrile groups to produce an amide moiety. The –CONH2 groups are removed in the second stage, and carboxylic acids are formed by adding a hydroxyl group to the amide. Overall, alkaline solution hydrolysis is to convert the –CN– groups present on the surface of PAN membrane to –CONH2– and eventually to –COO– groups, resulting in membrane stability. 15
Surface morphology of the nanofibre and surface modified filter (scanning electron microscope)
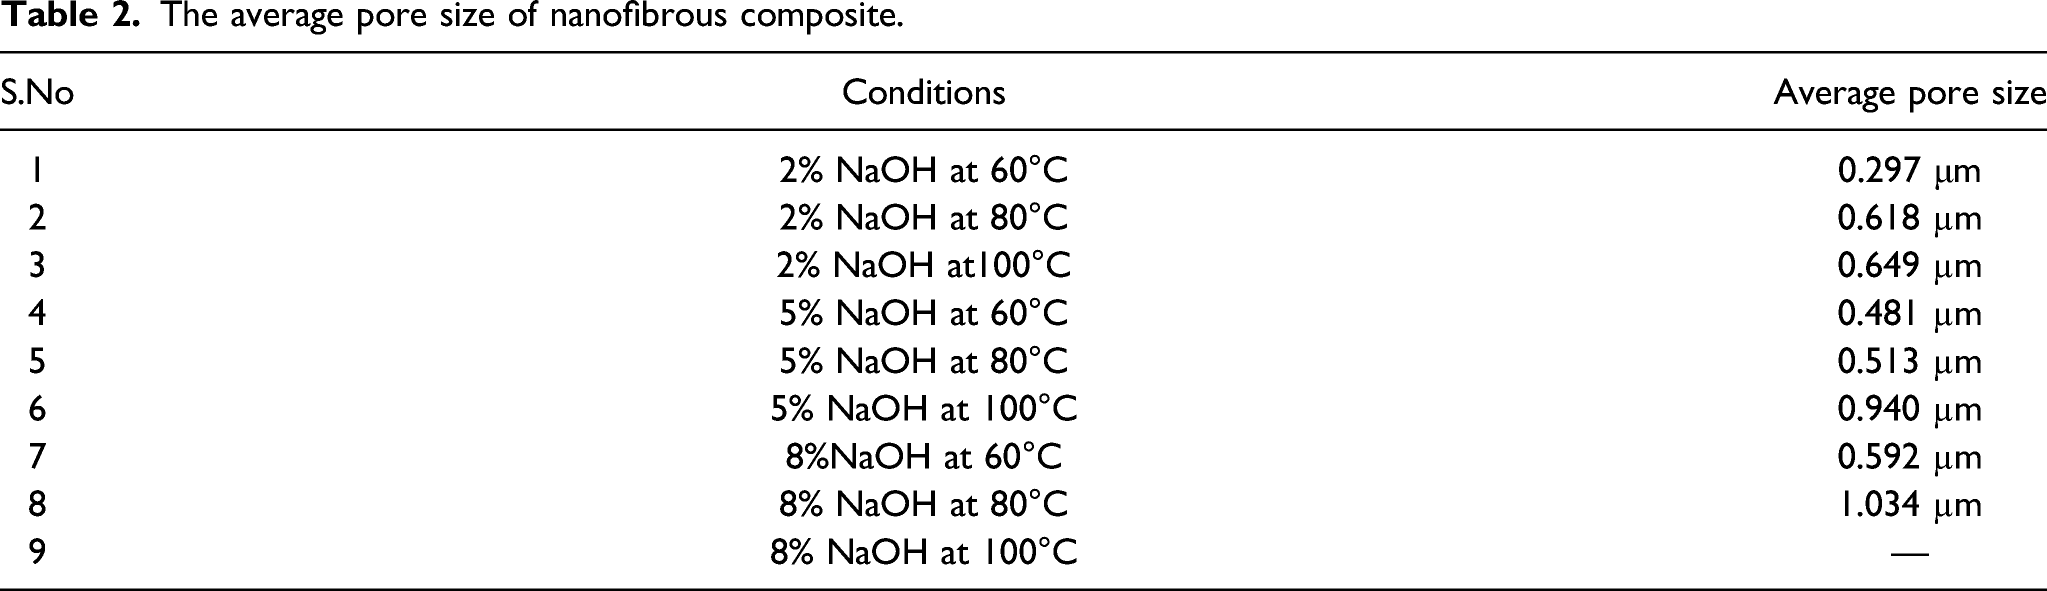
The surface morphology of electrospun web and alkali-treated nanofibrous composite was observed through SEM micrographs and given in Figure 3. The average fiber diameter of the control sample is around 250 nm and the structure has randomly oriented more uniform fibers. Scanning electron microscope images of (a) Control sample, (b) 2% NaOH at 60°C, (c) 2% NaOH at 80°C, (d) 2% NaOH at 100°C, (e) 5% NaOH at 60°C, (f) 5% NaOH at 80°C, (g) 5% NaOH at 100°C, (h) 8% NaOH at 60°C, (i) 8% NaOH at 80°C, (j) 8% NaOH at 100°C.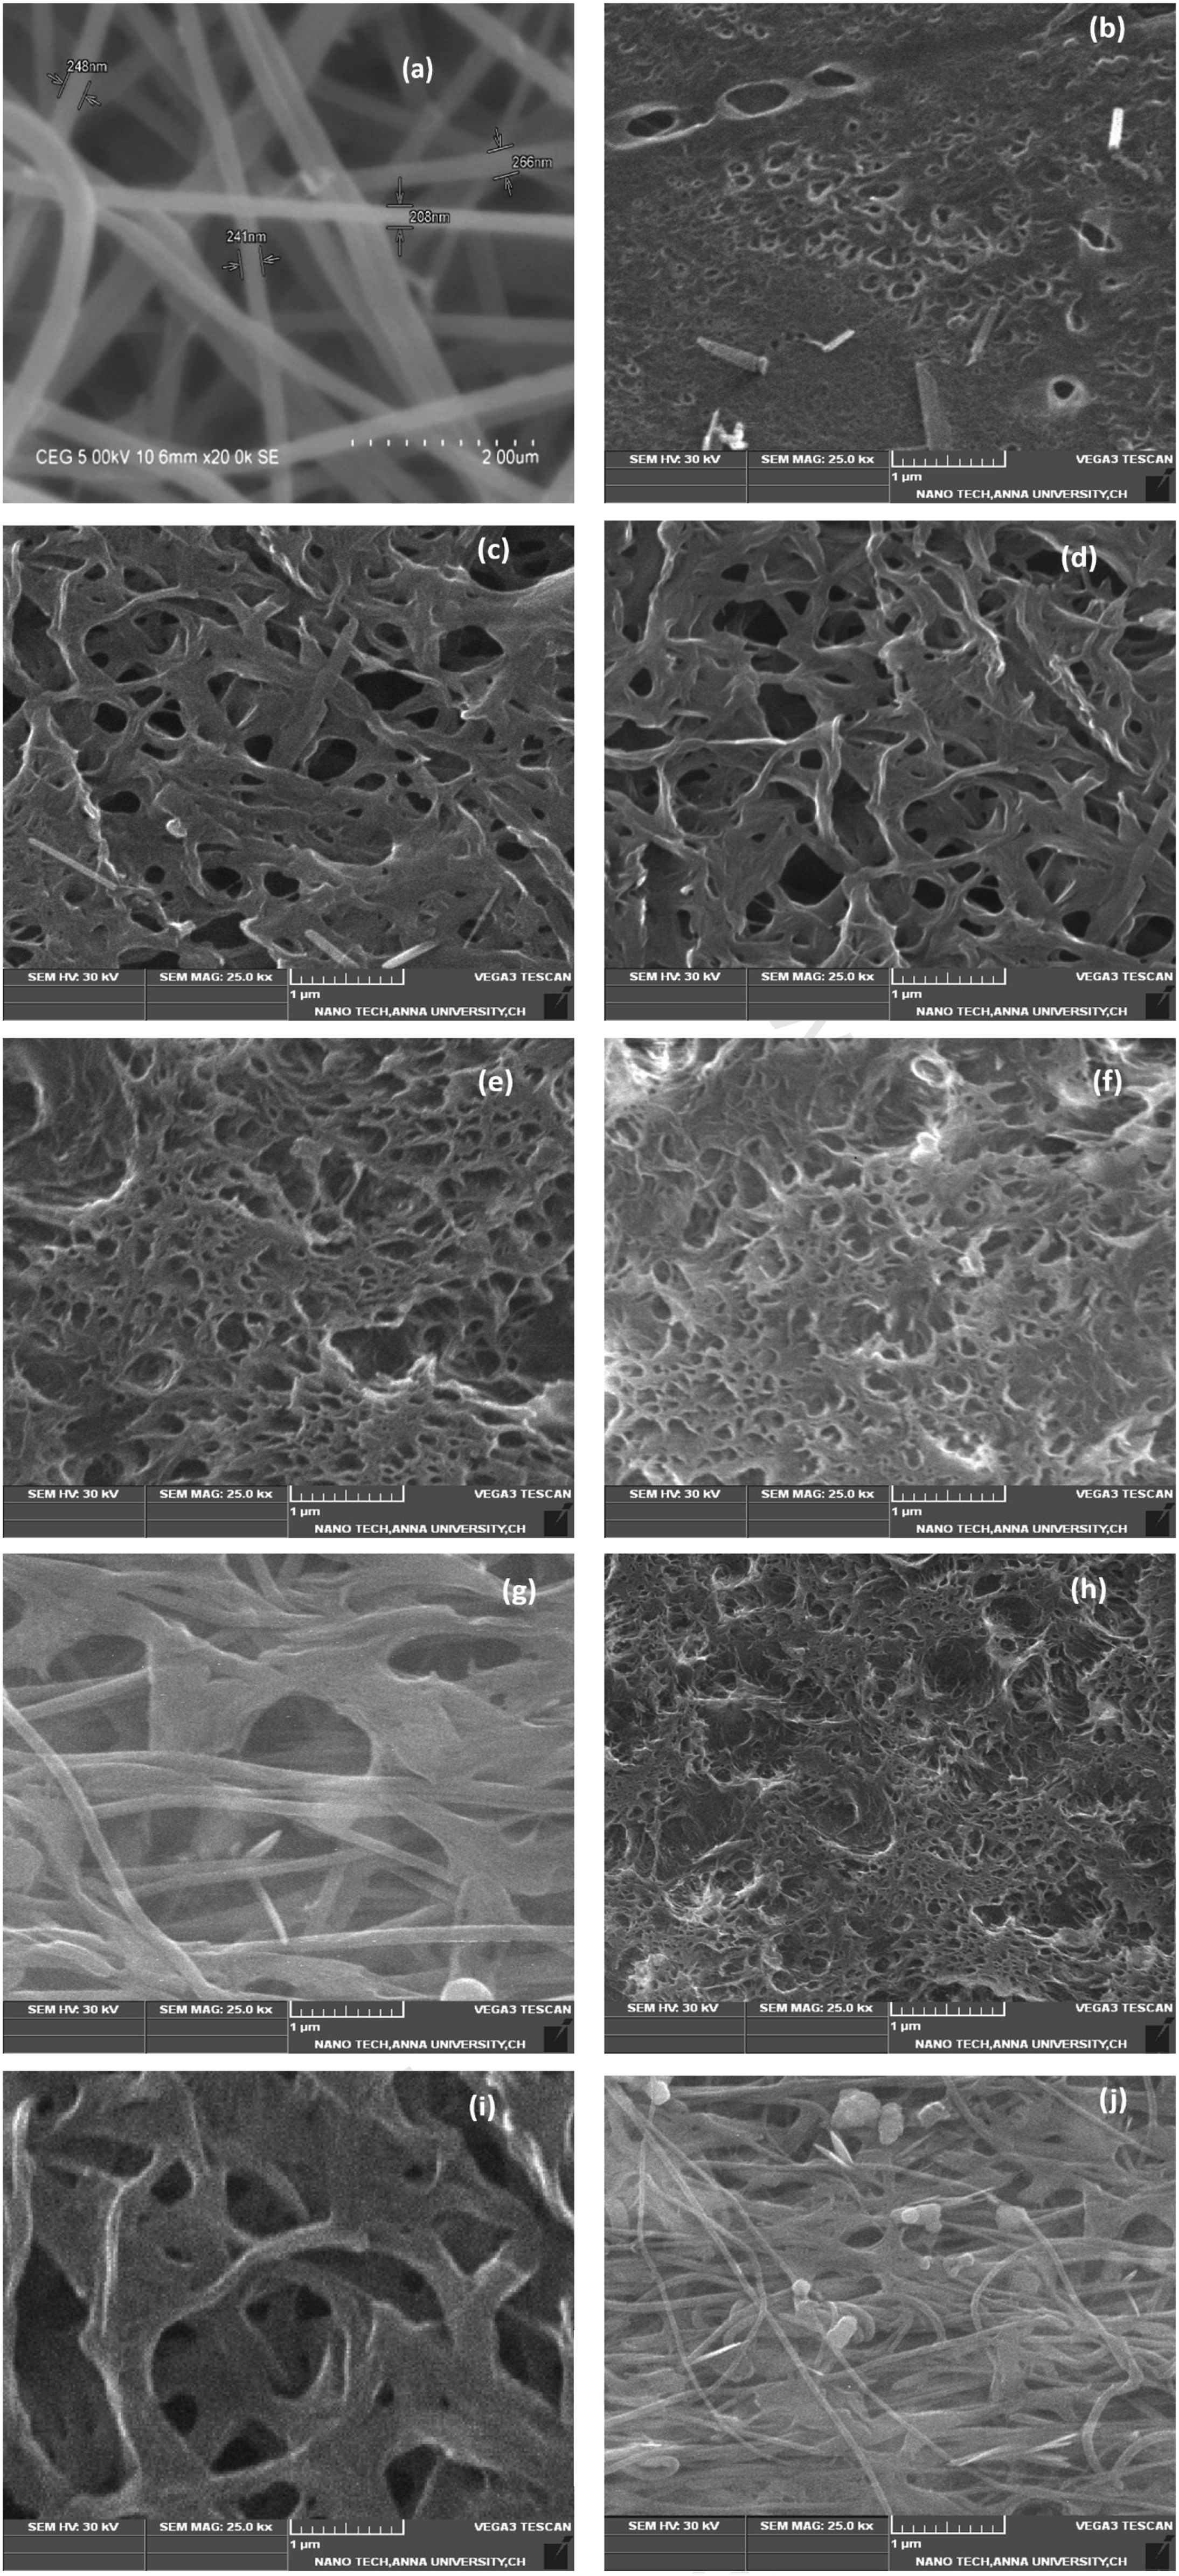
The average pore size of nanofibrous composite.
Fourier transform infra-red analysis
Figure 4(a) shows the FTIR spectrum of the control sample and Figure 4(b)–(d) shows the alkali-treated samples with different concentrations and different temperatures. In the control sample, the peak at 2936 cm−1 and 1736 cm−1 is due to stretching of C≡N and C=O of PAN respectively.
16
The peak at 3294 cm−1 is the N-H stretching vibration and 1635 cm−1 is amide carbonyl (C=O) of PA-6 respectively.
17
(a) FT-IR graph of the control sample. (b) FT-IR graph of 2% NaOH at different temperatures such as 60°C, 80°C and 100°C treated samples. (c) FT-IR graph of 5% NaOH at a different temperature such as 60°C, 80°C and 100°C treated samples. (d) FT-IR graph of 8% NaOH at a different temperature such as 60°C, 80°C and 100°C treated samples. FT-IR: Fourier Transform Infra-Red Analysis.
The peak at 1536 cm−1 existing in the treated sample represents the amide CONH2 moiety. 12 When comparing the 2% alkali-treated samples for the temperature, the peak intensity is high for the 80°C treated sample. For all the bonds in this temperature, the peak intensity was observed as high. Hence, the suitable temperature for this alkali treatment is 80°C. However, while comparing the 5% alkali treatment conditions, the effect of treatment on peak intensity is not uniform and it varies based on the stretching of bonds.
In the case of 8% alkali-treated samples, the peak intensity decreases further increase in temperature. This is due to the degradation of the compounds due to alkali treatment with higher treatment time and higher temperature.
Properties of nanofibrous composite
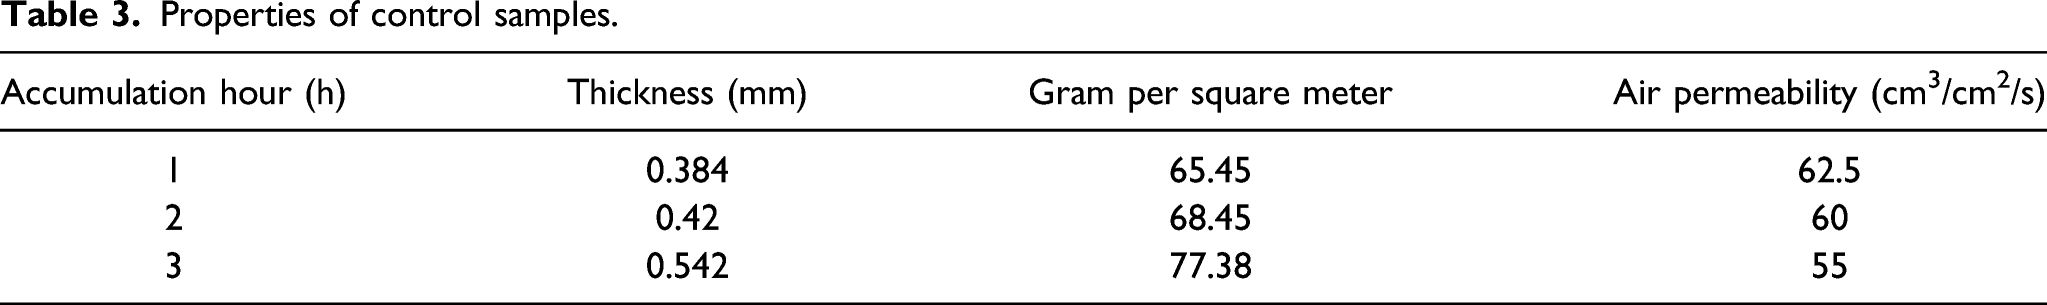
Properties of control samples.
Physical properties of alkali-treated samples.

Filtration efficiency
Particle filtration efficiency of control and treated sample.

The overall filtration efficiency of control samples varies from 32.48% to 54.83%. The overall filtration efficiency of the control sample has been varied based on the PAN accumulation hour. As the accumulation hour increases, the thickness of the nanofibrous composite increases which shows significantly lower performance than alkali-treated samples.
With respect to the particle size 0.3–3 μm, the particles are filtered by the mechanism’s diffusion, inertial impaction and interception. In general, the slippage of the particles from the surface of the filter or fibre will also happen due to smoothness. Hence if the surface roughness is imparted to the filters will also help to improve the filtration efficiency. Thus, the filtration efficiency of the alkali-treated samples was improved due to surface roughness. 18 The highest overall filtration efficiency was obtained for the second S2 compared to the control sample. This implies that the 2% alkali treatment is best the concentration as the pore size is minimum compared to other alkali concentrations. At lower alkali concentration and treatment temperature, the fibre swells and forms very small pores. Further, an increase in the concentration of NaOH and treatment temperature results in the degradation of PA-6 which creates a bigger size pore.
Regression analysis
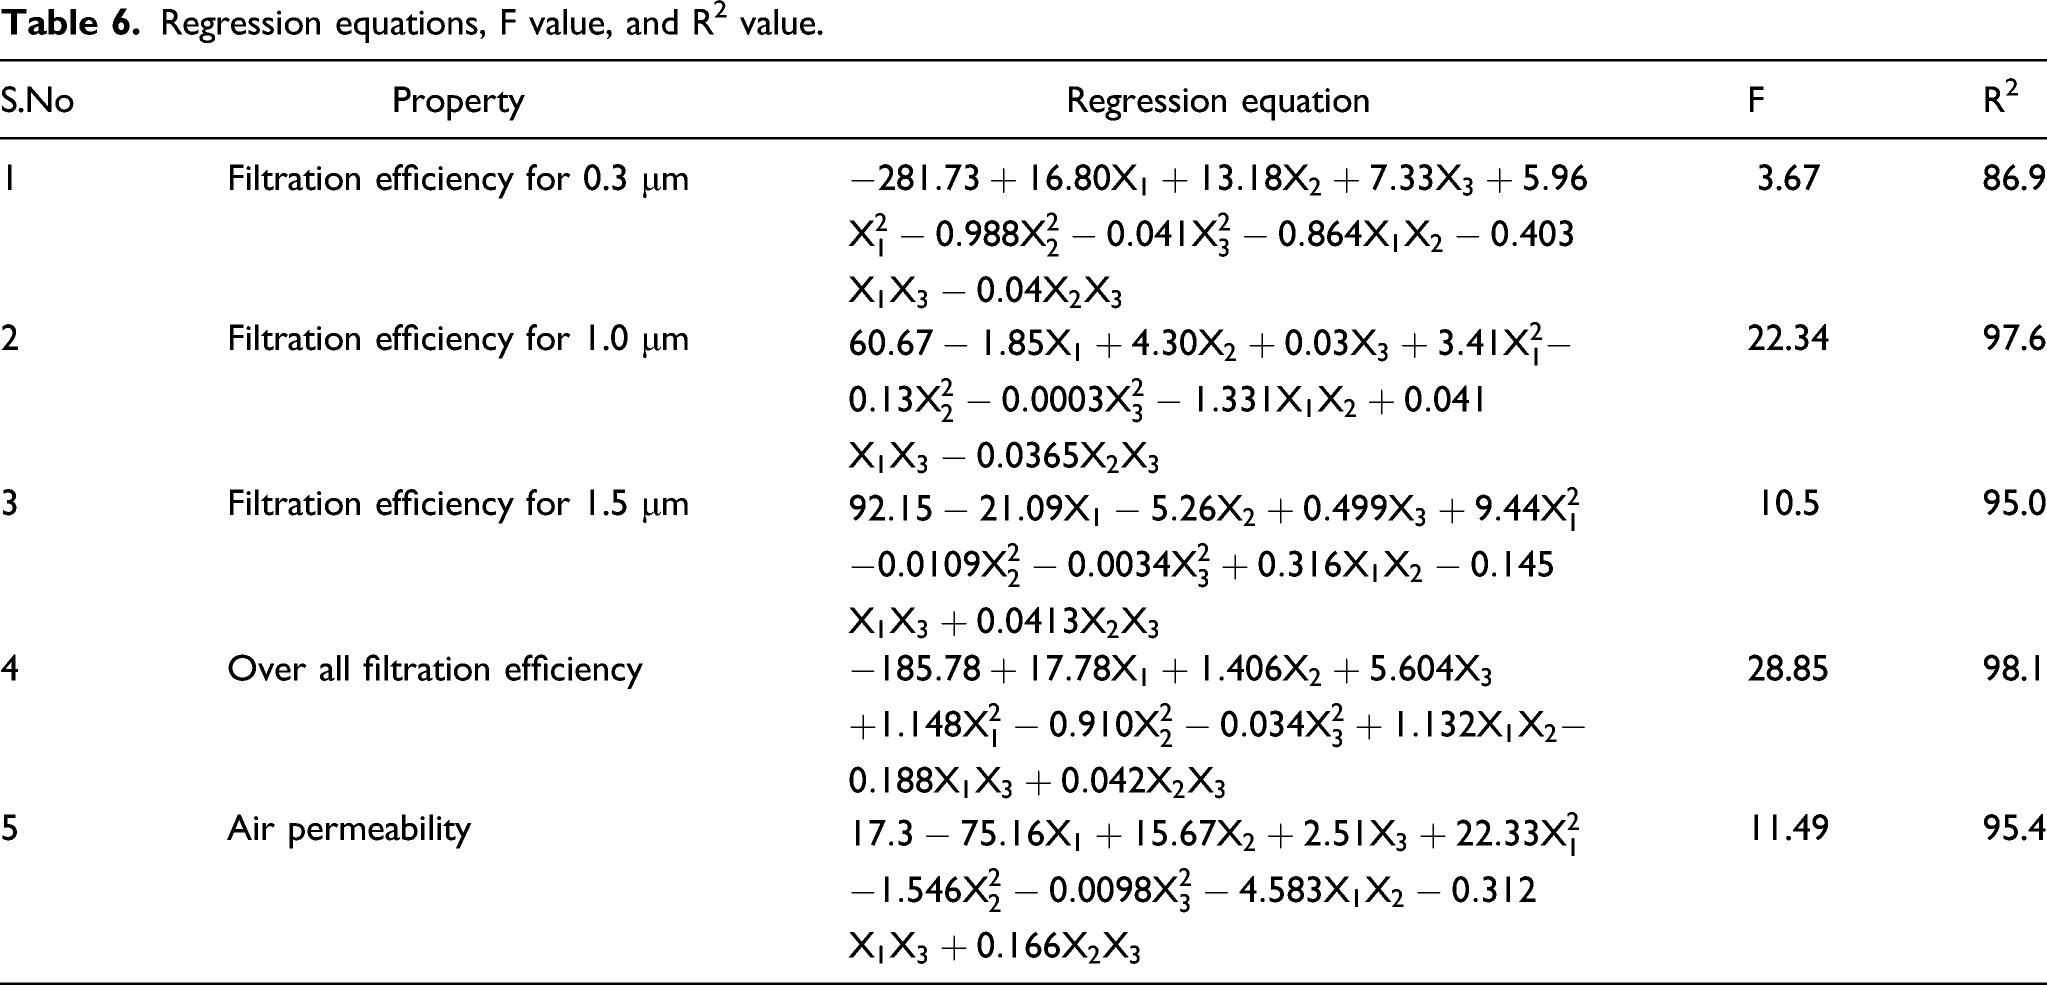
Regression equations, F value, and R2 value.
Response optimization and composite desirability analysis
Input parameters for response optimization.

Effect of input parameters on various properties of nanofibrous composite
Influence of process parameters on air permeability
The effect of process variables on air permeability is shown in Figure 5(a)–(c). It was observed that the lower electrospinning time, the higher concentration of NaOH and the higher treatment temperature result in higher air permeability due to lower nanofibre content, and more surface etching of composite by alkali conditions. While comparing the independent variables, the effect of concentration of NaOH is minimum on-air permeability then electrospinning time and treatment temperature. The increase in thickness of nanofibre composite due to higher electrospinning time results in lower air permeability. However, the higher concentration of NaOH and higher treatment temperature results in higher air permeability. (a)–(c) Influence of input parameters on the air permeability of surface-treated filters.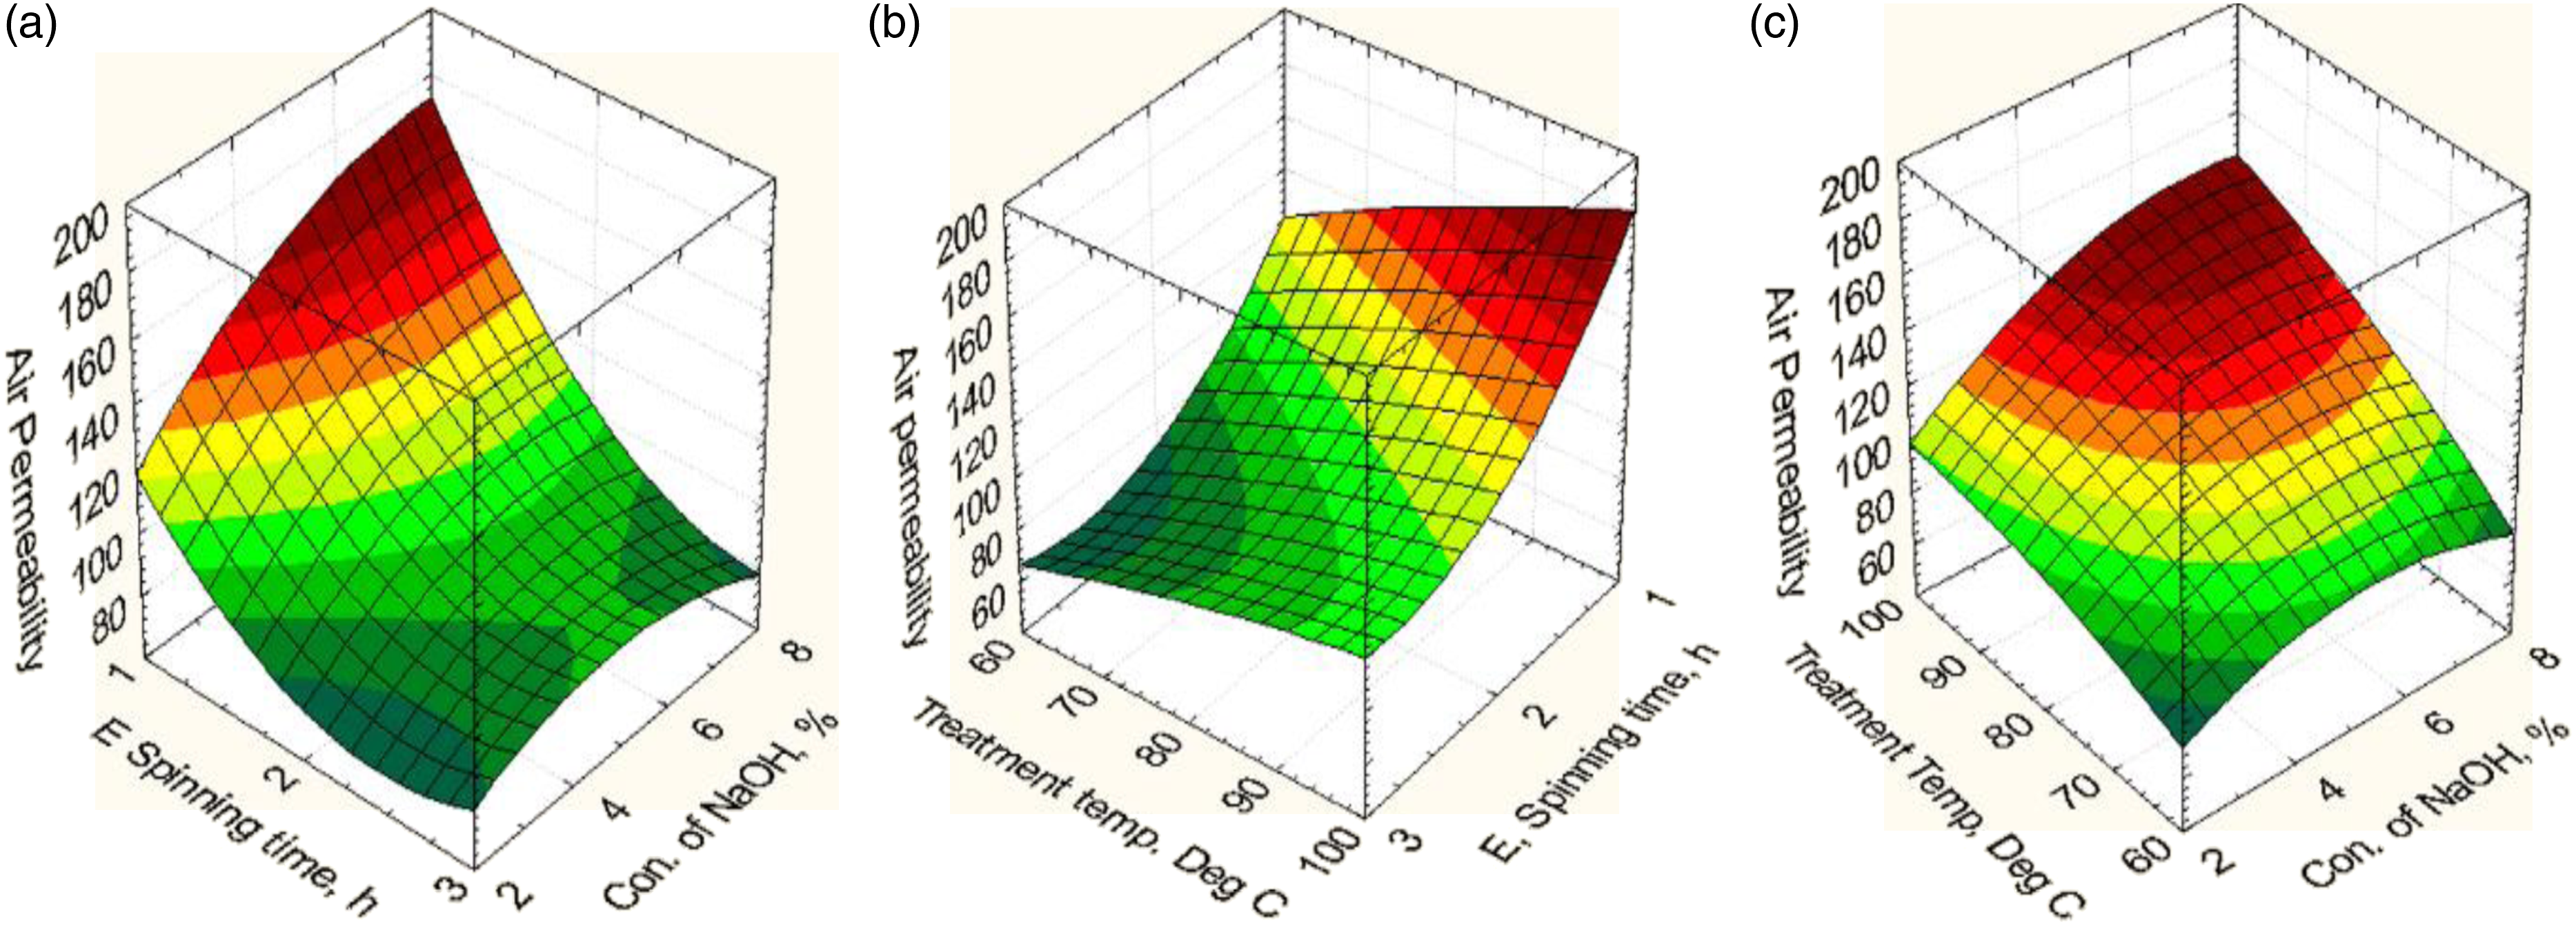
Influence of process parameters on filtration efficiency of 0.3 μm particles
The filtration efficiency for the particle size of 0.3 μm varies from 13.83% to 65.56%. The effect of process variables on the filtration efficiency of 0.3 μm particles is shown in Figure 6(a)–(c). In the case of filtration efficiency for 0.3 μm, higher electrospinning time, lower concentration of NaOH and temperature results in higher filtration efficiency. This implies that the lower concentration and temperature for the treated samples have a small pore diameter due to the swelling of nanofibers. Hence the surface roughness of the PA layer, nanofibers and random orientation of nanofibers can trap the smaller particles. In this case, due to the roughness of the surface of the filter and fibre, the probability of capturing 0.3 μm particles by Brownian motion is high.
18
(a)–(c) Influence of input parameters on the filtration efficiency of 0.3 μm particles of surface-treated filters.
Influence of process parameters on filtration efficiency of 1.0 μm particles
The filtration efficiency for the particle size of 1.0 μm varies from 53.12% to 92.19%. The effect of process variables on the filtration efficiency of 1.0 μm particles is shown in Figure 7(a)–(c). The electrospinning time influences more on filtration efficiency for the particles 1.0 μm due to higher deposition of electrospun fibres. 2% NaOH concentration is sufficient to enhance the surface roughness to obtain higher filtration efficiency. Hence, higher electrospinning time, lower temperature and concentration results in higher filtration efficiency. A higher concentration of NaOH results in bigger pores and more degradation of surface layers, it reduces the filtration efficiency. (a)–(c) Influence of input parameters on the filtration efficiency of 1.0 μm particles of surface-treated filters.
Influence of process parameters on filtration efficiency of 1.5 μm particles
The filtration efficiency for the particle size of 1.5 μm varies from 66.52% to 97.78%. The effect of process variables on the filtration efficiency of 1.5 μm particles is shown in Figure 8(a)–(c). It was observed that the particle size of 1.5 μm follows the same trend as 1.0 μm particles. However, the filtration efficiency is higher due to the larger particle size. The physical phenomenon involved in the particle collection of 1.5 μm is inertial impaction. This mechanism is responsible to capture particles of size greater than 0.3–1 μm.
19
(a)–(c) Influence of input parameters on the filtration efficiency of 1.5 μm particles of surface-treated filters.
Influence of process parameters on overall filtration efficiency
The overall filtration efficiency for the particles varies from 36.54% to 78.56%. The effect of process variables on overall filtration efficiency is shown in Figure 9(a)–(c). From the observations, in the case of overall filtration efficiency, the smaller pore size can be achieved due to higher electrospinning time and lower concentration of alkali used for treatment. This gives higher overall filtration efficiency. When the treatment temperature increases, it leads to degradation of the surface layer. Hence, a lower concentration of NaOH, higher electrospinning time and 80°C treatment temperature treated sample give higher filtration efficiency. (a)–(c) Influence of input parameters on the overall filtration efficiency of surface-treated filters.
Conclusion
Polyacrylonitrile nanofibre web was prepared by electrospinning and PA-6 coating solution was coated on the nanofibrous surface to develop a nanofibre composite. The nanofibrous composite was treated with different concentrations of alkaline and treatment temperature as per the Box Behnken experimental plan. The alkaline treated and control nanofiber membrane surface morphology was observed through the SEM images and FTIR analyses were also carried out. Due to the alkali treatment, the variation in surface morphology was observed, it also leads to change in various properties of the nanofibrous composite such as air permeability and overall filtration efficiency. The regression equations were derived and the effect of independent variables on various properties was graphically presented and discussed.
The variation of thickness was observed as 0.384–0.53 mm and the mass per unit area is varied from 62.5 to 83.33 g/cm2. The air permeation level varies from 52.5 to 60 cm3/cm2/s for control samples and 65–195 cm3/cm2/s for treated samples. The overall filtration efficiency varies from 36.54% to 78.56%. Composite desirability values for all samples are derived based on air permeability and overall filtration efficiency and the best sample is identified. As per the composite desirability value, the combination of independent variables is identified. The 5% NaOH treated sample at 60oC having the higher filtration efficiency of 78.56% is the best for air filtration.
Footnotes
Declaration of conflicting interests
The author(s) declared no potential conflicts of interest with respect to the research, authorship, and/or publication of this article.
Funding
The author(s) received no financial support for the research, authorship, and/or publication of this article.