
Abstract
Thermoplastic cassava starch (TPS)/sisal fiber (SF) composites were prepared by the melting method. The effect of SF on the retrogradation kinetics, morphology and size of spherulites, molecular interactions, short-range molecular structure, and crystal type of TPS was investigated. The results indicate that the retrogradation degree and rate of TPS increase with the addition of SF, and the spherulites become clearer and denser. The neat TPS sample forms an A-type crystal through double helix structure and a V-type crystal through single helix structure. After the addition of SF, the A-type crystal of the TPS/SF composite decreases and the V-type crystal increases. With the further increase of SF content, the TPS/SF composite mainly presents the V-type crystal. The TPS/SF composite has higher crystallinity, but smaller crystal size and interplanar spacing. The storage modulus, loss modulus, and glass transition temperature (Tg) of TPS get enhanced with the addition of SF.
Introduction
With the pollution problems caused by petroleum-based materials and the global emphasis on environmental protection and sustainable development, the research and application of degradable materials have received more and more attention. Starch is an important natural polymer material, which has the advantages of a wide range of sources, low price, and biodegradability.1,2 Therefore, the research and development of starch-based materials have gradually become one of the hot spots of degradable materials in recent years. However, starch materials have disadvantages such as poor mechanical properties and easy absorption of water, which limit the wide application of starch materials. Sisal fiber (SF) is a kind of natural fiber derived from the sisal plant, which has outstanding advantages in reinforcing polymer materials. 3 Campos et al.’s 4 investigation showed that sisal fiber improved mechanical and thermal properties of TPS biocomposites. Franco et al. 5 found that polycaprolactone/starch composites became more hydrolytically stable with higher fiber content because of the fiber–fiber physical network. Orue et al. 6 found the addition of fibers after the annealing process improved poly(lactic acid) thermo-mechanical behavior. Zhao et al.’s 7 investigation showed the mechanical properties of sisal fiber reinforced high-density polyethylene composites, and found the increase of fiber content and interfacial compatibilization could improve the mechanical properties of the composites.
Starch retrogradation occurs during processing or usage, which would affect the structures and properties of starch materials. The retrogradation behavior of starch is affected by the addition of fillers. Ji et al.’s 8 investigation showed the chitin nanowhiskers could inhibit the retrogradation of starch. Liu et al. 9 found that pullulan delayed starch retrogradation by decreasing the chain motion rate and increasing chain flexibility. The crystallinity values of starch increased with increased clay content, due to greater networking between starch and nanoclay particles.10,11 In our previous research, we found that the retrogradation rate of thermoplastic cassava starch (TPS) significantly increased after adding nano-SiO2, but excessive nano-SiO2 content could result in the decrease of retrogradation. 12
Although a lot of researchers have studied the effect of sisal fiber on the mechanical properties, heat resistance, and degradation properties of starch materials, there are few studies on the retrogradation behavior of sisal fiber on starch, and the changes of the multiscale structure of starch in the presence of sisal fiber need to be further studied. In this paper, the retrogradation rate and retrogradation mode of starch were analyzed from the retrogradation degree and retrogradation kinetics. The long-range order structure of starch, such as the spherulites’ morphology, size, and crystal type, was investigated. Furthermore, the movement of starch molecular chains, the hydrogen changes in bonds, groups, and the short-range order structure of starch were analyzed. The relationship between starch retrogradation behavior and multiscale structure by the sisal fiber was revealed, which would provide a theoretical basis and methods for exploring the mechanism of starch retrogradation and the application of starch-based materials.
Experimental
Materials
Cassava starch was obtained from Guangxi State Farms Mingyang Biochemical Company, Nanning, Guangxi, China, which has 17.4% amylose content. The glycerol (Chinasun Specialty Products Co., Jiangsu, China) was used as plasticizer. Sisal fiber was obtained from Guangxi Nongken Group Co., Ltd. Sodium hydroxide (NaOH) was procured from Guangdong Guanghua Technology Co., Ltd.
Samples preparation
Treatment of sisal fiber: A 5-mm long fiber was soaked in 10% concentration of NaOH solution for 4 h. Then, the sisal fiber was washed until neutral with deionized water, and dried at 80oC for 3 h.
The thermoplastic cassava starch (TPS) and sisal fiber (SF) composites were prepared by the melt mixing method, as shown in Figure 1. The cassava starch, glycerol, and sisal fiber were weighed according to the mass ratios of 100/40/0, 100/40/5, 100/40/10, and 100/40/20, which were named as SF0, SF5, SF10, and SF20, respectively. Firstly, the mixtures were physically blended in a high-speed mixer (Tianjin Test Instrument Co., Tianjin, China) and then kept in a sealed plastic bag. After 24 h, the mixtures were melt mixed in a rheometer (RM-200A, Harbin Hapro Electric Technology Co., Harbin, Heilongjiang Province, China) at 140oC. Schematic diagram of the preparation process of TPS/SF composite. (a) Sisal fiber, (b) short sisal fiber, (c) cassava starch, (d) mixing rheometer, (e) compression molding, and (f) TPS/SF composite.
The 0.2-mm film samples were prepared by a compression molding instrument (XLB25-D, Huzhou Shuangli Automation Equipment Co., Huzhou, Zhejiang Province, China) at 160oC and 14 MPa compressing pressure.
Retrogradation process
The sample of about 5.0 mg was weighed and placed in aluminum pan, and gelatinized using differential scanning calorimetry (DSC, Q 20, TA Instruments) from 40oC to 170oC at a heating rate of 10oC/min under ultra-pure nitrogen atmosphere. Then, the sample was taken out and retrograded at 15oC and 55% relative humidity for different retrogradation times (5h, 14h, 2d, 3d, 7d, and 21d).
Differential scanning calorimetry (DSC)
The sample was once again heated using DSC from 40oC to 170oC at a heating rate of 10oC/min under ultra-pure nitrogen atmosphere, and melting enthalpy (
The degree of retrogradation (

The retrogradation kinetics of samples were analyzed by using the Avrami theory


Polarized light microscopy (PLM)
The spherulites’ size and morphology of samples were characterized by a polarized light microscope (59XC-PC, Shanghai optical instrument factory, Shanghai, China) at 600 × magnification. The dimensions of samples were 10 mm × 10 mm × 200 μm.
X-ray diffraction (XRD)
The XRD experiment was carried out by using an X-ray diffractometer (D8 Advance, BRUKER, Germany). The operating conditions were 25°C, 40 kV, and 25 mA. The scanning diffraction angle was from 5° to 40° at a step size of 0.02°. The X-ray wavelength was measured as 0.154060 nm by using a LYNXEYE detector.
From equations (4) and (5), the interplanar spacing (d) and crystal size (L) were calculated


Scanning electron microscopy (SEM)
The samples were fractured in liquid nitrogen and dried in vacuum oven at 45°C for 5 h. The fractured surfaces of the samples were coated with gold, then put into the scanning electron microscopy (SU8010, Hitachi) to observe the fractured surfaces of samples and the dispersion of SF.
Dynamic mechanical analysis (DMA)
The dynamic mechanical analysis was carried out by DMA (Q800, TA Instruments) with the tension mode. The temperature range was from 80oC to 140oC at 3oC/min heating rate and 1 Hz frequency. The specimens (30 mm × 10 mm × 200 μm) were cut from the compressing film, and at least three specimens were tested.
Fourier transform infrared spectroscopy (FTIR)
The groups and structural change of the samples were analyzed by an FTIR spectrometer (IS10, Thermo Scientific, USA). The film samples were scanned from 500 to 4500 cm−1 at 4 cm−1 resolution using the attenuated total reflection (ATR) mode.
13C CP/MAS nuclear magnetic resonance spectroscopy (13C CP/MAS NMR)
The solid-state 13C CP/MAS NMR was carried out by using a Bruker Avance 600.13 MHz WB/Avance NEO (Bruker, Germany) to characterize the change of short-range molecular structure. The 500-mg sample was sealed in the rotor and inserted into the center of magic field with cross-polarization (CP) and magic-angle spinning (MAS) at 23°C.
Results and discussion
Retrogradation behavior
The influence of SF content on DSC curves of TPS is shown in Figure 2. With the increase of SF content, the retrogradation peak of the TPS/SF composite gradually becomes sharp. The retrogradation enthalpy also greatly increases, which indicates that the increase of SF content could promote the retrogradation of TPS. On the other hand, with the increase of SF content, the melting peak temperature decreases, indicating that the perfection of the crystal is reduced. Because SF could induce the heterogeneous nucleation of starch, the number of crystal nucleus of starch increases, which promotes the retrogradation of starch. With the increase of SF content, the retrogradation degree of starch becomes larger. However, due to the increase of crystal nucleus, the crystal growth speed is too fast, and the crystal easily collides during its growth process, which will also affect the crystal’s perfection. Effect of SF content on DSC melting curves of TPS (retrogradation time: 7d).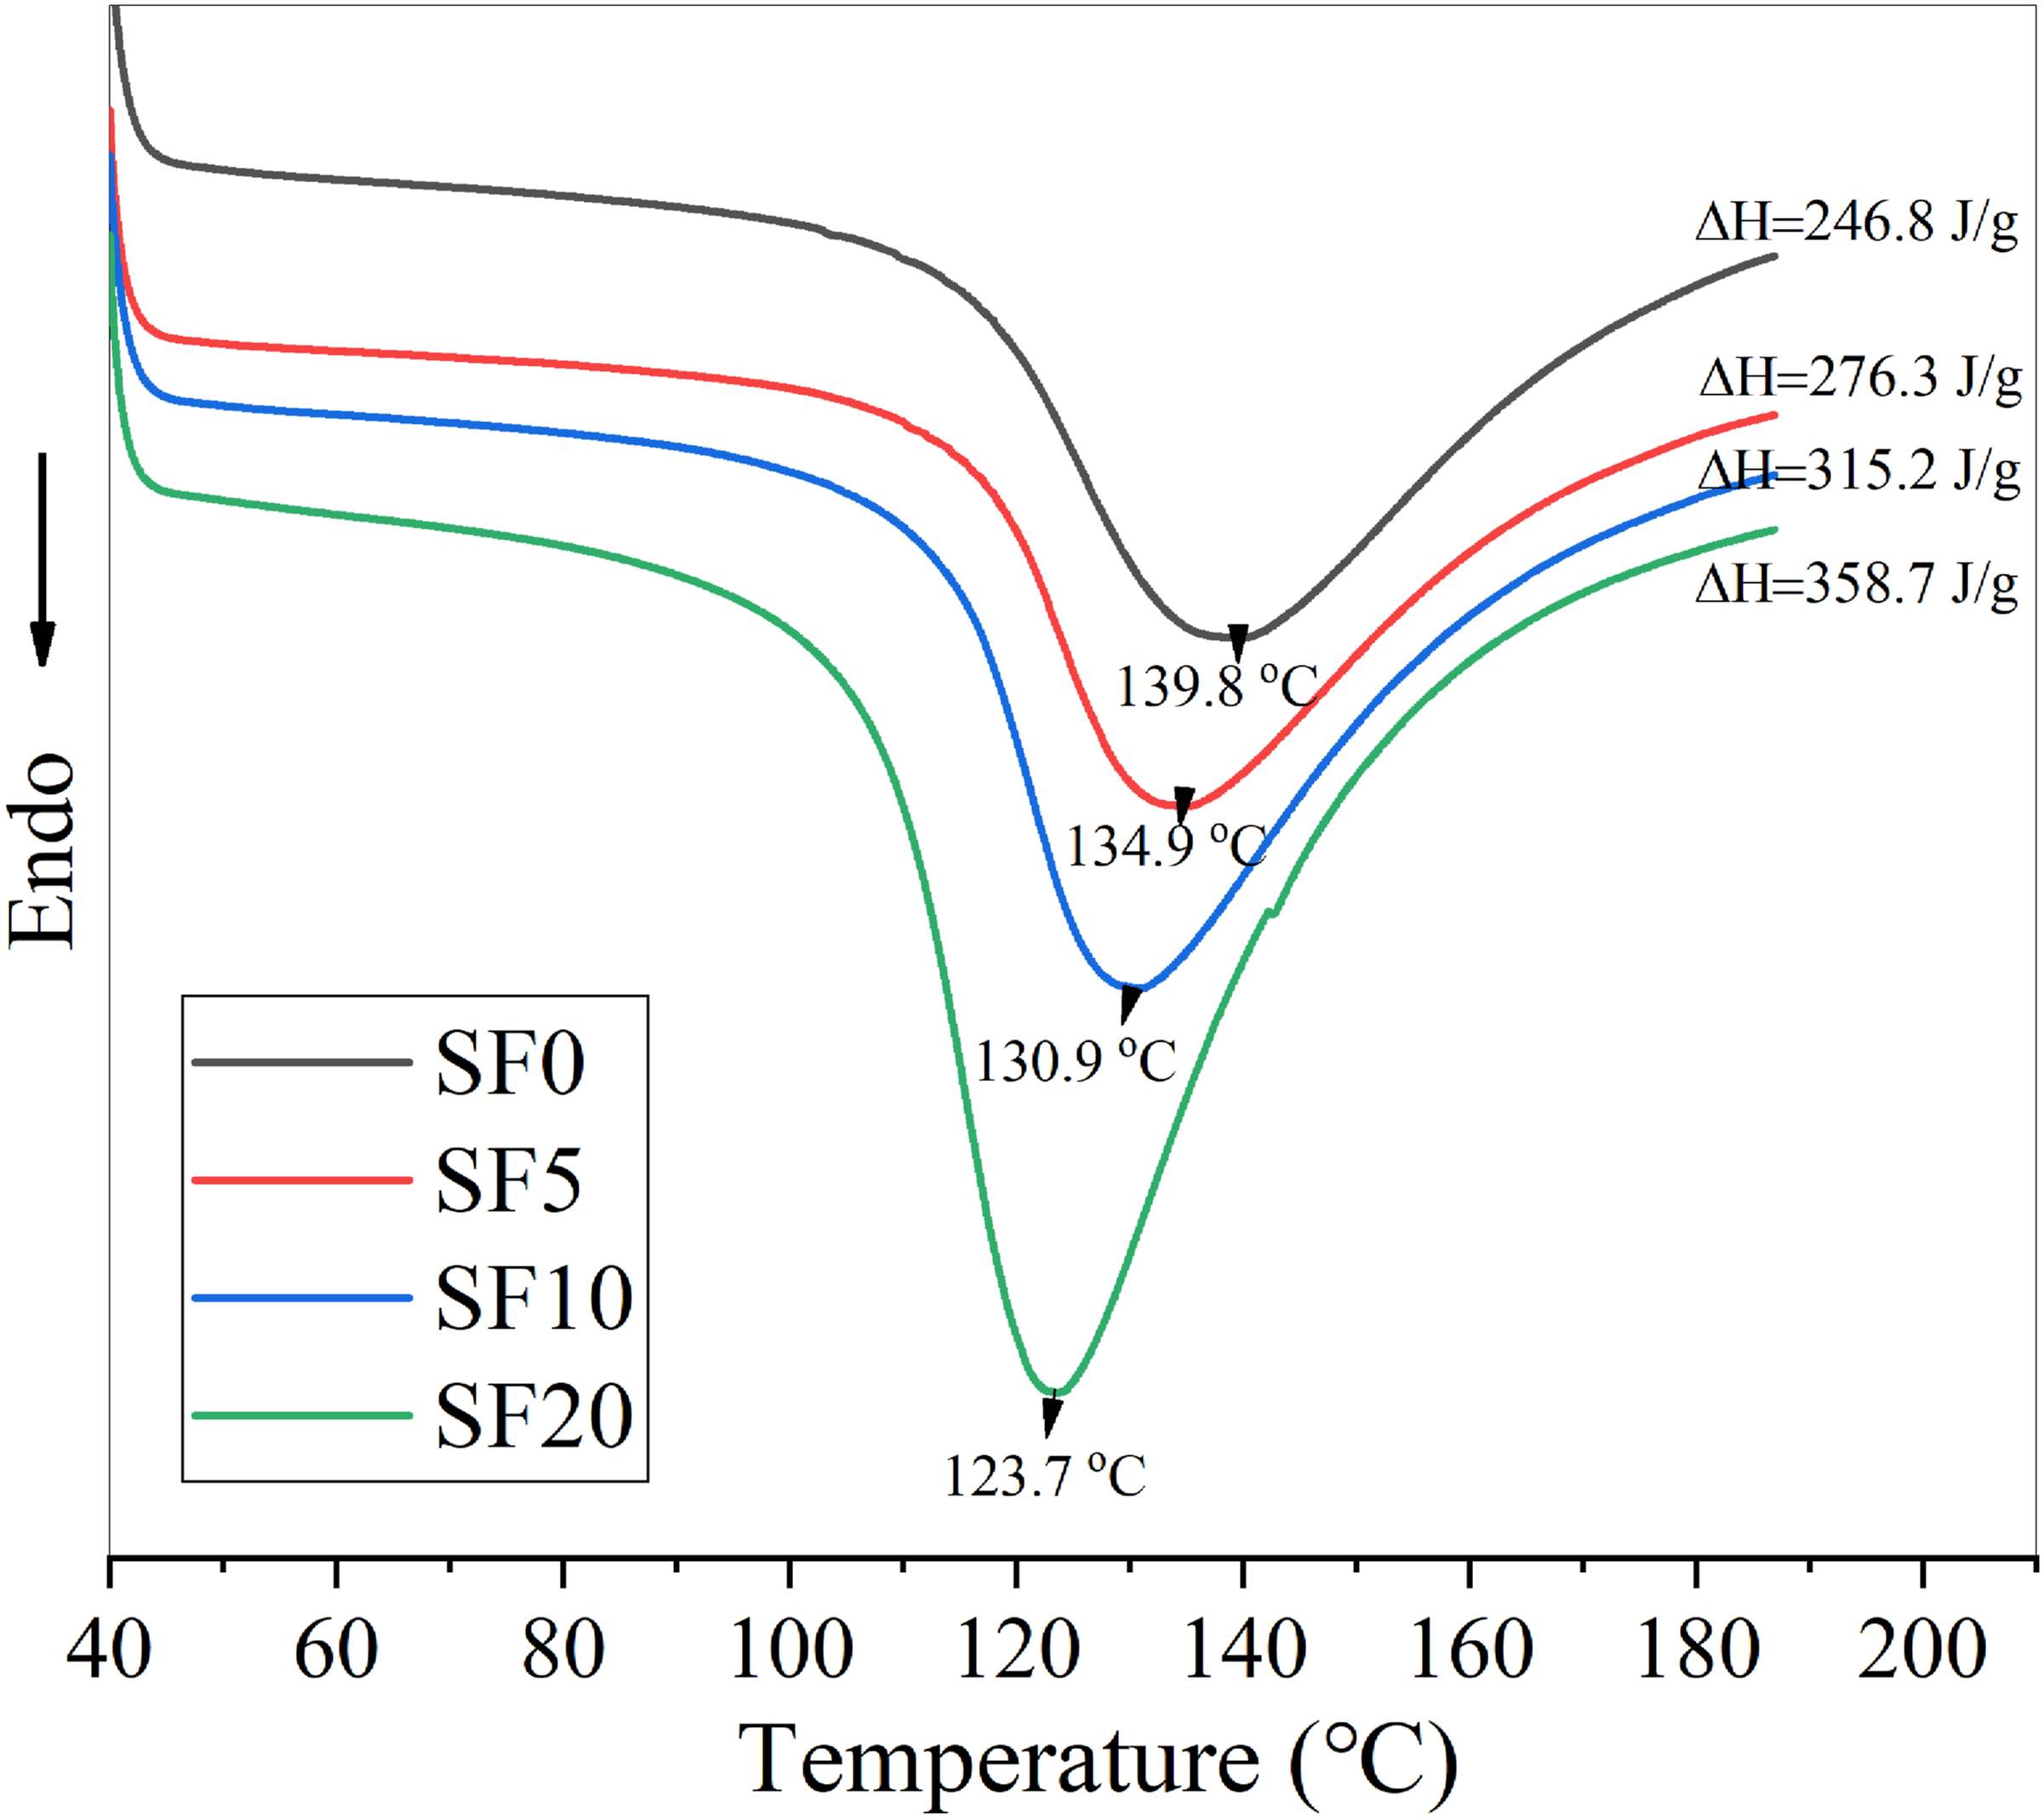
Figure 3 indicates the DSC melting curves of SF0 and SF5 samples at different retrogradation times. There is no melting peak of the samples after 5 h and 14 h retrogradation time, and a smaller retrogradation peak appears after 2 d retrogradation. With the increase of retrogradation time, the retrogradation peak gradually appears and becomes more obvious. For further analyzing the retrogradation kinetics, the Avrami method was used to calculate retrogradation rate constant (k) and retrogradation index (n) of SF0 and SF5 samples, shown in Figure 4. The n values of SF0 and SF5 samples are 2 ≤ n ≤ 3, meaning the two-dimensional nucleation growth. The k value of the SF5 sample is larger than that of the SF0 sample. The higher the k value, the higher the retrogradation rate, indicating that the addition of SF could promote the retrogradation of TPS. DSC melting curves of SF0 and SF5 samples at different retrogradation times. (a) SF0 and (b) SF5. Retrogradation kinetic plots and kinetic parameters of samples.

Spherulites
The effect of different SF content on the PLM images of TPS is indicated in Figure 5. From Figure 5(a), the spherulites of TPS are indistinct and sparse without the SF. With the increase of SF content (Figure 5(b)), the spherulites become smaller and clearer, and the crystal density around SF is obvious. When the amount of SF continues to increase, the spherulites increase and become denser, as shown in Figure 5(c). The spherulites of starch are affected by the molecular structures and the addition of fillers.13,14 Sisal fiber could play a role in heterogeneous nucleation, which increases the number of spherulites and the retrogradation degree of starch.15,16 However, with the further increase of SF content, the spherulites become blurred (Figure 5(d)). The addition of SF can play a role in heterogeneous nucleation, which increases the number of starch spherulites and the degree of starch retrogradation. However, the increase of crystal nucleus would lead to the collision of spherulites during the growth process, which would affect the crystal’s perfection. PLM images of TPS with different SF content (×600). (a) SF0, (b) SF5, (c) SF10, and (d) SF20.
Dispersion of SF
Figure 6 shows the SEM of TPS/SF composites with different SF content. When the SF content was 5 phr, SF had better dispersion in starch matrix and could be wrapped in starch matrix, indicating the good interface between SF and starch matrix (Figure 6(b). With the increase of the SF content (Figure 6(c)), SF could be obviously seen in TPS/SF composites; a small amount of SF was exposed in the matrix. With the further increase of SF content (Figure 6(d)), SF was easily agglomerated and even exposed to the surface of the matrix, which would make the SF easily exfoliate from the starch matrix. Because the molecular structure of starch and SF has a large number of hydroxyl groups, hydrogen bonds are formed between the molecules of starch and SF, which is beneficial to the combination of starch and SF. However, with the further increase of SF content, SF is prone to agglomeration due to the action of the hydroxyl group, which makes the sisal fiber easily separable from the starch matrix. SEM images of TPS/SF composites with different SF content. (a) SF0, (b) SF5, (c) SF10, and (d) SF20.
Crystal type and structure
The crystal type and structure of the materials could be characterized by X-ray diffraction angles (2θ). A-type crystal structure of starch materials has diffraction peaks near 15.0°, 17.0°, and 18.0°, and the V-type crystal has diffraction peaks near 15.0° and 20°24°.17,18 Figure 7 shows the XRD curves of TPS with different SF content. The 2θ of samples without SF show diffraction peaks at 14.7°, 17.3°, 18.0°, 19.6°, and 22.1°, indicating the A + V types crystal of the TPS sample. The 2θ of the SF5 composite is 14.7°, 18.0°, 19.6°, 22.1°, and 24.0°, which also indicates the formation of A+ V types crystal. In addition, the peak of 18° becomes diffused, indicating the increase of V-type and decrease of A-type crystal. When SF content is increased up to 20 phr, the diffraction peaks at 14.7°, 22.1°, and 24.0° appear in the SF20 composite. In addition, the intensities of 22.1° and 24.0° peaks are enhanced, while the peaks of 17.3° and 18.0° disappear, indicating that the V-type crystal is dominant for the SF20 sample. TPS forms an A-type crystal through double helix structure and a V-type crystal through single helix structure in the absence of SF. When 5 phr SF is added, TPS still indicates A + V types crystal, but the A-type crystal decreases and the V-type crystal increases. With the further increase of SF content, TPS mainly shows the V-type crystal. There are a lot of hydroxyl groups on the surface of SF, forming hydrogen bonds with starch hydroxyl groups, which would destroy the double helix structure of starch. XRD curves of TPS with different SF content.
XRD data of TPS containing different SF content.

Motion of the molecules
The storage modulus, loss modulus, and internal friction angle (tan δ) of TPS and TPS/SF composites are shown in Figure 8. With the addition of SF, the storage modulus and loss modulus of TPS/SF composites significantly increase (Figure 8(a)), which indicates that SF could improve the mechanical properties and modulus of TPS. The tan δ curve of TPS without SF has three temperature transitions of 64.8oC, 6.5oC, and 67.7oC, corresponding to Tg of glycerol, thermoplastic cassava starch, and cassava starch. DMA curves of TPS and TPS/SF samples. (a) Storage modulus, (b) loss modulus, and (c) Tan δ.
The plasticizer could affect the phase transformation of starch and the glass transition temperature of the starch material, leading to the changes of the mechanical properties and crystallization.21,22 After adding 5 phr SF, the same phenomenon appears in TPS/SF composites, and the three temperatures are 65.8oC, 27.9oC, and 83.4oC, respectively. Tg of glycerol did not greatly change, and Tg of thermoplastic cassava starch and Tg of cassava starch increase by 329.2% and 23.2%, respectively. The increase of glass transition temperature means the enhancement of the movement temperature of starch molecules. The reason is that there are a lot of hydroxyl groups on the surface of sisal fiber and the formation of the reaction between the hydroxyl groups of starch molecules and SF could hinder the movement ability of starch molecules.
Groups and hydrogen bonding
FTIR spectra of TPS/SF composites are presented in Figure 9. The peak in the range of 32003500 cm−1 is related to the stretching vibration of the OH group. The shift of the lower wave number indicates the enhancement of the hydrogen bond.23,24 The 2924 cm−1 peak is corresponding to CH stretching of the methyl and methylene groups. The peaks at 1647 cm−1 and 1453 cm−1 are related to the amorphous regions of starch. After adding SF, the peak of 1647 cm−1 becomes smooth, which means that the amorphous area was smaller. 1162 cm−1 is C-O and C-C stretching vibration, and 1085 cm−1and 1023 cm−1 are related to the crystal region and the amorphous characteristic peak. From Figure 9, with the increase of SF content, the hydroxyl groups of the TPS/SF composite move to lower wave numbers, indicating the enhancement of the hydrogen bond. The sisal fiber acting as a heterogeneous nucleation could enhance the hydrogen bonding, resulting in the increase of the retrogradation degree. FTIR curves of TPS/SF composites with different SF contents.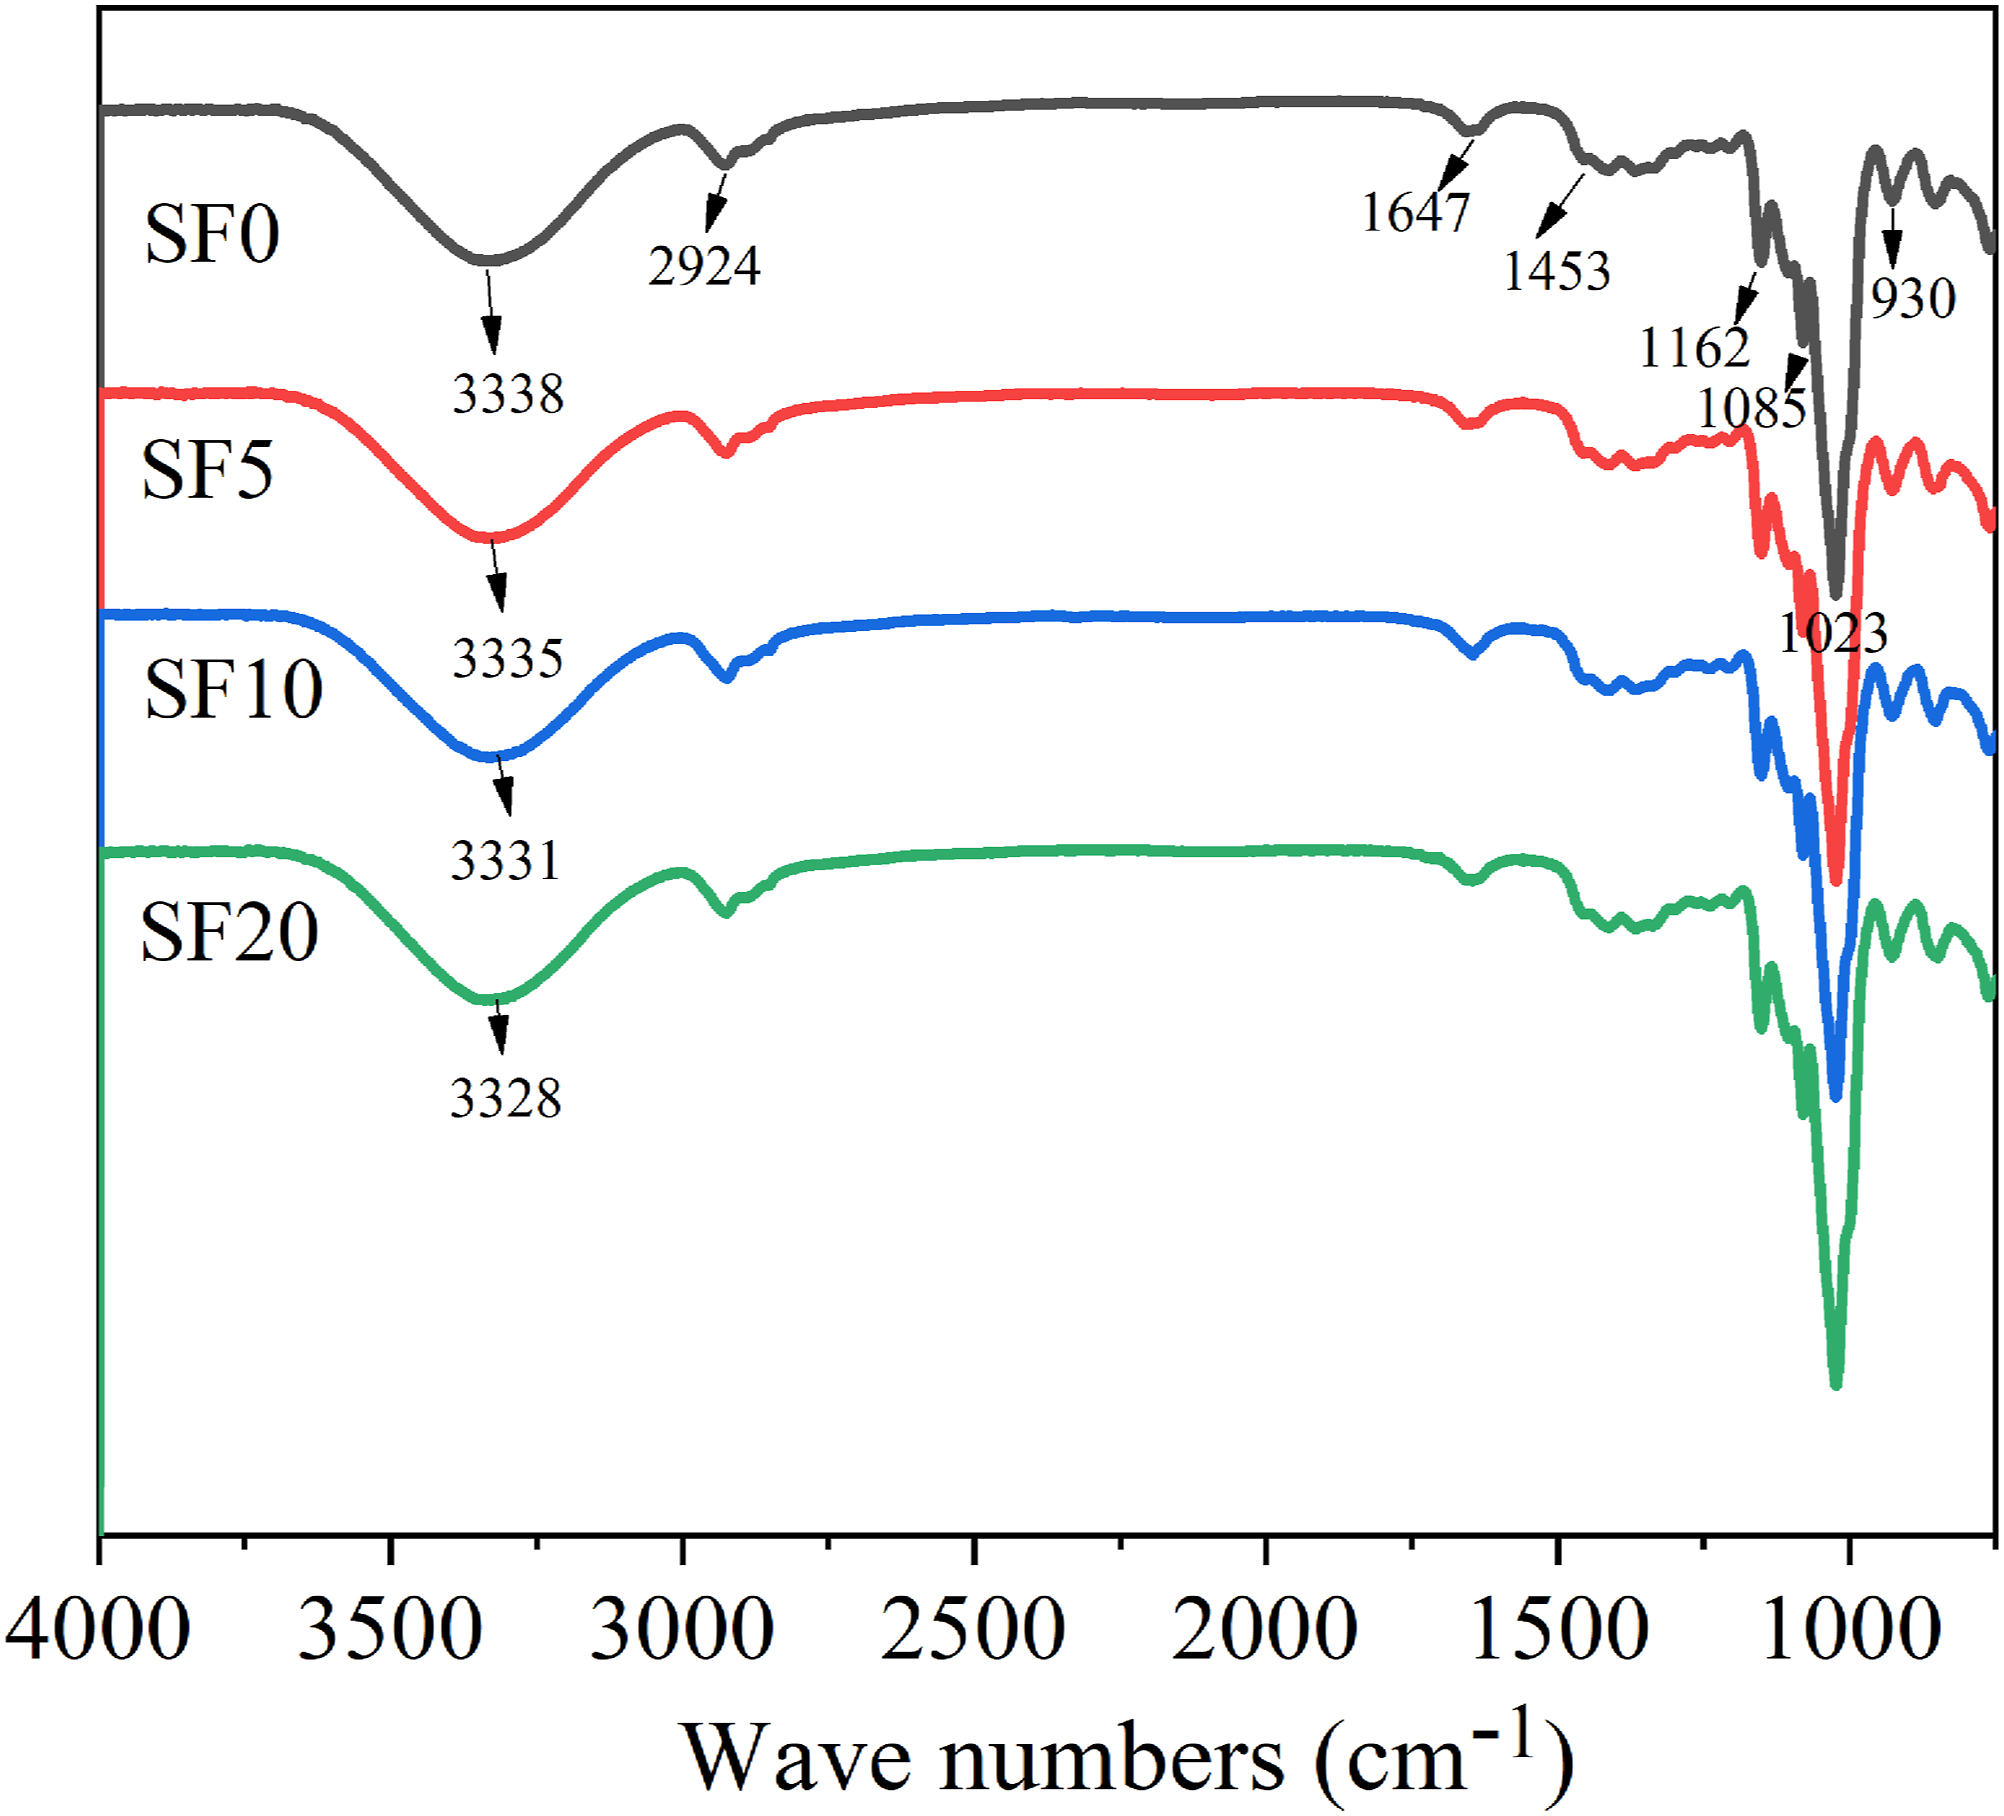
Change of short-range molecular structure
The chemical shift of six kinds of C atom in the glucose unit could reflect the change of chemical environment of starch molecules by 13C-NMR characterization. As shown in Figure 10, the carbon chemical shifts of C1 and C4 are corresponding to 94–108 ppm and 80–86 ppm; C2, C3, and C5 in 70–78 ppm; and C6 in 58–65 ppm.
25
C1 and C4 peaks are related with the crystalline region and the amorphous region, respectively. The C1 single peak is the formant of V-type single helix, and double peaks are the formant of amylopectin double helix. 101–106 ppm of the C1 peak could reflect the V-type single helix, and double peaks at 10297 and 93–96 ppm are the resonance peaks of amylopectin double helices. The C4 peak at 79–86 ppm is attributed to the random coils in the amorphous region. 13C-NMR spectra of TPS/SF samples. (a) SF0, (b) SF5, and (c) SF20.
The C1 of the SF0 sample indicates a three-peak condition (Figure 10(a)), among which the highest peak (103.06 ppm) is corresponding to the V-type crystal and the double peaks (101.52 ppm and 94.39 ppm) are related with the A-type crystal. This indicates that the SF0 sample is A + V types formant of single helix and double helix structures. After the addition of 5 phr SF, the SF5 sample also indicates a three-peak condition (Figure 10(b)); the intensity and area of highest peak increase, and the intensity and area of the other two peaks decrease, indicating the increase of the V-type crystal and decrease of the A-type crystal. With the further increase of SF content up to 20 phr, the SF20 sample is the formant of single peak, indicating the V-type of single helix structure (Figure 10(c)), which is consistent with the XRD results.

Relative area ratios of C1 and C4 peaks and total change (TC) value of TPS/SF samples according to 13C-NMR spectra.

aTotal change (TC) value which is calculated according to equation (6)
The structure diagram of the effect of SF on retrogradation of TPS is shown in Figure 11. The gelatinized state of the TPS/SF composite presents the amylose and amylopectin molecules in a disordered state (Figure 11(a)). In the short-term retrogradation process, the amylose molecules of starch are arranged in order and form the crystalline structure (Figure 11(b)). In the long-term retrogradation process, the amylopectin molecules form double helix structure through the hydrogen bonds and orderly arrangement (Figure 11(c)). During the retrogradation of starch, SF could cause the heterogeneous nucleation effect to promote the crystal nucleation and growth of starch, which is conducive to the retrogradation of starch (Figure 11(i)). Furthermore, the hydrogen bond interaction of starch is greatly affected by SF. In the formation of hydrogen bonds between the SF hydroxyl group and starch hydroxyl group, the hydrogen bond between starch double helix structure might be destroyed (Figure 11(ii)). Schematic diagram of the effect of SF on retrogradation of TPS. (a) Gelatinization of TPS/SF composite, (b) retrogradation of amylose, and (c) retrogradation of amylopectin. (i) Heterogeneous nucleation effect of SF and (ii) the formation of a hydrogen bond between SF and the starch molecule.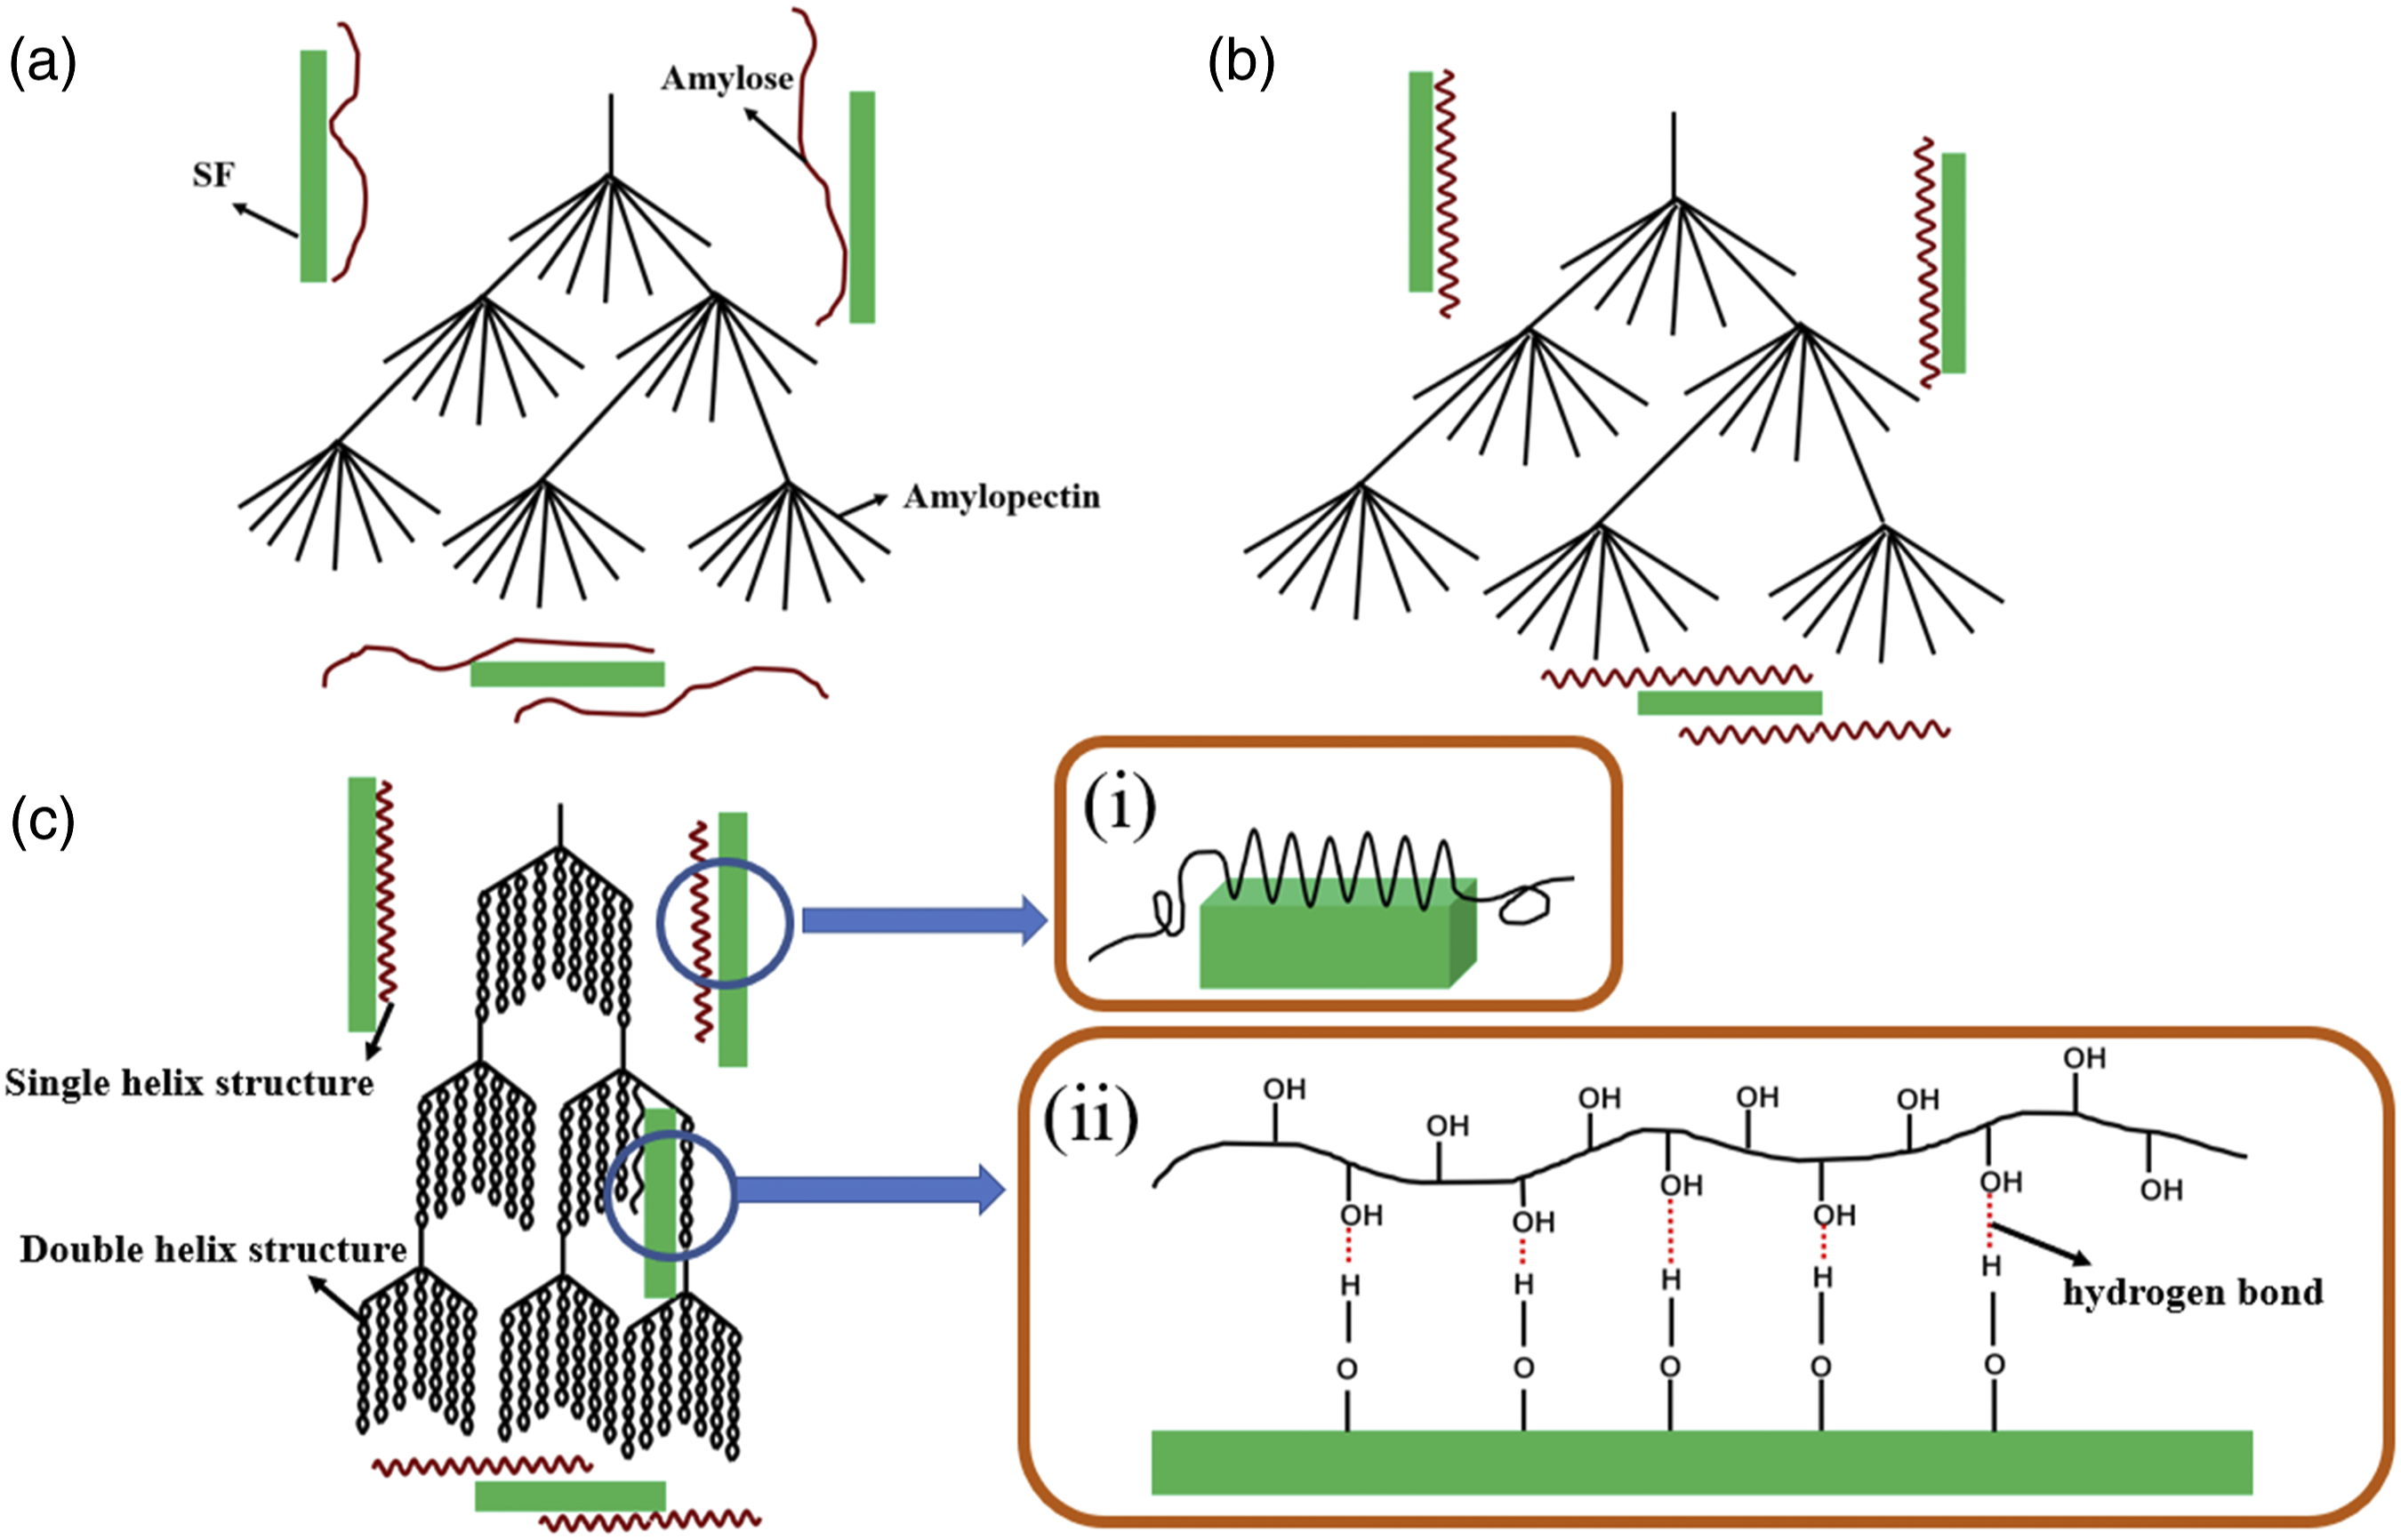
The effect of SF on hydrogen bonding of TPS would bring the change on the single helix, double helix structure, molecular motion, and heterogeneous nucleation of starch molecules, resulting in the changes of retrogradation degree, retrogradation rate, crystal size, and crystal type. TPS forms the A-type crystal through double helix structure and the V-type crystal through single helix structure in the absence of SF. When SF is added, the A-type crystal decreases and the V-type crystal increases. With the further increase of SF content, TPS mainly shows the V-type crystal. There are a lot of hydroxyl groups on the surface of SF, forming hydrogen bonds with starch hydroxyl groups, which would destroy the double helix structure of starch. In addition, the mobility of starch molecules is greatly affected by the SF. The formation of hydrogen bonds through the reaction between starch molecules and SF would reduce the mobility of starch molecules. The heterogeneous nucleation effect of SF could promote the crystal nucleation and crystal growth of starch, which is conducive to the retrogradation of starch.
Conclusions
With the increase of SF content, the melting enthalpy, the retrogradation degree, and rate of TPS increase, and the spherulites become clearer and denser. When SF content is 5 phr, SF has a good dispersion in the starch matrix, and the interfacial adhesion is good. TPS indicates the formation of A + V types crystal, and A-type crystal decreases and V-type crystal increases with the increase of SF content. The TPS/SF composite has smaller crystal size and interplanar spacing, but has higher crystallinity. The storage modulus and glass transition temperature of TPS greatly improve after the addition of SF. With the increase of SF content, the hydrogen bond of the TPS/SF sample is strengthened, which would be beneficial to the increase of retrogradation. TPS indicates the A + V types crystal through the single helix and double helix structures. After the addition of SF, the V-type crystal of single helix structure increases; however, the A-type crystal of double helix structure decreases. When the SF content is further increased, the A-type crystal of double helix structure disappears. From the total change value, the overall short-range molecular structures are promoted after the addition of SF. The experimental results reveal that the effect of SF plays an important role in the retrogradation and structures’ changes of TPS, providing a theoretical basis and methods for exploring the starch retrogradation mechanism and the application of starch-based materials.
Footnotes
Declaration of conflicting interests
The author(s) declared no potential conflicts of interest with respect to the research, authorship, and/or publication of this article.
Funding
The author(s) disclosed receipt of the following financial support for the research, authorship, and/or publication of this article: This study was supported by National Natural Science Foundation of China (Grant No. 51663002) and the Guangxi Natural Science Foundation of China (Grant No. 2017GXNSFAA198083 and 2020GXNSFAA159113).