
Abstract
Thermoplastic cassava starch (TPS)/silica (SiO2) composites were prepared through melt-mixing, and the effect of different SiO2 particle size (20 nm, 200 nm, and 23 µm) on the structure, morphology, and properties of TPS/SiO2 composites was investigated. TPS/SiO2 composite containing 200 nm SiO2 has the lowest plasticizing time and torque, and the highest tensile and impact strength. The 23 µm SiO2 particle has the strongest effect on promoting retrogradation of starch, while the 200 nm SiO2 particle could inhibit the retrogradation of starch. TPS/SiO2 composite containing 200 nm SiO2 has the highest thermal stability, resistant water absorption, and light transmittance. The 200 nm SiO2 particle could be uniformly and finely dispersed in the starch matrix, however 20 nm SiO2 particle easily aggregated in TPS. The spherulites size was uniform in TPS/SiO2 composite containing 200 nm SiO2. TPS/SiO2 composite indicates the mixture of A + V types of crystalline structure, and TPS/SiO2 composite containing 23 µm SiO2 had the largest crystal size.
Introduction
With the enhancement of the ecological and environmental awareness, the effort for use of environmental and friendly materials has been carried out to develop eco-friendly and biodegradable materials. Starch is a kind of biodegradable polymer, which could be obtained from natural plants. Starch has a lot of advantages, such as abundance, low cost, and biodegradability, and is applied in packaging, papermaking, spinning, and medicine fields.1,2 When it comes to the plastics packaging, the relation between plastics packaging and environment protection is considered. The packaging films made from the starch materials might be prepared to replace the traditional plastics packaging film from petroleum products. Moreover, they are considered to be the most promising one of biodegradable packaging materials. However, because a large number of hydrogen bonds in the starch molecules make the starch be difficult to plastic processing, the plasticizers such as the water, glycerol, formamide, and urea were used to prepare the thermoplastic starch. 3 In addition, the application of starch is still limited because of the poor mechanical properties, sensitivity to moisture, and high permeation. Blending is a handy and effective method to overcome the disadvantages. Wilhelm et al. 4 found that mineral clay was used as filler in order to improve the mechanical properties of starch films. Valencia et al. 5 found that laponite nanoparticles induced new interactions with starch chains to form a network structure. Kampeerapappun et al. 6 reported that starch/montmorillonite (MMT) composite film at low MMT content exhibited an improvement in tensile properties due to a reinforcement effect. Chaudhary 7 found that addition of nanoclay enhanced the mechanical properties and the isotropy of the starch nanocomposites strength. Incorporation of multiwalled carbon nanotubes into starch-based materials generally increased the mechanical properties and thermal stability and decreased the water sensitivity. 8 Huang et al. 9 prepared MMT-reinforced thermoplastic starch composites and revealed that the mechanical properties, thermal stability, and water-resistant properties of thermoplastic starch were greatly improved. Lara and Salcedo 10 evaluated gelatinization mechanisms of starch/MMT nanocomposites and the different intermolecular interactions between the constituents. Silica (SiO2) particle is useful for polymer materials because of their thermal stability, high surface energy, and unsaturated chemical bonds on the surface.11-13 SiO2 nanoparticle could improve the bonding capacity of renewable starch-based wood adhesive. 14 Tensile strength and Young’s modulus of the starch composite films were enhanced by adding SiO2. 15
When the gelatinized starch is stored at low temperature, it undergoes retrogradation process caused by the recrystallization of starch molecules. Retrogradation could be categorized as either short- or long-term retrogradation. 16 Short-term development of retrogradation or crystallization in starch gels is attributed to the crystallization of the amylose molecules of starch. 17 While the long-term changes occurring during the storage of starch has been related with the amylopectin fraction. 18
Although there have been a lot of studies on the starch composites, the effect of different filler size of fillers on the structures and properties of starch still needs further investigation, especially to understand the retrogradation behavior of starch composites. In addition, the hierarchical structures of starch are composed of granule structure (about 10–100 µm), growth ring structure (about 100 nm–10 µm), lamellar structure (about 9–100 nm), double helix structure (<9 nm), SiO2 particle size would have different effect on the hierarchical structure of starch. Therefore, in this article, the chosen particle size of SiO2 is 23 µm, 200 nm, and 20 nm, which is equivalent to starch granule, round structure, and layer structure in the size. The effect of different particle size (20 nm, 200 nm, and 23 µm) of SiO2 on the plasticizing property, mechanical properties, retrogradation behavior, thermal properties, water absorption, light transmittance, morphology, and structures of thermoplastic cassava starch (TPS)/SiO2 composites were investigated. The retrogradation behavior was analyzed using differential scanning calorimetry (DSC). The effects of different SiO2 particles on the morphology and crystalline, groups, and the dispersion of TPS were characterized by scanning electron microscopy (SEM), X-ray diffraction (XRD), polarized light microscopy (PLM), and Fourier transform infrared spectroscopy (FTIR). The relationships between properties and structures of TPS/SiO2 composites were analyzed, and the hierarchy structure model of TPS/SiO2 composites was established.
Experimental
Materials
Cassava starch (amylose 17.2 wt% and moisture content 13.0 wt%) was purchased from Guangxi State Farms Mingyang Biochemical Company (Nanning, Guangxi, China). The glycerol (analytical reagent) was purchased from Chinasun Specialty Products Co., Ltd (Jiangsu, China). Nano-SiO2 (TSP-H10) with particle size of 20 nm was procured from Nanjing Tansail Advanced Materials Co., Ltd (Nanjing, China). SiO2 with the average particle size of 200 nm was procured from Shengzhen Jingcai Chemical Co., Ltd (China). Micro-SiO2 (HT299-1) with particle size of 23 µm was procured from Shandong Haihua Group Co., Ltd (Weifang, China).
Samples preparation
The weight ratio of cassava starch, glycerol as plasticizer, and SiO2 was 100/40/5. The samples containing 20 nm, 200 nm, and 23 µm SiO2 were named as TPS-1, TPS-2, and TPS-3, respectively. Then, they were preliminarily mixed in a high-speed mixer (Tianjin Test Instrument Co., Ltd, China). Then, the mixtures were stored in sealed plastic bags at room temperature for 24 h. The samples were prepared by melting mixing in a rheometer (RM-200A, Harbin Hapro Electric Technology Co., Ltd, China) at 140°C for 6 min and 45 r/min; 220 × 220 × 2 mm3 plate and 220 mm × 220 mm × 200 µm film were prepared using compression molding instrument (XLB-D-400*400) at 160°C at 14 MPa pressure for 15 min.
Characterization
Plasticizing property of the samples
The melting mixing of TPS/SiO2 composites was carried out by a torque rheometer (RM-200A, Harbin Hapro Electric Technology Co., Ltd, China) at 140°C for 6 min and 45 r/min, and the plasticizing time and torque were determined.
Mechanical properties of the samples
The tensile property was tested by a universal testing machine (AGS-X, SHIMADZU) according to GB/T1040-2006. All samples were dumbbell-shaped specimens with the dimensions of 115 × 6 × 2 mm3. The tensile speed was 50 mm/min at 25°C temperature, and the stress–strain curves and data of samples were recorded. The average values of tensile strength were calculated after each composition at least five specimens test.
Izod impact strength of samples with the dimensions of 80 × 10 × 2 mm3 was characterized using Electronic Impact Testing machine (XJUD-5.5, Chengde Jinjian Testing Instrument Co., Ltd, China) at 25°C test temperature according to GB/T 16420-2006. The average values were calculated after each composition at least five specimens.
DSC of the samples
The peak temperature (Tp) and retrogradation enthalpy (ΔH) were obtained using DSC (Q 20, TA Instruments, New Castle, Delaware State, USA). About 5 mg sample was heated from 40°C to 170°C at 10°C/min under ultra-pure nitrogen atmosphere, and let the sample keep the gelatinized state. Then, the gelatinized samples were cooled and stored for different times at 15°C temperature and 65% relative humidity. The samples were again heated from 40°C to 170°C at 10°C/min under ultra-pure nitrogen atmosphere, and the retrogradation enthalpies and temperature were determined.
Thermal analysis of the samples
The thermal decomposition of TPS/SiO2 composites was characterized using a thermogravimetric (TG) analyzer (Discovery, TA Instruments). A sample about 7 mg was heated from 40 C to 700°C at 20°C/min under the ultra-pure nitrogen with 25 mL/min flow rate.
Water absorption of the samples
Water absorption experiment was carried out according to GB/T 1034-2008. The samples with the dimensions of 30 × 25 × 2 mm3 were cut and put in a condition with 25°C temperature and 50% relative humidity for 24 h. Then, the sample was taken out and weighed as W1, after it was dried in an oven at a temperature 105°C for 3 h, and weighed as W2. Water absorption of the sample could be calculated according to equation (1):

where W1 and W2 were the weight of the sample before and after drying.
Light transmittance of the samples
A piece of film sample with the size of 30 mm × 30 mm × 200 µm was tested by the Photoelectric Fog Instrument (WGW, Shanghai Optical Instrument Factory, China) at 25°C according to GB/T 2410-2008. The light transmittance of the sample could be obtained using equation (2):

where
SEM analysis of the samples
The samples were fractured in liquid nitrogen, and the fracture surfaces of samples were coated with gold. The fracture morphology and dispersion of SiO2 were characterized by scanning electron microscope (EVO18, Carl ZEISS, Oberkochen, Germany) at a magnification of 1000×.
PLM of the samples
A piece of film sample with the size of 10 mm × 10 mm × 200 µm was cut and transferred on to a glass slide and a coverslip was placed on top of the slide. A polarized light microscope (59XC-PC, Shanghai Optical Instrument Factory, China) was used to observe the pattern of the spherulites.
XRD of the samples
The diffractograms of samples were obtained by an XRD (D8 Advance, BRUKER, Germany) operating at 25°C with 40 kV and 25 mA. The scanning diffraction angle (2θ) was changed from 5° to 40° at a step size of 0.02°. The interplanar spacing and crystal size was calculated using the following equations:


where L is the crystal size; k is the diffraction coefficient, 0.89;
FTIR of the samples
The changes of groups of samples were characterized using an FTIR spectrometer (IS10, Thermo Scientific, Waltham, MA, USA) with the range from 500 cm−1 to 4500 cm−1 at 4 cm−1 resolution.
Results and discussions
Plasticizing property of the samples
The plasticizing curves of the TPS/SiO2 composites are shown in Figure 1, and the plasticizing time and torque are listed in Table 1. The plasticization of starch is related to the movement of starch molecules by the breaking of the hydrogen bonds. The plasticizing time is the time that the starch molecules began plastic flow after the hydrogen bonds of the starch molecules are broken. Thus, the plasticizing time could reflect the rate of the plasticizing process of the materials. The plasticizing torque refers to the state of the materials after the completion of plasticization, and it also reflects the changes in the viscosity and structure of materials.
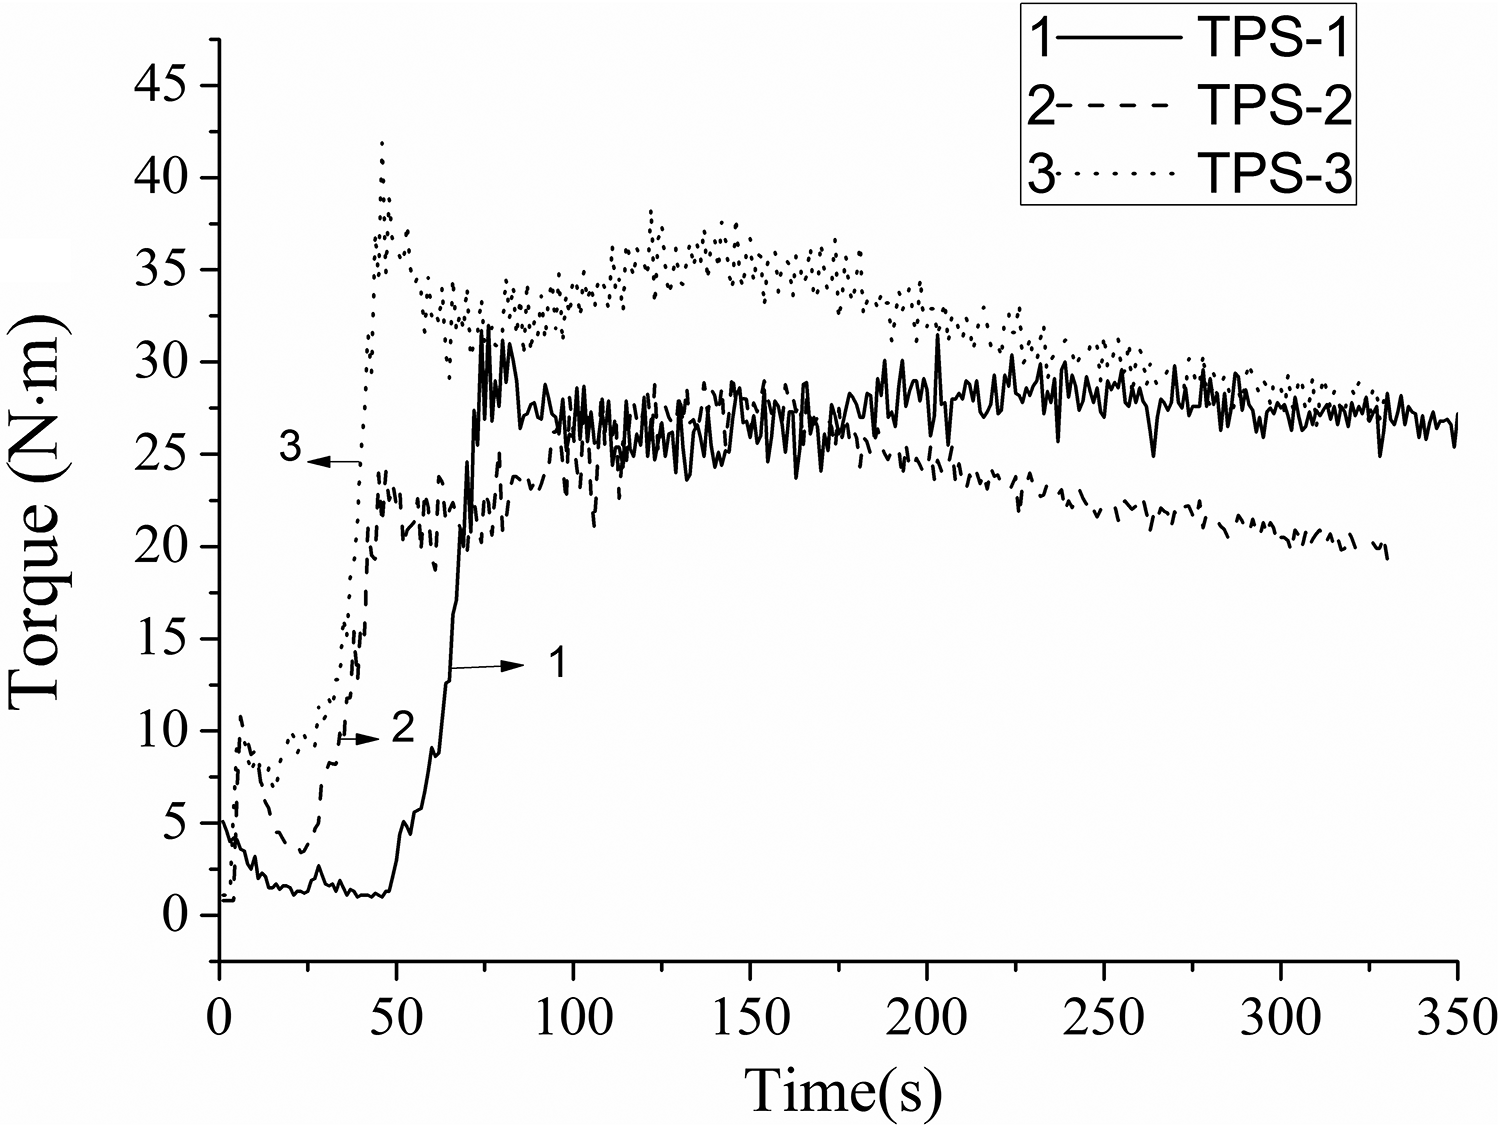
Plasticizing curves of the TPS/SiO2 composites.
Plasticizing data of TPS/SiO2 composites in mixing processing.
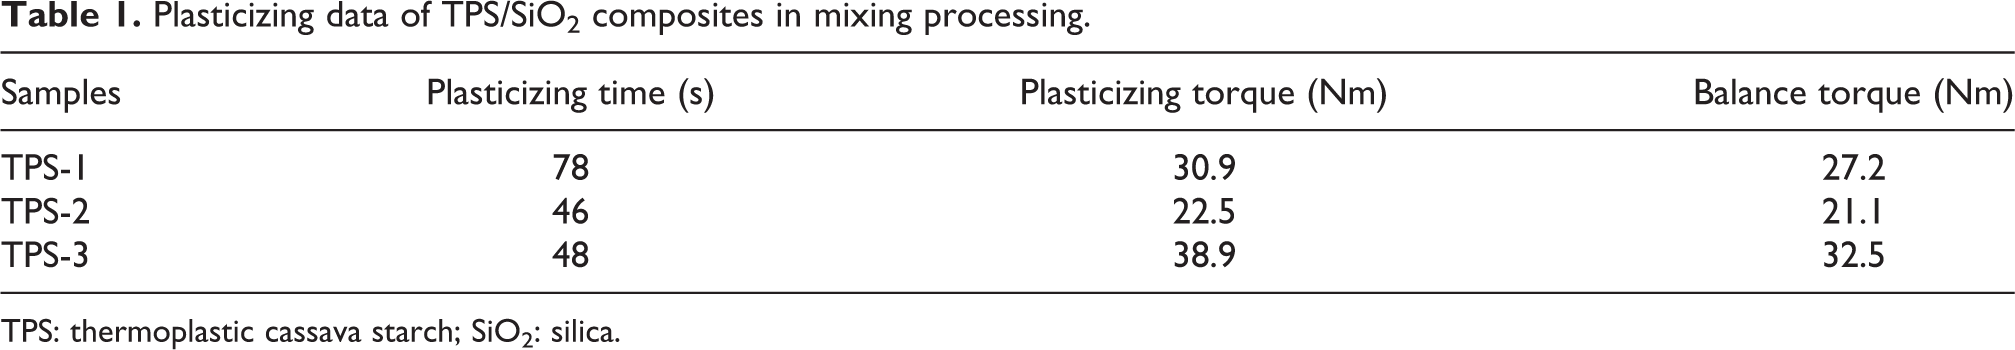
TPS: thermoplastic cassava starch; SiO2: silica.
As shown in Figure 1, TPS-2 composite had the lowest plasticizing time and torques. The starch molecules have large number of hydroxyl groups, and the hydrogen bonds could easily form in the intermolecules and intramolecules, leading to the decrease of movement of starch molecules. The hydrogen bonds of the starch molecules were disrupted in the presence of SiO2 particles. This would result in the increases of free volume and the movement ability of the starch molecules, 19 which promoted plasticization of the starch. In addition, the plasticization of starch was greatly affected by the particle size of SiO2. Because the particle size of micro-SiO2 is larger than that of nano-SiO2, and the friction force on the surface of the processing engineering is largest. The 20 nm SiO2 particle with larger specific surface area would easily aggregate in the starch, reducing the reaction probability between the starch molecules and SiO2 particle. The 200 nm SiO2 particle could be uniformly dispersed in the matrix, and this was beneficial to the reaction between hydroxyl groups of the starch and SiO2. The intermolecular and intramolecular hydrogen bonds of the starch molecules were easily disrupted, and promoted the motion of the starch molecules, which would be beneficial to the plasticization of starch, leading to the decrease of plasticizing time and torques of starch.
Mechanical properties of the samples
The stress–strain curves of TPS/SiO2 composites are shown in Figure 2. Stress of TPS/SiO2 composite increased continuously with strain without yield until the high elongation at break, indicating the plastic behavior. The tensile strength and strain of TPS-2 composite were higher than those of TPS-1 and TPS-3 composites. The tensile and impact strength of TPS/SiO2 composites are indicated in Figure 3. The reaction between SiO2 and starch molecules could form more stable structures, which would be beneficial to the improvement of the mechanical properties of the TPS/SiO2 composites. The mechanical properties of TPS/SiO2 composites were confirmed from the analyses of the plasticizing curves. This was because the dispersion of nanoparticles in the matrix played an important role in the mechanical properties of composites, which were closely related to the size of nanoparticles. The 200 nm SiO2 particle could be uniformly dispersed in the matrix, and this was beneficial to the improvement of the tensile properties of samples. However, the aggregation of 20 nm SiO2 particle would likely cause the nonuniform dispersion in the TPS materials, which resulted in a decrease of the mechanical properties.

Stress–strain curves of TPS/SiO2 composite.
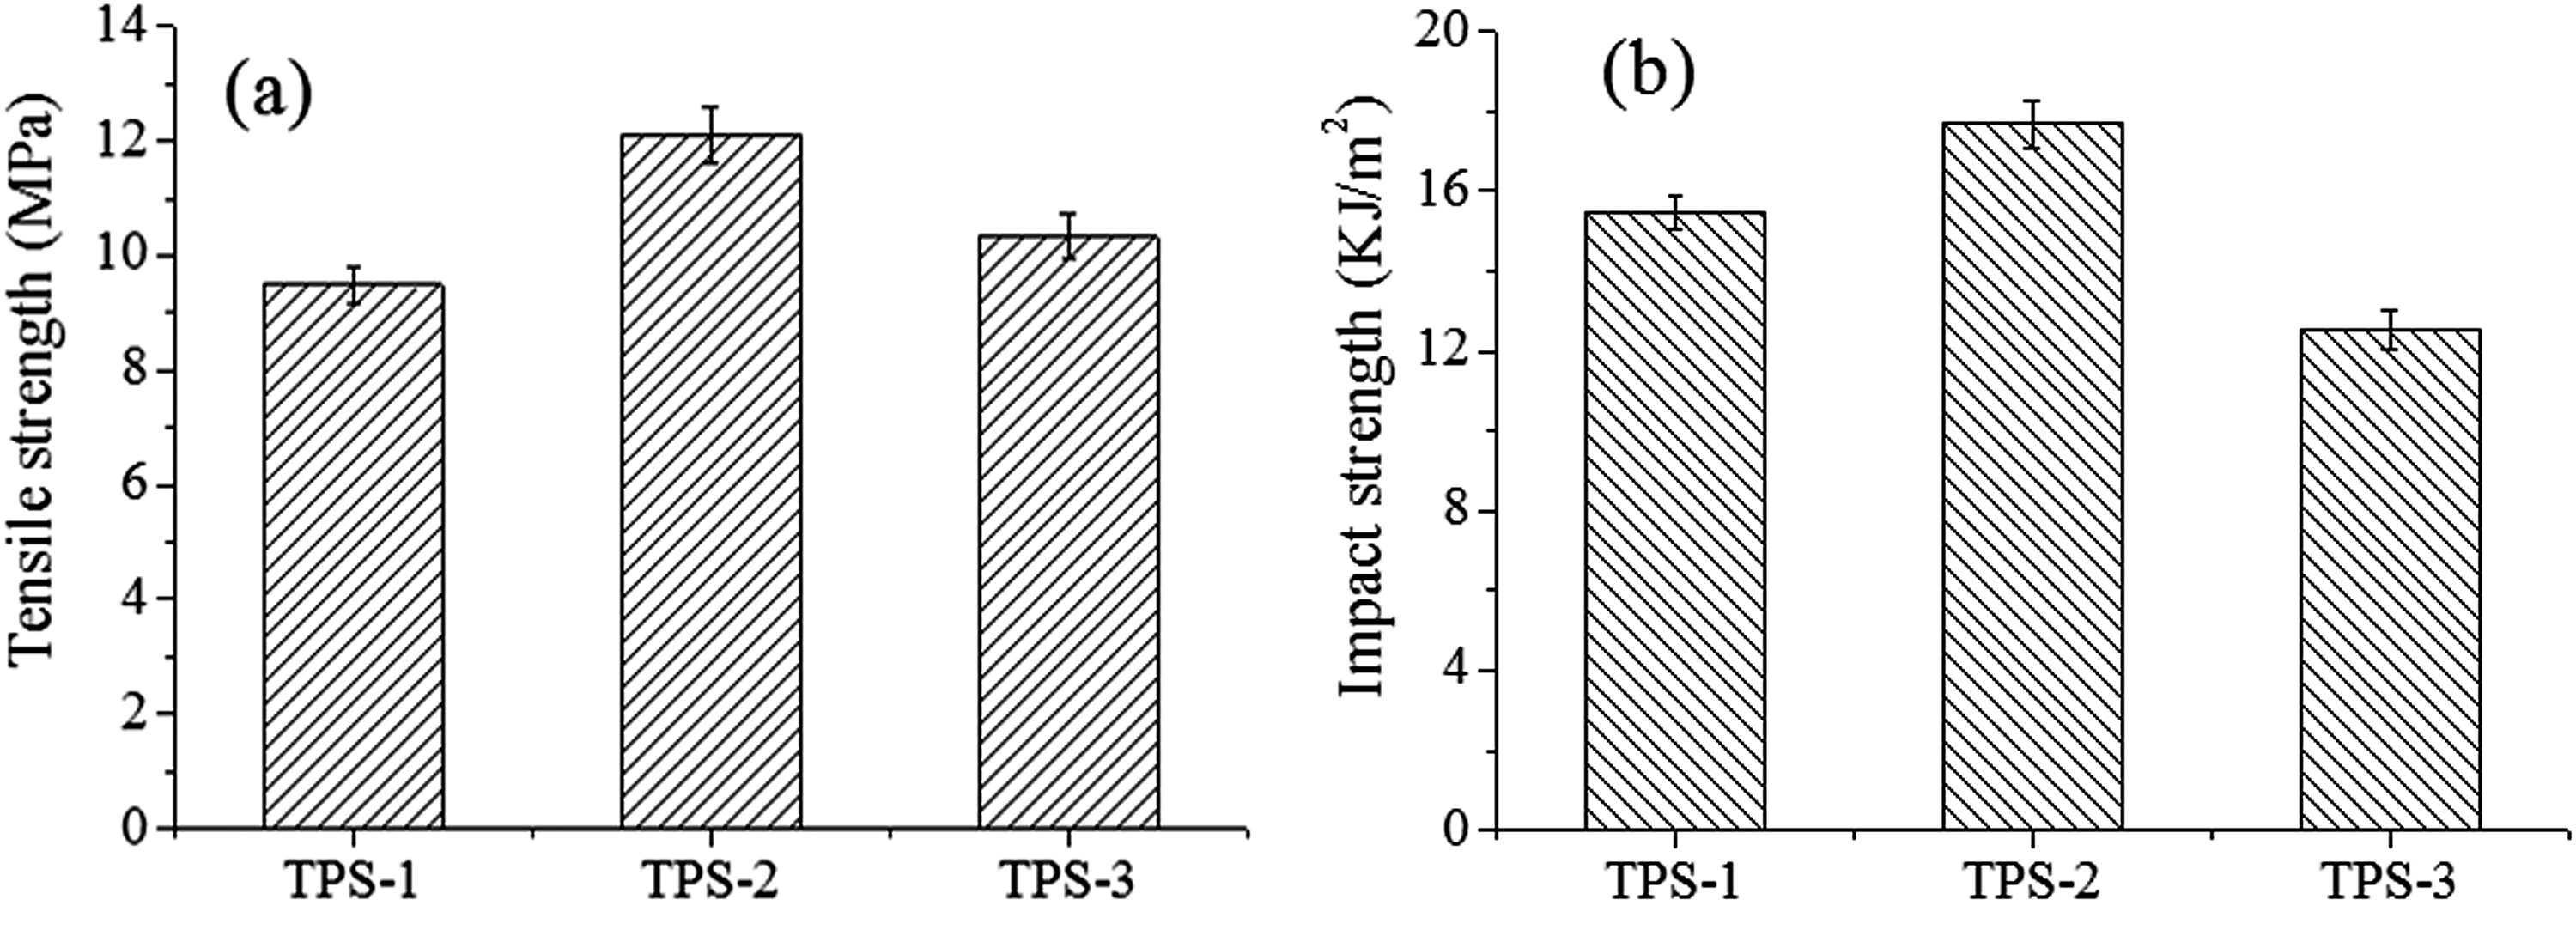
Mechanical properties of TPS/SiO2 composites: (a) tensile strength and (b) impact strength.
The effect of fillers on the properties of composites strongly depends on two main factors: homogeneous dispersion of fillers and interfacial adhesion between the phases.20,21 Particle size has an obvious effect on the mechanical properties of polymer composites. Smaller calcium carbonate particles provide higher strength of filled polypropylene composites at a given particle loading. 22 Sumita et al. 23 underlined the interest of replacing microscale SiO2 by its nanoscale counterpart, since nanoscale SiO2 particles possess superior mechanical properties. These nanoparticles give higher rigidity and superior yield strength to the polymers. Smaller particle size yields higher fracture toughness for calcium carbonate-filled high-density polyethylene. 24
DSC analysis of the samples
DSC melting curves of TPS/SiO2 composites after different retrogradation time are indicated in Figure 4. The retrogradation enthalpy (
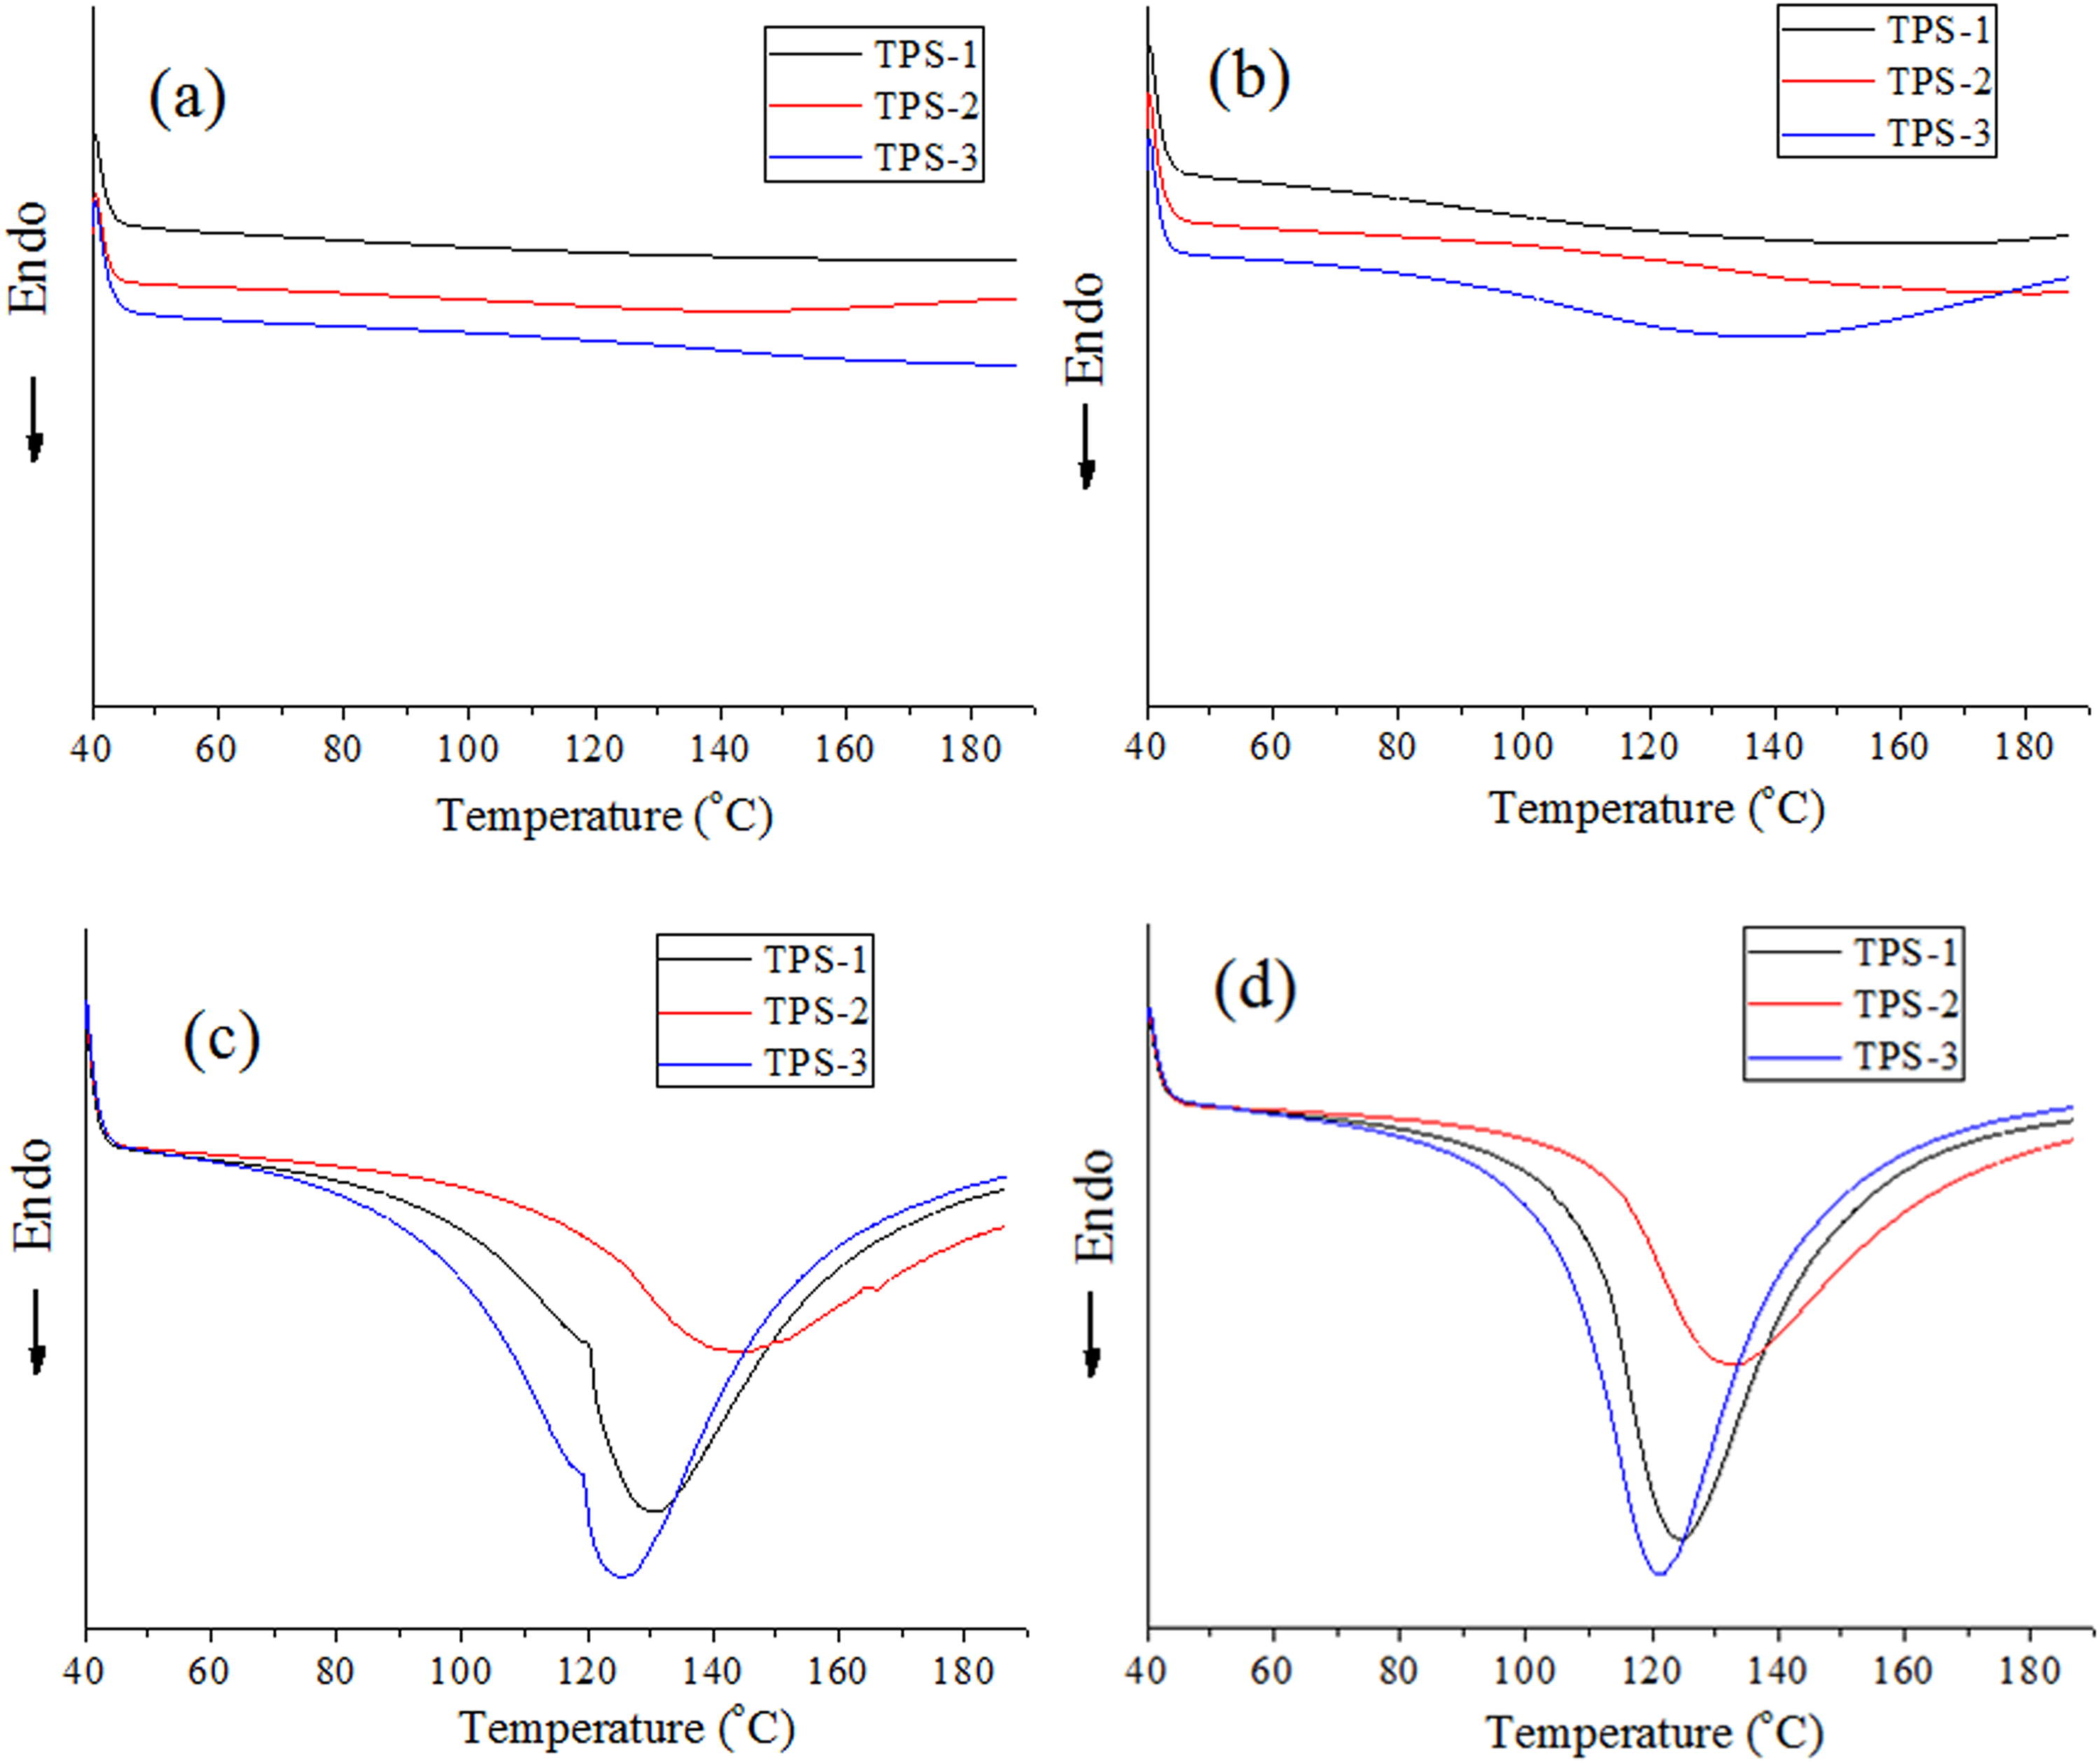
DSC melting curves of TPS/SiO2 composites after different retrogradation time: (a) 5 h, (b) 14 h, (c) 3 days, and (d) 7 days.
Retrogradation enthalpy (

TPS: thermoplastic cassava starch; SiO2: silica.
Thermal analysis of the samples
The thermal decomposition of TPS/SiO2 composites was characterized through TG analysis to analyze its thermal stability. TG curves of TPS/SiO2 composites are shown in Figure 5, and thermal decomposition data are summarized in Table 3. The thermal decomposition of TPS/SiO2 composites included three stages. 27 The mass loss in the first stage was the evaporation of water or volatiles. It is shown in Table 3 that Td in first stage of TPS-2 composite was higher than those of TPS-1 and TPS-3 composites. The second stage was related to the volatilization of glycerol. The glycerol as plasticizer could react with the starch molecules, and this stage was the volatilization of the residual glycerol. From TG and DTG thermal data, there was a decrease of TPS-2 composite in the volatilization of glycerol, because the most of glycerol could happen the plasticizing reaction with the starch molecules. The third stage showed the highest thermal decomposition peak, which was attributed to the decomposition of starch. 28
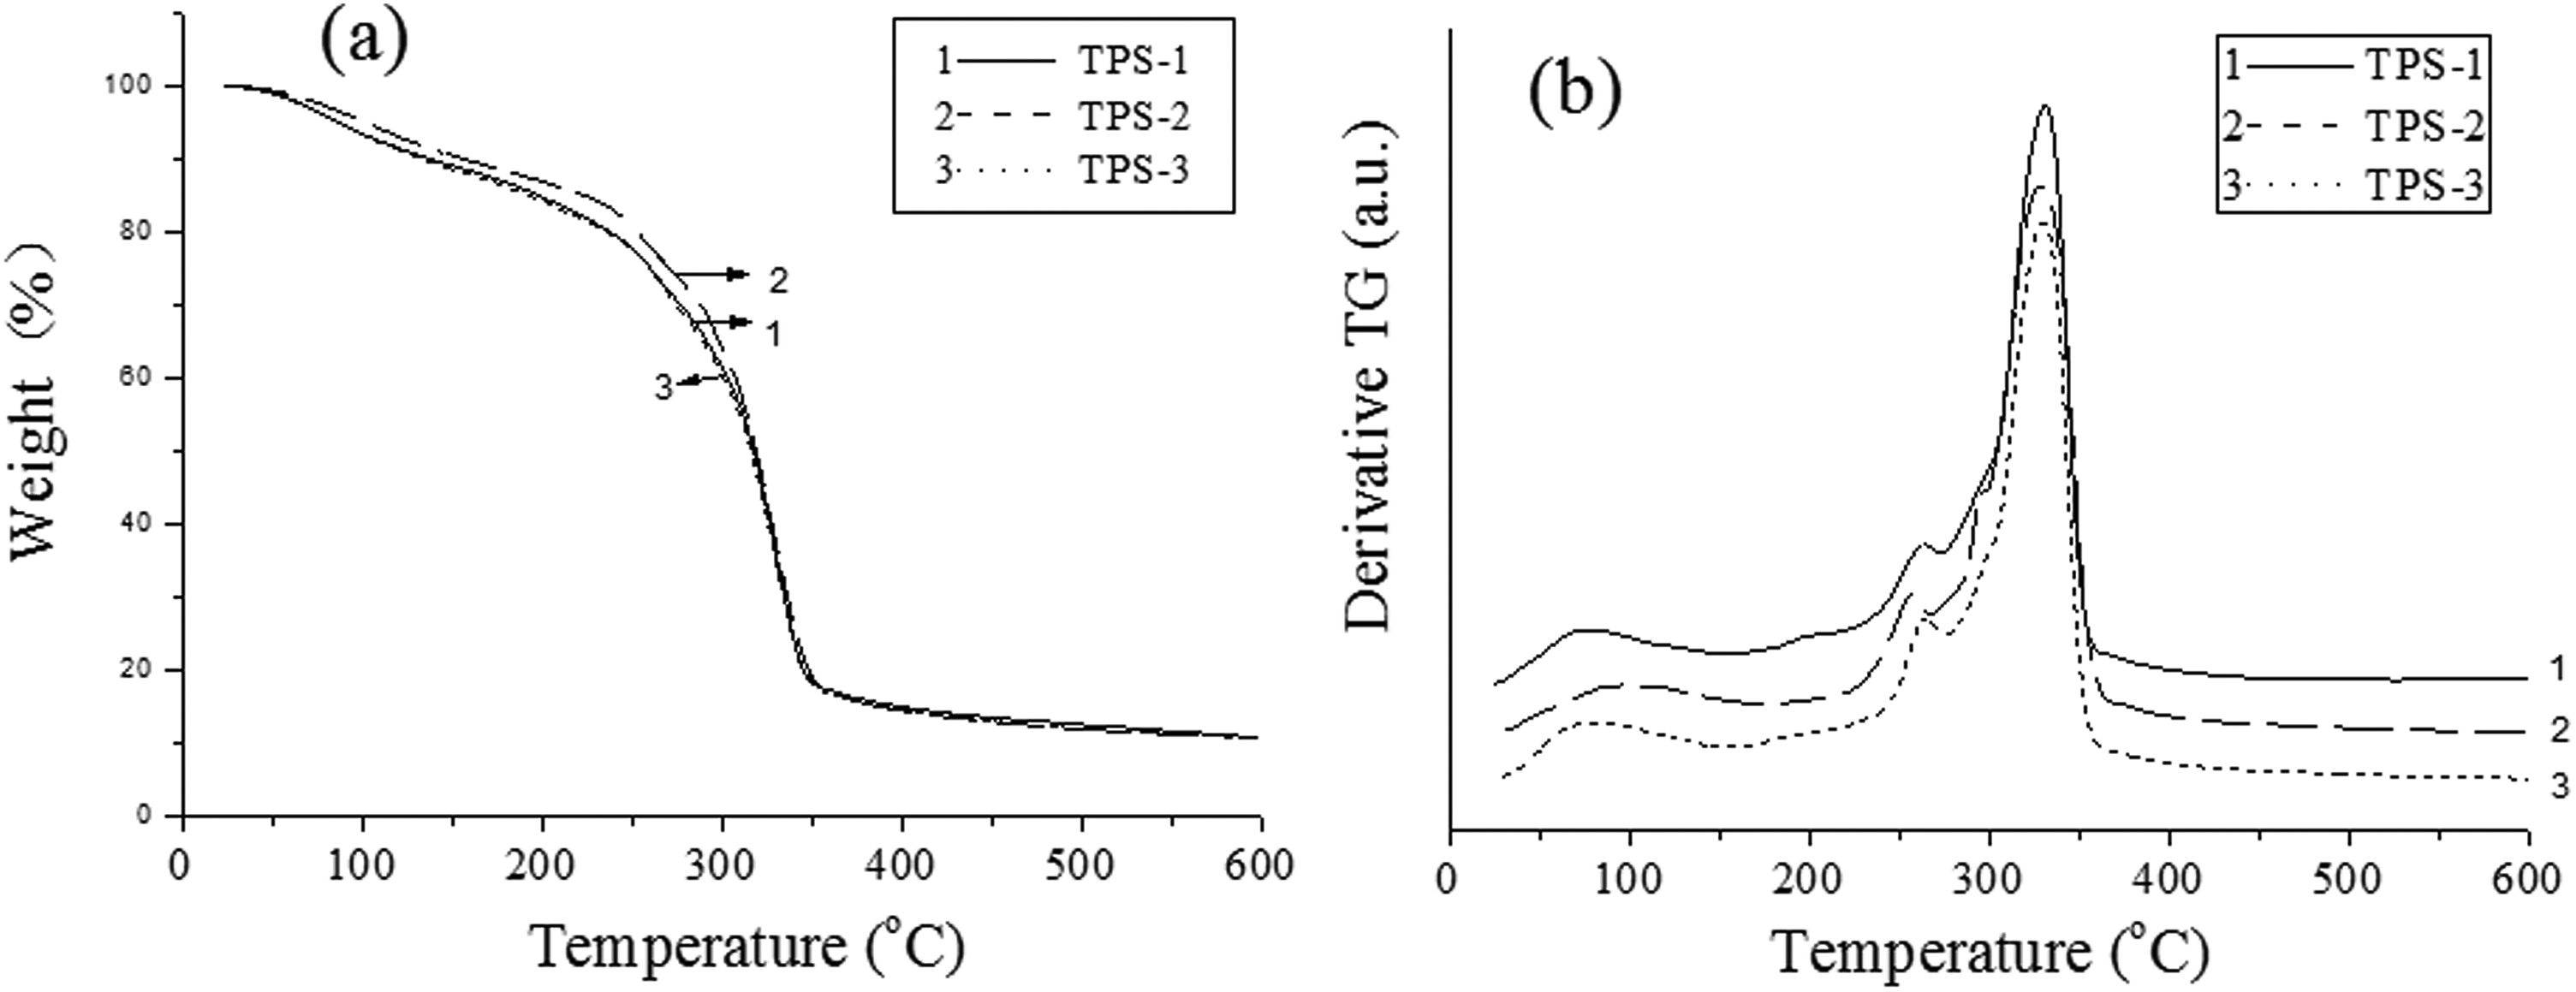
Thermal decomposition curves of the TPS/SiO2 composites: (a) TG and (b) DTG.
Thermal decomposition data of TPS/SiO2 composites.

TPS: thermoplastic cassava starch; SiO2: silica.
Furthermore, the other thermal decomposition temperatures of the TPS-2 composite, such as the denotative initial decomposition temperature (Tid), the temperatures at 5% and 50% loss, and the denotative terminated decomposition temperature (Ttd) had the highest values. In our previous studies, we also observed that the addition of SiO2 had a great increasing effect on Td values of the TPS blends materials. 29 The presence of inorganic fillers is beneficial to the improvement of the thermal stability of polymers. Td values are mainly related to the kinds of inorganic particles and the structure of polymer composites. The reaction between SiO2 and the starch molecules could promote the formation of more stable structures, which would be beneficial to the improvement of thermal decomposition temperature. The more stable the structure was, the more energy would be needed to destroy the structure. TPS-2 composite had more stable structure comparing with TPS-1 and TPS-3 composites. It is noted that the stable structure of polymer composite was related to the dispersion of SiO2 and the interface adhesion. If the particle could uniformly disperse in the matrix, the probability of the hydrogen bond reaction between 200 nm SiO2 and TPS molecules would be greater. In addition, the uniform dispersion of SiO2 could better play the role of inorganic particles to improve thermal performance.
Water absorption of the samples
Water absorption curves of TPS/SiO2 composites are indicated in Figure 6. The water absorptions of TPS-1, TPS-2, and TPS-3 composites were 27.3%, 23.6%, and 31.1%, respectively. The water absorption of starch materials was related to the hydroxyl group. The uniform dispersion of 200 nm SiO2 particle in the starch matrix would make more hydrogen bonding reaction between SiO2 particle, glycerol, and starch molecule. Therefore, the reduction of hydroxyl group might be beneficial to the improvement of water resistance of TPS/SiO2 composites.
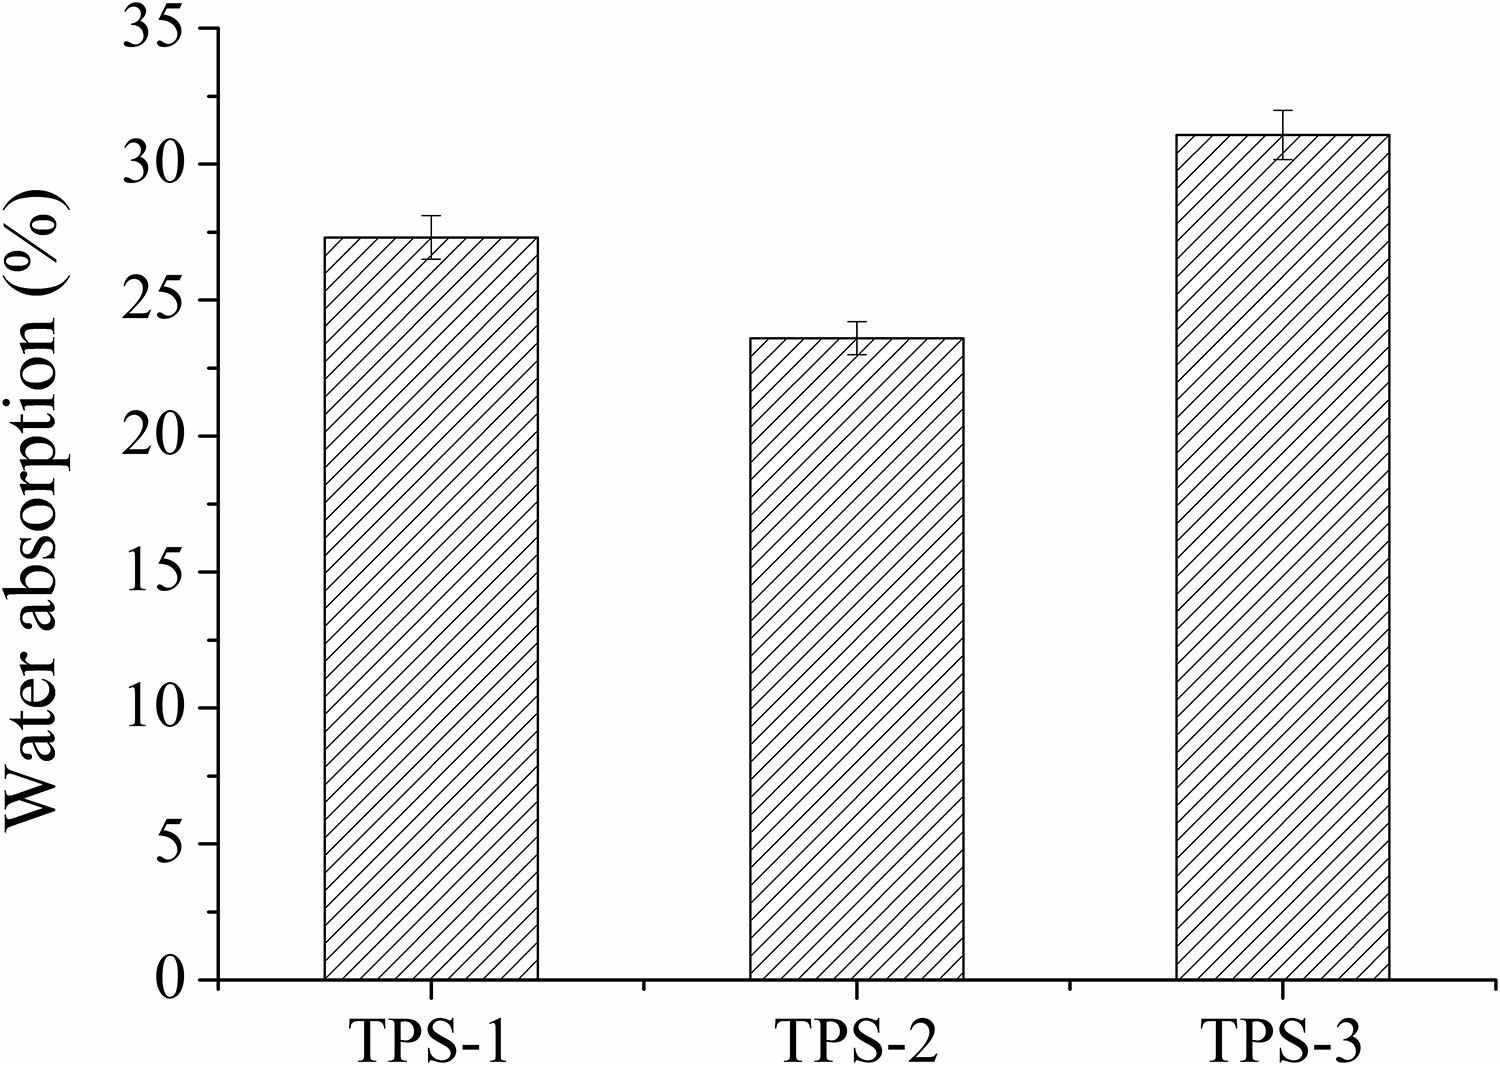
Water absorption of TPS/SiO2 composites.
Light transmittance of the samples
From the light transmittance of TPS/SiO2 composites in Figure 7, the light transmittance of TPS-2 composite was higher than those of TPS-1 and TPS-3 composites. The transmittance of the sample is related to the dispersion of SiO2 and the size of crystal. The uniform and fine crystal were favorable for the improvement of light transmittance of samples. 30 From the previous DSC analysis, it was known that TPS-2 composite had the lowest retrogradation, suggesting low degree of crystallinity. In addition, 200 nm SiO2 could be homogeneously dispersed in the starch matrix, which was favorable to the improvement of light transmittance

Light transmittance of TPS/SiO2 composites.
SEM analysis of the samples
Figure 8 presents the SEM images of TPS/SiO2 composites. In Figure 8(a), some of 20 nm SiO2 particles greatly aggregated in the cassava starch. The interface between SiO2 particle and the matrix was not good and SiO2 particle easily exposed in the sample has fractured section. In Figure 8(b), 200 nm SiO2 particle was uniformly and finely dispersed in the starch matrix. The granules of starch were not noticeably visible, indicating the starch was well plasticized. In addition, it was also found that the good interfacial adhesion between the SiO2 particle and the starch matrix. From Figure 8(c), the granules of starch were noticeably appeared in the fracture surface of TPS/SiO2 composite, suggesting the poor plasticization of the starch. This was in conformity with the results of plasticization, mechanical, and thermal properties as discussed earlier.

SEM images of TPS/SiO2 composites (×1000): (a) TPS-1, (b) TPS-2, and (c) TPS-3.
PLM of the samples
PLM images of TPS/SiO2 composites are displayed in Figure 9. The samples presented a Maltese cross under a polarized microscope, indicating the formation of spherulites. Spherulites are semi-crystalline entities with some degree of radial symmetry, displaying birefringence. 31 Spherulites of starch usually form after heating at high temperature and then cool at low temperature, especially in the presence of some impurity or complexing agent. 32 In Figure 9(a), the Maltese cross pattern of TPS-1 sample was clearest, and the number of spherulites was largest. The spherulites size of TPS-2 sample was more uniform in Figure 9(b). It was also observed from Figure 9(c) that there was clear Maltese cross pattern in TPS-3 sample, but the dispersion and size of spherulites were not uniform. The 200 nm SiO2 particle uniformly dispersed in the matrix, and the spherulites were well distributed. The good dispersion of 200 nm SiO2 in starch materials was more likely to promote the reaction between the starch molecules and SiO2; this would decrease the motion of starch molecules, which would inhibit the retrogradation of starch. During the retrogradation process, the ordered structures of starch composites are reconstructed, such as the formation of granules and the double helix structure through hydrogen bonds. 3 The nucleation and subsequent growth are two growth stages that affect the final morphology of nanomaterials. These phenomena are well described by the nucleation theory 33 and the Lifshitz–Slyozov–Wagner growth model, respectively.34,35

PLM patterns of TPS/SiO2 composites (×600): (a) TPS-1, (b) TPS-2, and (c) TPS-3.
XRD analysis of the samples
XRD curves of TPS/SiO2 composites are indicated in Figure 10. A, B, C, and V types crystalline structures of starch can be distinguished by XRD. The A-type structure is described as a compact monoclinic envelope, 36 while the B-type structure is described as a hexagonal unit cell. The C-type is an intermediate structure between A-type and B-type, 37 which was observed in legumes. The V-type is single helices of amylose crystallization, 38 including VH and VA structures according to the hydration or dehydration. 39 The typical A-type displayed the reflection intensities of XRD in the 2θ peak at 18°, and the peak at 20° is attributed to V-type crystalline structure. The evolution of crystalline structure is related to the water content of the sample and the storage temperature. 40 The co-existence of 18° and 20° indicates a mixture of A + V types of crystalline structures. 41 It was found that the native cassava starch displayed a typical A-type pattern.42,43 After the addition of SiO2, the hydrogen bonds formed between SiO2 and starch, glycerol and starch, leading to the decrease in the motion of starch molecules. TPS/SiO2 composites indicated the mixture of A + V types crystalline structure.

XRD curves of TPS/SiO2 composites.
The crystal size and interplanar spacing were calculated according to the strongest peak and listed in Table 4. The crystal size of TPS-3 was larger than those of TPS-1 and TPS-2. Because the 20 nm SiO2 with larger the specific surface area would easily aggregate in the starch, reducing the reaction probability between the starch molecules and SiO2 particle. The 200 nm SiO2 particle could be uniformly dispersed in the matrix, and this was beneficial to the reaction between the starch molecules and SiO2, leading to the decrease of retrogradation of starch. The 23 µm SiO2 particle is equivalent to the starch granule scale. The dispersion of 23 µm SiO2 is concentrated in starch matrix comparing with those of 200 nm and 20 nm SiO2 under the condition of same SiO2 weight. There is a relatively small chance of reaction between starch molecular chain and SiO2, therefore the movement of starch molecular chain is flexible and free moving to form the regular structures, resulting in the increase of crystallization, which was consistent with the DSC results.
XRD data of TPS/SiO2 composite.
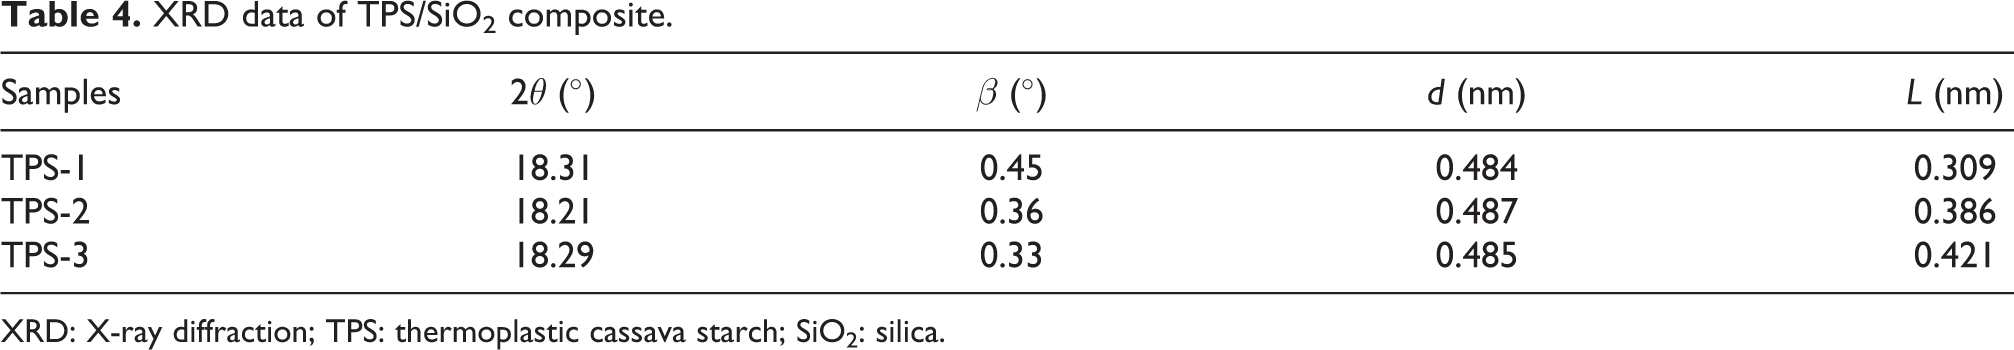
XRD: X-ray diffraction; TPS: thermoplastic cassava starch; SiO2: silica.
FTIR of the samples
Figure 11 shows the FTIR spectra of TPS/SiO2 composites. The peak around 3300 cm−1 is corresponding to stretching vibration of OH group. It was reported that OH group more easily vibrate and form more hydrogen bonds is prone to present a wider and less intense band. 44 The peak at 2900 cm−1 attributing to C–H stretching of TPS-2 was the strongest, indicating the most stable structure. The peak at 2516 cm−1 was related to the combination bond from water. The gradual disappearance of the peak at 2516 cm−1 indicated the decrease of the combination bond from water. The coexistence of peaks at 1640 and 1460 cm−1 was related to water adsorbed in the amorphous regions of starch. The increased intensity of the peak at 1640 cm−1 of TPS-2 sample indicated the amorphous area was enhanced, which means that the crystalline area was reduced. The peak of 1022 cm−1 was assigned to the amorphous phase environment. The peak of 870 cm−1 was attributed to the CH2 deformation.
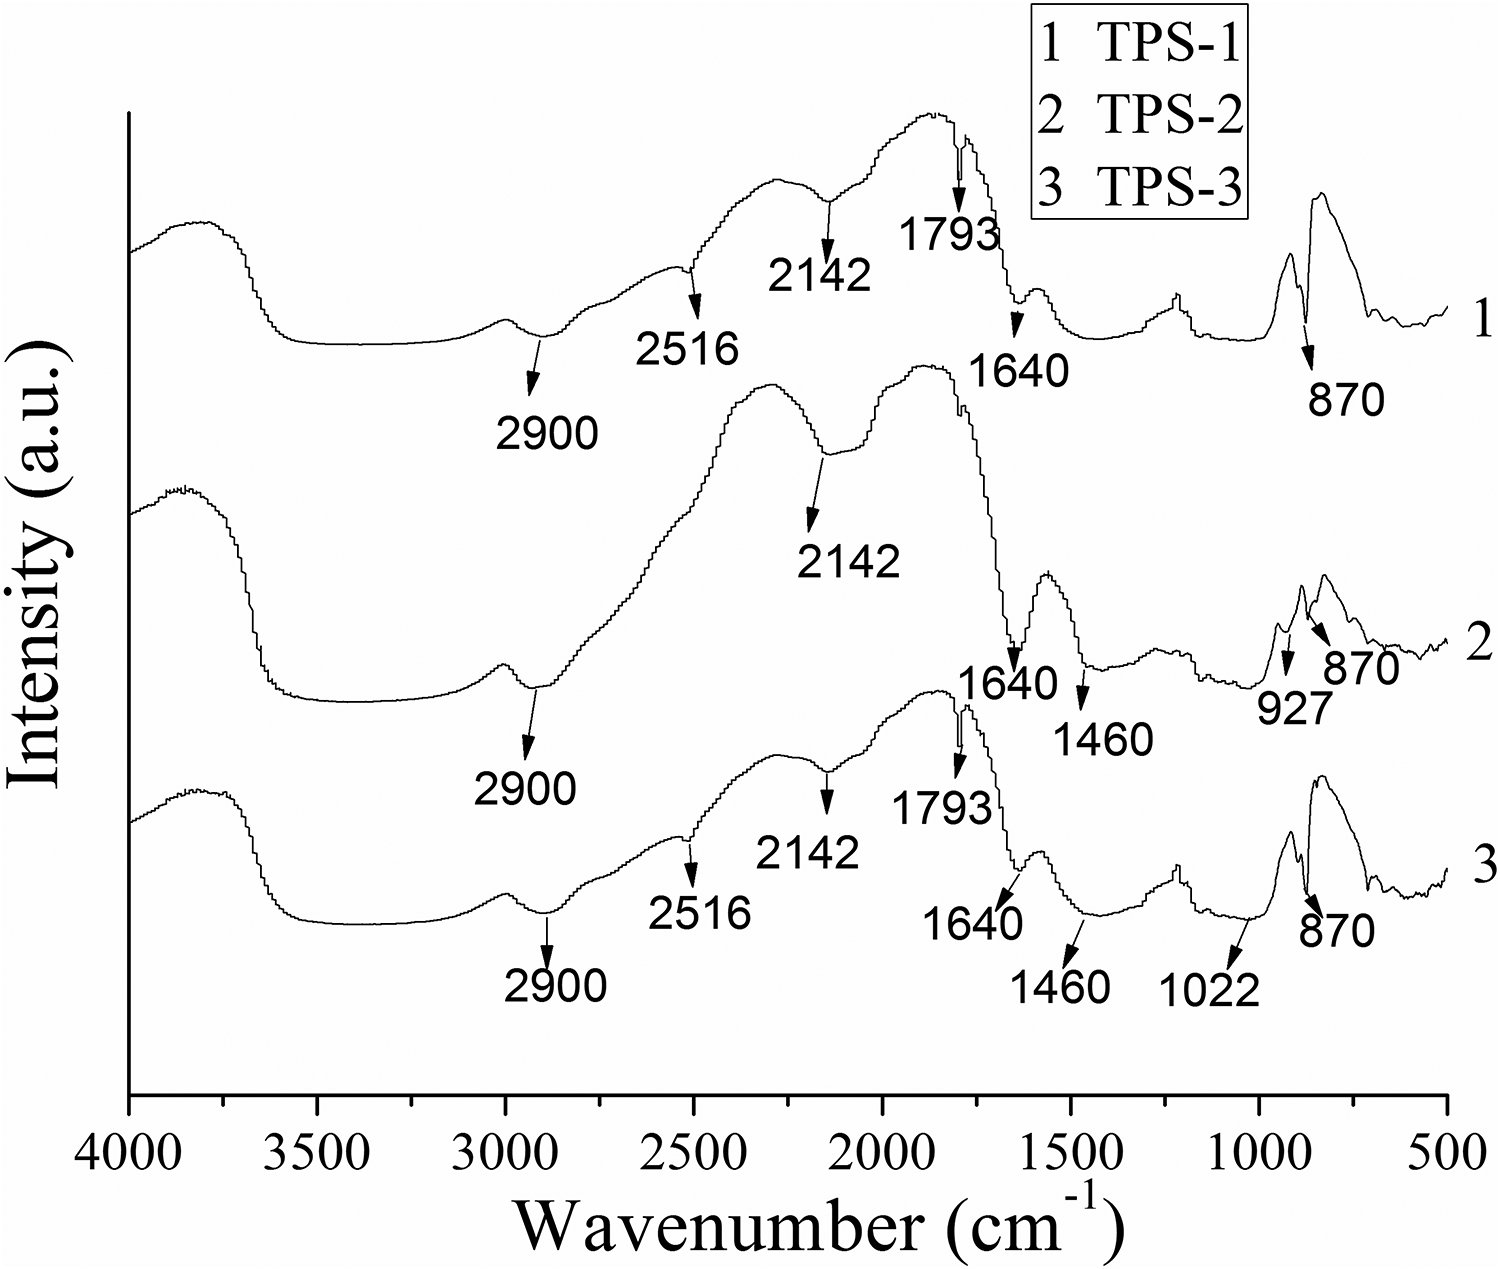
FTIR spectra of TPS/SiO2 composites.
The schematic diagram of the structure changes of TPS/SiO2 composites during retrogradation process is demonstrated in Figure 12. Retrogradation is a recrystallization process in which amylose and amylopectin molecules could rearrange and form the ordered structures.45-47 When the starch materials were heated up to the gelatinized temperature, it became gelatinized state, and the hydrogen bond of starch molecules was broken (Figure 12(a)). If the gelatinized starch was cooled, the amylose molecules of starch began to regularly arrange and formed the crystalline structure during a short-term retrogradation stage (Figure 12(b)). With the further increase of retrogradation time, the amylopectin molecules of starch gradually ordered together to form crystal through double helix structure under the action of hydrogen bonds (Figure 12(c)). The hierarchical structure starch is composed of granule structure (about 10–100 µm), growth ring structure (about 100 nm–10 µm), lamellar structure (about 9–100 nm), and double helix structure (<9 nm). 42 After the addition of SiO2, there were reactions between the hydroxyl groups of TPS molecules and SiO2 particle, which would affect the structures of starch during retrogradation process (Figure 12(d)). On one hand, SiO2 particle could play heterogeneous nucleation effect to promote the retrogradation of starch. On the other hand, the hydroxyl groups reaction between the starch molecules and SiO2 particle would restrain the motion of starch molecules, resulting in the decrease of retrogradation of starch. The reaction probability of hydroxyl groups between the starch molecules and SiO2 particle might be related to the particle size and dispersion of SiO2. The large specific surface area of nanometer particle would easily aggregate and not well dispersed in the matrix materials. The 200 nm SiO2 particle could disperse uniformly, which would be beneficial to the reaction of hydroxyl groups between starch and SiO2. This would lead to the decrease of the motion of starch molecules and inhibit retrogradation of starch.

Schematic diagrams of TPS/SiO2 composites during retrogradation process: (a) gelatinization, (b) short-term retrogradation, (c) long-term retrogradation, and (d) reaction of TPS molecules and SiO2.
Conclusions
The plasticizing properties indicated TPS-2 composite had the shortest plasticizing time and the lowest plasticizing torque. The tensile and impact strength of TPS-2 composite was higher than those of TPS-1 and TPS-3 composites. As for the retrogradation properties, TPS-2 composite had the lowest
Footnotes
Declaration of conflicting interests
The author(s) declared no potential conflicts of interest with respect to the research, authorship, and/or publication of this article.
Funding
The author(s) disclosed receipt of the following financial support for the research, authorship, and/or publication of this article: This work was financially supported by the National Natural Science Foundation of China (grant no. 51663002) and the Guangxi Natural Science Foundation of China (grant no. 2017GXNSFAA198083).