
Abstract
The rising concern of environmental issues from the non-degradable conventional polymers is triggering the development of sustainable and renewable polymers. Thermoplastic starch (TPS) has been known to have huge potential to substitute conventional synthetic polymers. A thermoplastic starch was prepared using a non-food bitter cassava starch with isosorbide as plasticizer. To improve the dispersion and interfacial affinity of thermoplastic starch and boost the compatibility between starch and isosorbide, citric acid (CA) was used as an additive. The influence of citric acid to the TPS was then investigated. The result shows that citric acid improved tensile strength from 8.68 MPa to 11.98 MPa. The addition of citric acid at a concentration of 1 – 10 wt % can increase glass transition temperature (Tg) from 48.81°C to 63.89°C and storage modulus at 25°C from 1.20 GPa to 3.47 GPa. Two degradation temperatures (Td) were detected which are Td1onset value was decrease from 83.32°C down to 79.78°C while Td2onset value was decrease from 275.29°C down to 247.17°C and Td2max from 311.12°C to 295.06°C.
Introduction
Plastic packaging is an important necessity in food industry because it can prolong food’s shelf life and consequently ensure food safety and quality. 1 The common type of plastic for packaging is polyethylene (PE) and polypropylene (PP) which a non-degradable type of plastic. However, the massive use of non-degradable plastic packaging have harmful impacts to the environment such as the microplastic threat, air pollution, and wastewater contamination.2,3 In addition, plastic also threatening wildlife animal because they can mistakenly eat the plastic. Thus, it is necessary to find a suitable alternative to replace the current material with more sustainable and environmentally friendly.
Starch is a type of carbohydrate that shows promising substrate for development of biobased plastic because of the wide availability, low cost, and renewability. 4 However, nowadays there is a raising debate whether using a staple food such as cassava, corn, and potato as a source of plastic is ethical. Thus, using non-food polysaccharides source such as bitter cassava can be a solution. Based on relevant study 5 bitter cassava (Manihot glaziovii) contains higher starch content of 18 – 32% and hydrogen cyanide (HCN) above 69% than sweet cassava. This type of cassava is rarely used because of its bitter taste and has a high cyanide content (100 ppm). 6
Due to the intermolecular forces in its structure, starch cannot be processed using conventional plastics technologies to achieve plastic properties. Nevertheless, the addition of a plasticizer is to weaken the bonds existing in the starch's original structure 7 Many studies have used certain compounds as plasticizers such as polyols (xylitol, sorbitol, ethylene glycol, glycerol), urea, or amides (formamide).8,9 Isosorbide is a secondary cyclic alcohol composed of two adjacent tetrahydrofuran rings with two hydroxyl groups at positions 2 and 5. 10 Isosorbide is widely used as a monomer and is derived from cellulose or starch. 11 This plasticizer is biodegradable, less toxic, and thermally stable. 12 Isosorbide has a smaller hydroxyl group compared to glycerol and sorbitol (3 and 6 O-H, respectively). 10 TPS with plasticizers containing higher hydroxyl groups easily absorb water, so when mixed with starch, they will also produce products with high air sensitivity. 13 Battegazzore D. et al. Studied the effect the isosorbide as plasticizer on TPS in extrusion process. 14 The result shows that thermoplastic starch (TPS) is stable in temperature up to 200°C, humidity range of 25 – 75% and has relatively high Young’s modulus (55 MPa), but it has low tensile strength (1.13 MPa), and elongation at break (28%). Kizkitza G., et al prepared TPS with the combination of isosorbide and 1,3-propanediol as plasticizer with solution casting. The resulting TPS displays tensile strength of 2.7 MPa, Young’s modulus of 8.7 MPa, and elongation at break of 142.4%. 10
Citric acid (CA) has been used as an additive in thermoplastic starch to improve elongation at break dan water resistance. CA has been used as the chemical crosslinker to improve enhanced the compatibility in polymer blend. 15 In addition, CA has hydrophobic ester group that known to improve the barrier properties of starch film. 16 Combining starch with citric acid will form hydrogen bonds very strong and stable. 17 Shi R et al. were studied characterization of citric acid as additive in thermoplastic starch using melt blending method. 18 The addition of citric acid in starch and glycerol blend result shows a decreased in tensile strength from 38 MPa to 11 MPa with the addition of 4% of CA but increase elongation at break from 1.2% to 14.6%.
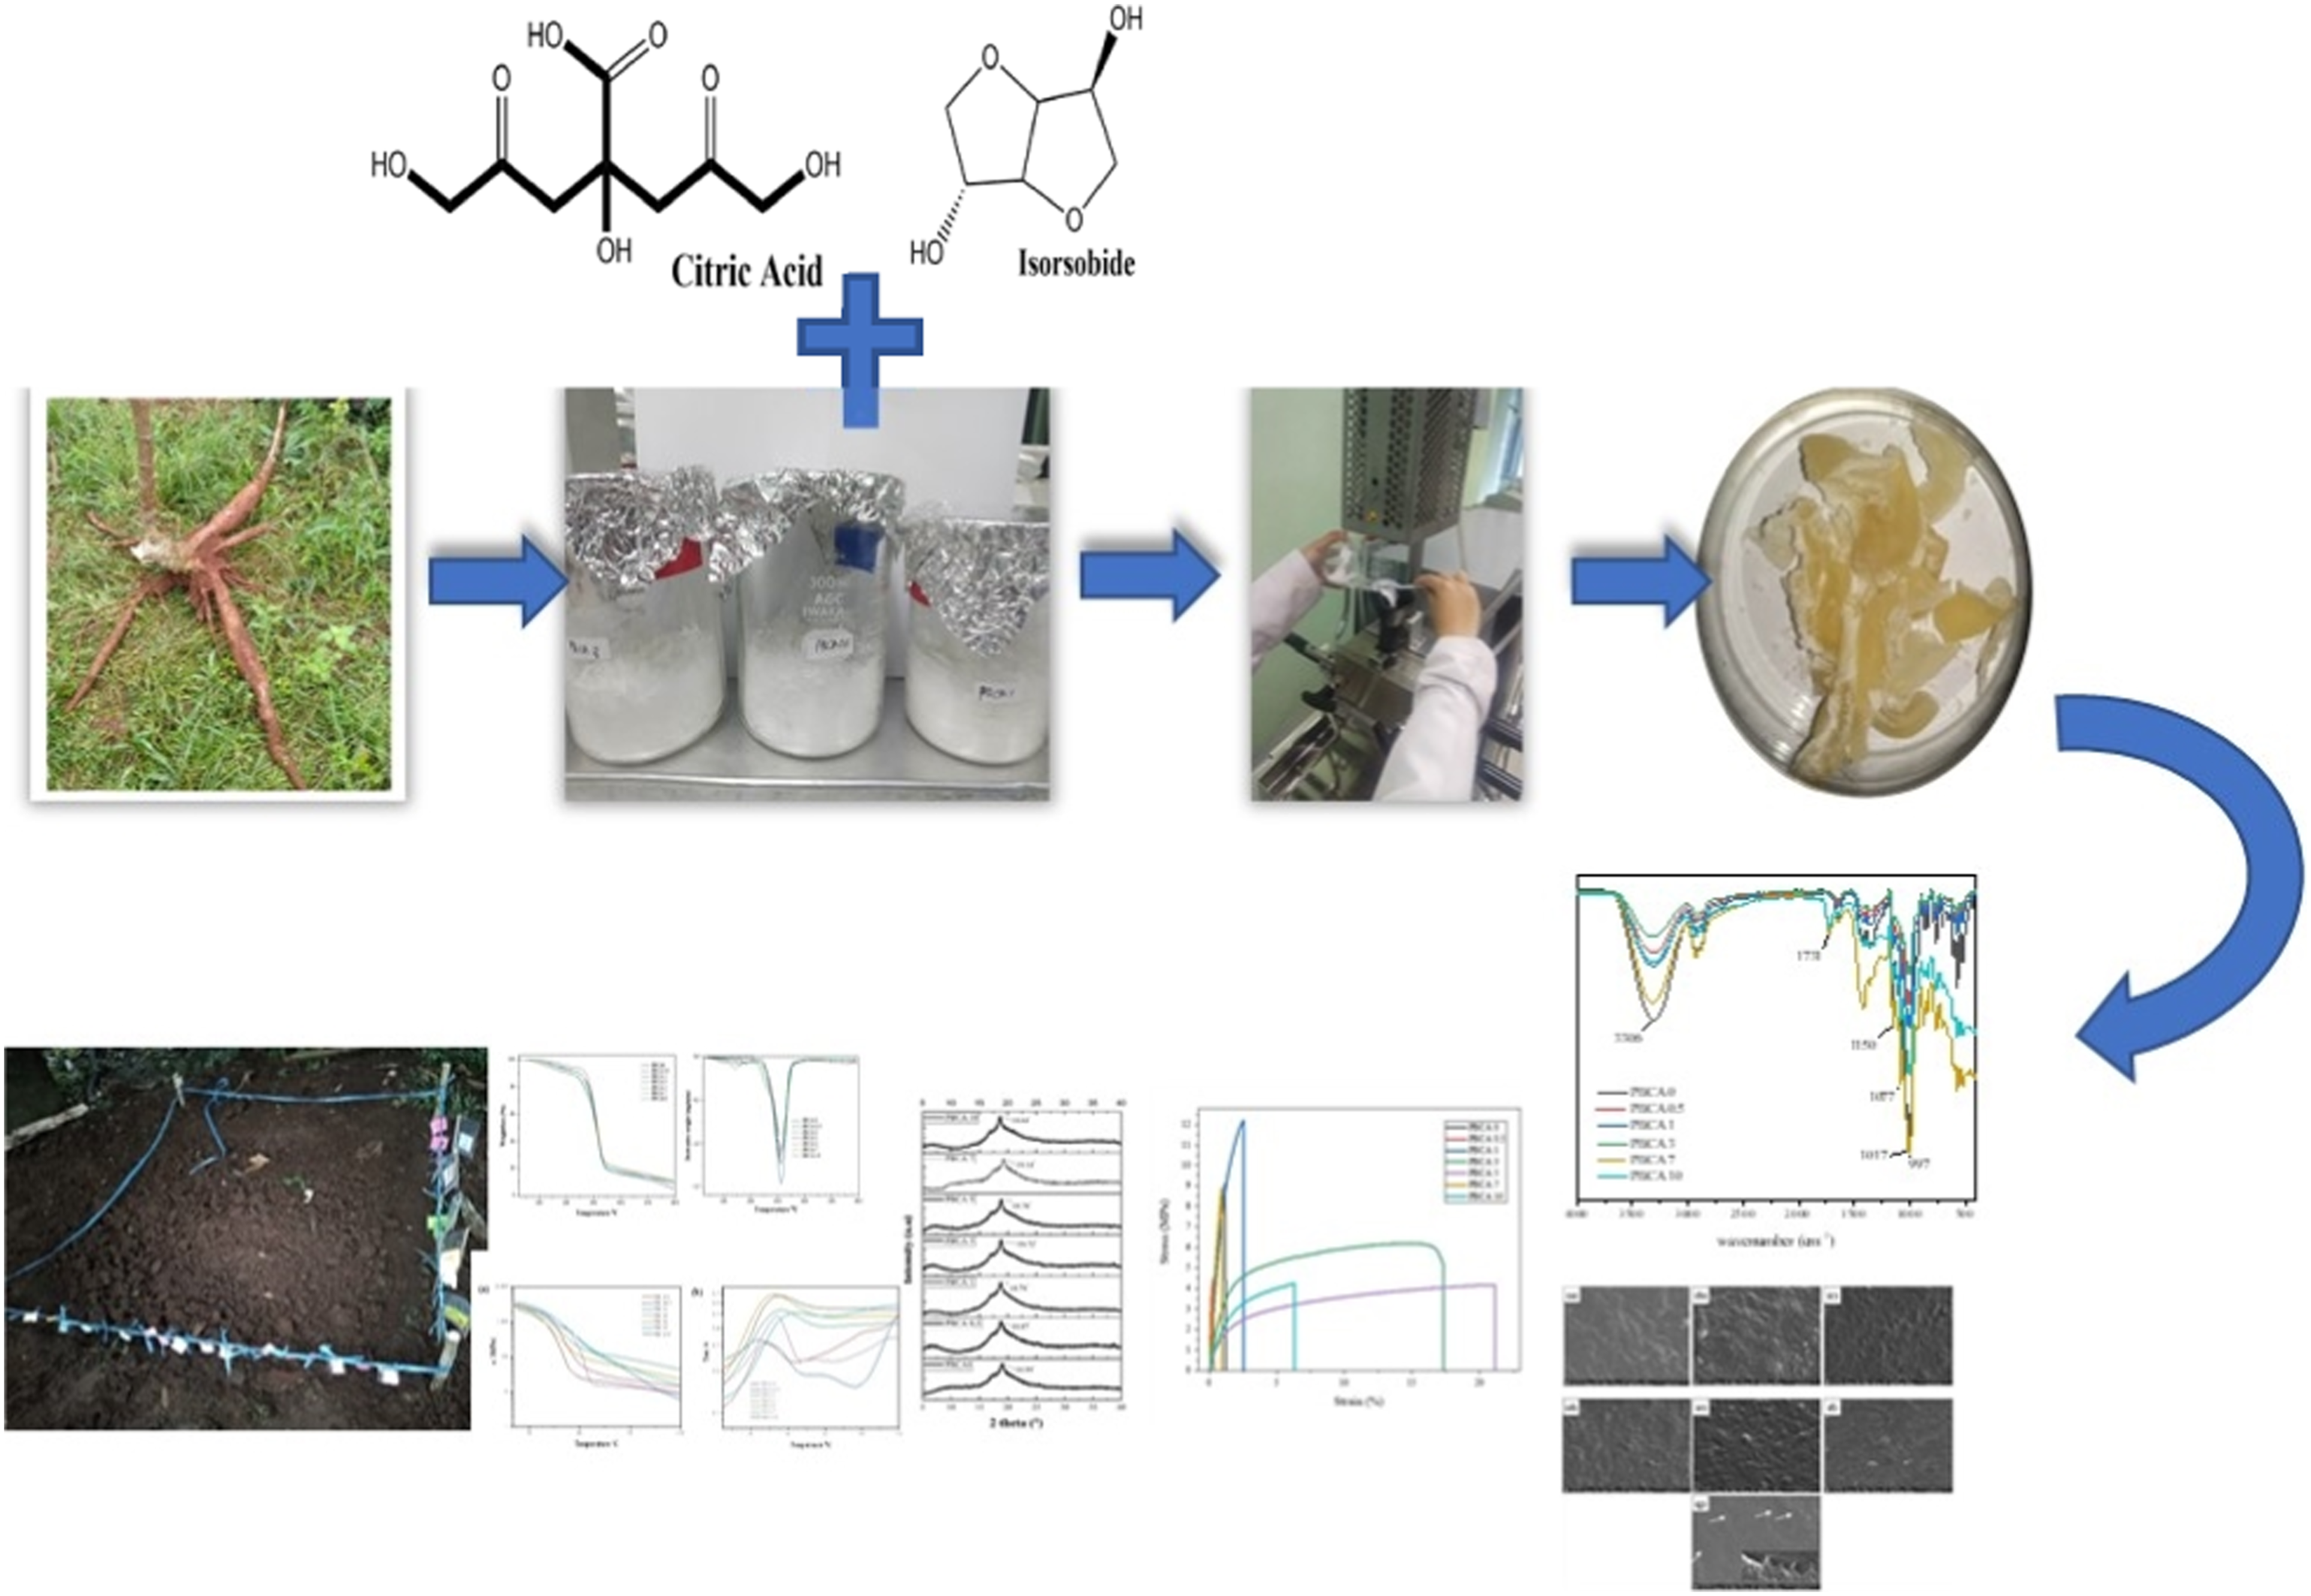
In this research, citric acid was used to enhance the compatibility between bitter cassava starch and isosorbide (1,4;3,6-dianhydro-d-glucitol) in the production of thermoplastic starch using melt mixing process. The influence of citric acid was investigated in terms of the physical, morphological, mechanical, barrier and thermal properties.
Experimental section
Materials
Fresh bitter cassava tubers (PBP) were obtained from farmer in Cibinong, Bogor, Jawa Barat, Indonesia. Isosorbide (Dianhydro-D-Glucitol 98%), and citric acid monohydrate 98% were purchased from Sigma-Aldrich. Aquades were provided from Nitra Kimia.
Isolation of starch
PBP tubers were peeled and cleaned from the remaining soil. Clean PBP tubers were soaked with water in a ratio of 1:2 for tubers and water, respectively. The tubers were left for 24 h at room temperature. Cassava tubers were crushed using a crushed machine (Bison 2000). Slurry cassava was mixed with water in ratio 1:2 and filtered with double layer of cheesecloth. The filter process was repeated 4 times to maximize starch extraction. The filtrates were stayed for 24 h at room temperature. The next day, the precipitate was collected and dried at 60°C for 5 h. The starch then stored in a closed container.
Preparation of thermoplastic starch
TPS was prepared using a Rheomixer HAAKE Polylab OS System. A desired amount of PBP starch was weighed and placed in a glass beaker. Citric acid with a weight ratio of 0.5 wt%;1 wt%;3 wt%;5 wt%;7 wt%;10 wt% were separately dissolved in aquades, the sample then were labeled as PBCA. Isosorbide was set at 40 wt% to the starch weight was the added to citric acid solution. The solution was poured into starch in the beaker and mixed thoroughly. The mixture was wrapped in plastic and left for 16 h at room temperature. The mixture was poured to twin-roll mixer Rheomixer HAAKE Polylab OS System, at 120°C with roller rotors rotating at 80 r/min for 7 min. TPS films were prepared using pressed using mini hot press YASUDA at 120°C, at a pressure of 40 MPa for 15 min.
Characterization of bitter cassava starch
Calculation of PBP starch content
The amount of PBP starch was calculated by determining the difference in volume between the Blanco and sample titrations. The PBP starch content of the material can be calculated from the reducing sugar content after hydrolysis with 3 wt% HCl using the table of differences in inverse sugar content, with the before inverse multiplied by 0.90. The starch content was determined using the following formula: wg: weight of standard glucose ws: sample weight FP: filtrate volume in a titration.

Determination of amylose and amylopectin of bitter cassavastarch
40 mg of pure amylose was added to a 100 ml volumetric flask along with 1 ml of 95% ethanol and 9 ml of 1 N sodium hydroxide during the standard calibration preparation step. The standard solution contained in a 100 ml volumetric flask was diluted with distilled water in increments of 1 ml, 2 mL, 3 ml, 4 ml, and 5 ml. The iodine solution was poured into each volumetric flask to a volume of 2 mL. Additionally, 0.5 N acetic acid was added in increments of 0.2 ml, 0.4 ml, 0.6 ml, 0.8 ml, and 1 ml to the solution. The solution was mixed and allowed to stand for 20 min. The intensity of the colour perceived by UV-Vis Spectrometry (Shimadzu 1800) at 620 nm wavelength.
Measurement of amylose and amylopectin using the IRRI Method (AOAC 1995). At the sample measurement stage, 200 mg of sample was put to the test tube along with 1 ml of ethanol and 9 ml of NaOH 1 N. The sample solution was heated for 10 min, cooled, transferred to a 100 ml flask, and adjusted with distilled water until the appropriate concentration was achieved. Up to 5 ml of the solution was transferred to a 100 ml volumetric flask, where 2 mL of iodine solution and 1 ml of 0.5 N acetic acid were added. The colour intensity was measured using a spectrophotometer with a 620 nm using UV-Vis Spectrometry (Shimadzu 1800) after the addition of the final solution and the required amount of distilled water, followed by 20 min of shaking the solution until it solidified using a spectrophotometer with a 620 nm wavelength. Standard curve and amylose content were estimated using the following equation:
Standard curve equation:

The formula for determining amylose is: A: Sample absorbance at a wavelength of 620 nm S: Slope on the standard curve Fp: Dilution factor, 20 W: Sample weight (gram)

Amylopectin content was calculated use the following formula
19
:

Characterization of thermoplastic starch
Fourier-transform infrared spectroscopy
Functional groups were investigated with a Perkin-Elmer Spectrum 100 in attenuated total reflectance (ATR) mode with resolution of 1 cm−1, and range of a wavenumber 4000 to 500 cm−1.
Scanning electron microscopy
Morphology measurements were determined using FE-SEM Thermo Scientific Quattro operating at an acceleration potential of 10 kV. The specimen was cut with dimensions are 2 mm x 1 mm x 1 mm and mounted in a sample holder with a carbon tape.
Mechanical analysis
The specimens for tensile test were prepared according to American Standard Testing and Material (ASTM) 638 type V with dimension of 63.5 × 9.53 × 3 mm. Tensile test was performed with a Universal Testing Machine (UTM) Shimadzu AGS-X series equipped with a 10 kN load cell at the speed of 5 mm/min. Three repetitions were made.
Density of sample was determined based on ASTM D792-91 on thin layer specimen. A specimen with dimension of 1.5 x 1.5 mm and weight of 1 gr was placed in a tube filled with 40 ml aquades. The volume of specimen was calculated using difference between the volume of water before specimen adding (V) and volume after specimen adding (V1) with following equation:

Density was calculated with:

Three repetitions were made.
Barrier analysis
Water vapor transmission rate (WVTR) measurement was according to ASTM E-96 by the cup method with three replications. The specimen using bioplastic film 50 × 50 mm, bioplastic was attached to middle aluminium foil, that has been perforated by 10% of the surface area of a plastic dish. The dishes were filled with 80 ml of water and covered with aluminium foil. The dish with specimen was weighed and put in oven at temperature 25°C, RH 80% and weighed eight times per hour. Mass loss of water were calculated and analysed using regression line to determine the slope (weight change at hours interval). WVTR (g.m−2s−1) was calculated with the following equation:

Crystallinity structure analysis
Crystallinity was conducted with XRD-7000SAS SHIMADZU condition instrument step-size 0.02° at 1 °min−1 scanning rate with scan range of 5 – 40°. The specimen for analysis was cut to dimension of 2 mm × 1 mm × 1 mm.
Thermal analysis
Degradation temperature of PBCA sample were determined with thermogravimetric analysis (TGA) with a TGA 4000 instrument. The sample were weighed and heated with a temperature from 25°C to 600°C at a heating rate of 10°C.min−1 and a rate of nitrogen 20 mL.min−1.
DMA was employed using a Perkin Elmer DMA8000 model in tensile film clamp with amplitude of 20 µm at 2 Hz, temperature range 30 to 120°C/min with heating rate of 2°C/min. A rectangular specimen with dimension 30 mm × 10 mm × 1 mm (length × width × thickness, respectively) was used.
Soil burial test
The biodegradability was determined by burying bioplastic sheets in soil. A specimen with the dimension of 15 mm × 15 mm ×1 mm was buried in terrain at 14 cm depth for 6 days with three repetitions. The weight of sample (as shown in the attached in Figure 1) was calculated every 2 days. The weight loss of the specimens was measured by weighing sample before buried in soil (W0) and after days in soil (Wf). The bioplastics weight reduction was determined using an equation: Environmental conditions for biodegradability test.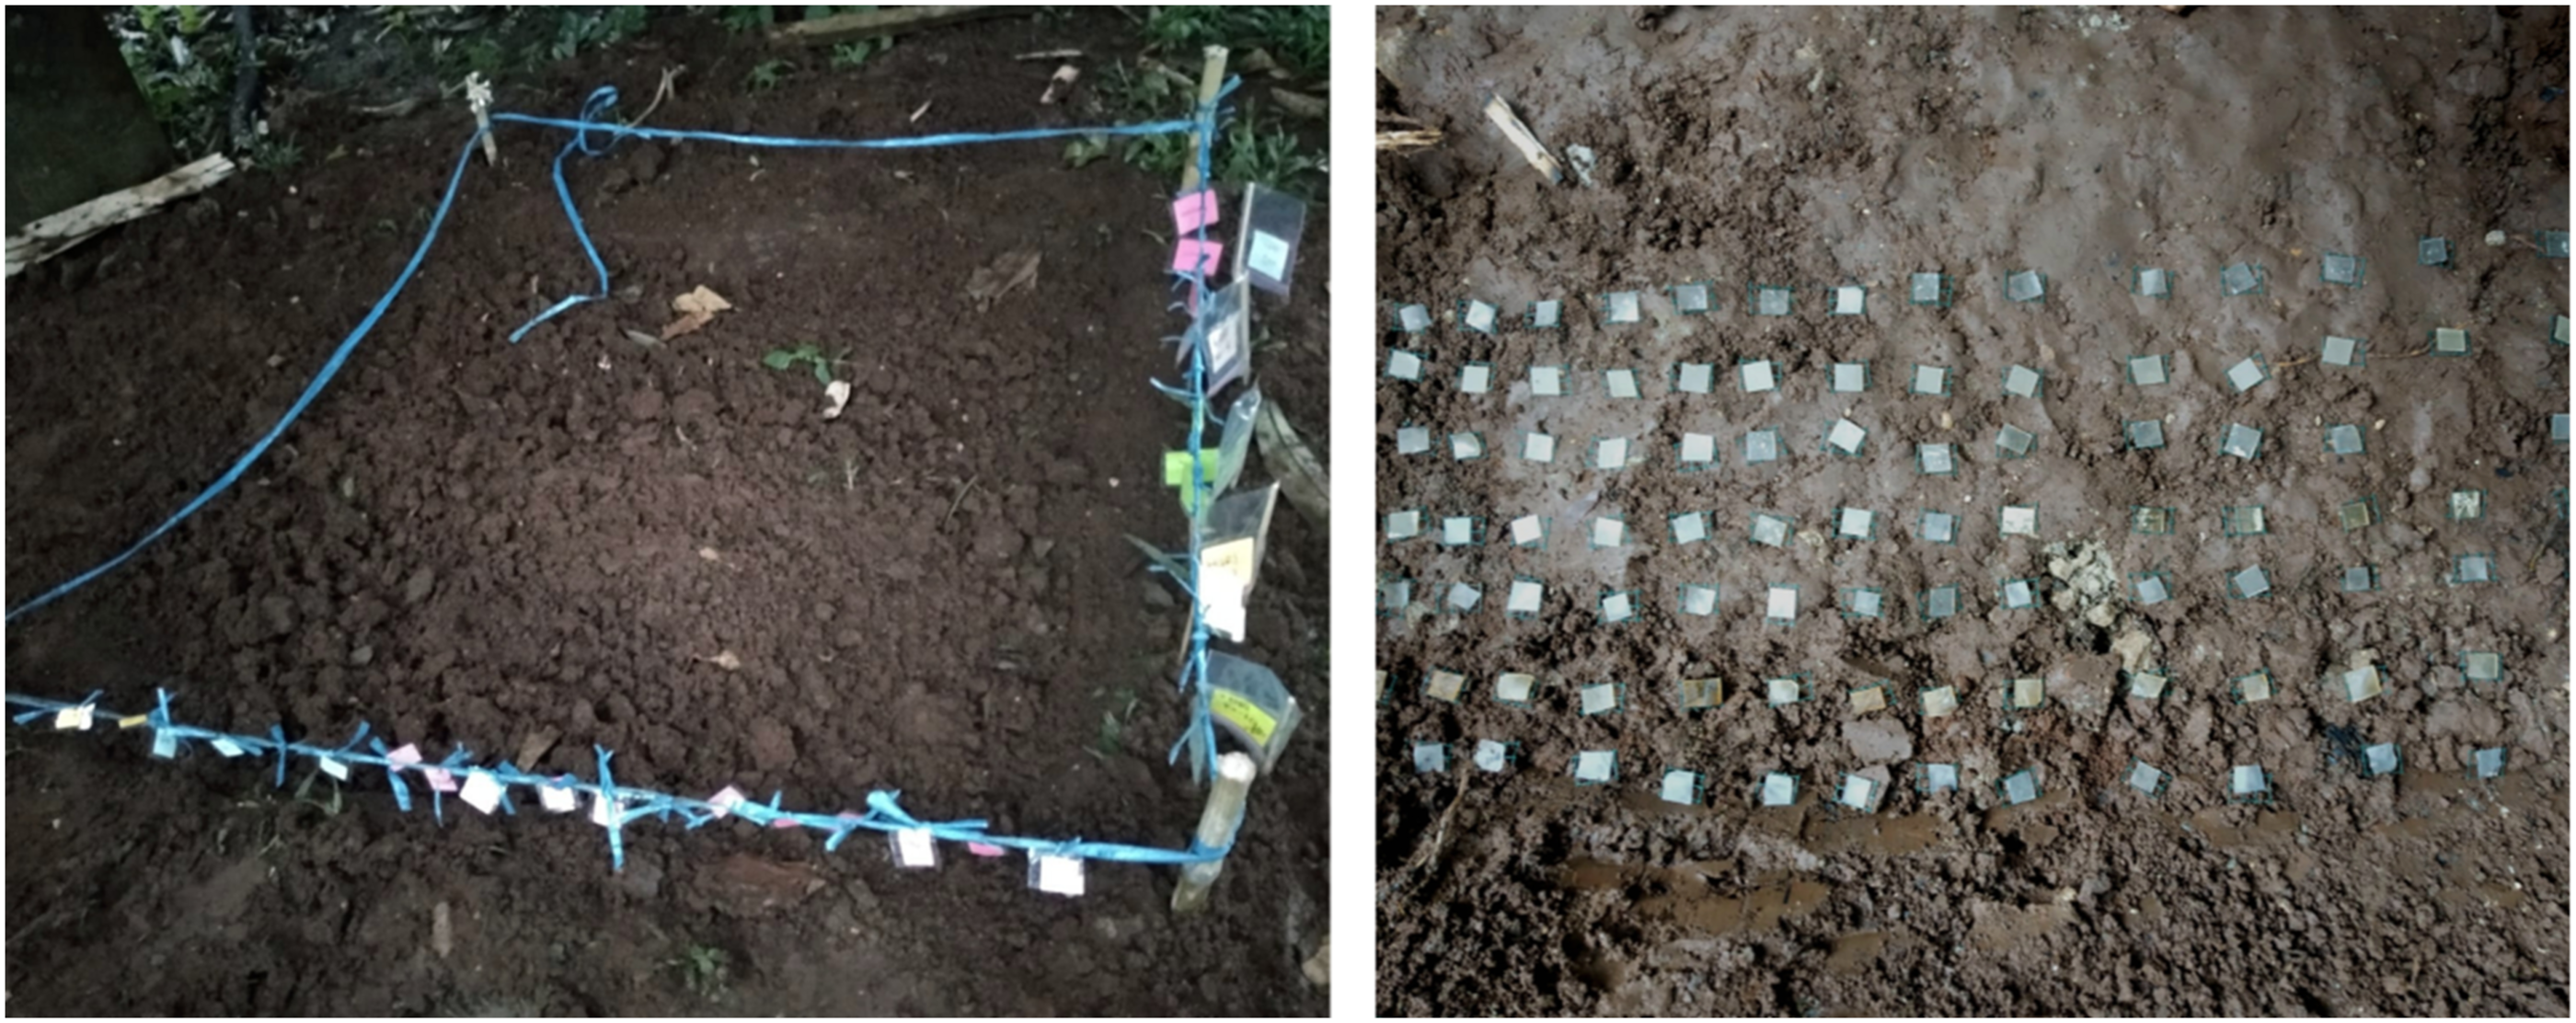

Results and discussion
PBP starch properties
Bitter cassava with a local name of pucuk biru (PBP) were obtained from a local farmer. After starch extraction, the concentration of the amylose, amylopectin and starch were calculated. The bitter casava starch has amylose content of 35.98%. This value is higher than several reports on other polysaccharides such as maize 25% 20 and wheat 22.46 – 32.22% 21 Amylose influences crystallinity and elongation in thermoplastic. Meanwhile amylopectin content in this bitter cassava starch is 64.02%. The starch content of bitter cassava (PBP) is 78.17%, which higher than starch content in several reports such as commercial casava 66.02%, 22 maize 72 – 73 wt% 23 and wheat 70 – 75%. 21
Figure 2 shows PBP starch plasticized with isosorbide with citric acid as an additive. The sample were labelled PBCA 0, PBCA 0.5, PBCA 1, PBCA 3, PBCA 5, PBCA 7 and PBCA 10 for the citric acid concentration of 0%, 0.5 wt%, 1 wt%, 3 wt%, 5 wt%, 7 wt%, 10 wt%, respectively. Figure 2(a) presents PBCA after melt-mixing process which become a rigid but slightly brittle material. The high concentration of citric acid makes the sample more yellowish. Figure 2(b) shows a compressed film of PBCA with a thickness 0.5 mm. Overall, the films have high transparency but increases the opacity as the citric acid concentration increases. PBCA sample after (a) melt-mixing process (b) compression.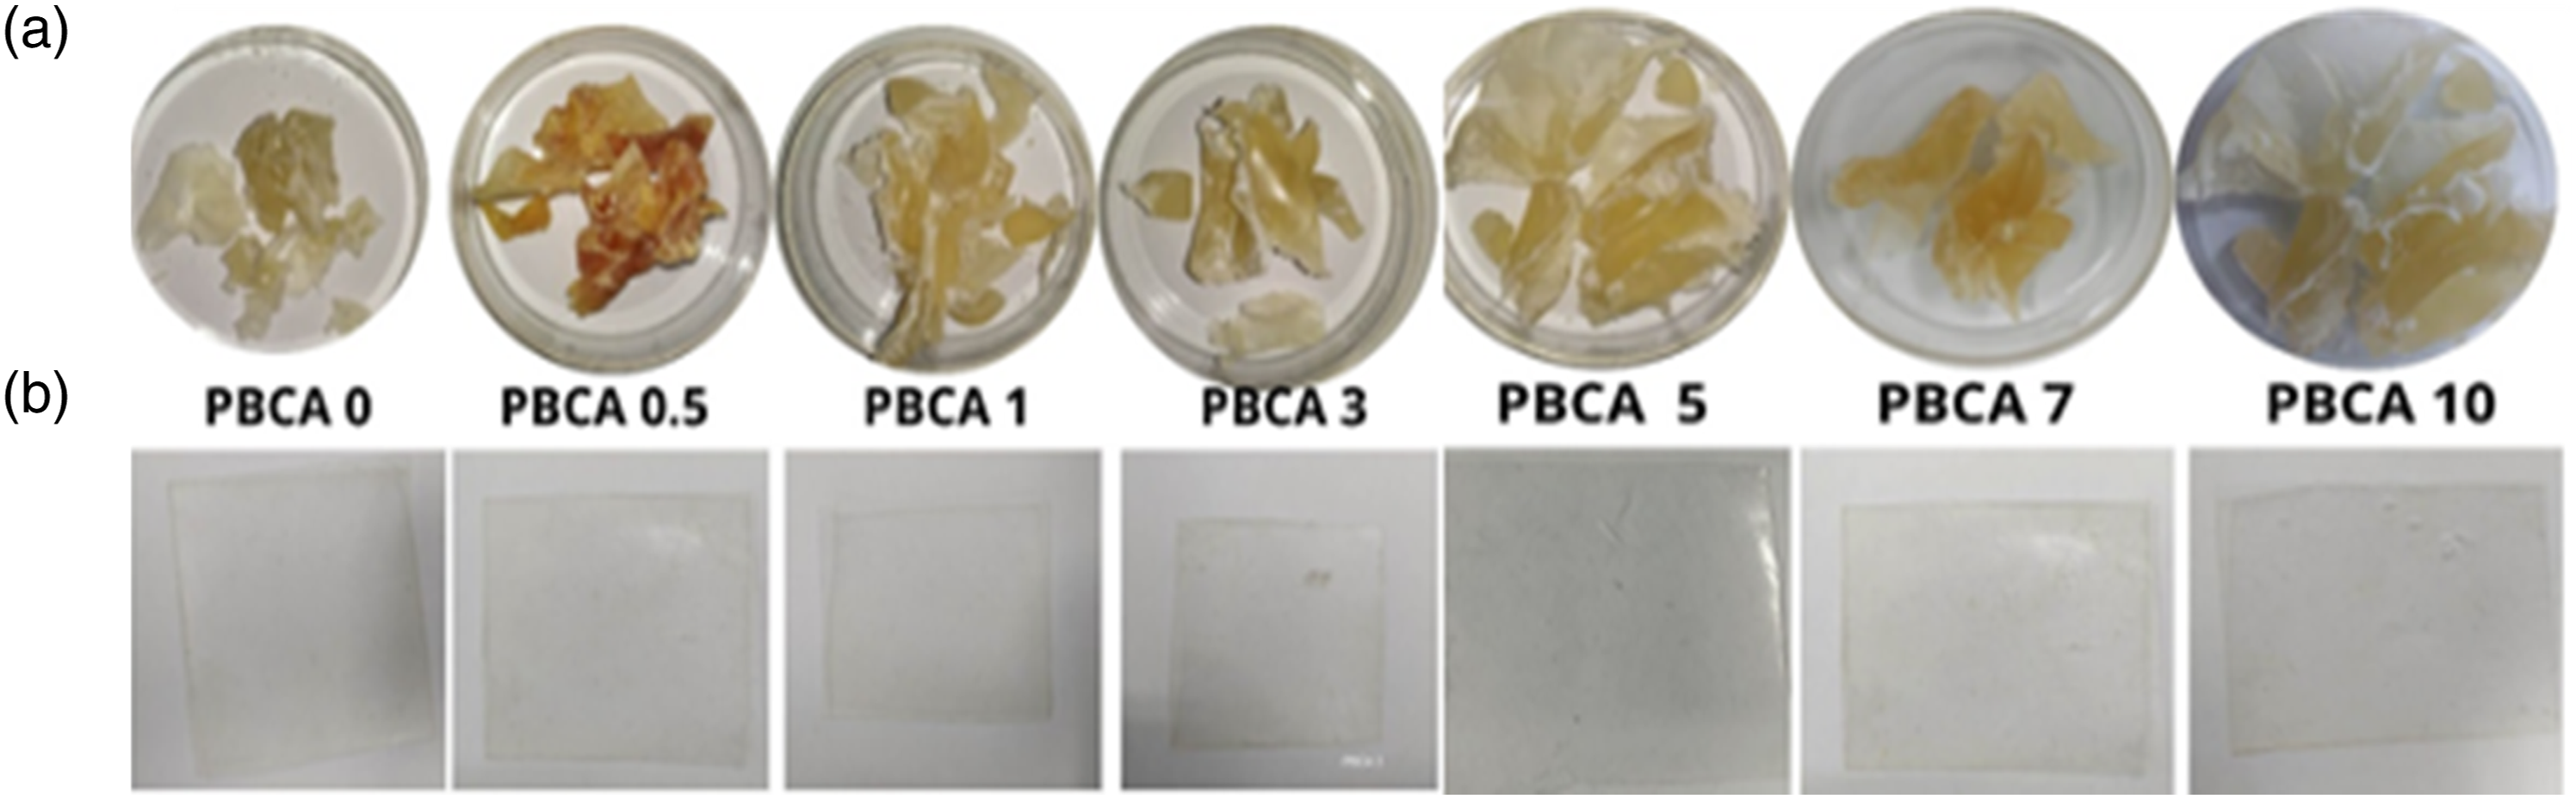
Morphological properties
The specimen without citric acid (PBCA 0) in Figure 3 has a rough surface with noticeable residual starch granules. These granules remain even after the loading of 0.5 wt% to 7 wt% citric acid (Figure 3). However, at 10 wt% citric acid (Figure 3) the surface become smoother, and residual starch granule is reduced. This result shows that a high concentration of citric acid helps the isosorbide and starch to mix better. Citric acid can increase the fragmentation and destruction of starch granules, which promotes the absorption of plasticizer into the molecular structure of starch, and the formation of high plasticization of PBCA can be achieved.
17
Surface morphology of PBCA with CA concentration of (a) 0 wt%, (b) 0.5 wt% (c) 1 wt% (d) 3 wt%, (e) 5 wt% (f) 7 wt% (g) 10 wt%.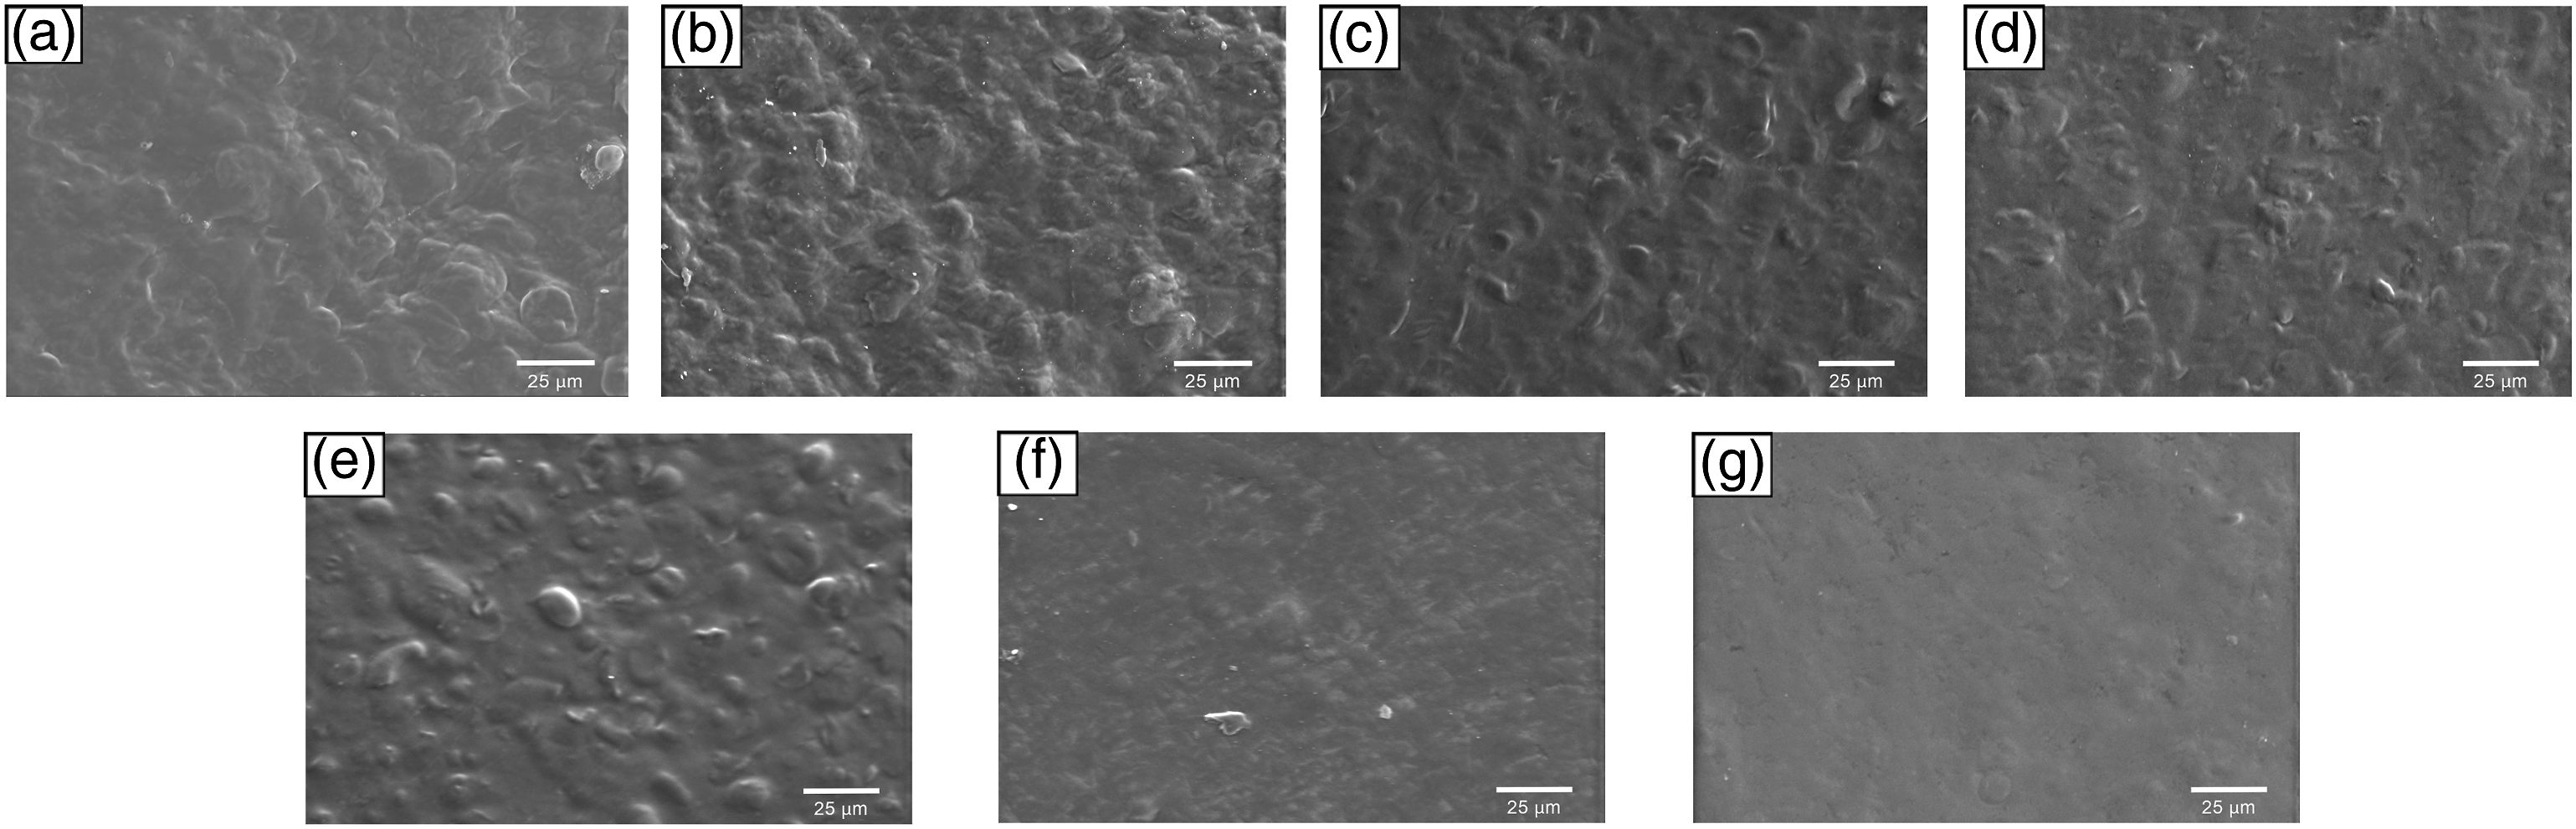
Functional groups determination
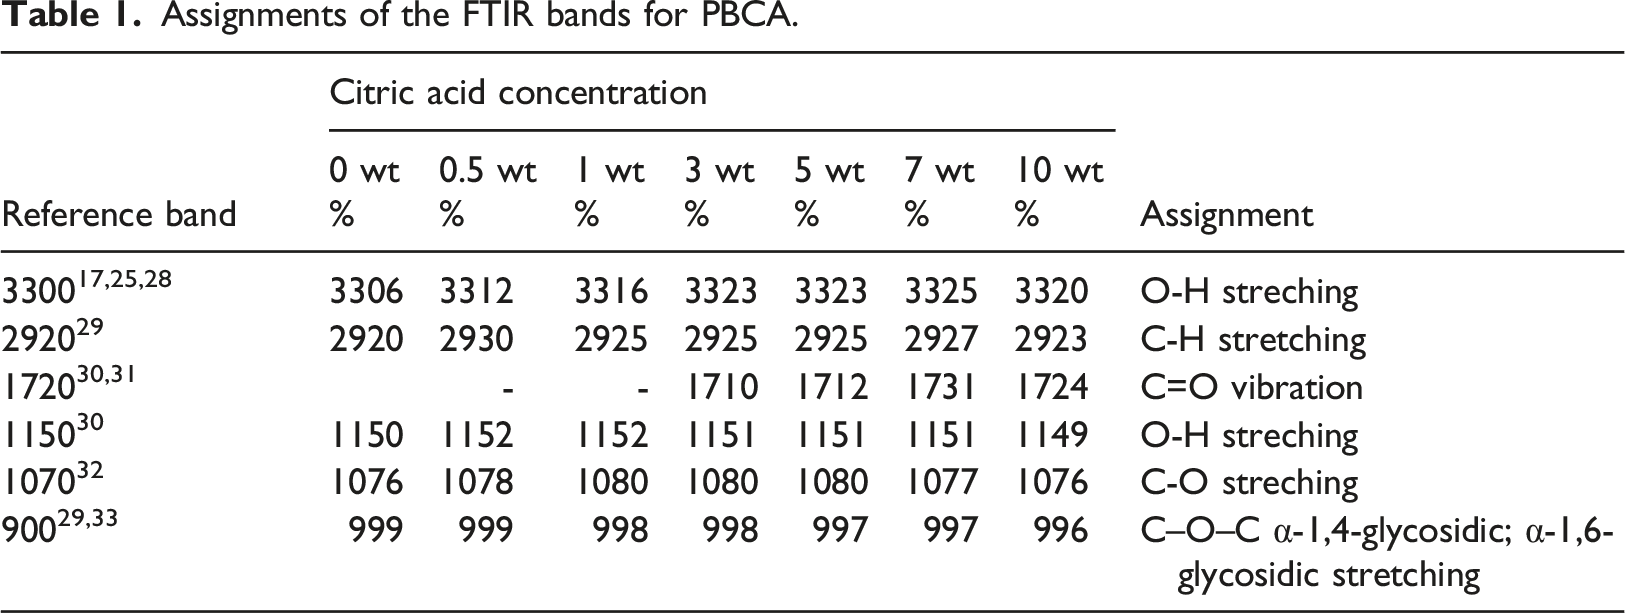
A FTIR spectroscopy measurement was carried out to analyse the influence of citric acid addition to the neat PBCA (Figure 4) and Table 1. The typical bands for starch are observed at 1148 cm−1, cm−1, 1076 cm−1 are referred to the stretching vibration of C–O in C–O–H. Another peak at 999 cm−1 which is related to C–O bond stretching of C–O–C group.20,21 For isosorbide, absorption bands at 1035 cm −1 for C–O–C stretching, at 2894 cm−1 for C–H stretching, and at 3365 cm −1 for OH stretching. Meanwhile citric acid absorption band is detected at 1753 cm−1 and 1169 cm−1 which is associated to C=O and C–O stretching, respectively. The incorporation of citric acid shifted the fingerprint peak of starch in the fingerprint region of starch, indicating interaction between starch and citric acid.
24
Peak at 3306 cm−1 for 3320 to high wavenumber (e.g. 3320 cm−1 for PBCA 10), which related to the hydrogen bonding interaction between the starch and citric acid.
25
In addition, the peak of PBCA 0 at 1150 cm−1 for OH stretching is shifted to lower bands (e.g. PBCA 10 at 1151 cm −1), indicating O-H group of starch was involved in the hydrogen bond formation
26
The peak at 1731 cm −1 shift to lower band at 1724 cm−1 (PBCA 10) for C=O groups vibrations, implying the formation of hydrogen bonds or molecules.
27
The absorption band at 1150 cm−1 and 1077 cm−1 indicate C–O stretch in C–O–H. Peak at 999 cm−1 which related to C–O stretching and C–O in C–O–C shifted to lower wave number down to 997 cm−1 in PBCA 10. FTIR spectra of thermoplastic starch with variation of citric acid. Assignments of the FTIR bands for PBCA.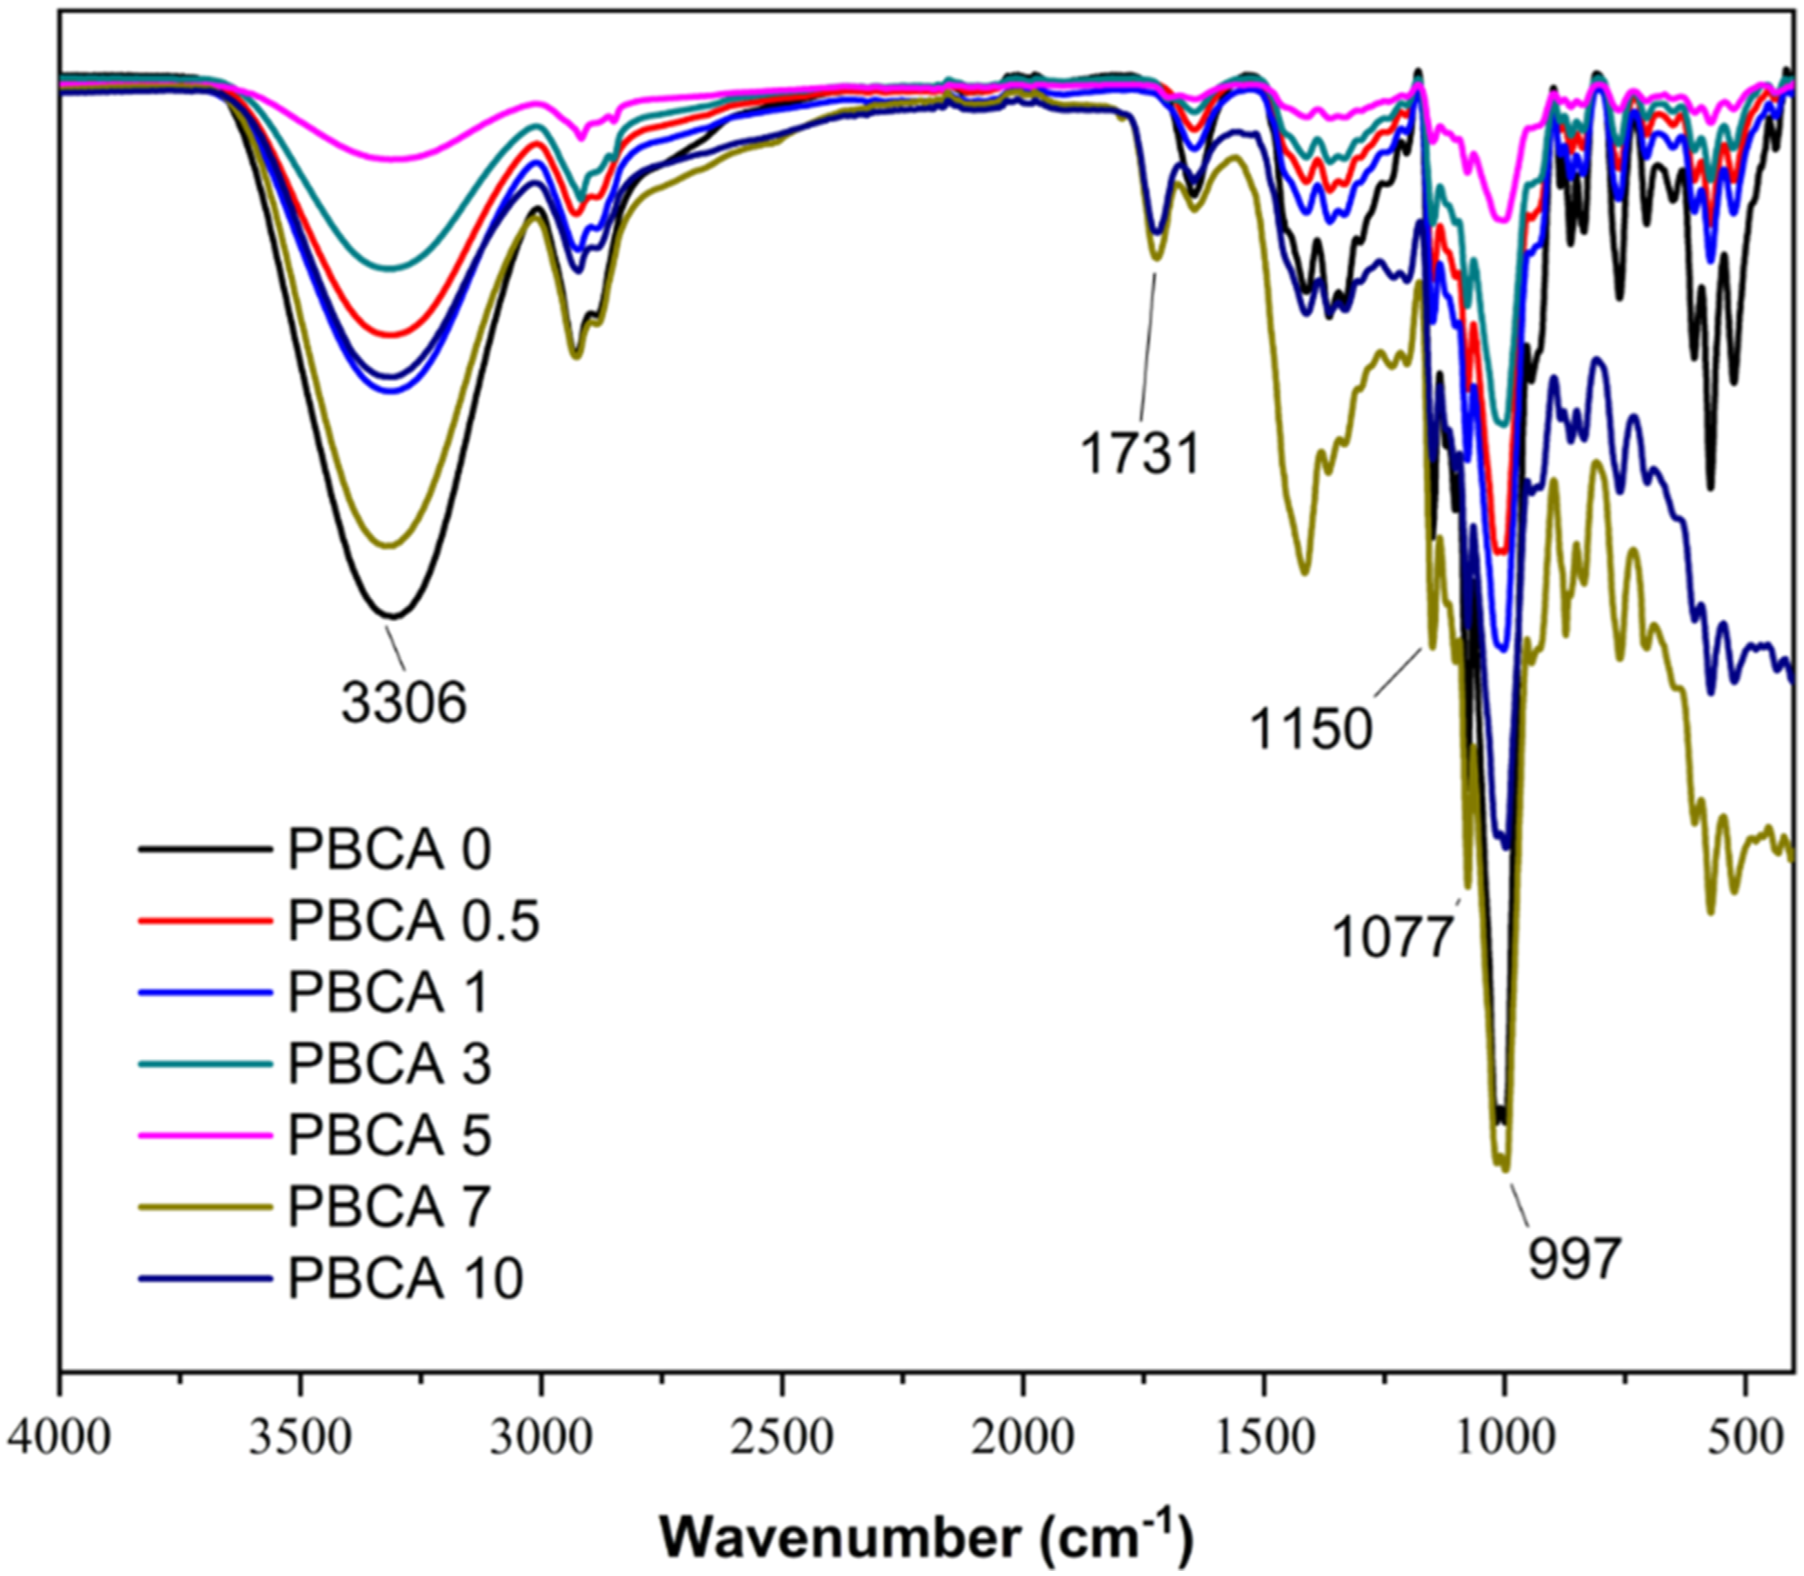
Mechanical properties
The stress and strain curves of PBCA are shown in Figure 5. The tensile strength, elongation at break, and Young’s Modulus of PBCA 0 are 8.68 MPa, 1.60%, 0.89 MPa, respectively. The presence of CA decreased the tensile strength of PBCA 0 from 8.68 down to 4.88 MPa (PBCA 10). However, at the concentration of 1 wt% the tensile strength increased significantly to 11.94 MPa. Meanwhile the presence of CA slightly influences the elongation at break. At composition CA of 1 wt% the elongation at break recorded only 1.3%. This might be because during molten process the starch chain has poor mobility and orientation which was affect the tensile strength as well as the elongation at break. This behaviour was also found in a work by Ning and co-workers which embedded citric acid to starch film plasticized with glycerol through an extrusion.
34
The elongation of break of this composition is only 1.23% in comparison to other CA concentrations such as 3 wt% has 4.25% and 5 wt% has 10.56%. PBCA also has relatively low stiffness with Young’s modulus 8.99 MPa-13.76 MPa and similar with glycerol plasticized starch film with extrusion blend (9.19 MPa).
34
However the Young’s modulus of the PBCA was dropped significantly at citric acid composition of 10 wt% to 2.09 ± 0.29 MPa.
35
The high disparity in the tensile test result values might be because the ineffective interaction between citric acid, starch, and isosorbide in the melt mixing process. It can be seen that there is high amount of residual starch granule which is depicted in Figure 3. An efficient melt mixing method should be conducted to get an optimum result. Stress and strain curves of PBCA with various citric acid concentration.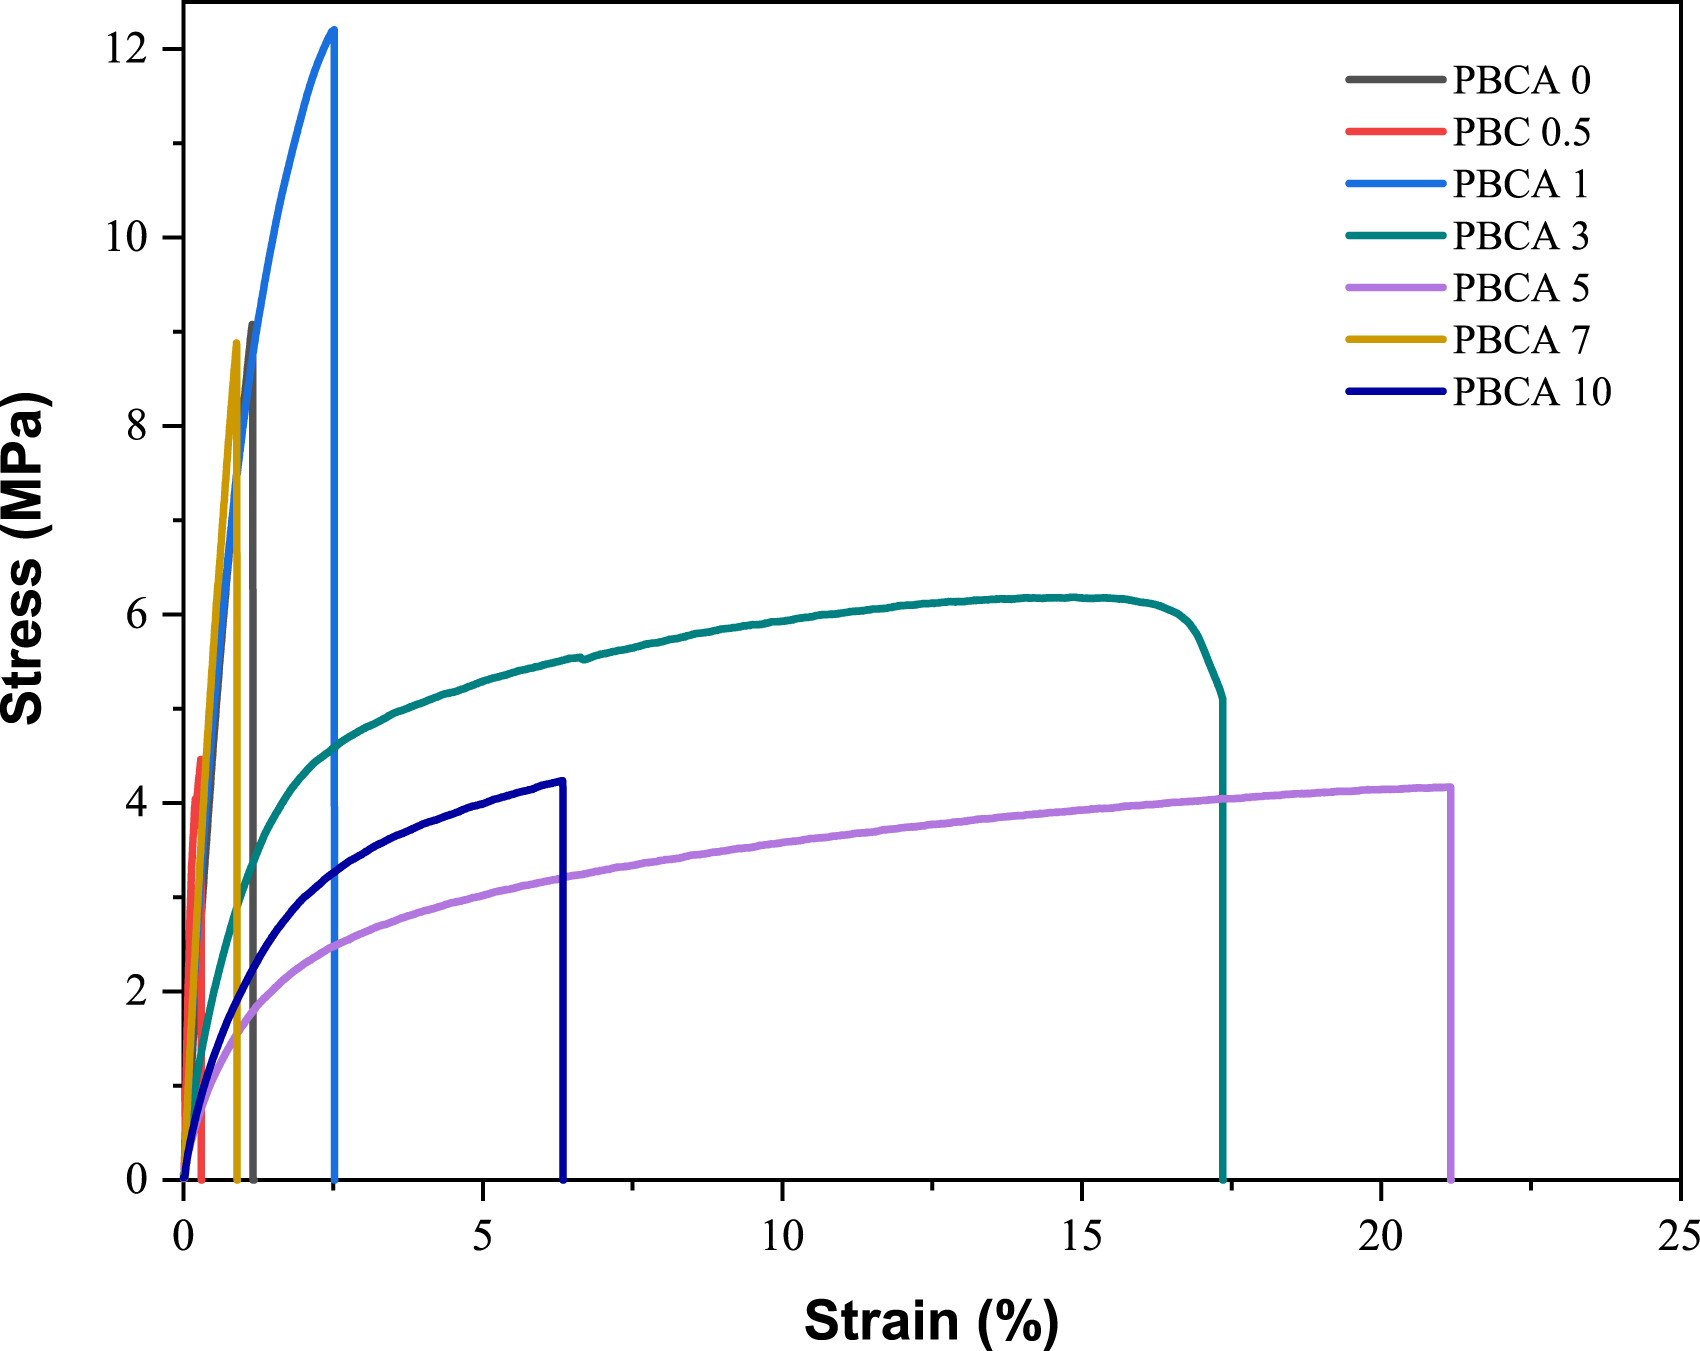
A comparison of mechanical and barrier properties thermoplastic starch with variation of citric acid concentration.
Crystallinity properties
The X-ray diffraction of PBCA, pure isosorbide, citric acid, and native starch are shown in Figure 5. The result shown crystallinity peak shifted from 18.99° (PBCA 0) to 18.76° (PBCA 5), implying addition of citric acid The X-ray diffraction of PBCA, pure isosorbide, citric acid, and native starch are shown in Figure 6 X-ray diffraction curve for (a) Starch PBP and (b) PBCA sample.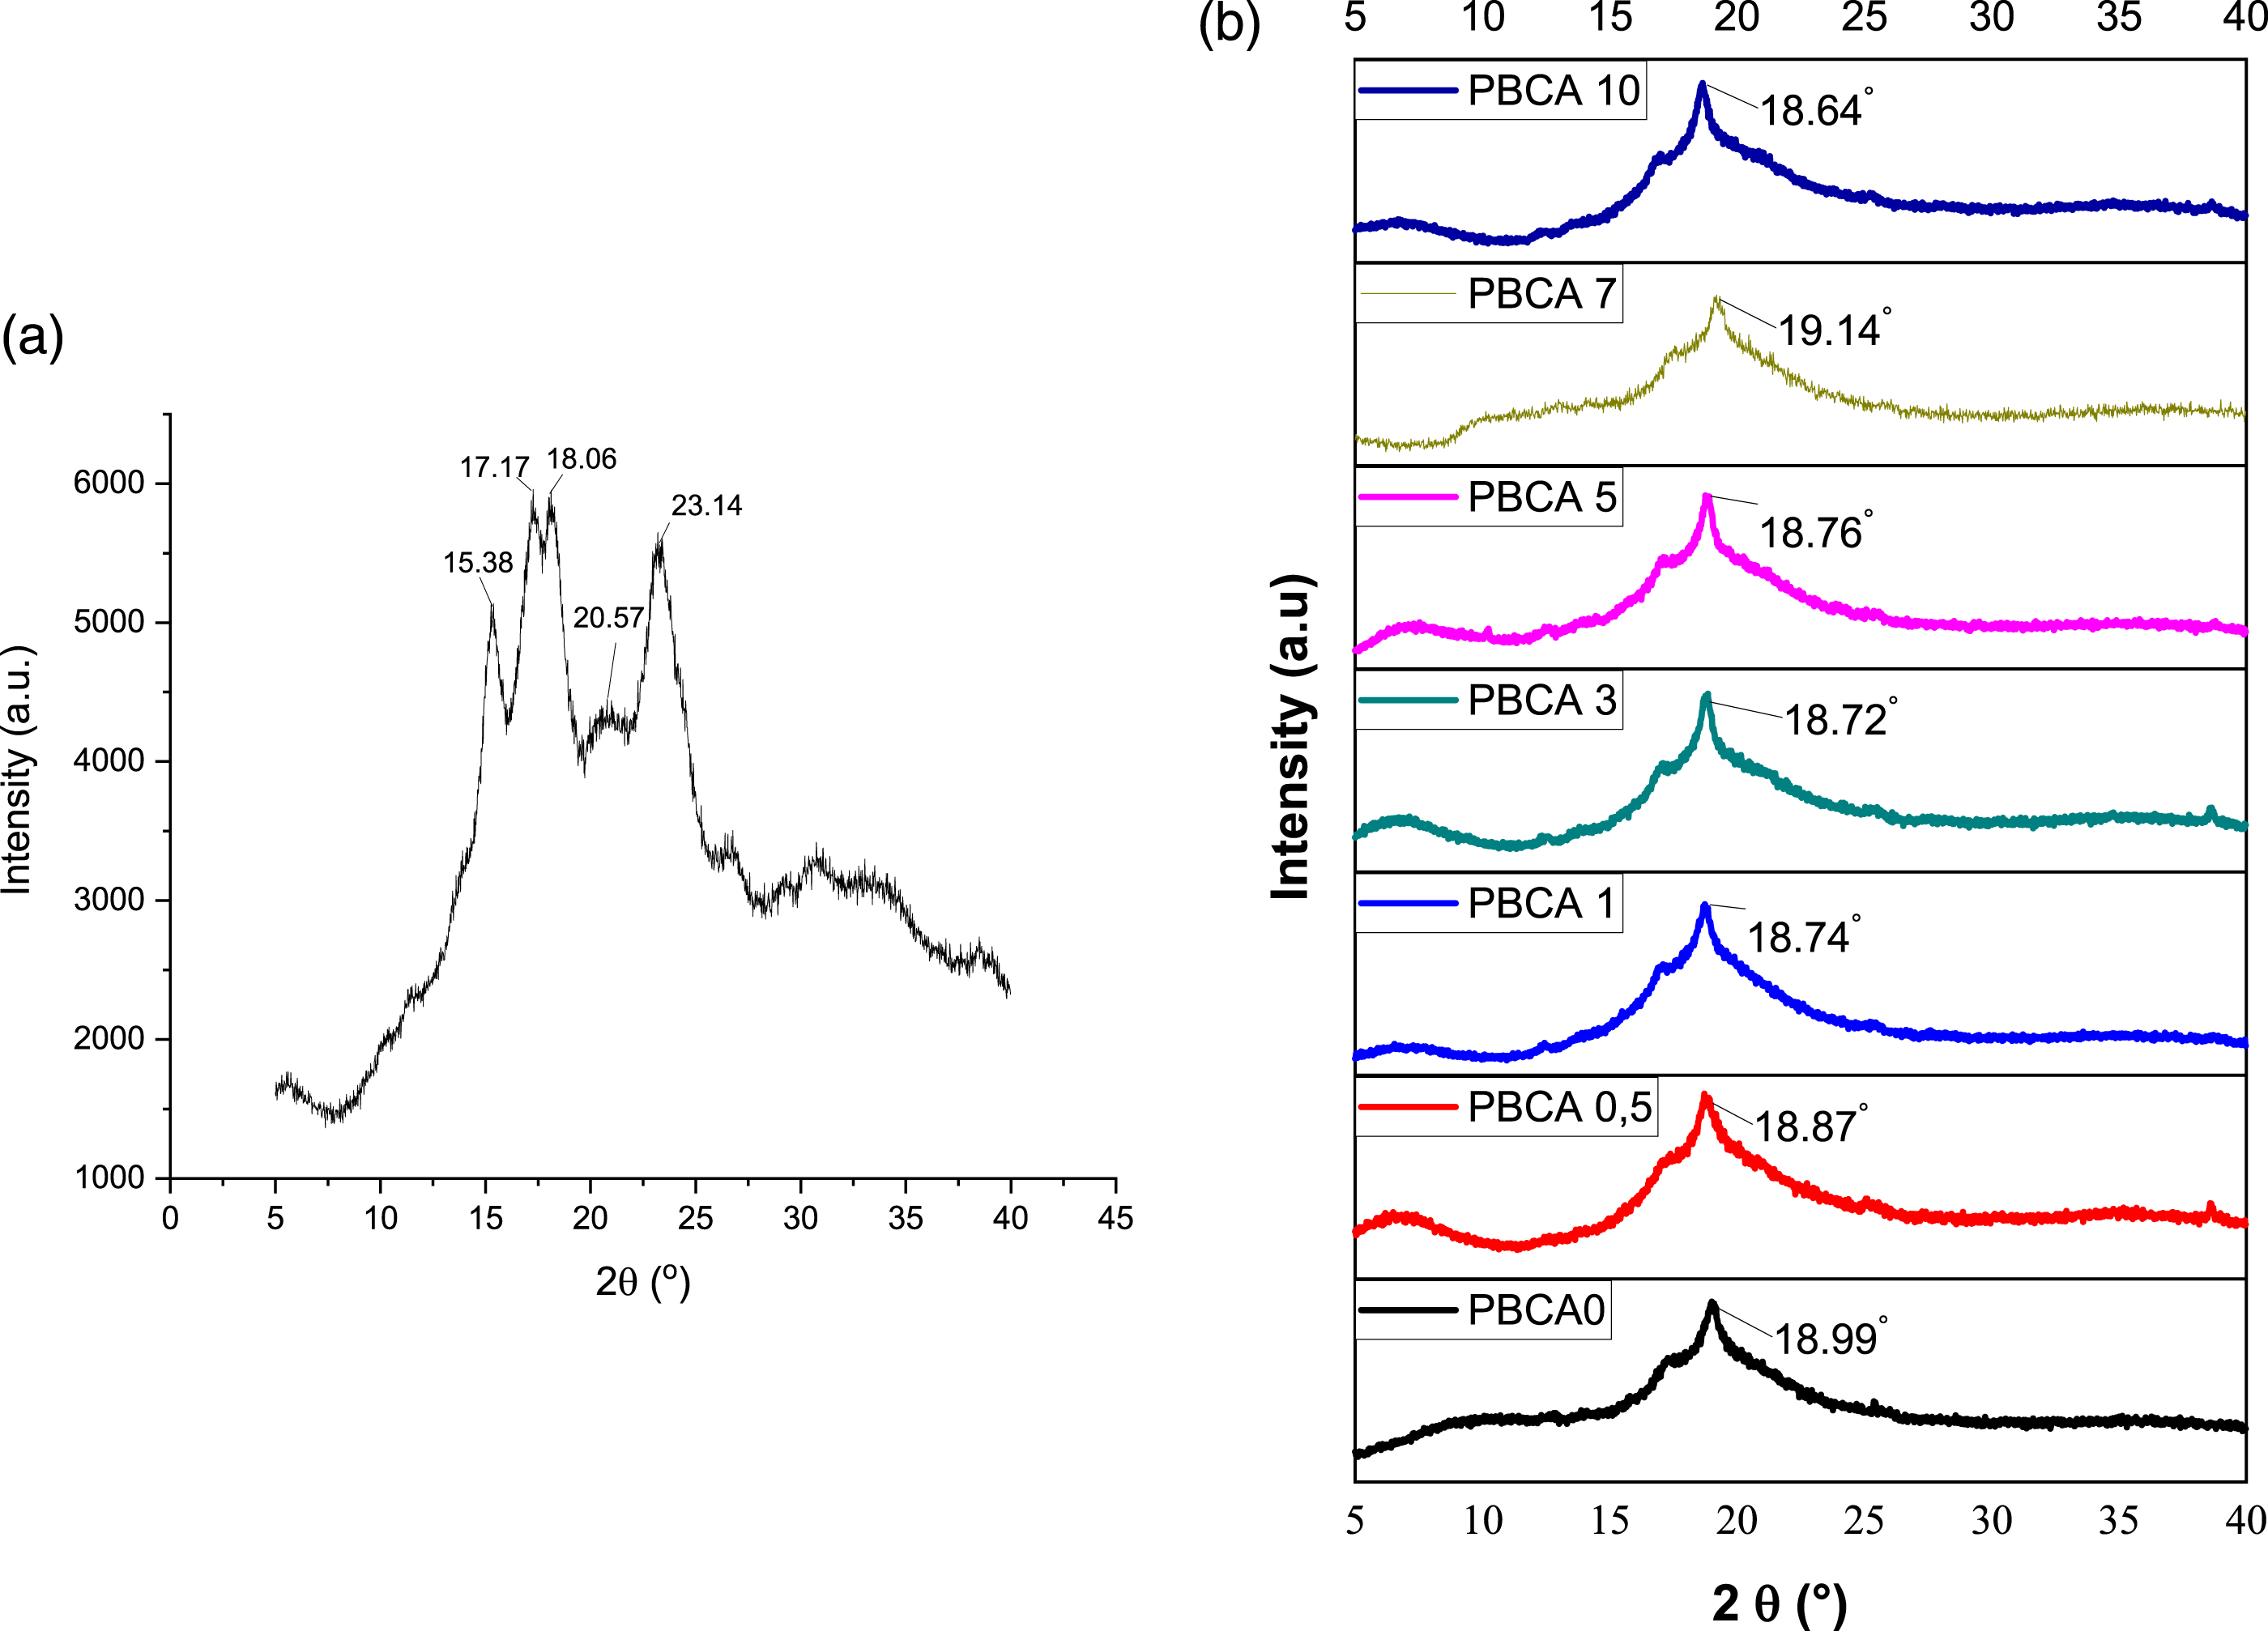
Barrier properties
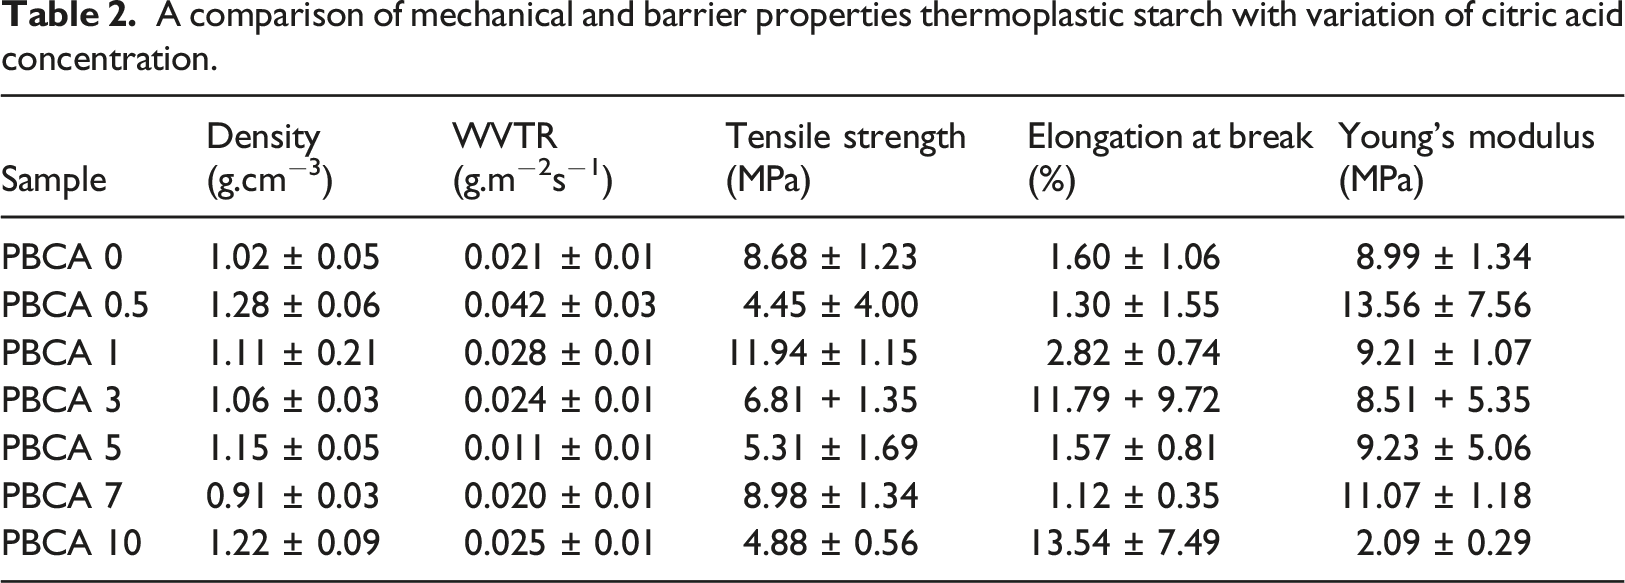
The result of WVTR test of the sample is showed in Table 2, PBCA 5 had ability of thermoplastic to retain water vapor is still lowest than sample all of sample. The result shows that PBCA has WVTR in a range of 0.011 g.m−2s−1 to 0.042 g.m−2s−1. This is still below the WVTR standard of the from Japanese Industrial Standard (0.00166 g.m−2s−1). 38 The ability of thermoplastics to retain water vapor is attributed to the hydrophilic character of raw ingredients which all natural material (starch and isosorbide). 39 The addition of citric acid was intended to introduced the hydrophobic ester group from CA to hydrophilic group on starch through melt mixing process. The presence of CA could lowering the moisture content and limiting the molecular movement and thus preventing the penetration of small molecules through the film. 40 However, it seems like the non homogenous mixture of the starch and CA which was depicted in Figure 3 is created a non efficient crosslinking process. Moreover, non homogenous mixture might create the defects in the film so gas molecules easily pass through the film. 40
Thermal properties
The influence of citric acid on the thermal stability of PBCA 0 was investigated by TGA which is depicted in Figure 7(a) and displayed in Table 3. PBCA 0 and PBCA with varieties citric acid showed degradation pattern with two main steps. The first step (Td1onset) occurred from 79.78°C to around 90.85°C and it can be attributed to evaporation of water and of plasticizer rich phases which partially overlapped. The second main step of degradation (Td2onset), mostly occurred from 247.17°C to around 275.29°C, mainly corresponds with thermal decomposition of starch-rich phase.
41
(a) TGA and (b) Derivative weight (DTG) curves of PBCA. Thermal properties of native starch (PBP) and PBCA.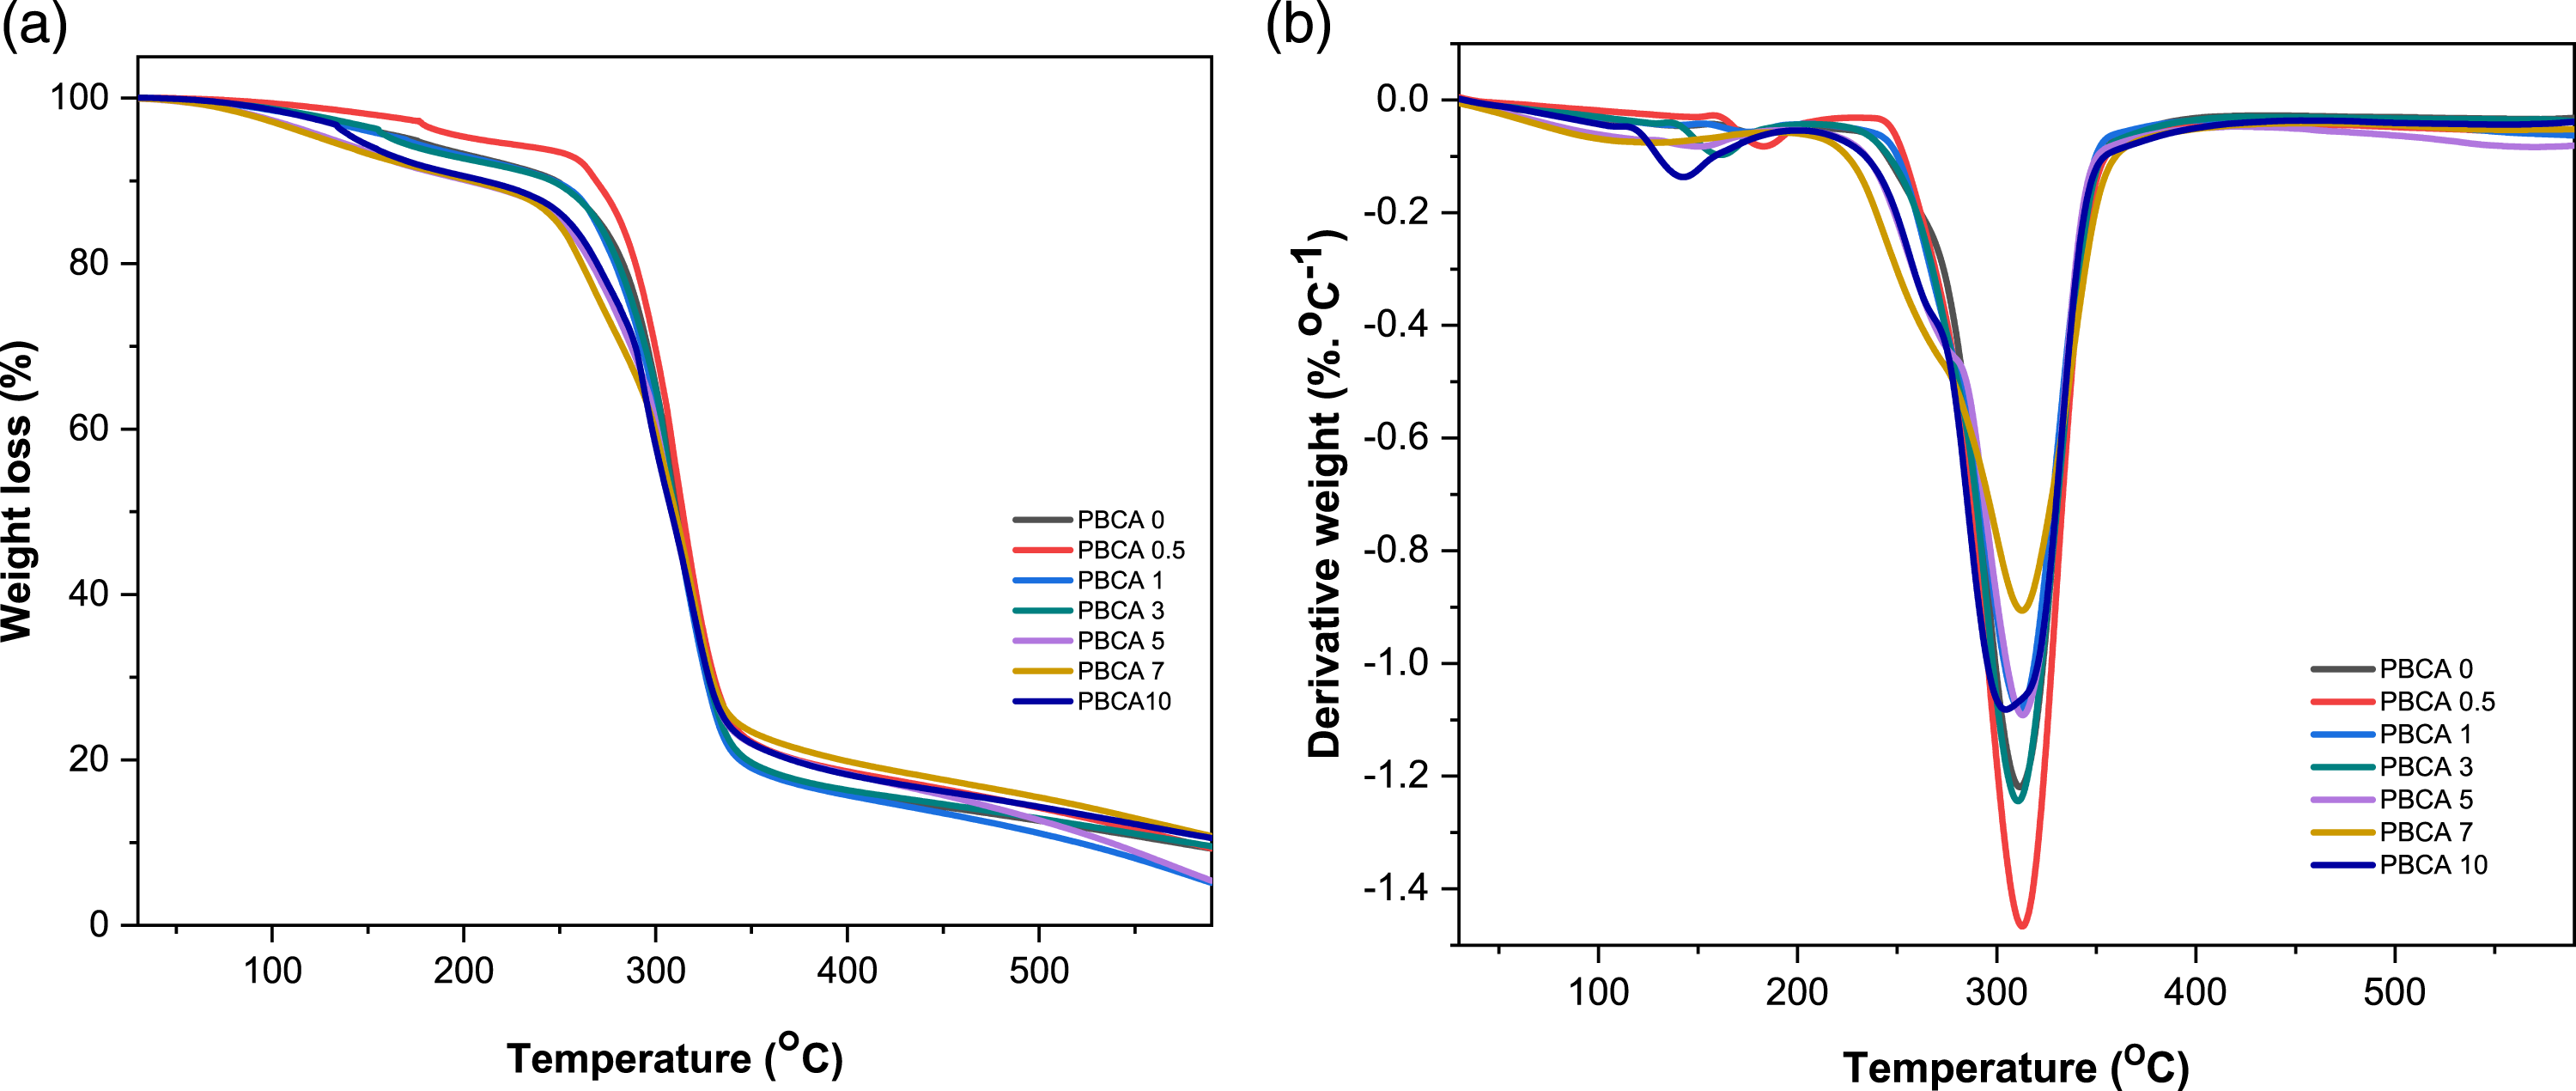
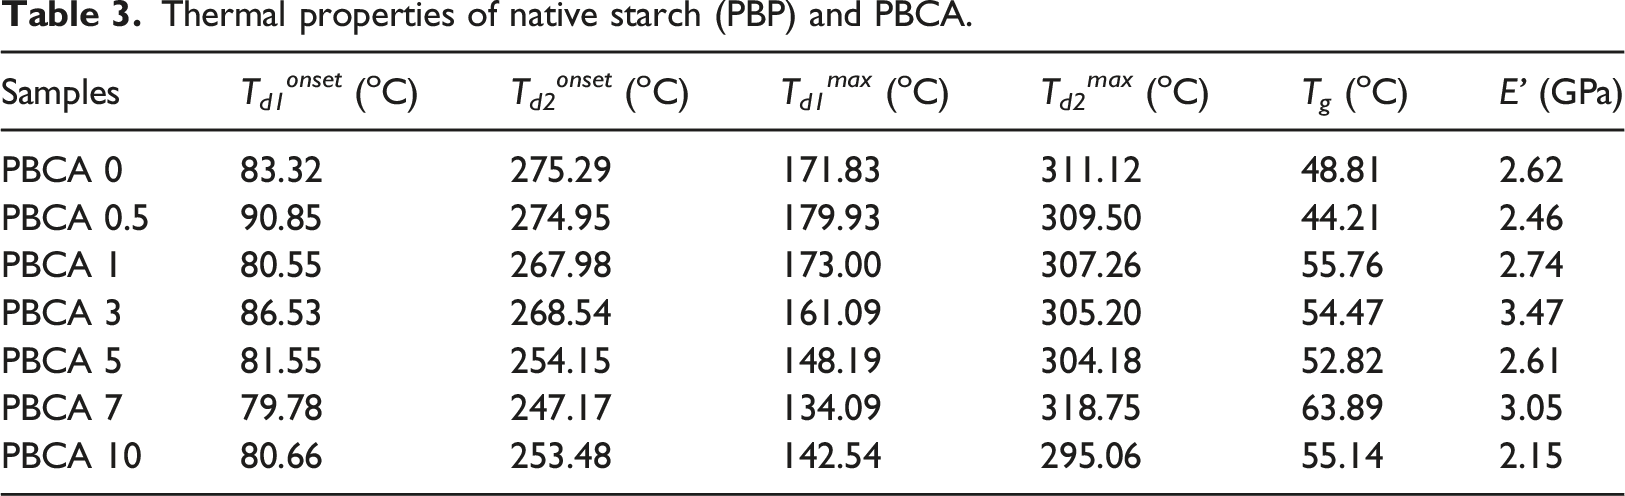
Meanwhile the DTG curves of PBCA typically have two maximum degradation temperature (T d max) showed in Figure 7(b).) DTG curve showed maximum decomposition rate temperature. The first step (T d1 max) occurred from 134.09°C to around 179.93°C is associated with the initial stage of thermal decomposition that occurs due evaporation of plasticizer and water. (T d2 max) occurred from 295.06°C to around 318.75°C. The second step (T d2 max) maximum decomposition rate temperature of PBCA, T d2 max thermoplastic starch without citric acid is 311.12°C but the presence of citric acid showed obviously lower value down to 295.06°C (PBCA 10). The lower value indicated destruction of crystalline structure of the starch by citric acid. 42 This phenomenon is also supported with XRD results showing peak crystallinity displacement in PBCA samples as seen in Figure 6.
The viscoelastic properties of PBCAs were measured by DMA. The addition of citric acid into PBCA 0 influences elastic response slightly, which is shown in the storage modulus of the PBCA (Figure 8(a)). The PBCA 0 displays a storage modulus (E’) of 2.62 GPa at 25°C and increases up to 3.47 GPa (PBCA 3), implying the stiffening effect of citric acid which also confirms in Young’s modulus value in PBCA 3 of 1.16 MPa had higher value than PBCA 0 of 0.89 MPa (Table 3). Representative DMA for (a) Storage modulus (E’) and (b) tan δ TPS.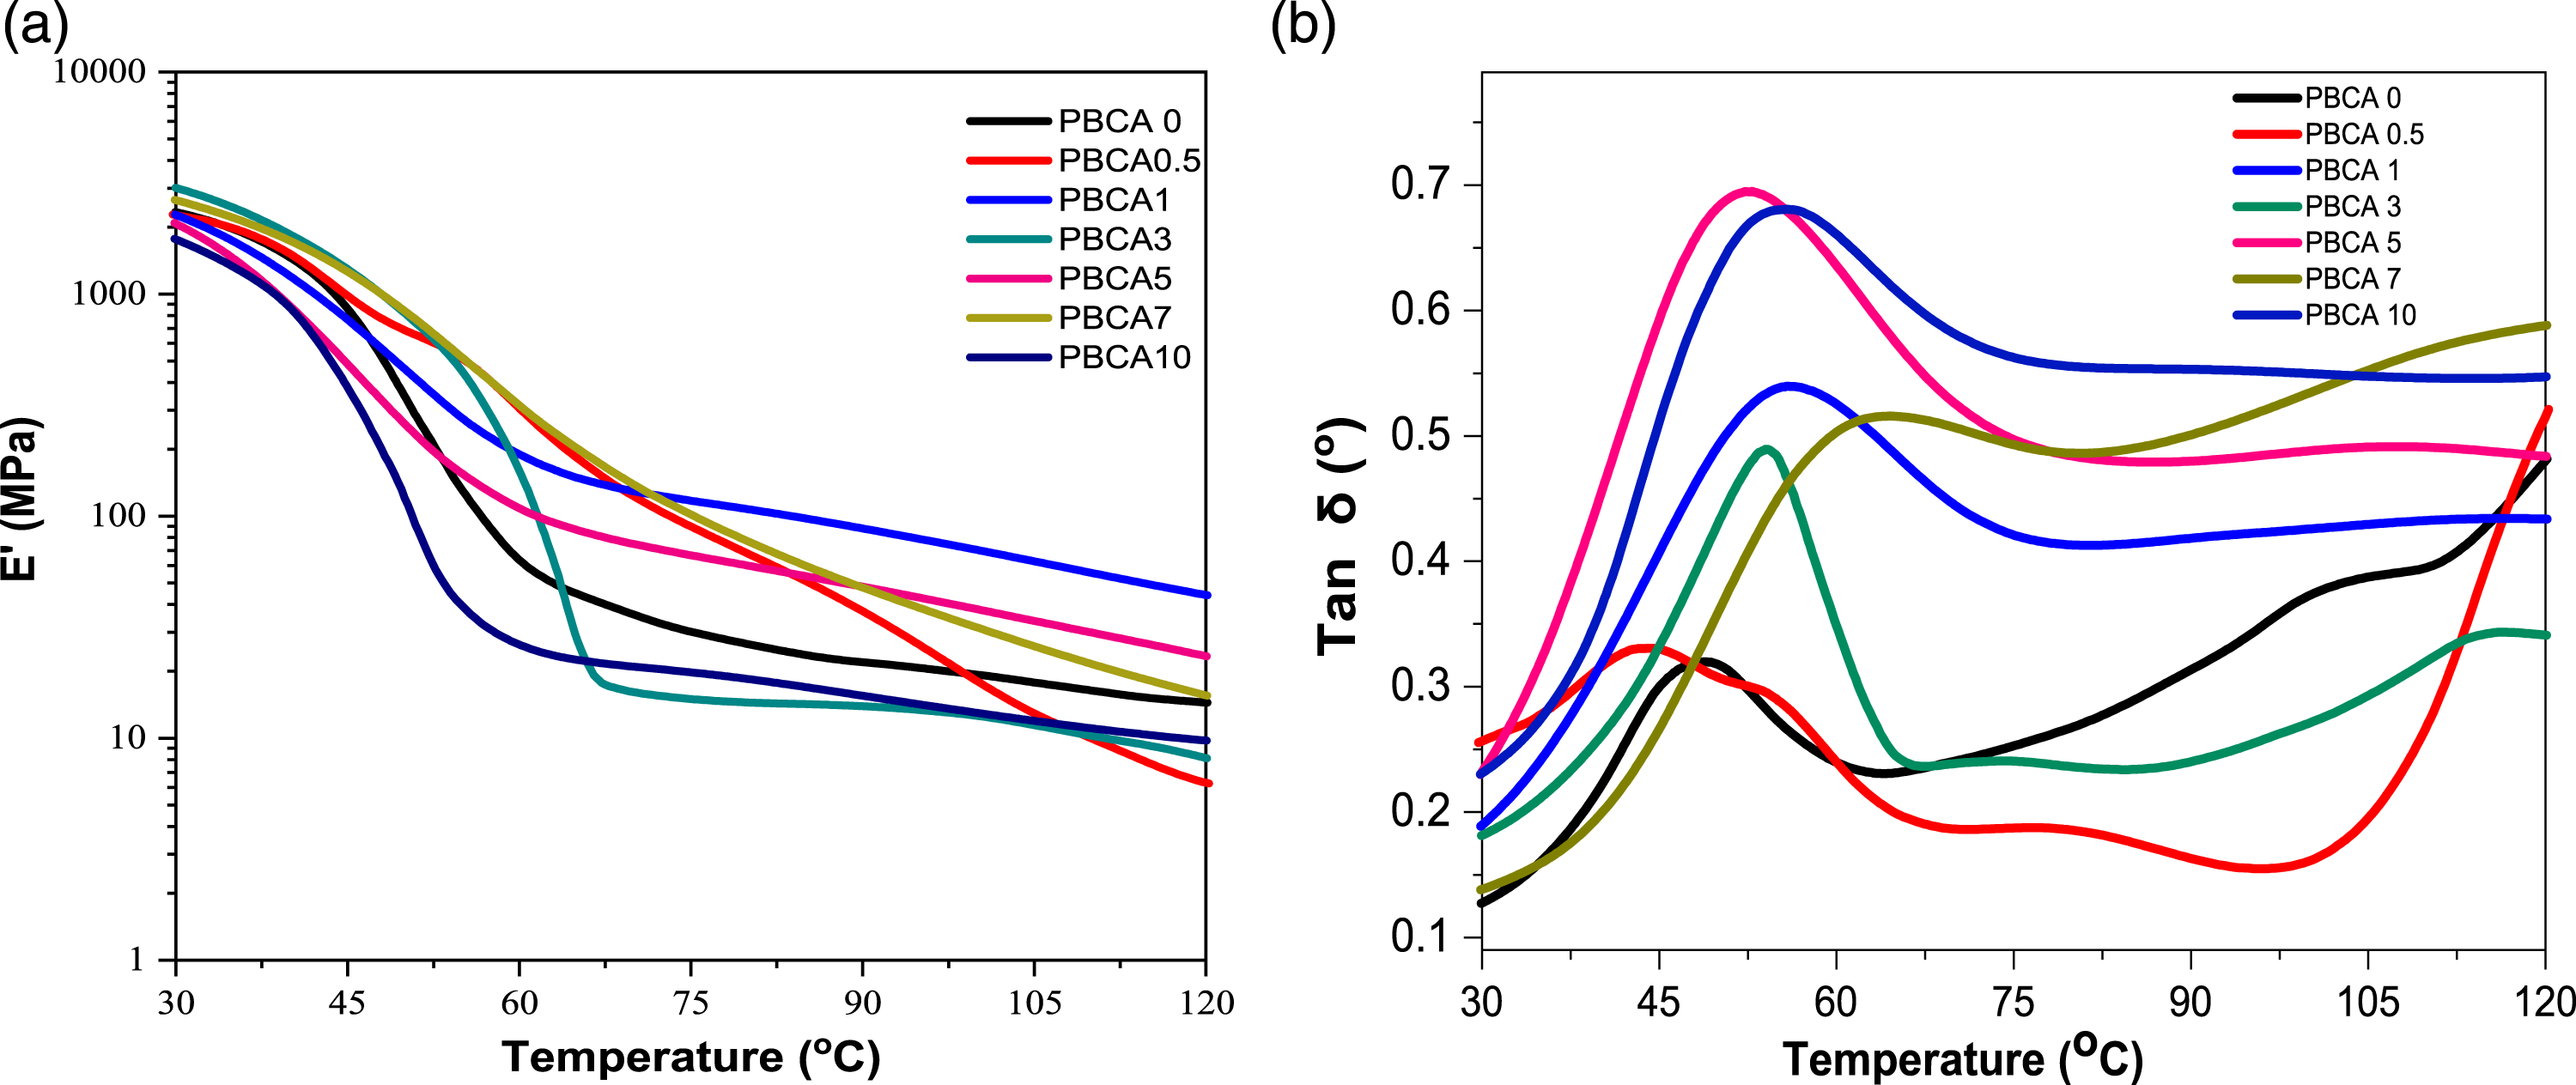
High E’ in PPBCA 3 could be mean that the material is stiffer and more resistant to deformation. This is attributed to the poor mobility and direction of the starch chains during the melt mixing process, as well as the actually that the majority of the residual starch granules attached in matrix of amylose and amylopectin groups, which can increase stiffness and trigger binding between intramolecular hydrogen bonds in starch, citric acid, and plasticizer.9,43,44
Figure 8(b) illustrates tan δ profiles of each sample which displays a single peak associated with the δ-relaxation transition. 45 From the peak of tan δ (Figure 8(b)) we can determine the glass transition temperature (T g ) of sample. The addition of citric acid actually increases the T g temperature of PBCA 0 from 48.81 ° to 63.89 ° (PBCA 7). It might be because the presence of citric acid hinders the molecular mobility, so T g increases.
Degradability performance
Figure 9 displays degradability process of the PBCA 0 and PBCA 1 wt% – 10% film from day 0 to day 10. Every 2 days the films were weighed and observed. The result shows that every 2 days the sample shrinks and break into several pieces. From day 2 to day 6, there was mass increase of all samples due to heavy rainfall in the burial area so the sample were absorbed water and influence the weight. Biodegradable PBCA 1 used the soil burial test method throughout 10 days; (a) day 0, (b) day 2, (c) day 4, (d) day 6.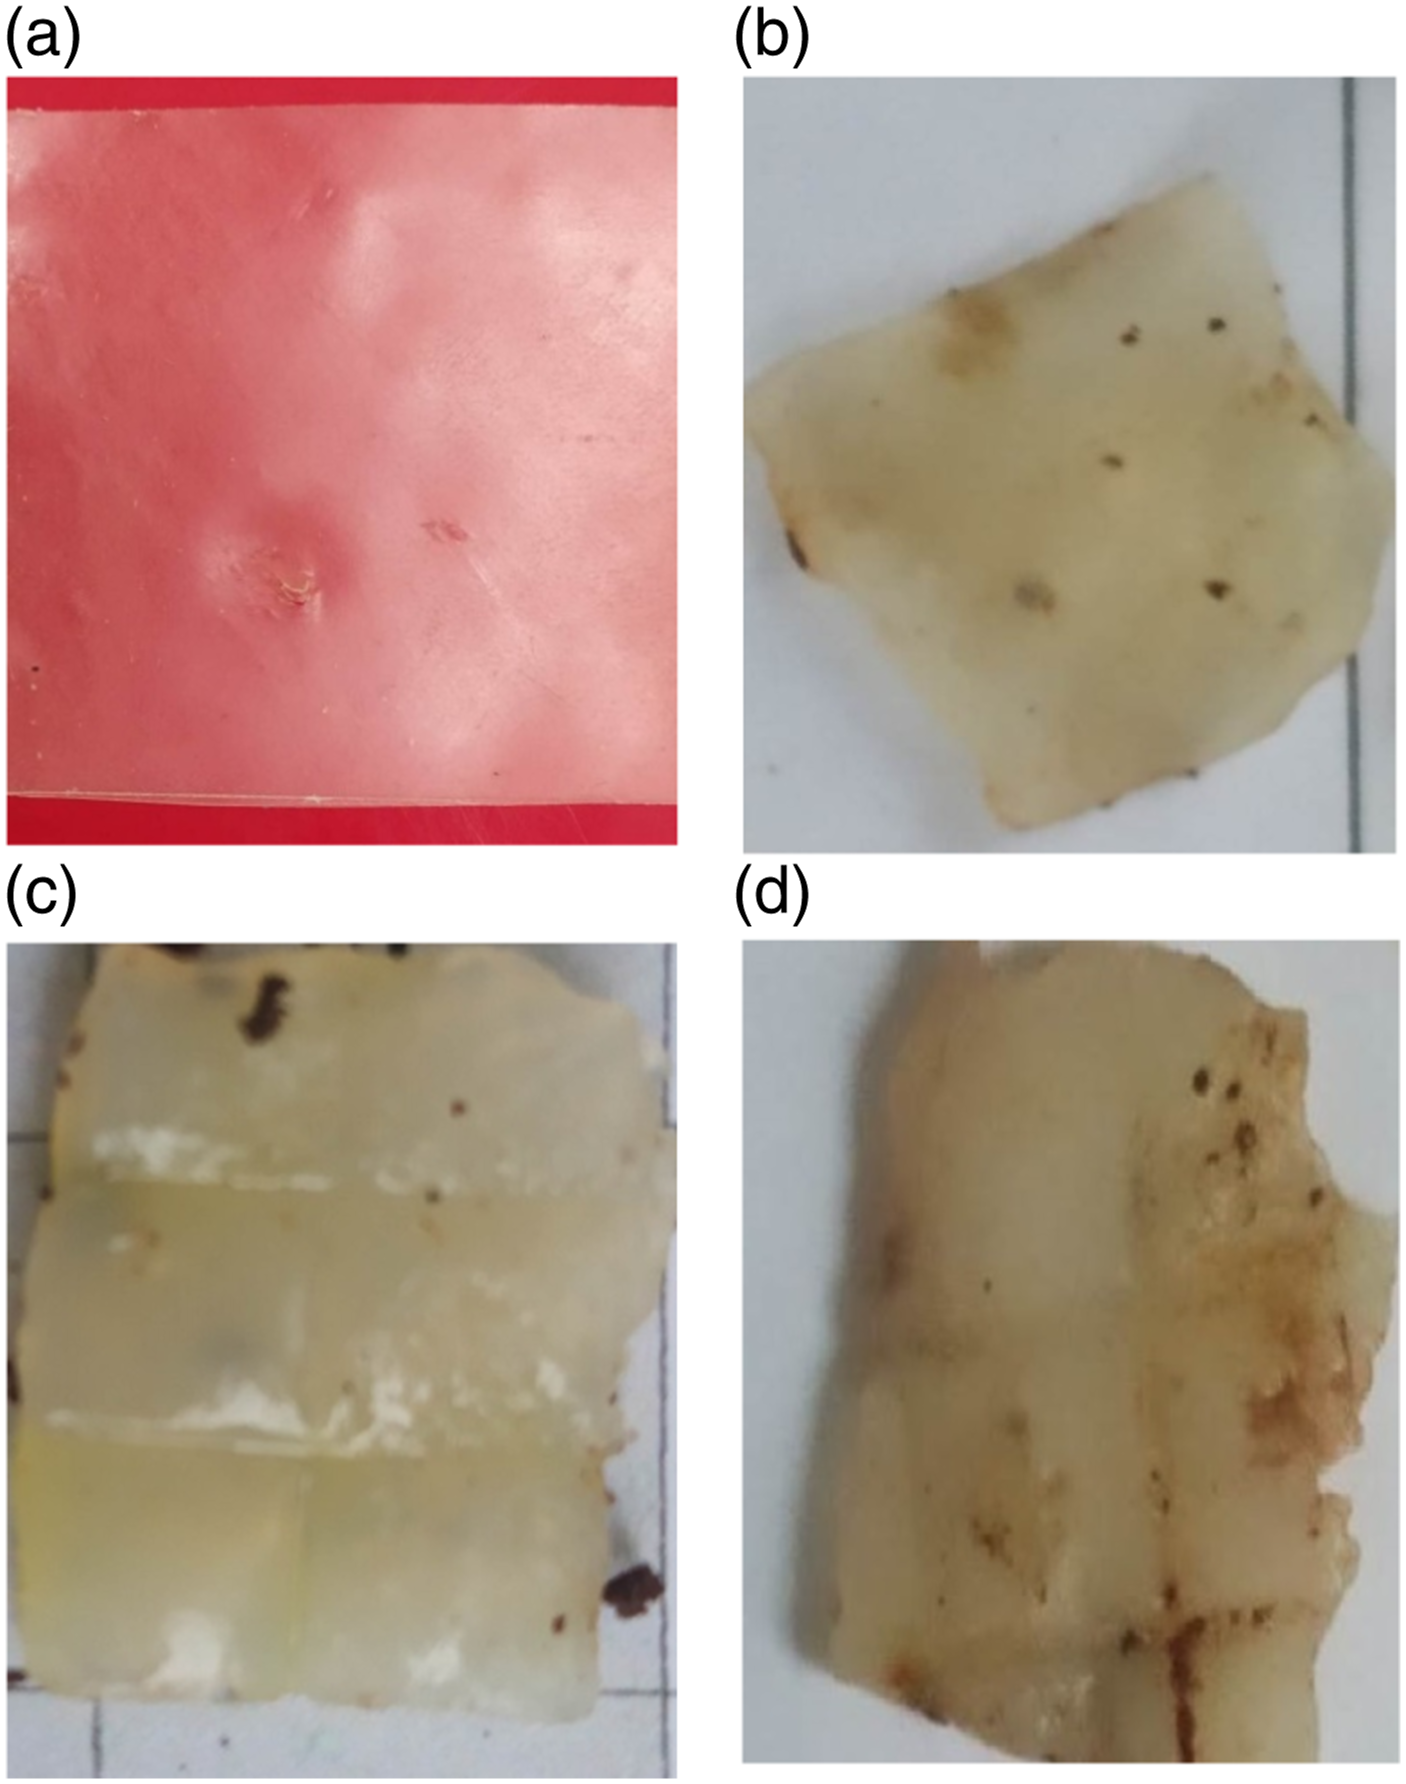
Figure 10 shows weight loss progress of PBCA for every 2 days. The weight increases from 0.11 g to 0.18 g at PBCA 1. In day 8 to day 10 the sample split into several parts, beside of that this case related to Pang et al. who reported maximum water absorption of thermoplastic starch reached after 5 days (18,9%) and after reaching a plateau, the water uptake dropped significantly. This was most probably brought about through the partial leaching or dissolving of starch into the water.
46
After 6 days of observation, the weight increases 48.26% at PBCA 3. It was due to the absorption of water by the sample which illustrates as a minus in Figure 10. Day 10, PBCA 0 and PBCA 10 lost weight 91.07% – 100%, due to the raining stops and degradation process start again. This result is confirmed with FTIR analysis in Figure 3. PBCA 7 and 10 had high peak at 3306 cm−1 for the OH group, makes faster degraded because the larger hydroxyl content inside the PBCA gathered O2 from the soil environment easily and attracted the microbiological.
47
The soil has more nutrients and that synergistic interactions between the activities of many microorganisms (bacteria and fungi) harm the macrostructure of bioplastic samples.
48
Weight loss of TPS using soil burial test method for 2–6 days.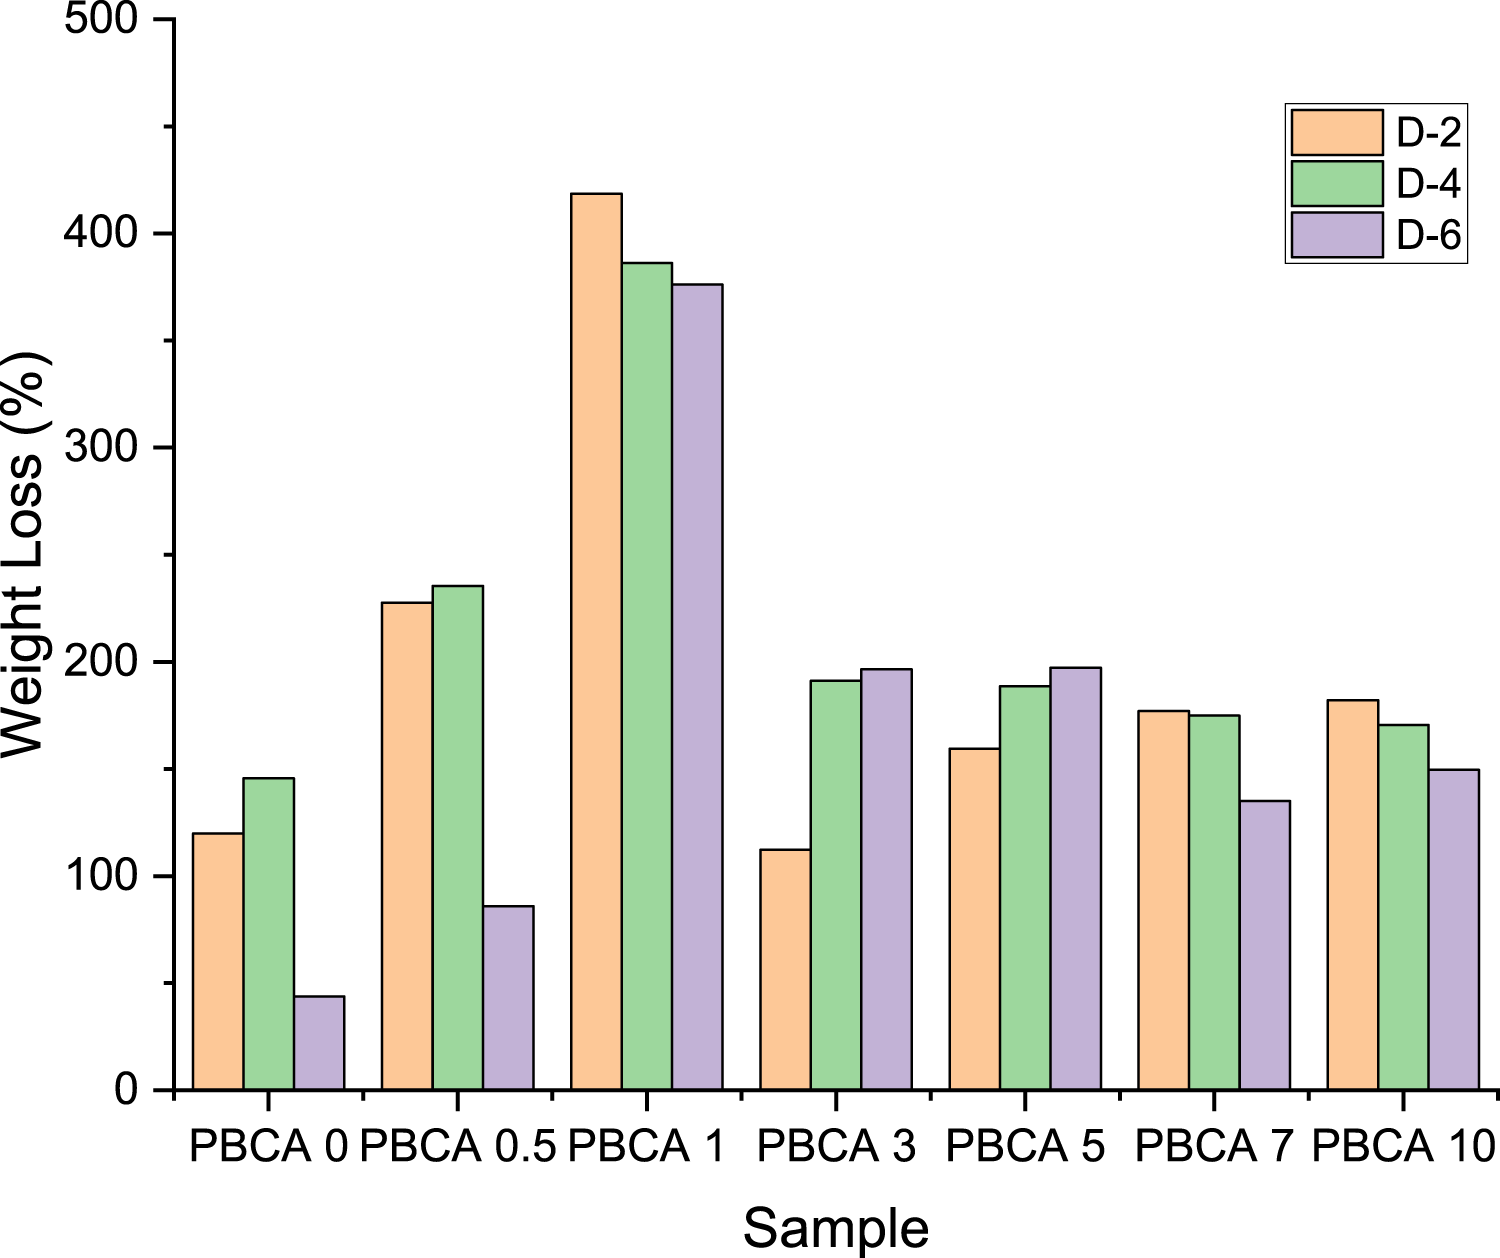
Conclusions
Thermoplastic starch was prepared from bitter casava starch and isosorbide. Citric acid was added as an additive and the influence of it was investigated. The addition of citric acid slightly improves the tensile properties such as tensile strength from 8.68 MPa to 11.98 MPa. The loading of citric acid shifts the crystallinity peak of the sample from 18.99°C (PBCA0) to 18.76°C. WVTR of PBCA still below the WVTR from JIS (0.00166 g.m−2s−1) in a range of 0.011 g.m−2s−1 to 0.042 g.m−2s−1. It is might because there is residual starch granule remain after melt mixing process which influence the gas permeation process. The presence of citric acid in PBCA increase T g up to 63.89°C and storage modulus up to 3.47 GPa. The biodegradability performance of the film was observed with soil burial test, which after 6 days the weight loss increases, indicating the effective degradation process. Overall, the addition of citric acid to isosorbide plasticized starch film can be considered as brittle plastic substitution. However, effective melt mixing method should be performed to obtain an optimum result.
Footnotes
Acknowledgements
Arfiathi thanks to BRIN for the financial support during study.
Author contributions
Arfiathi: Experiments, Methodology, Formal analysis, Investigation, Data curation, Writing – original draft. Yeyen Nurhamiyah: Conceptualization, Methodology, Validation, Writing – review, editing, supervised during the study. Riska Sumirat: Methodology, Formal analysis, writing supports. Firda Aulya Syamani and Muhammad Adly Rahandi Lubis were responsible for Writing-review, and editing. All the authors read and approved the final manuscript.
Declaration of conflicting interests
The author(s) declared no potential conflicts of interest with respect to the research, authorship, and/or publication of this article.
Funding
The author(s) disclosed receipt of the following financial support for the research, authorship, and/or publication of this article: This work was supported by the Badan Riset dan Inovasi Nasional Rumah Program Material Maju No. 2/III/HK/2022.