
Abstract
Owing to the increase in demand on bio-degradable materials, the present researches focus on the development of materials with full degradability. This research is intended to develop a bio-resin–based composite from senegalia catechu gum for light load automotive applications. The bio-resin obtained from the plant is processed with commercial polyester in order to make it as a functional resin for composite preparation. The synthesized resin is made in the form of structural materials by adding jute reinforcements in varying proportions. An extensive study on the various characters in comparison with the synthetic resin–based composites has been done which includes mechanical strengths analysis and thermal characters investigation. It is revealed that the bio-resin–based composites are good against tensile, flexural and impact loads as compared to that of the synthetic resin composites. In addition, it has been witnessed that the material with 40% weight of jute fabric is apt for offering highest resistance against tensile, flexural and impact loads. Micro-structural investigations proved that the bio-resin–based composites are superior in reducing the flaws and enhancing the bonding of resin with fibres as compared to that of the synthetic resin-based composites. Further, the thermal characterization showed that the bio-resin–based composites have high thermal stability as compared to the synthetic composites, and hence, a positive sign is obtained for bio-resin–based composites in both mechanical and thermal characters.
Introduction
The impact of synthetic composite materials on bio-degradability and recycling ability made the researchers to look for substitute materials derived from nature. Over the decades, synthetic reinforcements like glass, carbon and kevlar are extensively analysed, and it is realized that they are good in mechanical characters but are not degradable when buried under the ground. As a solution, fibres derived from natural sources have been used as reinforcements and revealed that they help in improving the degradability of composites.1–6 Though green fibres are used in materials, they would partially enhance the degradability as the matrix material used is not degradable. In order to make a fully degradable material, both the matrix as well as the reinforcements must be degradable. This made the present scientists to look for a natural matrix material as an alternative for the synthetic polymers.7–9 Apart from degradability, these green resins also improve the mechanical strengths, lowers the weight, enhances the ease of processing and reduces the cost,10,11 and thus, these materials are used as structural components in automobiles, aircrafts and civil industries.12–15 Green resins are obtained while destructing plants. Plants such as rubber, banana, moringa, urushi, aloe vera, tamarind, guar, fenugreek, soya bean, okra, hibiscus, karaya and catechu are known for their resins. Although these green resins are majorly used in pharmaceutics and food industry, investigations have also been done to study the suitability of green resins for composite materials. Some recent studies have proved that the green resins such as soya-bean oil, starch, banana sap, drum stick and humins are suitable for structural composite manufacturing.16–22
A green resin needs synthesis with suitable chemicals and heating in order to convert it in to a functional resin and also improve the characters such as bonding ability, hydrophobicity and degradability. Especially, the moisture absorption nature of green fibres in a composite material is alleviated by the chemically processed green resins by appropriately reacting with the hydrophilic groups of the green fibres. On the other hand, the interfacial adhesion between the fibre and matrix is highly improved by the chemically processed green resins helping to transfer the stress uniformly in the matrix and to the fibres.23,24 The use of soy protein as a matrix has been investigated and disclosed that an improved interfacial adhesion is obtained helping the composite to bear high level loads. 25 The mechanical strengths and other characters of composite materials are not only decided by the resin and reinforcements, but also on the other agents such as fillers, plasticizers and cross-linking agents which are added at the time of composite fabrication. Glutaraldehyde as a cross-linking agent plays a dominant role in fixing the tensile strength, flexural strength, bio-degradability and water absorption of the composite materials, whereas the poly vinyl alcohol as the plasticizer helps for consolidation of the material. 26 Interfacial adhesion may also be improved by giving chemical treatments to green reinforcements used in the composites. Many such studies have been reported by using several chemicals such as sodium hydroxide, potassium hydroxide, hydrogen peroxide, sodium bicarbonate, benzoyl chloride and organosilane.27–30 Realizing the significance of chemical treatments, nowadays the commercial developers of green fibres produce products in various forms by adopting one of the chemical pre-processing techniques.
Hybrid resin has been formulated by using banana sap as the green resin in a three-stage process. In the first stage, maleic anhydride and propylene glycol are combined to form polypropylene maleate. Secondly, the polypropylene maleate is made to react with styrene monomer during which the double bonds breaks and cross-linking takes place. Finally, the maleate is made to react with banana sap resulting in removal of water from banana sap, attachment of ester with the maleate and formation of banana sap resin. The formulated resin has been used for fabrication of composite materials and a detailed characterization is made. 20 Starch-based green resin is epoxidized before fabrication of green composite materials by using epoxidized cardanol and toluene solutions. The chemical reaction is done for about 24 h with continuous stirring and heating at 130°C. The resulting epoxidized starch is filtered, dried and used for fabrication of green composites. 31 Like this, the formulation of green resin and their characterization has been done in several ways for sugar, triglyceride, cashew nut resin and soya bean oil.32–35 Senegalia catechu is a deciduous plant mainly found in southern parts of Asia. It is a thorny plant and it is mainly destructed for timber and for its gum which is called as catechu or cutch. Catechu is used as a colouring agent which gives red colour for food items. Catechu is very hard and by heating with water, it becomes liquid. Catechu resin has been as a dyeing agent for colouring silk products. The dye is formulated by diazotization reaction during which the catechu resin is treated with benzene diazonium chloride solution forming azo dye. 36 Isolation of catechin from catechu resin has been reported, and then it is treated with chemicals such as alkali, dimethyl sulphate and benzoyl chloride to make different types of colouring dyes. 37 Catechu resin acts as an effective corrosion inhibitor for mild steel by developing a protective layer on the steel surface. 38 The research on catechu resin is mainly focussed on preparing colouring agents and corrosion inhibitors in various field, and no reports were found for the formulation of catechu as a functional resin for structural composite materials. Hence, the present research is focussed on the preparation of catechu bio-resin and followed by development and characterization of composite materials for light load applications.
Experimental
Preparation of composites
Catechu gum is obtained in the form of pellets from a local supplier and is finely powdered to a particle size of 0.5 mm. The powder is soaked in water in the ratio of 1:1 by weight for 24 h during which the catechu particles mix with water and there is no separation of water either on top or at the bottom of the beaker. This solution is then mixed in isopthalic polyester resin of grade SKR 2101 with a viscocity of 550 cP, in the ratio of 1:1 by weight. The mixture is heated in a beaker at 80°C and stirred well by motorized stirrer for about 2 h. During this treatment, the catechu and polyester solutions are mixed well to form a uniform resin named as catechu-polyester (CP) resin. The step-by-step route followed during this synthesis is detailed in Figure 1. A 0o/90o woven jute mat with an L/D ratio of 260 is used as the reinforcement during composite fabrication. The mat is thoroughly washed in distilled water and dried in sunlight to remove the dust and other unwanted particles resent in it. On the other hand, synthetic-polyester (SP) resin has been used to prepare synthetic resin–based composites. To complete the polymerization process, cobalt naphthenate is used as the accelerator and methyl ethyl ketone peroxide is used as the catalyst. Eight composite materials have been prepared in various resin-fibre proportions by using a compression moulding machine with a die size of 30 cm x 30 cm x 0.6 cm. The weight compositions of developed composites are listed in Table 1. Synthesis of catechu resin and composite fabrication. Compositions of composites.

Testing procedures
Fourier-transform infrared (FTIR) spectroscopy study has been carried out on the fabricated composites by using Shimadzu IRTracer-100 spectrometer in the range of 4000–4500 cm−1. The percentage transmittance of molecules is recorded against the wave number. The fabricated composites are subjected to mechanical characterization according to ASTM standards. Tensile, flexural and impact testing are done by using ASTM D638-03, D790 and D256 standards at room temperature, respectively. During the tensile and flexural tests, the stress–strain plot and the ultimate strengths and modulus have been noted. Tensile and flexural tests have been carried out in an Instron 5980 universal testing machine and the Izod impact test is done by using a 45o notched sample in Instron CEAST 9050 pendulum impact testing machine. For each test, three samples have been cut at different locations on the developed composites and an average of three readings is noted.
Surface morphology of the fractured composites has been studied by using Zeiss Evo 18 scanning electron microscope (SEM). The machine operates at an accelerating voltage of 5 kV in the secondary electron mode and has a maximum resolution of x106. Before this testing, the fractured surface is coated with gold by using plasma sputtering machine to prevent charging of the surface. Differential scanning calorimetric (DSC) testing has been conducted by using Netzsch 404 F1 calorimeter under nitrogen atmosphere with samples approximately weighing 15 mg. The working temperature has been set between 30°C and 450°C with a heating rate at 5°C/min. Thermal gravimetric analysis (TGA) has been done to study the mass loss as a result of heating by using Netzsch TG 209 analyser. Samples of 15 mg weight has been taken in the ceramic pan and then heated from 30°C to 700°C under atmospheric air with a temperature raise of 10°C/min.
Fourier-transform infrared characterization
The chemical constituents present in the formulated CP resin composites have been studied by using FTIR analysis as detailed in Figure 2. The peak obtained at 3395 cm−1 corresponds to the stretching vibration of alcohol (OH stretch) group. This peak slightly appears in composite CP1, but the peak intensity increases for CP2, CP3 and CP4 composites, respectively, which gives an evidence that there is an elevation in the hydrogen bonding due to the increase in the jute content .
39
The peaks obtained at 2922 cm−1 correspond to the stretching vibration of C-H bond of methyl group, whereas the peak at 2870 cm−1 is allocated for the C-H bond of methylene. The peak at 2355 cm−1 may be attributed to the stretching vibration of C FTIR spectra of CP composites. FTIR: Fourier-transform infrared.
Figure 3 details the FTIR study of SP composites. The curves obtained for various SP composites looks similar to that of the previously done research works.40,41 All the curves are similar in nature with meagre variations in the existence of vibration peaks. The peak at a stretching vibration of 3430 cm−1 represents the presence of alcohol (OH) group. This peak is somewhat broadened in SP3 and SP4 composites evidencing the increase in hydrogen bonding. The peak at 3030 and at 2930 cm−1 represents the stretching vibration of alkane (= C – H) group. The stretching vibration at a peak of 1730 cm−1 denotes the presence of aldehydes (C = O) and the peak at 1600 cm−1 corresponds to amides (NH). Carboxylic acid existence is noted at a peak of 1580 cm−1 and alkyl halides (C – F) is noted at a peak of 1280 cm−1.
42
The stretching vibration at a peak of 1070 cm−1 corresponds to amines (C – N) and the 740 cm−1 peak in the fingerprint region represents the presence of benzene. FTIR spectra of SP composites. FTIR: Fourier-transform infrared.
Mechanical characterization
Tensile properties
The tensile strength plot and tensile modulus plot are shown in Figure 4. Both the plots resemble same showing a peak value for the sample CP3. As far as CP composites are concerned, a 10 wt % hike in the jute content improves the strength by 25.4% and a 20 wt % hike increases the strength by 28.13%. Increase in the jute composition enhances the tensile strength and modulus until 40 wt % and declines for further increase. Though this behaviour is common for both SP composites and CP composites, the performance is majorly dominated by CP composites under all compositions. This clearly represents that CP composites have more capacity in resisting the tensile load as compared to that of the SP composites. Bonding between the jute and matrix plays a dominant role in deciding the tensile strength of a composite and here it has been observed that, CP composites have more bonding capacity than that of the SP composites.
2
Therefore, a positive sign has been obtained by the introduction of catechu resin with a peak tensile strength of 8.88 MPa and a peak tensile modulus of 60.9 MPa. The optimum composition of fibre/matrix during tensile loading is found to be 40/60 wt % by weight in both SP and CP composites. (a) Tensile strength plot; (b) tensile modulus plot.
Tensile stress–strain analysis is depicted in Figure 5(a). The tensile stress of all samples goes up with an increase in the load until the ultimate point and then drops with further hike in the applied load. In the low strain region, all the curves are purely elastic as noted from the straight lines whereas in the high strain region, all the samples show a plastic behaviour. This is observed clearly by the non-linear part of the curves in all the samples. The plastic behaviour occurs due to the deformation of the matrix. As the matrix is deformed, micro-cracks are produced, and after the ultimate point these cracks passes through the entire matrix and breaks the bonding with the fibre as a result, the strength rapidly declines.
43
SP1 show a maximum strain of 16% among the SP samples and the strain declines gradually by 15%, 14% and 13%, respectively, for SP2, SP3 and SP4 composites. As the jute fibres are brittle in nature, they do not elongate and break earlier when subjected to tensile loading. As the jute content is gradually hiked from SP1 to SP4, their corresponding strain values goes down proportionately, and thus, the elongating capacity of SP composites directly depends on the fibre content.
2
As far as CP composites are concerned, a maximum strain of 18% is observed in sample CP3. This is followed by samples CP1 and CP2 showing 17% and then by CP4 showing 16%. The decline of strain is not gradual, and the difference between the maximum and minimum strain is also meagre. This shows that the shift from plastic to brittle nature of CP composites is hindered by the presence of catechu resin, and thus, jute fibre does not dominate the CP composites during elongation. Hence, CP composites are superior to SP composites in respect to both stress and strain behaviours. (a) Tensile stress–strain plot; (b) flexural stress–strain plot.
Flexural properties
The flexural strength plot and flexural modulus plot are shown in Figure 6. Among the CP composites, a 10 wt % hike in the jute content improves the strength by 20.16% and a 20 wt % hike elevates the strength by 32.44%. Elevation in the jute composition enhances the flexural strength and modulus until 40 wt % and declines for further increase, and this behaviour is quite similar to that of the tensile studies. As far as SP composites are concerned, both the flexural strength and modulus goes up with an elevation in the jute content until 50 wt %. Hence, jute fibre plays a dominant role in resisting the bending load for SP composites, and it is culminated that 50 wt % jute content would be the optimum composition for SP composites. During flexure, load is applied laterally on the composite leading to bend and break at the middle of the span. Micro-cracks will be initiated in the matrix before breaking, and on the other hand, the reinforcements try to resist the load to a large extent. During this competitive phenomenon, the reinforcements give its fullest effort and help the composite to bear a maximum flexural load.
44
Comparing SP and CP composites, it is noted that CP composites have more capacity in resisting the bending load as compared to that of the SP composites. Here, it has been observed that CP composites have more bonding capacity than that of the SP composites. Therefore, a positive sign has been obtained by the introduction of catechu resin with a peak flexural strength of 17.8 MPa and a peak flexural modulus of 1618 MPa. The optimum composition of fibre/matrix during flexural loading is found to be 40/60 wt % for CP composites and 50/50 wt % for SP composites. (a) Flexural strength plot; (b) flexural modulus plot.
The flexural stress–strain analysis is shown in Figure 5(b). The plot resembles like the tensile plot showing elastic nature at the low strain region and plastic nature in the medium and at high strain region. Once the ultimate point is reached, micro-cracks are initiated in the matrix in all the directions. Failure of the composite is attributed by progression of micro-cracks in the matrix leading to separation of fibre and matrix. 45 Comparing tensile and flexural plots, it is observed that the strain levels of all composites are higher than that of tensile strains. A maximum strain of 20% is attained by sample CP1, and this is followed by SP1 showing 19%, CP2 showing 18%, SP2 and CP3 showing 17%, SP3 and CP4 showing 16% and SP4 showing 15%. The flexural strains levels are elevated at an average value of 12% for all samples as compared to tensile strains which shows that the bending capacity of all composites are far good. In both the SP and CP composites, it is obvious that elevation in the jute content dwindles the strain. This shows that the jute fibres are weak in handling the bending loads, whereas both the matrices are susceptible to flexural load and helps the composite to withstand a maximum loading. 46 Comparing the SP and CP composites, it is noted that the maximum strain of CP composites is 1% ahead of SP composites which reveals that the bending ability is enhanced by introducing the catechu resin in the matrix.
Impact properties
The behaviour of composites under impact load is studied by using impact strength analysis as presented in Figure 7. The influence of jute fibres plays a vital role in deciding the impact strength of composites. When an impact load is applied, failure starts with tensile bending of the top layer and compressive bending of the bottom layer of the sample under study. The fibres present inside the sample offer maximum resistance to the impact load as they are capable for bending to a large extent. During the breakage, the fibres are pulled outside the matrix developing a huge tensile stress on the fibres, and thus, the pull-out force finally decides the impact strength of the composite sample.
47
The fibre pull-outs will be more on these samples as compared to that of the broken samples in tensile and flexural tests. Unlike tensile and flexural strengths, there is a linear elevation in the impact strength with a hike in the fibre content for CP composites. Among the CP composites, a 10 wt % hike in the jute content improves the impact strength by 35% and a 20 wt % hike in the jute elevates the strength by 61%. Further, a 30 wt % hike in jute content increases the strength by 64%. Comparing CP3 and CP4, there seems to be only a 3% increase in the impact strength showing that jute content beyond 50 wt % does not helps to elevate the impact strength. Hence, a maximum of 50% by weight of jute is the optimum content to be added to acquire optimum impact strength of 5.02 kJ/m2. On the other hand, a maximum impact strength of 4.1 kJ/m2 is exhibited by sample SP3 among the SP composites and a hike in the jute beyond 40 wt % declines the impact strength. This shows that SP matrix fails to bond the fibres properly in all directions and thus breaks at an earlier stage. Comparing the behaviours of SP and CP composites, it is clearly culminated that the interface strength between the fibre and matrix is highly improved by the usage of catechu resin in the matrix material. Impact strength plot.
Morphological analysis
The surface morphological analysis has been done on the fractured samples of tensile test by using scanning electron microscopy as detailed in Figure 8. The morphological study gives a vivid picture on the various shortcomings present in the matrix and fibre before and after failure. Figures 8(a) and (b) show the morphologies of composite SP1 and CP1 exhibiting majority of flaws such as fibre pull-outs, voids, matrix cracks and fibre breakage. Matrix cavity is observed in the composites mainly due to improper filling of the resin during composite preparation. Whenever the sample is loaded beyond the ultimate point, fibres are heavily stressed and pulled out of the matrix, and as a result of these fibre pull-outs, voids are produced in the matrix.
48
When the material starts to fail, cracks are initiated in the matrix and it travels in the direction where there is a weak bonding between the fibre and matrix. Once the cracks are travelled to the extremities of the composite, matrix and fibres are separated leading to complete failure of the composite. Figures 8(c) and (d) detail the morphologies of composite SP2 and CP2, respectively, showing some of the flaws such as micro-holes and fibre pull-outs. Micro-holes are produced in the matrix at some weaker regions during the propagation of cracks. Figures 8(e) and (f) detail the morphologies of composites SP3 and CP3, respectively. As compared to samples SP1, CP1, SP2 and CP2, there seems to be very few shortcomings such as micro-holes and fibre pull-outs in both SP3 and CP3. In the morphology of CP3, the matrix is clearly visible as a uniform region and there are no visibility of cracks and cavities. In addition, fibre-matrix interface is clear-cut without any separation between them. This clearly proves that the CP resin properly surrounds the jute fibre and makes proper bonding with it. Thus, CP3 is capable of resisting a maximum load as compared to that of the remaining composites. Figures 8(g) and (h) show the morphologies of composite SP4 and CP4, respectively, exhibiting few flaws such as cavities. The bonding between the fibre and matrix seems good, and the fibre breakage takes place at the fibre-matrix junction alleviating the fibre pull-outs and thus makes the composites SP4 and CP4 to produce a comparable tensile stress with that of the SP3 and CP3 composites. SEM images of fractured samples (a) SP1; (b) CP1; (c) SP2; (d) CP2; (e) SP3; (f) CP3; (g) SP4; (h) CP4.
Thermal characterization
Differential scanning calorimetric analysis
The DSC plots of CP composites as detailed in Figure 9(a) shows three major regions, namely, the glass transition region, crystallization region and the melting region. Glass transition point is the temperature (Tg) at which the composite changes its plastic character to brittle character which occurred at around 76 C for composite CP2, 78°C for composite CP1, 79°C for composite CP3 and 80°C for CP4. There is a gradual elevation in the occurrence of Tg from CP1 to CP4 representing that CP1 and CP2 containing high amount of catechu resin in the matrix and they are diluted to a greater extent than other composites. This is caused due to the unreactive components present in the matrix resin remaining as a free plasticizer.
20
Crystallization is the region where the mobility of polymer chains is raised and form some ordered arrangements. Crystallization occurred at a peak temperature (Tc) of 262.2°C for composite CP2, 265.3°C for composite CP1, 245.7°C for composite CP3 and 270.2°C for composite CP4. The occurrence of Tc for CP3 at an earlier stage shows that the atoms are free to make ordered structure and postpones the melting stage. In between the glass transition region and crystallization regions, a small shoulder is visualized at a temperature of 220°C, and this may be due to the presence of additives such as accelerator and catalyst added during composite preparation.
49
The final region is the melting point and at the point of melting, the polymer chains are free to dislocate in all directions and thus they will not in an order. The melting point (Tm) of all composite samples is very closer to each other and occurs at around 368°C for sample CP1, CP2 and CP4, whereas sample CP3 shows a slightly elevated Tm of 370 C which is due to the interaction between the cellulosic fibre and polymer adhesion. (a) DSC curves for CP samples; (b) DSC curves for SP samples.
DSC plots for SP composites are detailed in Figure 9(b). Although the curves look somewhat similar to that of the CP composites, Tg occurs too earlier at a temperature less than 50 C. This shows that SP composites are diluted at a temperature less than that of the CP composites. Crystallization peaks obtained in SP composites are not closer to each other like the CP composites. Sample SP1 shows a crystallization peak at a temperature of 245 C and sample SP2 showing it at a temperature of 248 C. Sample SP3 shows the crystallization at a peak of 236 C and sample SP4 showing it at a temperature of 244 C. Like CP3, sample SP3 also shows Tc at an earlier stage due to the formation of ordered atomic structure but does not influence on the melting point. This shows that the interaction between fibre and polymer is not dominant in SP composites as compared to CP composites. As compared to CP composites, it is observed that SP composites require lesser heating to acquire the crystallization process showing a maximum for SP2 composite. Melting of SP composites occurs at a temperature less than 350 C which is also smaller than that of the CP composites. A maximum melting temperature has been exhibited by sample SP1 at 348 C and this is followed by sample SP2 and SP4 at 346 C and SP3 sample at 345 C. This clearly indicates that the SP composites have an alleviated capacity of resisting the heat as compared to that of the CP composites.
Thermal gravimetric analysis
The mass loss of the composite samples has been studied against the temperature as plotted in Figure 10. All the composites retain their masses up to a temperature 70–90 C and then start to lose. The first stage of mass loss is observed in the temperature range between 350 C and 380 C and occurs due to the decomposition of cellulose, hemicellulose and pectin present in the jute fibre.
50
The second stage of mass loss is noted at a temperature between 400 C and 450 C and occurs due to the breakage of polymer chains in the matrix. Among the CP composites, sample CP2 exhibits a highest mass retainment of 94% at a temperature of 350 C. This is followed by sample CP1 exhibiting 92%, CP3 exhibiting 90% and CP4 exhibiting 89%. This gives a clear idea that the elevation in the jute content from 20% to 30% helps to enhance the heat resistance of the composite. A further increase in the jute content beyond 30% reduces the thermal stability of the composites.
51
The reason being that as compared to the jute fibres, the CP matrix needs high temperature to break the molecular chain. By the introduction of jute fibres, mobility of molecular chains is elevated leading to decomposition of chains at some regions. Also, due to the plasticization and heterogeneous nucleation, there is a high chance of crystallization resulting in thermal degradation at an earlier stage in samples CP3 and CP4.
52
After a temperature of 350–380°C, there is a sudden drop in the mass for all the composite samples from 85% to 20%. Among the SP composites, it has been noted that SP1 show a maximum thermal stability followed by samples SP2, SP3 and SP4, respectively. This also gives a clear witness that the elevation in the fibre content reduces the thermal stability of the composites. Hence, the mechanism behind failure of composites possessing high fibre content is quite common for both CP and SP composites. After melting at above 450°C, 95% of the mass is degraded and the residue present due to oxygen and carbon will be burnt off at 650°C. TGA curves of CP and SP samples.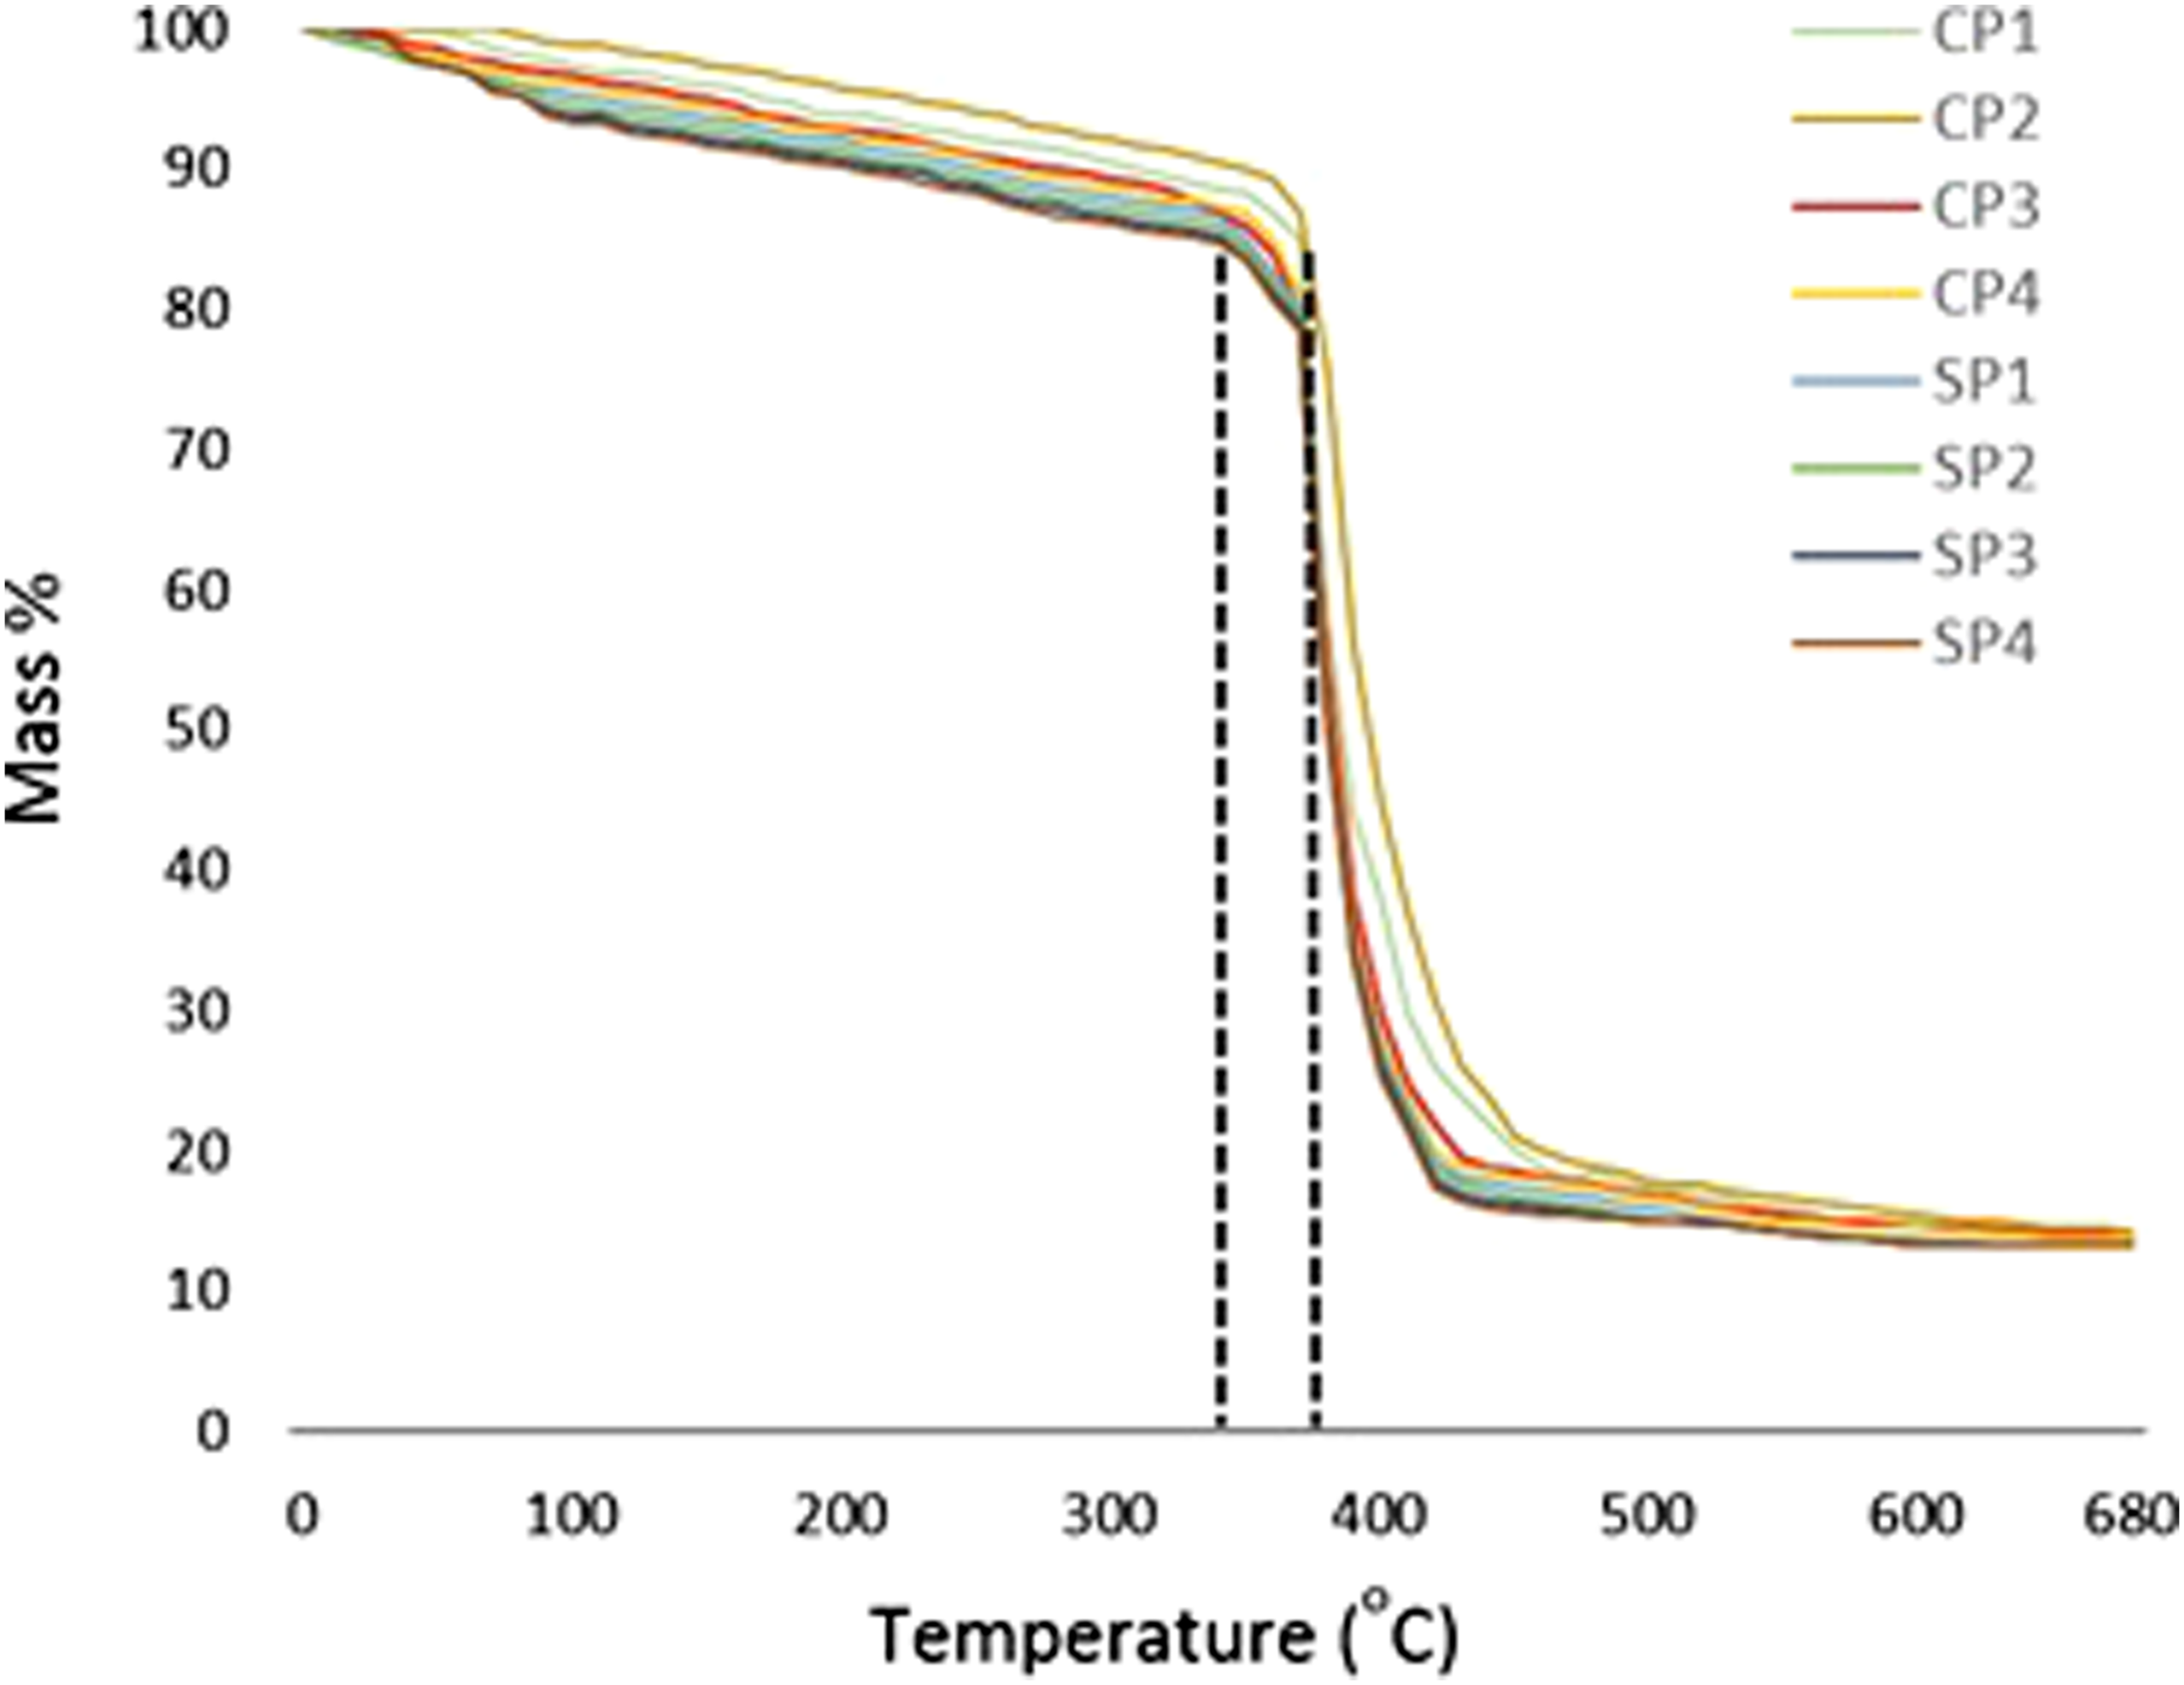
Conclusion
Novel catechu resin has been treated with polyester, and composite samples have been fabricated by using jute as reinforcements in varying compositions. A detailed investigation has been made on the characters of the developed composites in comparison with the synthetic polyester composites and the major conclusions obtained are as follows: Tensile strength and modulus of all CP composites are better than that of SP composites witnessing that CP resin provides adequate bonding with the fibres. A maximum tensile strength has been exhibited by sample CP3 proving that 40/60 by weight as the optimum composition for jute/matrix. Tensile strain behaviour is also dominated by the CP resin making the CP composites to go for an additional deformation as compared to that of the SP composites. Flexural strength and modulus of CP composites are higher than that of the SP composites until a fibre composition of 40%. Jute content plays a dominant role in deciding the flexural strength of the composites and a 50% jute combination is found to be optimum for SP composites. The superior behaviour of CP composites is attributed by the complete interfacial bonding ability of the matrix with the surrounding fibres. As far as flexural strain is concerned, the presence of jute fibres dwindles the strain but CP composites again dominate the SP composites. Impact studies revealed that the fibre pull-out force plays a dominant role in deciding the impact strength. The impact strength is more or less same for CP3 and CP4 composites giving an indication that there is no use of elevating the jute content beyond 50%. Among the SP composites, 40% jute is found to be the optimum proportion, and beyond that, there is a drop in the impact strength. Thermal studies revealed that glass transition is postponed due to the presence of jute fibres. Mass degradation of SP composites starts earlier as compared to that of the CP composites with complete degradation occurring at around 450°C. Elevation of jute content decreases the thermal stability of both SP and CP composites. Both mechanical and thermal characters of CP composites are found to be superior to the SP composites. The synthesis and characterization of catechu resin produced a positive sign, and hence, the present investigation proposes the fabricated composites be suitable for structural applications of automobiles mainly for low temperature usages.
Footnotes
Declaration of conflicting interests
The author(s) declared no potential conflicts of interest with respect to the research, authorship, and/or publication of this article.
Funding
The author(s) received no financial support for the research, authorship, and/or publication of this article.