
Abstract
The aim is to study the reactive compatibilization of two immiscible thermoplastic polyesters, namely polycarbonate (PC) and poly (ethylene terephthalate) (PET), by transesterification reactions through melt compounding. For this, a catalyst, which is hydrated samarium acetylacetonate (Sm(acac)3), is incorporated with concentrations of 0.10, 0.15 and 0.20 phr into the 70PC/30PET mixture.
The characterization of the PC/PET blends by differential scanning calorimetry (DSC) revealed that, the transesterification reactions in the absence of catalyst are undetectable or practically impossible; however, by increasing the catalyst concentration, significant variations are noticed on the thermal properties. These modifications, due to the interfacial reactions between the two phases of the system, were also evidenced by variations in morphological properties observed after the study of atomic force microscopy (AFM).
Introduction
Blends of aromatic polyesters, namely poly (ethylene terephthalate) (PET) and poly (butylene terephthalate) (PBT) with polycarbonate (PC), have been subject of much research during the last two decades. Most of the studies have focused on the miscibility, phase behavior and reactions occurring between blend components during melt mixing of the blends. 1 PET/PC reactive blending allowed us to consider this method as one of the most prospective techniques for production of new polymer materials based on polyesters and polycarbonates. 2
PET and PC are engineering plastics. Commercially, PET is the most successful member of the thermoplastic polyester family, showing relatively low toughness and high resistance to common solvents. Conversely, PC has high impact strength but poor solvent resistance. Also, both PET and PC contain reactive functional groups able to produce exchange reactions during the mixing of the polymers in the molten state. 3 Miscibility and the ester-interchange reaction between PC and PET have been the subjects of extensive investigations in the literature studies. 4 An important factor that influence the miscibility of the polyesters/polycarbonate blends in general, is the transesterification reaction. 1 When, transesterification is a generic term applied to a collection of intermolecular reactions between polyester, which include alcoholysis, acidolysis and ester-interchange. These reactions take place readily not only between polyesters but also such polymer combinations as polymethacrylate and polycarbonate, polyester and polycarbonate and polymethacrylate with polyester. 5 This reaction change the initial homopolymers to block and then to random copolymers, which effect the miscibility of the system. 1
In PC/PET blends, exchange reactions between the carbonate groups of PC and the ester groups of PET begin at the interface and cause the conversion of homopolymer chains to block copolymers, when the exchange rate is still weak. The block structure of the synthesized copolymer is, after more intense transreactions, converted to a random one, especially when transesterification also concerns copolymer chains for which the reactions must be faster and easier. But, without the deliberate incorporation of a transesterification catalyst, ester-carbonate by interchanges do not occur at all or produce practically unnoticeable effects on the final properties of the blend. 6
As part of this work, mixtures of two thermoplastic polyesters, polycarbonate (PC) and poly (ethylene therephthalate) (PET) are produced in the presence and absence of a transesterification catalyst, hydrated samarium acetylacetonate (Sm-Acac) at different concentrations of 0.1, 0.15 and 0.20 phr. Of which, according to Ignatov, 7 this catalyst was considered the most suitable for promoting ester-ester exchanges in PC / PET mixtures and therefore compatibilizing these two polymers, because it has a high activity compared to other catalysts already used in the literature. The morphology and thermal behavior of catalyzed and uncatalyzed PC/PET blends prepared in the melt were studied by using DSC and AFM.
Materials and methods
Presentation of parent polymers
The commercial PC was supplied by the Bayer group (Leverkusen, Germany) under the name Makrolon 2807. The melt flow index of PC was 10 g/10 min measured at 300°C and 1.2 kg (Iso 1133).
The PET resin with an intrinsic viscosity of 0.8 g/dl was obtained from Tongkook (Seoul; South Korea; TexPet 874-C80).
Transesterification catalyst
Samarium (III) acetylacetonate hydrate (Sm(acac)3) is the catalyst used in our study is supplied by Sigma-Aldrich.
Preparation of PC/PET blends with and without catalyst
The uncatalyzed and Sm(acac)3 catalyzed PC/PET blends were prepared in a Brabender internal mixer at a temperature of 270°C and a mixing speed of 30 rpm for 20 min. After the melting of homopolymers, the catalyst was introduced at concentrations of 0.1, 0.15 and 0.20 phr. Then, the obtained mixtures were pelletized to obtain samples for characterization. Below are the different compositions of the mixtures used in this study:

Differential scanning calorimetry (DSC)
The calorimetric analysis were performed using a SETARAME differential scanning calorimeter (DSC131 EVO). At a heating rate of 10K/min, by scanning the samples from room temperature up to 300°C, under nitrogen. The melting temperature (Tm) was evaluated as the maximum of the endothermic melting peak on the basis of the thermograms from the second scanning of the samples. Tg and ΔHm were taken from the second heating cycle. The Tg value was also estimated using Fox equation, 8 in order to predict the miscibility.

where wPET and wPC are the weight fractions of PET and PC, respectively.
The PET’s degree of crystallinity (XC) was calculated from the ratio of PET endothermic peak area (ΔHm) and the enthalpy of fusion of 100% crystalline PET (ΔH°m = 140 J g−1),
6
taking into the account the weight of PET in the blend, according to the following equation
6

The crystal thickness (lc) of the components, derived from the Thomson-Gibbs equation
9

We have used the following values for these calculations:
ΔH∞m, as mentioned above, is the melting enthalpy for an infinitely thick crystal; σe is the surface free energy and T0m is the equilibrium melting point, for the PET component, we have used: T0m = 561ºK,9 and σe = 151–161 erg/cm2.9
Atomic Force Microscopy (AFM)
Atomic force microscopy is a technique for visualizing, with nanometric resolution, the three-dimensional morphology of the surface of a material. 10 Mizes et al. 11 used this technique to study the adhesion dependence of the topography of a mixture and found that the strength of the adhesion decreases with increasing local curvatures. This method has also been used to study the surface structure and interactive forces in nanostructured films. In our study, the surface topography of mixtures and composites was observed using an Asulym Research-Model MFP-3D brand atomic force microscope, under ambient conditions and at a resonant frequency of 1 Hz.
Results and discussion
Differential scanning calorimetry (DSC)
Thermal behavior of uncatalyzed 70PC/30PET blends
The DSC thermograms of the second heating cycles of the PC/PET mixtures prepared without catalyst with different compositions (100/0, 70/30, 50/50 and 30/70, 0/100) are shown in F
igure1. The thermograms show no evidence of any crystallization of the PET phase from the molten state or after the cooling cycle performed in DSC. This is explained by the fact that the slow cooling from the molten state when processing the blends allowed the polymer to crystallize well. In addition, during the DSC test, the PET completed its crystallization during the cooling cycle, which prevents any further crystallization process during the second heating cycle.
The PET thermogram’s reveals essentially the glass transition temperature at about 79°C and an endothermic melting peak ranging from 200 to 270°C and showing a maximum at about 248°C. PET has a crystallinity level of approximately 33%. However, the PC exhibits only the glass transition zone around 147°C.
Glass transition in mixtures without catalyst
The estimation of the Tgs of the PET and PC phases from the second heating cycles gave the values reported in Figure 1(a).
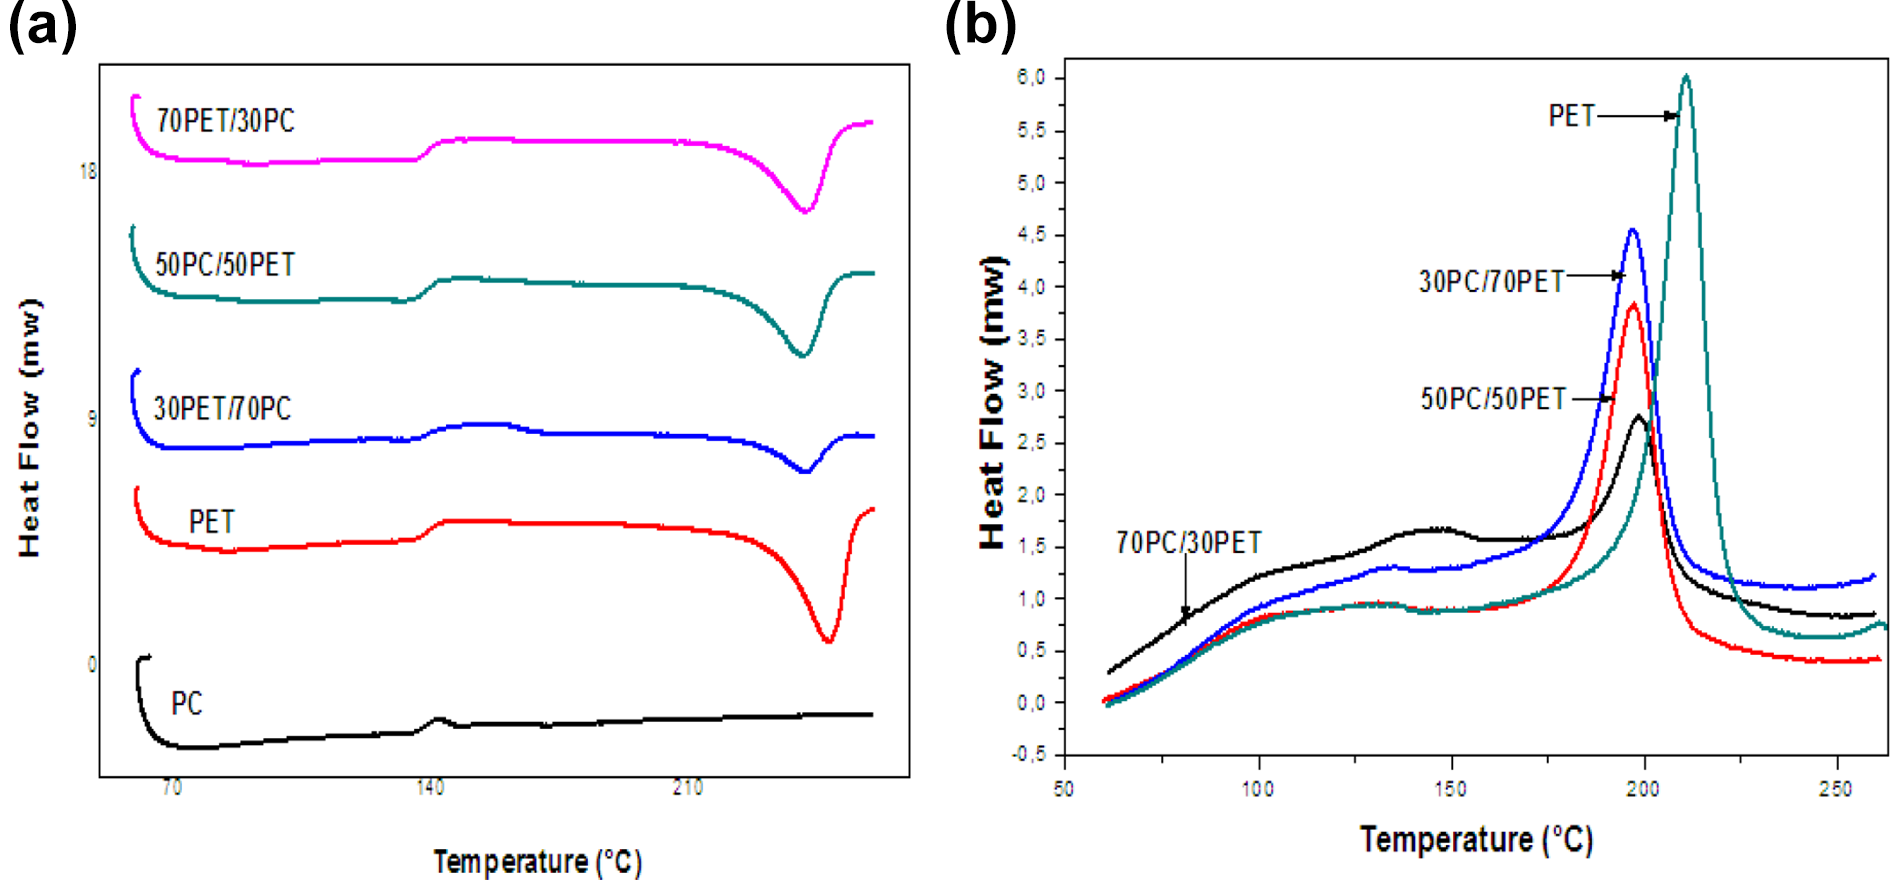
DSC thermograms of: the second heating cycles (a) and cooling cycles (b) of PC, PET homoplymers and PC/PET mixtures (70/30, 50/50, 30/70) prepared without Sm(acac)3.
We noticed that the Tg of the PET phase is slightly shifted from that of pure PET and shows an increase of 79°C up to 86°C for the 30PC/70PET mixture. This variation could be explained by the fact that the PC phase, which is still in the glassy state, imposes restrictions on the mobility of the PET units. However, the Tg of the PC phase is found shifted at slightly lower temperatures than that noted for the homopolymer. In fact, when the PC approaches its Tg, the PET is in the rubbery state and then plasticizes the PC phase which reduces its Tg relative to the value determined for pure PC. 12 It is well-established fact that residual catalyst present in the commercial sample of PET is sufficient for significant extent of transesterification. On the other hand, the small variation in the Tg of the PC phase is mainly attributed to the high viscosity in the melt state, which makes it difficult for the fragments of PET chains to diffuse within this phase. 13
Also, the results show that the Tg values of the PC and PET phases in the mixtures are totally different from those predicted by the Fox equation for the amorphous phase of the miscible mixture relating to each composition.
For their part Reinsch et al. 12 and Fraïsse et al. 14 proposed that the increase in the Tg of PET might be the result of transesterification reactions between PC and PET.
We noted, from the results that the Tgs of the two phases vary little with their levels in the mixtures due to the immiscibility of the two polymers and the fact that the variation is totally due to the restrictive effect exerted by the vitreous phase PC or the plasticizing effect of PET (Figure 2). Likewise, Forounchi et al. 15 found that the PC chains have a lower tendency to diffuse in the PET phase, due to the large difference in melt viscosity between the two polymers.

Effect of the composition on the glass transition temperature of PC/PET blends (70/30, 50/50, 30/70) prepared without Sm (acac)3.
Thermal behavior of catalyzed 70PC/30PET mixtures
Glass transition in mixtures prepared in the presence of Sm(acac) 3
Figure 3(c) represents the DSC thermograms of the second heating cycle of PC and PET homopolymers and 70PC/30PET mixtures prepared by melting without and with different levels of Sm(acac)3, (0.15 and 0.20 phr) .

DSC thermograms of the first heating cycles (a), cooling cycles (b) and second heating cycles (c) of 70PC / 30PET mixtures prepared with and without Sm(acac)3.
From the DSC thermograms, we notice that the Tg of the PET phase is shifted to higher temperatures exceeding 100°C, unlike that of the PC phase which varies slightly with the catalyst level. Thus, the insertion of PC units, having a higher Tg within the PET chains, causes the Tg of all of the resulting new mixed phase to shift to higher temperatures. This diffusion of PC chain segments across the interface, in the presence of the transesterification catalyst, is at the origin of the formation of copolymer structures capable of reacting as interface agents and of compatibilizing the mixture. 6
On the other hand, the small variation in the Tg of the PC phase is mainly attributed to the high viscosity in the melt state, which makes it difficult for the fragments of PET chains to diffuse within this phase. This results in negligible structural changes within the phase which thus retains its predominantly homopolymer phase appearance. On the other hand, the PET phase is subject to significant structural modifications giving it its character as a copolymer phase, as the results of the calculations of the compositions of each of the phases will testify.
Further, calculating the Tg of the amorphous phase of the miscible mixture using the Fox equation yielded the values shown in Figure 4. These values are quite close to that of the phase rich in PET in the case of the 70PC/30PET mixture at 0.20 phr Sm(acac)3, which leads us to think that the concentration of catalyst necessary to achieve the miscible mixture and homogenize the system is slightly greater than 0.20 phr. Also, the Tg value of the miscible mixture decreases with increasing catalyst level; the more the Sm(acac)3 content increases, the lower the Tg of the miscible mixture.

Variations of the glass transition temperatures of the PC and PET phases in the 70PC/30PET mixtures as a function of the level of Sm(acac)3.
3.1.1.2. PET phase crystallization/melting process
The thermograms of the second heating cycles of the PC/PET mixtures prepared without Sm(acac)3 show that the degree of crystallinity of the PET phase varies markedly by increasing the PC content in the mixtures, as shown in Figure 1(a). Indeed, it has been found that the crystallinity decreases from 33% for pure PET to 23, 17 then 16% for mixtures with 30, 50 and 70% PC, respectively (Figure 5(a)).

Variations in the crystallinity rate of PET (a): in PC/PET mixtures (70/30, 50/50, 30/70) prepared without Sm(acac)3 and (b): in 70PC/30PET mixtures as a function of the level of Sm(acac)3.
The PET’s crystallization decrease is attributed to the fact that this begins to occur while the PC phase is still in the glassy state. As a result, severe restrictions are imposed by the PC chains on the rearranging movements of the PET chains, which will then form less perfect crystals with a wide size distribution. Several authors have concluded that the crystallinity of PET tends to decrease and, in some cases, to disappear with increasing PC content in mixtures; and when this later was greater than 70%.6,12,16-21
The thermograms of the first heating cycles (Figure 3(a)) show that the melting peaks of the PET-rich phase are shifted to lower temperatures suggesting that the crystals formed during the crystallization process are less perfect and have different sizes than those formed in PET and in the mixture without catalyst. The significant effect of the addition of the transesterification catalyst on the melting and crystallization processes is even more evident on the thermograms of the second heating and cooling cycles. Indeed, the thermograms of the second heating cycles of the 70PC/30PET mixtures prepared with and without Sm(acac)3 show that despite the presence of PC units in the PET chains, their ability to crystallize is retained, which implies that the chain segments of the PET-rich phase are long enough to be able to arrange into crystallites. Indeed, if the PET blocks in the copolymer were too short, their crystallization power would be lost. For this, it is observed that the higher the level of catalyst, the lower the level of crystallinity of the PET in the mixture, as shown in Figure 5(b).
In this context, it has been reported that the prevention of crystallization is generally due to the insertion of PC chain segments into PET chains; this could be due to the formation of a more homogeneous mixture or to the reduction in the length of the PET blocks in the copolymer formed.22-24
Melting points in PC/PET blends
As a consequence of the crystallinity results, the melting temperatures of the PET phase in the mixtures are clearly influenced by the presence of the PC as they decrease from 248°C, the value obtained for pure PET, to 242°C for the mixture at 70% PC, as shown in Figure 6(a). This result is identical to that found by Hanrahan et al. 20 who have proposed that the melting temperature of PET decreases with decreasing its content in mixtures. Also, they suggested that the second component of an immiscible mixture significantly affects the melting behavior of the crystallizable polymer due to its effect on nucleation and on the growth rate of spherulites. This is especially evident on endothermic peaks whose changes indicate that melting of PET crystals has occurred at lower temperatures because they are not as perfect as those formed in pure PET. In fact, the melting peak of pure PET is narrow, which shows that the size of the crystals and their degree of improvement are homogeneous. However, the melting peaks of the PET phase in the mixtures are relatively wider, which means that the size distribution of the crystals and their shape are heterogeneous because of the PC phase.
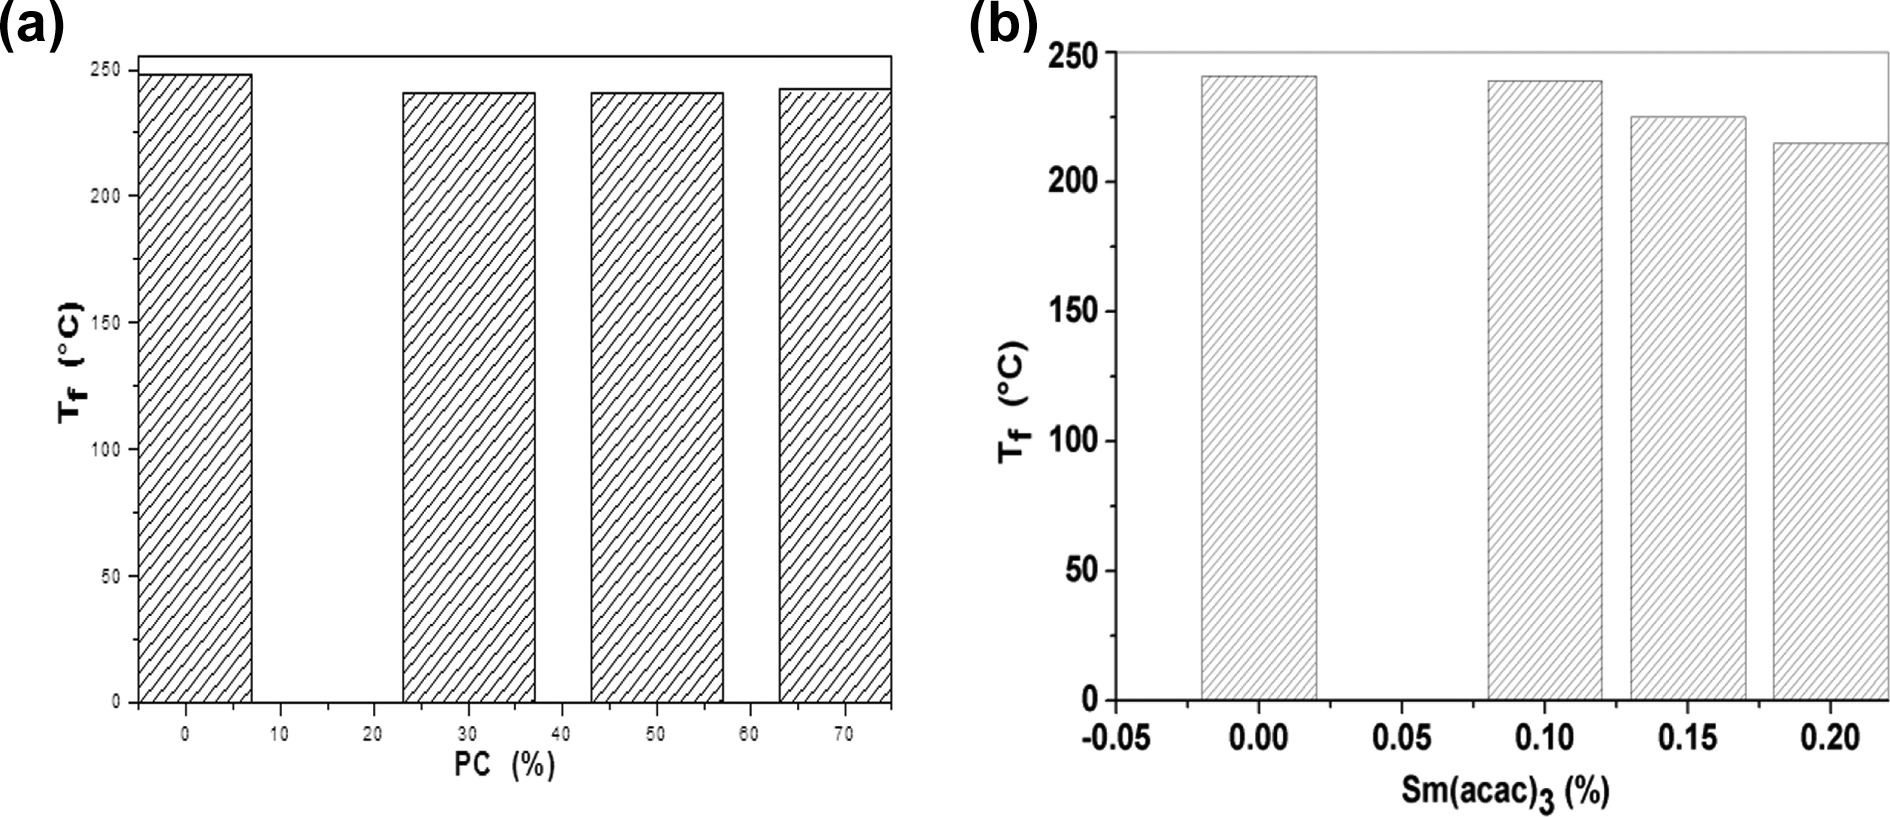
Variations in the melting temperature of PET (a): in the PC / PET mixtures (70/30, 50/50, 30/70) prepared without Sm(acac)3, (b): in 70PC/30PET mixtures as a function of the level of Sm(acac)3.
The cold crystallization behavior of PET in mixtures without catalyst is studied from the cooling cycles given in Figure 1(b). We note that in the presence of PC, the PET chains require more cooling for nucleation and development of crystallites. The PC domains act on the dynamics of the PET chains by notably slowing down their rearrangement, which decreases the crystallization temperature relative to pure PET. As a result, the crystallinity rate of the PET phase in the mixtures is lower as the PC content increases. The insertion of fragments of PC chains into the PET phase, via inter-exchange processes, considerably inhibits its crystallization by preventing chain organization movements, which is at the origin of the notable disturbance of the nucleation and growth processes of crystallites.
Moreover, the crystallites formed do not exhibit the same characteristics as those of pure PET and therefore, a remarkable shift toward lower temperatures is noted for the endothermic peak of PET in mixtures. 15 Thus, the melting temperature decreases from a value of 250°C observed for pure PET to 215°C for the mixture of 0.20% Sm(acac)3, as shown in Figure 6(b).
The insertion of fragments of PC chains into the PET phase, via inter-exchange processes, considerably inhibits its crystallization by preventing chain organization movements, which is at the origin of the notable disturbance of the nucleation and growth processes of crystallites
The thermograms of the cooling cycles, given in Figure 3(b), reveal that the temperature and area of the peak crystallization of PET are lower the higher the level of catalyst. The shift of the crystallization peak to lower temperatures shows that the rearranging movements of the PET chains have become more difficult, which also affects the area of the crystallization peak, which is consequently reduced.
The regression in the ability of PET to crystallize from the molten state is explained by the insertion of bulky units of PC into the PET chains, which decreases their tendency to rearrange into crystals whose formation only becomes possible at low temperatures. This means that in order to be able to crystallize, the 0.15 pcr mixture of Sm(acac)3 requires cooling to temperatures low enough to develop nucleation sites of the PET crystals.
Determination of the thickness of PET crystals
Thickness of PET crystals in uncatalyzed mixtures
The values for the thickness of PET crystals in mixtures prepared without catalyst are given in Figure 7(a). The results show that the crystal thickness of the PET phase is slightly affected by the presence of the PC domains. In fact, the size of the crystals in the PET phase varies from 16.34 nm for pure PET to a value of 15.89 nm for the mixture containing 70% PC. This slight decrease is mainly due to the immiscibility of the mixture, which means that the restrictions imposed by the PC phase on the rearrangements of PET chains are negligible.

Variations in the thickness of PET crystals in (a): uncatalyzed PC/PET blends depending on the composition, and (b):70PC/30PET mixtures depending on the concentration of Sm(acac)3.
These results also confirm the small variation in the melting temperature of the PET phase as a function of the PC content. 24 The smaller the thickness of the crystals, the lower their melting point. Since the incorporation of PC has little effect on crystal size, we notice that the melting temperature varies slightly after mixing with PC.
Effect of the level of Sm(acac)3 on the thickness of crystals in catalyzed mixtures
The variations in the thickness of the PET crystallites in the 70PC/30PET mixtures prepared in the presence of different levels of catalyst are shown in Figure 7(b).
The results clearly show the decrease in the crystallite thickness values of PET in the 70PC/30PET mixture after incorporation of the catalyst. The values of Ic vary from 15.49 nm for the mixture prepared without catalyst to 9.29 nm for that at 0.20 phr of Sm(acac)3. This is interpreted by the fact that the insertion of PC segments into the PET chains, thanks to the inter-exchange reactions, significantly decreases the tendency of the PET phase to crystallize, which results in the significant decrease in the thickness of its crystallites.
It is also observed that the higher the level of catalyst, the smaller the size of the crystals. Indeed, it appears that the greater the rate of interchange units between the two polymers, the more the crystallization is disadvantaged. PC units exhibit a low tendency to crystallize, which means that their insertion into PET chains significantly decreases the latter’s ability to organize.
Morphological characterization of mixtures with and without Sm(acac)3
Atomic force microscopy (AFM) is a microscopic technique that can be used to determine morphological information about polymer mixtures, including the shape, size and orientation of particles, and the distances between particles.
This technique reveals not only the distribution of the polymer phase, but also a great deal of information regarding the structure of the components and the properties of heterogeneous polymer blends, as well as the interface between the polymers.
Effect of composition on the morphology of mixtures without Sm(acac)3
Figure 8 shows the topography of the PC/PET blends having the compositions (70/30 and 30/70) prepared without catalyst. We note that the surface state of the mixtures is not homogeneous and that when the PC has the minority fraction, the number of domains of the dispersed phase is smaller and the roughness higher. Indeed, it is observed from the AFM image of the 70PC/30PET mixture that the areas with clear tops corresponding to the PET phase are more numerous and that practically the entire surface of the sample is covered with distributed roughness (bumps). In a homogeneous way. However, the image of the sample 30PC/70PET mixture, shows that the domains of PC, revealed as lighter roughness, are less numerous, thus reflecting a limited state of aggregation of this phase in the PET matrix. For this, roughness values of 24.57 and 31.45 nm were assigned to the 70PC/30PET and 30PC/70PET mixtures, respectively. These observations are interpreted by the difference in viscosity between the two polymers.

AFM micrographs of PC/PET (70/30) and (30/70) mixtures prepared without Sm(acac)3.
The higher the viscosity of the matrix, the better the dispersion of the minority phase. In fact, when the matrix is fairly viscous, the subdivision of the dispersed phase into more numerous and better -distributed domains throughout the matrix is favored by the relatively large shear forces. This is not possible when the matrix has a lower viscosity than that of the dispersed phase, the subdivision of which into smaller domains is then limited. In summary, it can be said that the dispersion of PET in PC matrix is better than that of PC in PET matrix.
Effect of the Sm(acac)3 concentration on the morphology of the 70PC/30PET mixture
Comparison of the topography of the 70PC/30PET mixture without catalyst with those of the mixtures prepared with 0.1; 0.15 and 0.20 pcr of Sm(acac)3 shows significant changes in particle shape, size and orientation as well as in distances between domains of the dispersed phase with variation in catalyst concentration. Indeed, it is clearly observed from Figure 9 that in addition to the clear domains already observed in the mixture without Sm(acac)3, there are also broader, ordered and oriented domains due to a new intermediate phase between the two initial phases of the mixture. The zones formed no longer appear in the form of bumps as in the case of the mixture without Sm(acac)3, but are in the form of rods or planes superimposed and oriented under the effect of the interactions. These domains could result from the fusion of the small domains of PET with the PC, due to the course of transesterification reactions that contribute to the compatibilization of the mixture. Assuming we have two PET nodules separated by PC. The groups at the interface of the nodules react simultaneously with the same fraction of PC, which will thus unite the two phases of PET located on either side to form a single domain whose orientation will depend on the positions relative values of the initial nodules. As a result of these reactions, it is noted that the adhesion between the domains where the inter-exchange reactions took place was markedly improved. This is evidenced by the decrease in the number of dark areas at the interface between domains. 25 We also observe that the higher the level of catalyst, the more these new domains are numerous because a larger fraction of copolymers is produced. Due to the processes of melting the PET nodules by means of the reactions with PC, an increase in roughness is noted from a value of 24.57 nm for the mixture without Sm(acac)3, to values of 32, 66; 35.59 and 45.15 nm for mixtures catalyzed by 0.1; 0.15 and 0.2 pcr of catalyst.

AFM micrographs of 70PC/30PET mixtures prepared with: 0 phr (a), 0.10 phr (b), 0.15 phr (c) and 0.20 phr (d).
Conclusion
The main objective of this study consisted in the realization of compatibilized systems composed of two immiscible polyesters, which are PC and PET. The use of a transesterification catalyst is considered a very effective compatibilization strategy for these mixtures. Of which, The inter-exchange catalyst which is samarium acetylacetonate Sm(acac)3 was introduced at rates of 0.1; 0.15 and 0.20 phr.
Confirmation of the compatibilization of the system was provided by the demonstration of notable variations in the main characteristics of the mixture, in particular the thermal and morphological properties using characterization techniques including DSC and AFM.
The study of the effect of the composition on the properties of PC/PET blends produced without Sm(acac)3 showed that The immiscibility of the system is evident after the detection of two glass transition temperatures characterizing each of the two phases. Also, despite the immiscible nature of the mixture, the presence of the PC phase significantly affects the crystallization process of PET during the heating and cooling cycles and this by producing variations in the degree of crystallinity and the size of the crystals;
After the incorporation of different levels of Sm(acac)3 to the 70PC/30PET mixture, obvious variations in the properties studied were noted and testify to a significant modification in the structure and the morphology at the level of the interface between the two polymers.
The decrease in the crystallinity rate of PET in the blends with the increase in the level of Sm(acac)3 is due to the insertion of bulky units of PC and the gradual decrease in the length of the PET blocks in the formed copolymer, making their crystallization impossible.
A notable change in the topography of the catalyzed mixtures, which revealed orderly and very regular areas not preexisting in the virgin mixtures. These zones emphasize the formation of intermediate structures or the establishment of interactions at the interface between the phases of the mixture. The higher the level of Sm(acac)3, the greater the level of order exhibited by the surface of the mixture.
Footnotes
Declaration of conflicting interests
The author(s) declared no potential conflicts of interest with respect to the research, authorship, and/or publication of this article.
Funding
The author(s) received no financial support for the research, authorship, and/or publication of this article.