
Abstract
The improvements of the thermal, mechanical, morphological properties of low-density polyethylene (LDPE)/nanoclay (NC) composites were investigated. Low-density polyethylene (LDPE) with different NC contents 2 wt.% (Vf = 8%), 4 wt.% (Vf = 15), and 8 wt.% (Vf = 27) with a fixed particle size (300μm) were prepared by the melt mixing process. The thermal tests (thermal gravimetric analysis) were performed to monitor the thermal stability of LDPE composites. The mechanical tests such as tensile strength, Young’s modulus, and strain at break were studied. The results of the thermal gravimetric analysis (TGA) display significant enhancement in thermal stability as the loading of NC increased in pure LDPE. The results showed that the NC fillers could effectively improve the mechanical properties of LDPE by comparison to pure LDPE, the tensile strength of LDPE/8 wt.% of NC are increasing by about 17% while Young’s modulus is increased by about 39%. From DMA results, the storage modulus is enhanced with increasing of NC loading into the LDPE matrix. The results of SEM photographs indicate that the incorporation 8 wt.% of NC displayed the best particles dispersion in the LDPE matrix.
Introduction
Polymer nanocomposites have been widely used in several applications as industrial, construction, and medical sectors accroding to their excellent chemical, physical, and mechanical properties.1-4 Polymer nanocomposites consist of nano-sized fillers, show superior properties at a lower loading than conventional composites. 4 Low-density polyethylene (LDPE) is a commodity polymer, cheap, versatile, with wide uses in a variety of forms such as plastic packages. An improvement of LDPE properties should be of interest in order to raise its application fields.5-7 Several types of research have been focussed on finding the clay loading that will produce the ideal thermal and mechanical properties of the desired application. 8-11 Heydari-Meybodi et al. were investigated in their work that Young’s modulus reduced with increasing with the clay loading from 5 wt.% to 7 wt.%. 12 Bumbudsanpharoke mentioned that a clay loading of 10 wt% or more only results in small improvements of some of the mechanical properties. 13 Zabihi et al. also suggested as the clay loading is increased beyond the threshold limit value, Young’s modulus will level off. They attribute this to a change in the clay-polymer interaction. Thermo-mechanical properties are dependent on the interactions between the clay particles and the polymer matrix, which include the type of clay, compatibiliser or surface treatment used as well as its dispersion in the matrix. 14
Although low-density polyethylene (LDPE) has long been broadly utilised in packaging applications, some limitations still exist in its utilisation, which may be due to its relatively low mechanical strength. 15 The aim of this study is to analyse the possibility of using montmorillonite (MMT) nanoclay as fillers to improve the thermal and mechanical properties of LDPE, prepared via melt extrusion.
Experimental
Materials
Low-density polyethylene (LDPE) with a density about 0.925g/cm3 was provided from SABIC chemical company, KSA. The nanoclay utilised was the type (Cloisite 30B) and was received from Southern Clay Products (USA). 16 Nanoclay contains organically modified nanometre-scale crystal, which are layered by magnesium aluminium silicate platelets and the density is about 0.23 ± 0.03 g/cm3. Moisture content is ≤2%, and the particle size is approximately 2 μm. 16
LDPE/NC composite film preparation
The LDPE/NC nanoclay composite films were prepared by melt extrusion to yield composite film samples with NC contents of 2 wt.% (Vf = 7.65%), 4 wt.% (Vf = 14.5), and 8 wt.% (Vf = 26.5). The composite films were processed by utilising a laboratory-scale, twin-screw extruder (Haake HBI system 90, 300 ccs, fill factor 0.8). The LDPE and NC pellets were dried in a convection oven at 80°C for 24 h and blended in a sealed plastic bag by using manual tumbling before being fed into the extruder. LDPE was fed into the twin-screw extruder at the rate of 8 kg/h, and the NC was added regularly at the melting zone. Then, all samples were regularly blended up to 10 minutes at 160°C with a rotor speed of 100 rpm. The LDPE/NC composite was pressed under 25 MPa at 160°C for 10 min and then cooled down to room temperature for 6 hours.
Characterisations
Thermogravimetric analysis (TGA)
LDPE and LDPE/NC composite samples were tested by using TGA instruments type (TGA Q500; TA Instruments) under a nitrogen atmosphere and a temperature range from 25°C to 650°C at a heating rate of 10°C·min−1. All samples were weighed within the range (5−10 mg). The thermal stability was tested and investigated based on the thermal decomposition of LDPE and LDPE nanocomposites samples within the above temperature range. 16
Tensile and flexural strength tests
Composites samples were tested by using the Instron tensile machine model (Testometric, M500-50AT, UK). The crosshead speed was about 10mm/min. Tensile measurements of the samples were carried out at the room temperature by using a device equipped with a 10 KN load cell. Dog-bone-shaped samples with overall dimensions of 16.3 × 1.9 × 0.5 cm were prepared and the tests according to the American Society for Testing and Materials (ASTM), D638. 4 Three-point bend tests were carried out based on the ASTM D 790 M test method to test flexural properties. The measurements of all samples were (100 mm long, 25 mm wide, and 3 mm thickness). In the three-point bending test, the external rollers were 60 mm apart, and the samples were measured at a strain rate of 0.5 mm/min. Three samples of each composition were tested, and the results were reported.
Dynamic mechanical analysis of composites (DMA)
The storage modulus of LDPE and LDPE composites were evaluated by using DMA Q800 (TA Instruments Inc. USA). Rectangular samples were cut from the pressed sheet to the size of 50 mm × 10 mm × 3 mm. The samples were tested with three-point bending configuration and the span was about 40 mm according to the standard ASTM-D7028 to display the curves of the storage modulus with different temperatures at a fixed frequency of 1 Hz. The range of temperature was from 40°C to 150°C, at a heating rate of 5°C /min under a flow of nitrogen. 5
Water absorption
The tests of water absorption were carried out based on ASTM Standard D750-98. All samples with dimensions of (2.0 × 3.5 cm) were utilised for water absorption study. Before the immersion in a water bath the samples were dried up to 24 hours at 60°C by using a vacuum oven. The samples were immersed in distilled water at 25 ± 5°C. Samples were periodically removed from the water and cleaned, using a tissue paper to remove any residual amounts of water before weighing by using a sensitive balance.
The values obtained for each sample over four runs were averaged and reported. The water absorption (WA) of samples was computed by utilising the following equation 16

Where: Wº is the weight of the original sample and Wt is the weight of the immersed sample at a time.
Scanning electron microscopy (SEM)
The surfaces morphologies of the LDPE and LDPE/NC composite were studied by using JEOL, JSM 840A scanning electron microscope operated at a voltage of 10 kV. The surface of the samples was coated with a thin layer of gold by utilising a vacuum evaporation method.
Results and discussion
Thermal decomposition Analysis of LDPE nanocomposites
The thermal stability of LDPE and LDPE nanocomposites was investigated by utilising TGA, as shown in Figure 1. The DTG curve was obtained from the TGA results to illustrate the maximum decomposition temperature, as given in Figure 2. The initial temperature (Ti) is due to the initial degradation process and it is a relevant factor of evaluating the thermal stability. 17 The maximum decomposition temperature (Tmax), Ti and residual yield % at 650°C are summarised in Table 1. The incorporation of 8 wt.% NC into the LDPE matrix is exhibited higher initial decomposition temperature at 448.5°C while pure LDPE is about 435.5°C (Table 1). The presence of the NC fillers is found to enhance the thermal stability of the LDPE matrix and provide excellent interfacial adhesion18-20 between the LDPE matrix and NC fillers. The decomposition at T10 is showed a higher decomposition in LDPE/8 wt.% NC (472.4°C) While the T10 of pure LDPE was (362.5°C). The incorporation of 8 wt.% of NC in LDPE matrix produced a higher decomposition temperature loss at decomposition (T50) that is (482.5°C) by comparing to that of pure LDPE (470.2°C) as shown in Table 1.
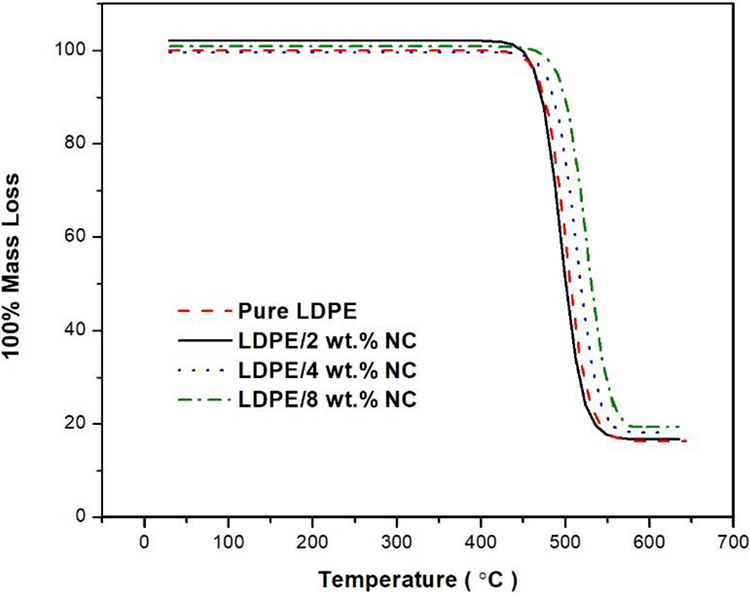
TGA thermogram curves of pure LDPE and LDPE/NC composites.

DTG curves of pure LDPE and LDPE/NC composite samples.
TGA thermograms degradation results of pure LDPE and LDPE/NC composites.

The results of residual yield % exhibited higher value of 2 wt.%, 4 wt.%, and 8 wt.% NC in LDPE (16.7%, 18.5%, and 20.5%), respectively, by comparing to that of the pure LDPE that was about 15.5% (Table 1). The results showed that the Tmax of 8 wt.% NC in LDPE was (410.7°C) while the Tmax of pure LDPE was (395.6°C). A previous work investigated the TGA of LDPE and LDPE/MMT nanoclay, the results obtained displayed that the thermal stability of LDPE improved significantly as the MMT nanoclay incorporation into LDPE increased. 13
Mechanical analysis of composites
The comprehensive mechanical properties of LDPE and LDPE/NC at different loadings are displayed in Figure 3. From stress–strain curves, as the NC contents increased, the mechanical properties improved. From Table 2 and Figure 3, it is evident that when the NC loading reached up to 8 wt.%, the tensile strength and Young’s modulus of 8 wt.% incorporated was increased by 17% and 38.6%, respectively, compared to those of LDPE.
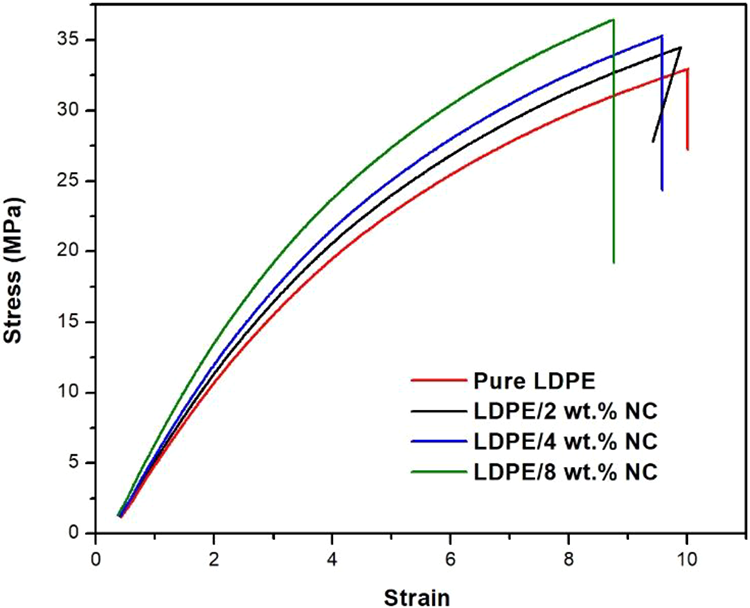
Stress–strain curves for LDPE and LDPE nanocomposites.
Mechanical test results of LDPE and LDPE nanocomposites.

The results of the Young’s Modulus are given in Table 2, Young’s modulus values of 2 wt.%, 4 wt.%, and 8 wt.% of NC in LDPE are (92.45 ± 3.55) MPa, (98.21 ± 5.87) MPa and (125.08 ± 6.35) MPa, respectively, while Young’s modulus of pure LDPE is (90.22 ± 4.25) MPa. The strain at break of LDPE/NC composite is displayed a decreasing pattern for all blends composition (Table 2). The significant drop in the strain at break 21 is observed for that the LDPE with higher NC contents, could be due to the agglomeration of NC particles in the composites. From Table 2 and Figure 3, the strain at break is exhibited a lower value (8.45 ± 0.65%) by comparing to that of pure LDPE (10.25 ± 0.54%).
A previous work exhibited the effect of graphene nanoparticle (GNP) on the mechanical properties of low-density polyethylene (LDPE) and showed that the loading of 3 wt.% of NC in LDPE is exhibited a 15% increase in Young’s modulus 22 while in this work Young’s modulus values of 2 wt.% 4 wt.%, and 8 wt.% of nanoclay into LDPE were increased by 2.47%, 8.86%, and 38.64%.
Another study found that the addition of 5 wt.% nano alumina into LDPE improved the mechanical properties, the tensile strength and Young’s modulus were increased by 12.5% and 57%, respectively, by comparing to the LDPE matrix 23 while in the current work, the incorporation of 8% wt. of NC in LDPE, the tensile strength and Young’s modulus was increased by (16.78 ± 1.25)% and (38.64 ± 2.82)%, respectively.
As shown in Table 1, with an increment of nanoclay loading from 2 wt.% up to 8 wt.%, the flexural strength and flexural modulus were increased significantly. The LDPE/8% NC composite exhibited a higher flexural modulus by about (19.42 ± 5.1)% than that of LDPE matrix. The flexural strength of LDPE/8% NC was about (75.42 ± 4.26) MPa while the flexural strength values of LDPE/4 wt.% NC, LDPE/2 wt.% NC, and pure LDPE were (70.65 ± 3.44) MPa, (68.25 ± 3.21) MPa, and (67.57 ± 3.55) MPa, respectively. One can compare the results obtained from the current work of mechanical properties with another work was studied by Supri et al. They found that the tensile strength of LDPE/10 wt.% NC was (9.5 ± 1.25) MPa and the LDPE sample was (9.8 ± 1.85) MPa while in our work, the tensile strength of LDPE/8 wt.% of NC was about 37.45 ± 2.86 MPa and the strain at break of LDPE/10% NC was reduced by 36.4% compared to that of LDPE matrix. 24
The impact strength of NC incorporated into the LDPE matrix was increased with increasing the NC loading. From Table 2, the impact strength values of LDPE/2 wt.% NC, 4 wt.% NC, and 8 wt.% NC are (6.98 ± 0.35) kJ.m−2, (8.77 ± 0.64) kJ.m−2, and (11.61 ± 1. 22) kJ.m−2 while the pure LDPE is (6.54 ± 0.52) kJ.m−2. From the overall mechanical tests, 8 wt.% NC loading into LDPE showed good mechanical properties compared with other loadings of NC and pure LDPE.
In another work, the tensile strength of LDPE was increased gradually with increasing of MMT nanoclay loading, the tensile strength of 10 wt.% MMT loading into LDPE matrix was increased by 40.87% compared with the tensile strength of the pure LDPE. 13
DMA measurements
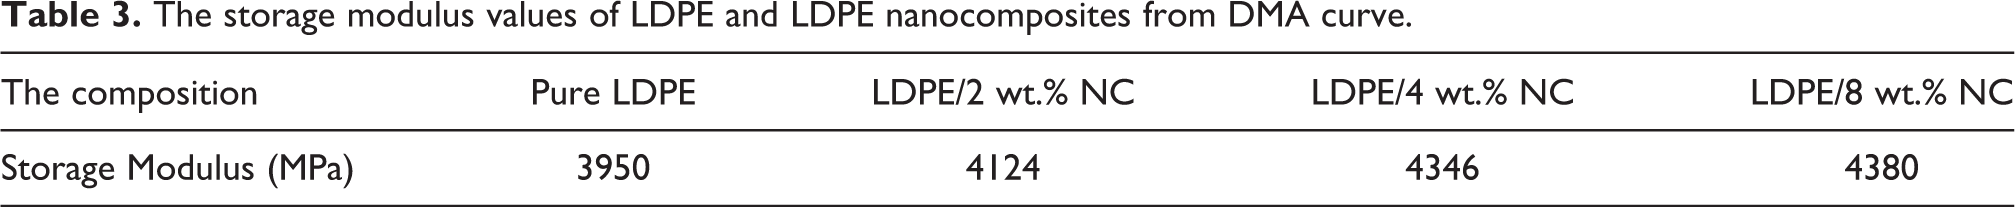
Dynamic mechanical analysis (DMA) has been a well-established method in thermal analysis.24,25 The calculations of storage modulus depend on temperature and deformation frequency. The curves of storage modulus versus the temperature (Figure 4) reveal the differences between the pure polymer matrix and composite system with LDPE/NC. From Figure 4 and Table 3, it can be seen that the storage modulus increased with the addition of NC content up to 8 wt.%. The storage modulus of LDPE/8 wt.% of NC was increased by 14% compared to that of pure LDPE, as shown in Figure 4 and Table 3.

Storage modulus of LDPE and LDPE nanocomposites.
The storage modulus values of LDPE and LDPE nanocomposites from DMA curve.
Water absorbance of composites
Figure 5 displays the water absorption versus immersion times of pure LDPE and LDPE/NC composites. The pure LDPE shows the smallest amount of water absorption after 250 h. It can be observed that the water absorption of all composites is increased with increasing immersion times. The presence of NC in LDPE nanocomposites of a certain amount of water decreases the water uptake of LDPE nanocomposites.
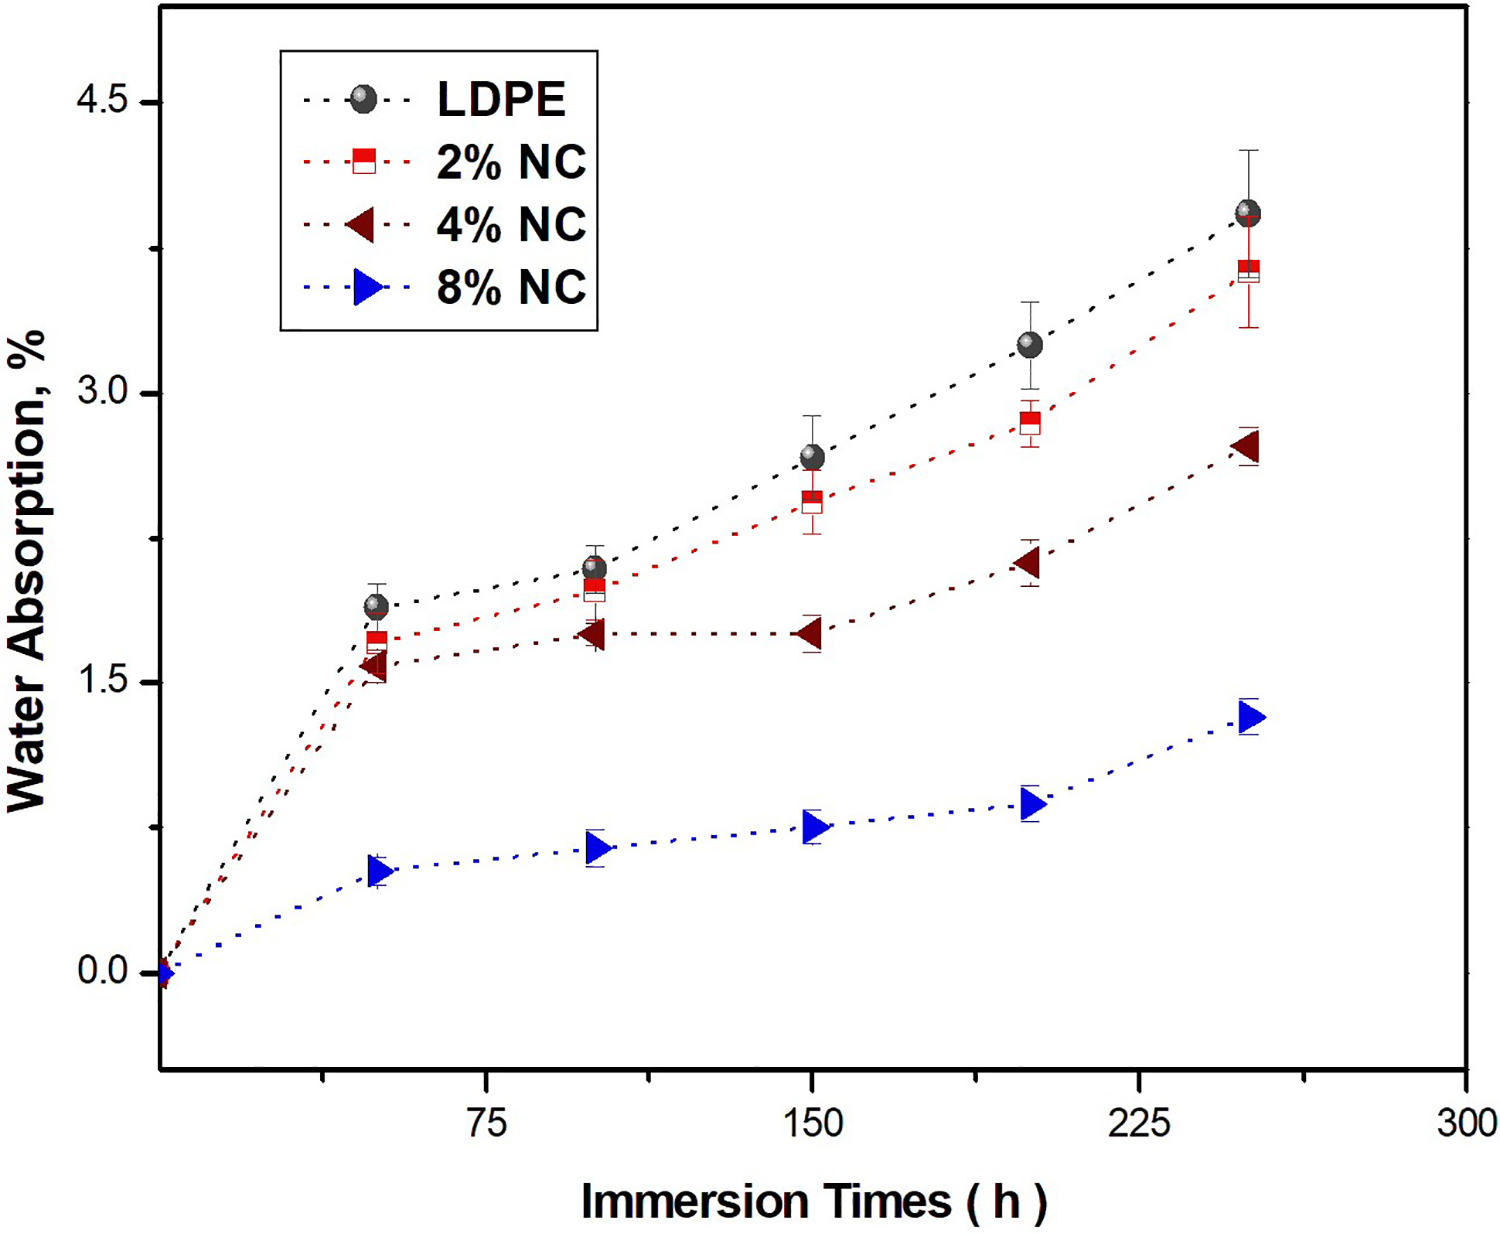
Water absorption of LDPE and LDPE /NC composites.
The percentage of water absorption exhibited a higher value for pure LDPE compared to that of LDPE incorporated 8 wt.% NC. After immersion to 250 h, the water absorbance of LDPE was increased significantly by 4.6% compared to that of LDPE/NC nanocomposites with different loadings of 2%, 4%, and 8% (3.8 ± 1.4%, 2.7 ± 1.2%, and 1.65 ± 0.98%) that is raised with increasing immersion time to 250 h (Figure 5.). Another study showed that increasing the loading of nanoclay enhanced the water absorption of LDPE after 24 h immersion time. 26 Another work showed that the water absorbance increases as the corn stalk filled in LDPE and immersion times increasing. 27
Surface morphology analysis of LDPE/NC composites
SEM micrographs of pure LDPE and the 8 wt.% incorporated into the LDPE matrix are shown in Figures 6(A) and (B). From Figure 6 (A), it is evident that pure LDPE displays more voids and ductilities while the LDPE incorporated with 8 wt.% NC shows more smooth and homogeneous distribution between the particles. This confirms that NC particles filled the voids on the LDPE surface and indicates more adhesion between the molecules of LDPE and nanoclay filler (Figure 6B).
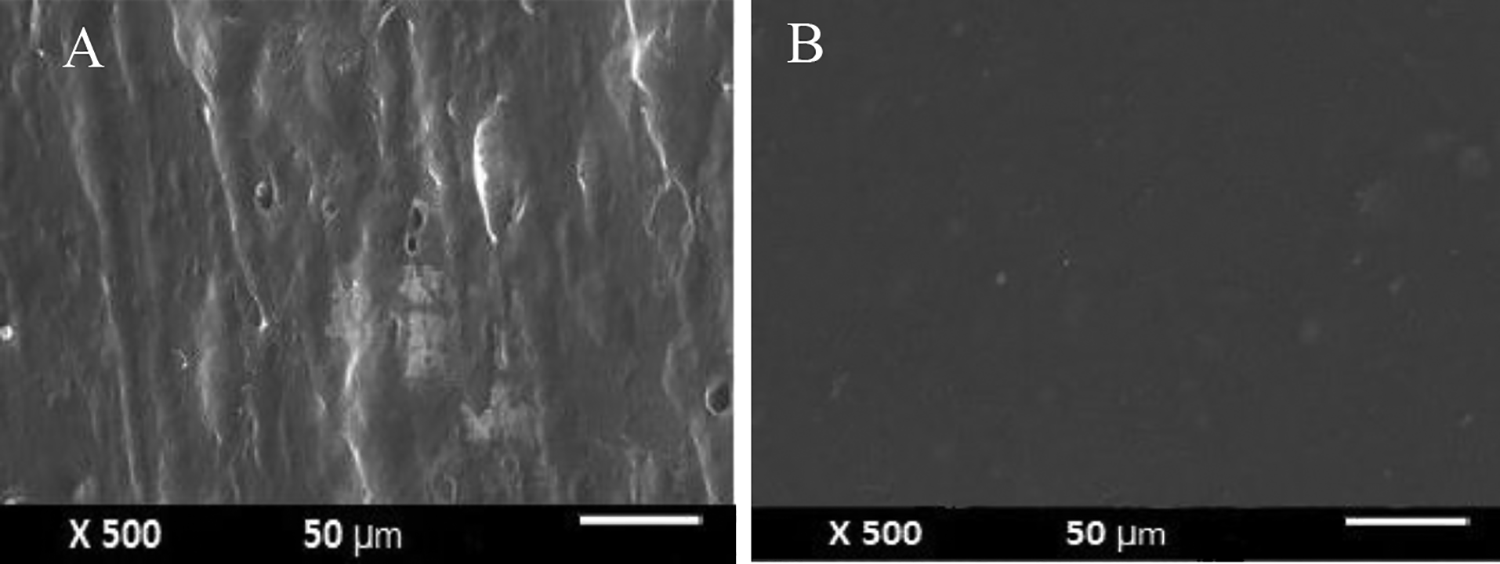
SEM micrographs of LDPE (A) and LDPE/8 wt.% NC composite (B).
Conclusions
The additions of NC fillers in LDPE matrix have achieved improvements in the thermal and mechanical properties of LDPE nanocomposites. From TGA results, it is interesting to find the thermal stability was increased with increasing NC content in LDPE. The incorporation 8 wt.% NC in LDPE showed a higher Tmax (410.7°C) than the Tmax of pure LDPE (395.6°C). From mechanical tests, the tensile strength and the Young’s modulus were increased significantly with the addition of different loadings of NC compared with the pure LDPE. The tensile strength and Young’s modulus of LDPE/8 wt.% NC composite were increased by (16.78 ± 1.25)% and (38.64 ± 2.82)% compared to that of LDPE. Strain at break was decreased slightly with increasing NC content into the LDPE matrix. The storage modulus was improved with increasing the loading of NC in the LDPE matrix. The storage modulus of the composite incorporating 8 wt.% NC in LDPE increased by 14% compared to pure LDPE. The LDPE nanocomposites was exhibited more resistance to increase the water absorption compared with that of LDPE. The results of the SEM morphology showed the proper mixing and dispersion of LDPE treated with 8 wt.% of NC.
Footnotes
Declaration of conflicting interests
The author(s) declared no potential conflicts of interest with respect to the research, authorship, and/or publication of this article.
Funding
The author(s) received no financial support for the research, authorship, and/or publication of this article.