
Abstract
The present study aims to investigate the water diffusivity into polystyrene/ calcium sulfate (PS/CaSO4) nanocomposite samples as a threat to the intended reinforcing properties. For this purpose, CaSO4 nanoparticles were synthesized through a chemical reaction using polyethylene glycol as the stabilizing agent. The polystyrene/calcium sulfate nanocomposites were fabricated through in situ polymerization of styrene monomer and stearic acid coated CaSO4 nanoparticles. SEM analysis was applied to determine the size and shape of the produced nanoparticles. In addition, TEM analysis was applied to study the general morphology and structure of the nanocomposites in order to confirm the PS/CaSO4 nanocomposites formation. FTIR analysis was employed to study the surface functions and bonds formation in both the surface treatment and nanocomposite preparation steps. Water diffusivity into the nanocomposites was evaluated through samples water exposure followed by calculation of the effective diffusion coefficients (Deff) using the diffusion equation given by Fick’s 2nd law. The calculation results have revealed that the obtained Deff values for water diffusivity in PS/CaSO4 (1.5 wt.%) and pure PS samples were 8.73 × 10⁻²⁰ and 11.1 × 10⁻²⁰ m2/s, respectively.
Introduction
Among all topics in nanotechnology, Polymer/Inorganic Nanocomposites (PINCs) are of a great interest including both polymer and inorganic materials properties.1–7 It is generally believed that the combination of these two material categories leads to several desired characteristics such as flexibility, homogeneity, lightness, cost-effective processing and physical properties concurrently. 8 It is worth noting that having control over the polymer and inorganic nanomaterials composition facilitates preparation of PINCs for specific applications. 9 Improved mechanical, thermal and barrier properties plus flame retardant enhancement have been successfully observed for this new class of materials.10–12 All the aforementioned properties are achievable only when the nano-phase is well dispersed in the polymeric matrix, so that larger interface region is gained leading to obtain a more homogenous product. That is severely affected by surface modification of the nano-fillers. In other words, larger interface is gained through modification of the surface properties with the help of surfactants resulting in a more homogeneous product.1,8–10 Although the lipophilic properties of nano-fillers become stronger after chemical surface treatment and they are mainly trapped by the polymeric chains of the matrix, their hydrophilic nature is not completely disappeared. This means that in a humid environment they may cause undesired effects on the nanocomposites efficiency. In other words, the primary goals of material reinforcement may be affected by moisture absorption at some nanoparticle loading levels. Therefore, gradual degradation of the nanocomposites and possible weakening of the adhesion force between the nanoparticles and polymer originating from the moisture uptake, damages the preliminary targeted purposes.13–15 In this regard, possibility of water diffusion into the PINCs should be counted as a crucial threat to their maintainability and performance.
Research on diffusion of water/ other solvents molecules into polymer/inorganic nanocomposites have revealed different results in various conditions. Investigation of humidity diffusion into intercalated and exfoliated Vinyl Ester/MMT clay nanocomposites indicated that the presence of silicate sheets in the matrix had made tortuous paths restricting water molecules mobility whereas moisture adsorption increased with a further rise in the clay content. 16 Diffusion of water and acetone into PVA/clay nanocomposite samples has also exhibited an improvement in both cases as a result of the high hydrophilicity of clay and also the free spaces inside the clay galleries. 17 Besides, the hydrogen bonds forming between coir and water molecules in natural rubber/coir fiber composites in exposure to distilled water and artificial sea water (an artificial salt mixture resembling the composition of sea water) demonstrated larger amounts of water diffusion through the composites rather than through pure rubber. 18 Furthermore, water diffusion into PA6/PP/OMMT nanocomposites has indicated that a higher diffusion rate was obtained for the nanocomposites which actually decreased with an increase in the amount of OMMT compared to the pure polymer. Such a trend resulted from the fillers agglomeration which acted as a barrier against water molecules passage. 19 Likewise, water diffusion into Epoxy resin/ nano-silica nanocomposites has designated that the diffusion coefficient was higher in nanocomposites than that in the pure epoxy resin which was attributed to the probable paths created as a result of nanoparticle introduction into the matrix. 20 Water vapor diffusion through PVA/Fumed Silica (FS) nanocomposite examination demonstrated that larger FS amounts led to a higher free volume thus promoting the diffusion event. 21 Also, water diffusion into both PP/clay 22 and starch/clay 23 nanocomposites have indicated improved diffusion rate in comparison with pure polymeric matrix, although water diffusion into starch/clay nanocomposites has conversely exhibited weaker water absorbance in the presence of clay layers in another study. 24
Accordingly, water diffusivity could be encountered as a leading factor in polymer based material aging and degradation the same as what occurs in sea water. 25 In this regard, conflicting humidity diffusion impacts on polymer nanocomposites properties have been observed. This brings out the necessity of further assessments of the consequences of inorganic nanoparticles incorporation in polymeric matrixes.
In the present research, polystyrene/calcium sulfate nanocomposite samples were synthesized. As a novel investigation, alterations in water diffusion behavior through the mentioned samples with various amounts of calcium sulfate nanoparticles were studied. Accordingly, the effective diffusion coefficients were calculated, as well. Calcium sulfate nanoparticles were chosen as hydrophilic yet not water soluble nano-fillers produced via a simple chemical method. Moreover, polystyrene was chosen due to its wide variety of applications in mechanical and structural engineering fields, owing to its highly desirable physical properties on the one hand and its low cost which makes it appropriate for processing and also its completely hydrophobic nature making it an ideal matrix for our experiments, on the other hand. Primary data of water amount diffused into the samples have been obtained via a simple weighing method which have been later converted to mass fluxes and substituted in the diffusion equation given by Fick’s 2nd law. Finally, the effective diffusion coefficients have been calculated and compared to each other for the interpretation of the influence of different nanoparticle loadings in polymeric matrix on water diffusion.
Experimental procedure
Materials
Calcium chloride (CaCl2), polyethylene glycol (PEG, Mw = 6000), stearic acid (CH3(CH2)16COOH), dichloromethane (CH2Cl2), styrene (St) monomer (analytical grade), sodium dodecyl sulfate (SDS), calcium hydride (CaH2) and sodium bicarbonate (NaHCO3) were supplied from Merck Chemical Co. Ammonium sulfate ((NH4)2SO4) and ammonium per sulfate (APS, (NH4)2S2O8) were purchased from Carlo Erba Co and Panreac Co, respectively. Laboratory deionized water was used to prepare the aqueous solutions.
Equipment and analysis sample preparations
SEM images were recorded by KYKY EM 3200 SEM instrument. The nanoparticles were dried in oven at 60°C for 24 hours and transferred to a glass slide followed by a gold coating step to become conducting and were prepared for SEM imaging accordingly. The FTIR spectra were obtained by a Perkin Elmer FTIR spectrophotometer. The samples obtained in different steps were first dried in oven and then mixed with KBr forming a pellet prepared for the spectroscopy. TEM micrographs were taken by Philips CM30. The images were taken from a nanocomposite emulsion drop diluted in water and further dried on a copper grid. All drying processes were carried out in 250938 Shimaz.co oven.
Calcium sulfate nanoparticles synthesis
Calcium sulfate nanoparticles were synthesized through a chemical reaction method adopted from the Ref.26,22 A 0.167 molar aqueous PEG solution was prepared (24.87 wt.%) and added drop-wise to a 0.108 molar aqueous calcium chloride solution (0.3 wt.%) under stirring for 1 hour. To complete formation of Ca-PEG complexes, the resultant solution was left to digest for 2 hours. Then a 0.108 molar aqueous solution of ammonium sulfate (0.35 wt.%) was added gradually to the previous solution under constant mixing. Calcium sulfate nanoparticles with average size of near 50 nm were produced and confined inside the complexes. The reaction-born nanoparticles were kept separated from each other by the interference of PEG as a non-ionic stabilizer. The steric repulsion induced by PEG molecules inhibited further growth of the nanoparticles as well as their interaction, thus agglomeration did not take place and the nanoparticles maintained their nano-size. The synthesis flowchart is presented in Figure 1 and the SEM image of the nanoparticles is demonstrated in Figure 4.
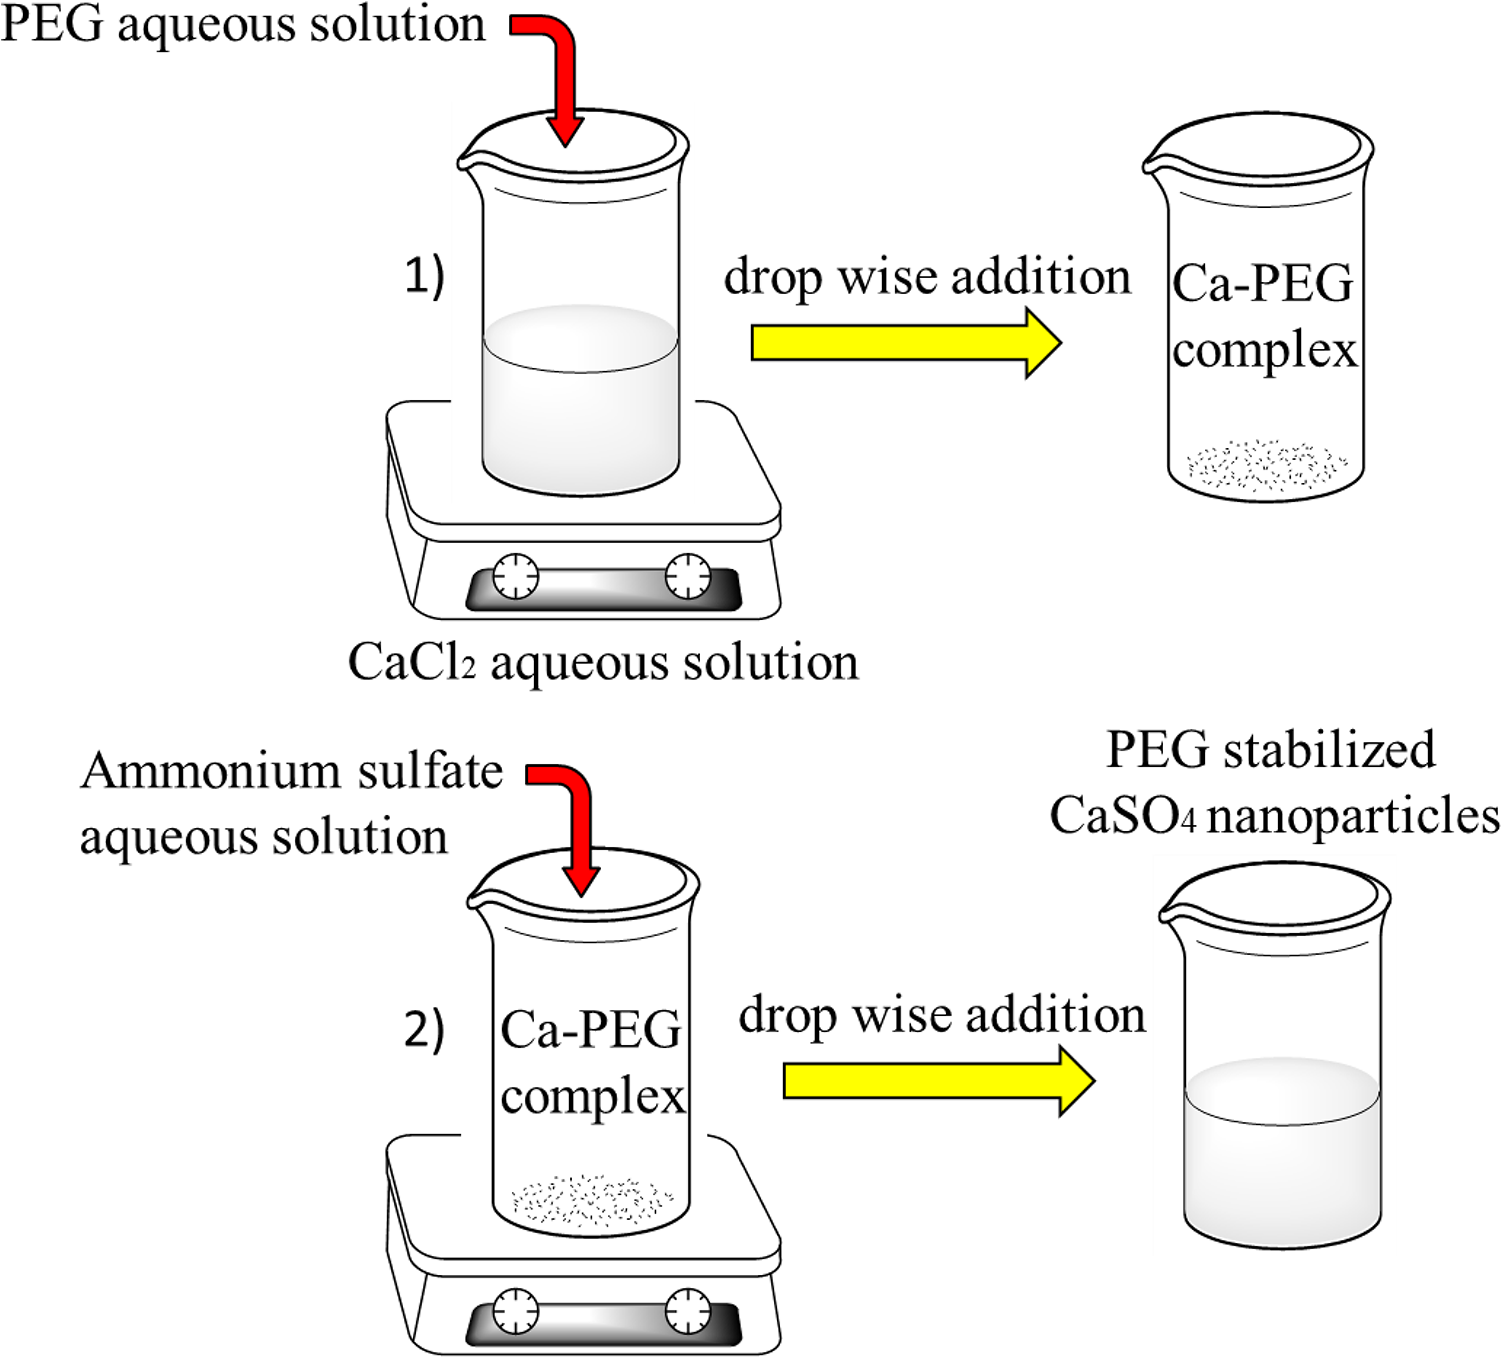
Flowchart showing CaSO4 nanoparticles synthesis through chemical reaction.

Illustration of surface modification of stabilized CaSO4 nanoparticles as preparation for polymerization step.

Schematic of polystyrene/CaSO4 nanocomposite fabrication through emulsion polymerization and further preparation for water uptake evaluation.
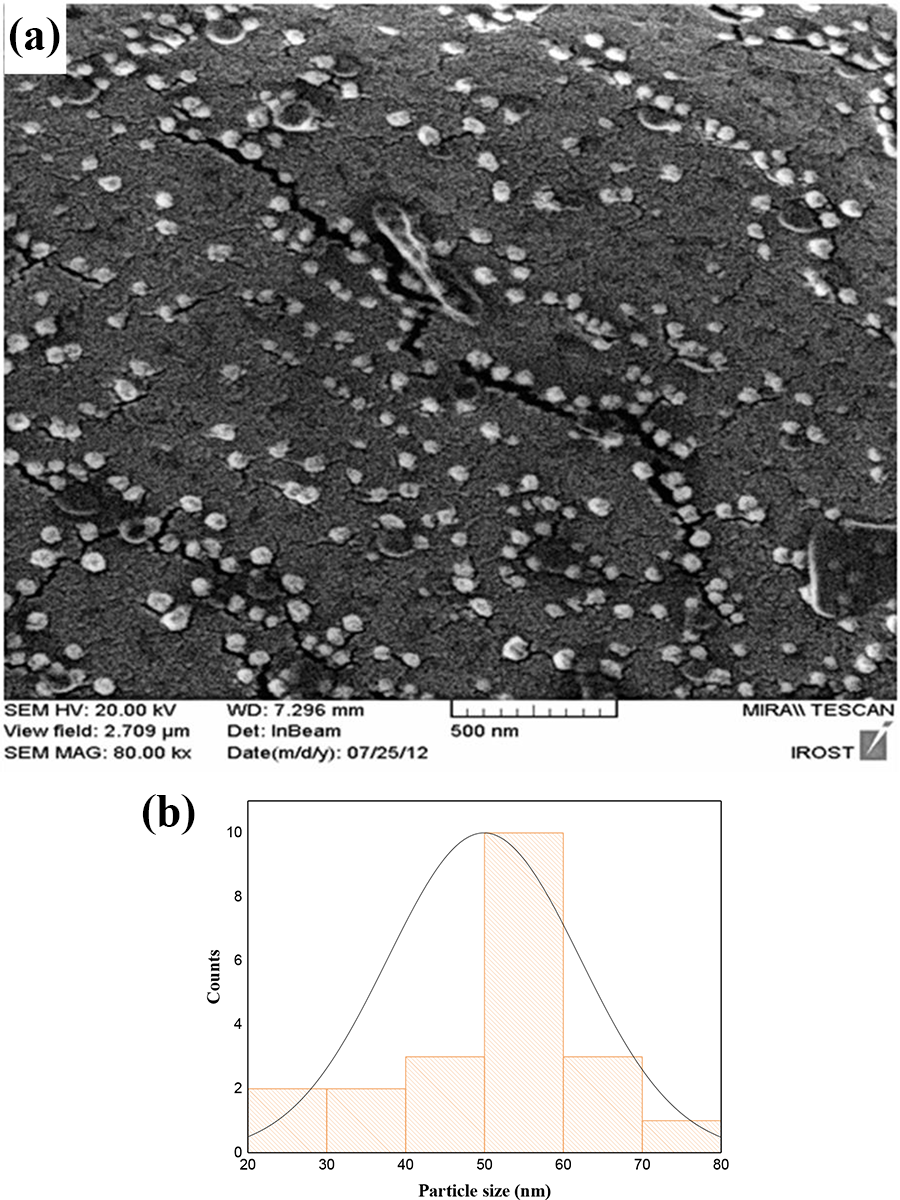
(a) SEM images of the calcium sulfate nanoparticles obtained through chemical reaction explained in section 2.3 (b) The size distribution curve of the produced CaSO4 nanoparticles (average size: 49.9 nm).
Nanoparticles surface modification
Chemical surface modification of the nanoparticles was carried out to increase compatibility between polystyrene (PS) matrix and calcium sulfate nanoparticles for enhancing the homogeneity and greater dispersion levels of nanoparticles. For this purpose, PEG was first removed from the surface of nanoparticles via an extraction method using dichloromethane that is largely immiscible in water, although capable of dissolving PEG molecules. This step was followed by drop-wise addition of PEG-free nanoparticles aqueous solution to a proper amount of stearic acid which was previously dissolved in ethanol and heated up to about 50°C under constant stirring for half an hour. Then it was left to cool down to the room temperature. Minimum amount of stearic acid required for covering the calcium sulfate nanoparticles surface was calculated (at least 0.05 g for each 0.367 g produced CaSO4) as described in the Ref.27,23 Extra stearic acid and other undesirable materials were washed out two to three times by ethanol and deionized water with the help of centrifugation. Eventually, the deposited powder was dried in oven at 50°C for further polymerization. The relevant schematic is illustrated in Figure 2. The results of removing PEG from the nanoparticles surface and coating by stearic acid were confirmed by FTIR, as depicted in Figure 5.

FTIR spectra of a) PEG-free calcium sulfate nanoparticles obtained through extraction and b) Stearic acid modified calcium sulfate nanoparticles obtained from surface modification explained in section 2.4.
PS/CaSO4 nanocomposite fabrication
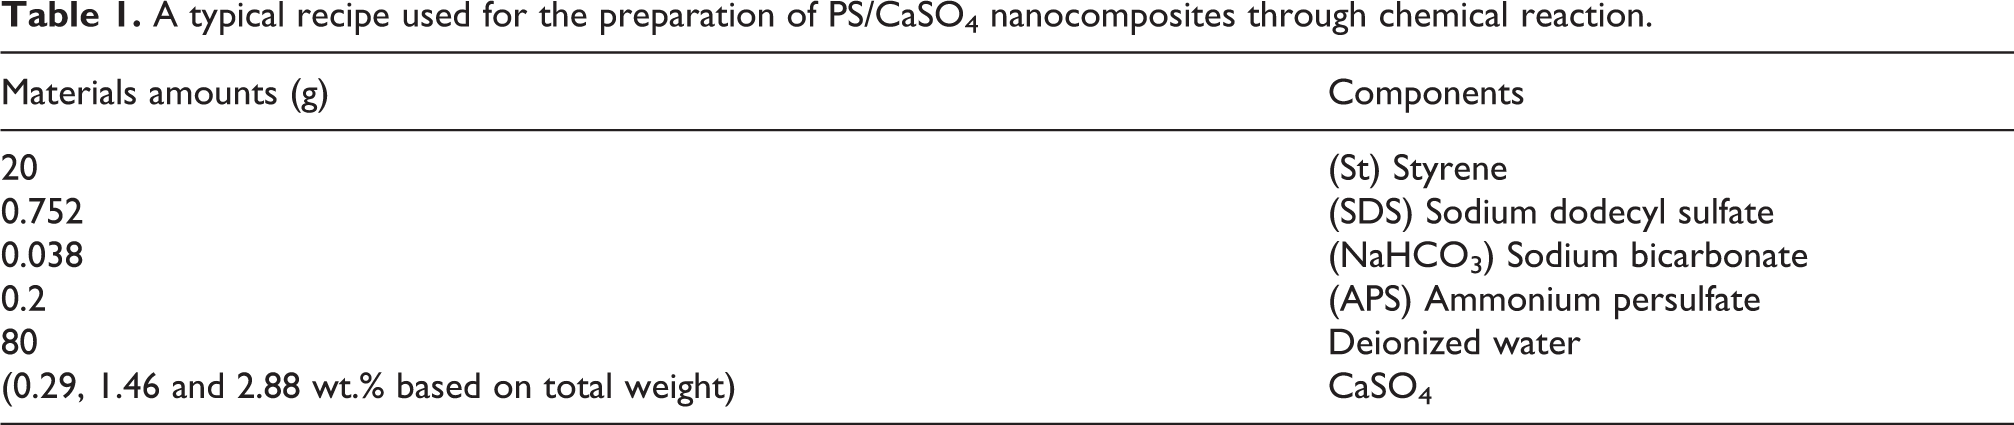
In situ emulsion polymerization method was chosen because of its simplicity for laboratory experiments and also to avoid probable nanoparticles aggregation during nanocomposite fabrication. Styrene was first washed with 5 wt.% NaOH solution to remove inhibitors, dried over calcium hydride and stored at 0°C. Emulsion polymerization took place in a three-necked round bottom reactor equipped with a reflux condenser, a thermometer and a nitrogen gas inlet and kept in a paraffin oil bath to fix the temperature at 80°C. Mixing was done with the aid of a magnetic stirrer. The materials concentrations were chosen based on the relevant previous experiences and literature at three stages of low, medium and high levels to avoid either too low or high incorporations and covering a range of possible detectable outcomes. In a typical procedure, in order to form nanocomposites of 1.5, 7.5 and 15 wt.%—based on weight of dry monomer—calcium sulfate nanoparticles (0.29, 1.46 and 2.88 wt.%—based on total weight) were dispersed in a definite amount of deionized water and poured into the reactor. SDS and sodium bicarbonate buffer were then added to the vessel (0.74 and 0.037 wt.% in the blank (nanoparticles-free) solution). Afterward purified styrene (19.8 wt.% in the blank solution) was fed into the reactor and nitrogen was purged over the mixture to reduce oxidation. The mixture was stirred at 400 rpm and heated up to 80°C. Then APS (0.2 wt.% in the blank solution) was dissolved in a little amount of water and poured into the reactor. The polymerization process lasted for 6 hours and the final milky emulsion of polystyrene droplets containing calcium sulfate nanoparticles was poured into petri dishes and dried in oven at 70°C for 24 hours. The materials amounts are given in Table 1 and the fabrication process is depicted in Figure 3. The obtained nanocomposites of different loadings are titled as NC-wt.% in the article in which the weight percentages are reported as weight of nanoparticles to that of dry monomer.
A typical recipe used for the preparation of PS/CaSO4 nanocomposites through chemical reaction.
Sample exposure to water
Dried samples were so brittle that we could not shape them into sheets or films for water exposure. Therefore, we pounded them to powder followed by a proper screening step. Finally, particles with an average size of 89.5 micrometers were separated and located inside a totally sealed vessel containing deionized water at room temperature under constant stirring for 5 days. We believe that forming the samples into powder leads to a higher contact surface area which along with the nonstop mixing action could probably induce mass transfer and facilitate the water diffusivity. Sampling was performed every 24 hours: a definite amount of the wet nanocomposite powder (m1) was taken out from each container and placed in a small dish with known weight. Then it was dried at 50°C for about 100 minutes (or higher if needed after checking the surface) in order to vaporize the surface moisture. After the surface was completely dried such that no water droplets were left on it (no apparent moisture could be observed), this dry sample was weighed by a high accuracy balance (m2). A second step of drying took place at 70°C for 24 hours to vaporize the diffused water from the inner parts of the samples (fully dry samples), followed by a second weighing step (m3). All the samples were prepared and evaluated via the same procedure thus the results are obtained on a comparative basis. To obtain the amount of water diffused into the samples, we used equation 1


Results and discussion
Characterizations
Nanoparticles preparation
Characterization of the produced CaSO4 nanoparticles was carried out by SEM analysis (Figure 4). The average nanoparticle size obtained from the distribution curve in Figure 4b is approximately 50 nm. It should be noted that the shape of the particles observed in the image is relatively round, a morphology between sphere and cubes is acceptable. Plus, their salt nature implies them for assuming cube-like structures, so that for the following calculations in section 3.2.1 cubes were chosen as the shapes which were readily applied in the slab model for diffusion and they successfully responded to the initial assumptions.
Nanoparticles surface modification
Removing PEG from the particles surface and their surface treatment with stearic acid were confirmed and characterized by FTIR spectroscopy. Based on the spectra obtained, absence of PEG characteristic peaks at 1100 and 2900 cm−1 representing C-H and C-O stretching bonds proves that PEG was totally removed from the particles surfaces (Figure 5a) which is in accordance with the Ref.28,24 In addition, according to Figure 5b the presence of new peaks at 2849 and 2917 cm−1 (C-H stretching bond) and1704 cm−1 (C=O stretching bond) reveals attachment of stearic acid functional groups on the nanoparticles surface.
Besides, the peaks appearing at 1620 and 720 cm−1 could demonstrate carboxylic salt formation and the presence of a long alkyl chain on the particles surface, respectively, which is similar to previous reports.27,23
Nanocomposite fabrication
Formation of PS/CaSO4 nanocomposites was characterized by FTIR spectroscopy and TEM analysis (Figures 6 and 7). According to Figure 6, the absorption peaks at 3025 and 3059 cm−1 (C-H aromatic stretching vibration), 2921 cm−1 (C-H stretching vibration), 1600 and 1451 cm−1 (C-C phenyl ring stretching vibration) and 755 and 698 cm−1 (C-H phenyl ring vibration) clearly assign the formation of polystyrene. Furthermore, the wide peaks at 1154 and 1182 cm−1 obviously explain the existence of calcium sulfate nanoparticles in the nanocomposites and the peak near 700 cm−1 could be attributed to C-S bond formation which confirms nanocomposite formation.29,30
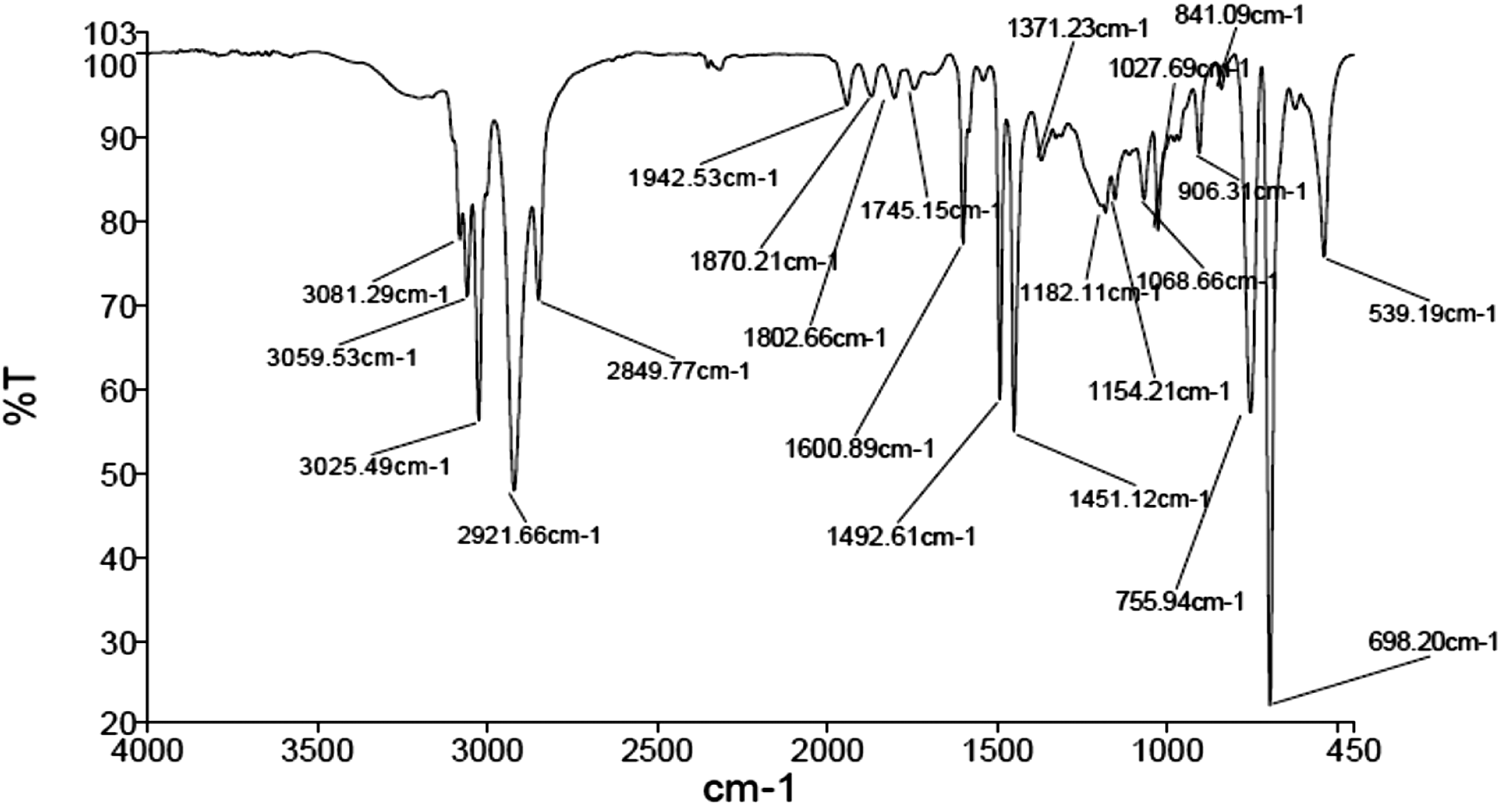
FTIR spectrum of PS/CaSO4 nanocomposite (1.5 wt.%) prepared using emulsion polymerization method described in the section 2–5.

TEM images of PS/CaSO4 nanocomposite (1.5 wt.%) visualizing the successful nanocomposite formation through emulsion polymerization.
The internal morphology of polymer nanocomposites as well as nanoparticle size can be realized using TEM images of the samples as demonstrated in Figure 7. A dilute drop of nanoparticles in deionized water was placed on a copper grid and the images were obtained followed by interactions between the electron beam and the ultrathin specimen produced on the grid. Considering the electrons passing the samples and reaching the screen for creating the image, as they meet crystals with faces being oriented in comparison with an amorphous material such as the polymer matrix, they appear much darker in the final image as a consequence of the diffraction contrast occurring in the bright field mode. Accordingly, as it can be seen in the figure, the lighter parts of the substance reveal the polymeric chains and the small dark parts are ascribed to the crystalline structure of the calcium sulfate nanoparticles. Thus, TEM images confirm that the nanoparticles were totally grabbed/encapsulated by polystyrene layers and were completely embedded inside the polymer matrix approving the nanocomposite structure formation. Besides, the size of the nanoparticles is in accordance with the SEM images to be at an average of 50 nm.
Therefore, considering the FTIR peaks and TEM images, the interface has necessarily been formed between the nanoparticles and polymer matrix eventually, thus based on the nanocomposite definition its formation is confirmed at nano-scale.
Water diffusion
Water absorption curves for pure PS and the nanocomposites are depicted in Figure 8. As displayed in the figure, it can be observed that the moisture-time curve of pure PS with less than 1 wt.% water uptake is located below those of the nanocomposite samples, which represents lower overall water content in the hydrophobic pure matrix than the nanocomposites. On the other hand, it can be seen that with introducing 1.5 wt.% inorganic hydrophilic CaSO4 nanoparticles in the matrix the water equilibrium weight increased almost 4% which was followed by a continuous decrease with incorporation of higher contents of nanoparticles in the samples from 1.5 wt.% to 15 wt.%. However, the mentioned fall is much more considerable for NC-15 wt.% compared to NC-7.5 wt.%. Such that, while the diffusion curves of NC-1.5 wt.% and NC-7.5 wt.% samples are located very close together with a very slight difference between their water contents as well as similar trends of changes over time, the diffused water content in NC-1.5 wt.% reached almost its half amount in NC-15 wt.% at the end of the time range together with a much smaller moisture-time slope during the period. Besides, the curve for NC-15 wt.% reached the equilibrium level relatively rapidly after passing about one fifth of the time range standing at its final moisture amount.

Water weight percentage (% water uptake) in the nanocomposite and pure polymer samples versus time graph depicting the diffusion behavior as a result of nanoparticles loading.
It seems that introduction of hydrophilic nanoparticles into the totally hydrophobic matrix had two counteracting effects on the matrix water absorption behavior. On the one hand, the presence of calcium sulfate nanoparticles in the polymeric matrix has changed its general tendency to water absorption in a way that higher hydrophilicity originating from the nanoparticles inorganic nature was induced in the matrix leading to higher overall moisture amounts in the nanocomposite samples than the pure matrix. On the other hand, increasing the nanoparticles loading levels in the matrix resulted in a reduction in water equilibrium weight. That seems to be governed by the interactions between the nanoparticles and the polymeric chains; as a matter of fact, it is assumed that these inorganic nanoparticles were trapped within the chains forming clusters at higher loading levels and consequently most of the free spaces between the polymer chains were occupied by theses nanoparticles. Therefore, despite the anticipated hydrophilicity induced by the nature of calcium sulfate nanoparticles in polystyrene, blockage of the gaps among the chains by the nanoparticles revealed a dominant effect and as a result, fewer water molecules could pass through the chains. Hence, although at the initial steps of nanoparticle loading a growth has been observed in the nanocomposites’ total moisture content, higher concentrations of nanoparticles eventually resulted in a barrier effect created by changes in the patterns of nanoparticle embedding among the chains at high loadings and possible aggregations, all of which led to disrupting the aimed water tendency induction in the polymer.
Effective diffusion coefficient
Diffusion equation given by Fick’s 2nd law, was solved for polystyrene and the nanocomposite samples assuming cubic-shaped particles for the powder implying that they were all considered collectively as a slab against the water diffusing flux. The diffusion equation, the initial and boundary conditions are written as follows (Eq. 2):
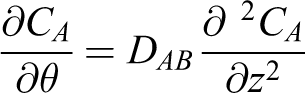

Here, CA,
Solving and simplifying the above equation lead us to the following equation which is employed to find the effective diffusion coefficients.


where

Considering that the samples were dry at the beginning, CA0 is equal to zero. The calculated effective diffusion coefficients are given in Table 2.
Effective diffusion coefficients calculated for the pure polymer and PS/CaSO4 nanocomposite samples.

As it can be observed from this table, loading 1.5 wt.% nanoparticles in the matrix slightly reduced the effective diffusion coefficient of the matrix primarily which afterward reached its minimum value of 7.497 × 10 −20 m2/s for 7.5 wt.% nanoparticles content (Table 2).
Conversely, increasing the nanoparticles content to 15 wt.% led to a considerable rise in the effective diffusion coefficient to a maximum value of 307 × 10−20 m2/s. For a better insight, the order of D values is presented as below:

The apparent structures of the nanocomposites and the pure matrix are illustrated through SEM images presented in Figure 9.
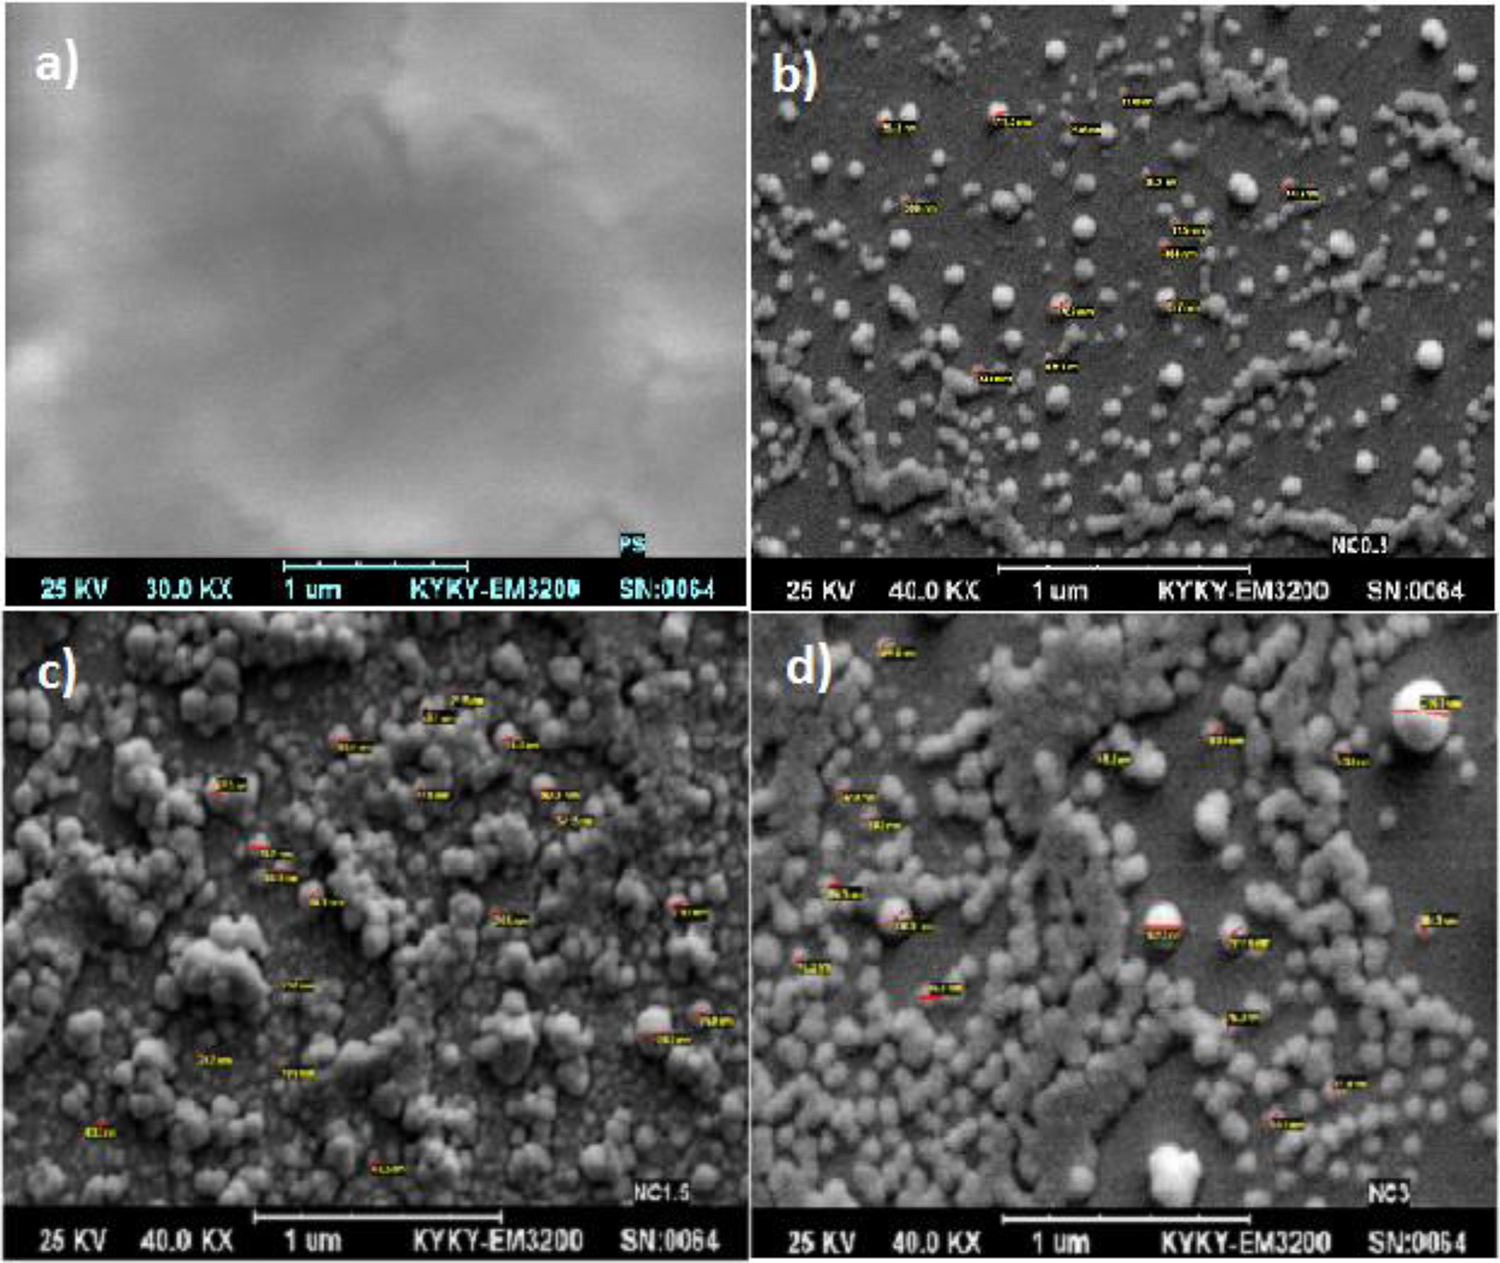
SEM images of (a) pure PS (b) 1.5 wt.% (c) 7.5 wt.% and (d) 15 wt.% nanocomposite samples illustrating the dispersion and agglomeration behavior followed by nanoparticles incorporation.
Once again, we can see that addition of calcium sulfate nanoparticles to polystyrene matrix demonstrated two contrary effects on effective diffusion coefficients. On the one hand, it prevented water from passing through the sample in lower loading contents, and on the other hand, it promoted the water diffusivity of the matrix at the highest nanoparticle amount applied. In other words, in the first two nanoparticle weight percentages of 1.5 and 7.5%, the reinforcing effect was expressed and it was visualized that the spaces between the chains were filled with the nanoparticles which prevented water molecules from crossing through the polymer chains. Thus, diffusion became harder and the effective diffusion coefficients declined to lower values than that obtained for pure PS. However, in case of 15 wt.% loading, the hydrophilic nature of the nanoparticles and their probable agglomeration at larger amounts were dominated. Besides, agglomerated particles could grow in size and consequently have lower surface area. Therefore, surface modification could have occurred imperfectly leaving some uncovered parts which could finally result in weaker interactions with the matrix. This phenomenon could have created preferable paths for water molecules as nano-gaps around hydrophilic nanoparticles and enhance the water molecules diffusion. In addition, it can be noticed in Figure 9 that smaller and more compact particles (as demonstrated in Figure 9c) regarding 7.5 wt.% nanocomposite, may have made the diffusion harder which is consistent with D value obtained for this sample. On the other hand, the larger particles in Figure 9d with larger interspaces may partly prove the higher D value gained for the sample containing 15 wt.% nanoparticles.
Comparing with the relevant studies, it could be realized that the amount of nano-filler loadings as well as the shape, aspect ratio and also the hydrophilic/hydrophobic nature of the nano-fillers could play an important role in the water diffusion behavior in a polymer nanocomposite. However, the polymer’s nature is the other important factor affecting this phenomenon. Accordingly, investigation of nano-clay presence in different polymers have demonstrated both effects of enhancement and weakening of the water diffusivity; such that the high aspect ratio of the sheets could emerge a tortuous path inside the polymer matrix which acts as a barrier for the migrant molecules, while their hydrophilic nature on the one hand and the galleries created by the sheets on the other hand could serve in a totally opposite manner and promote transferring water molecules inside the nanocomposites.16,17 However, none of the above mentioned mechanisms can be considered for the present synthesized CaCO4 as they should be remarked as round particles. Meanwhile, agglomeration of different shaped nanoparticles could alter the water diffusivity results through different ways. It has been demonstrated that agglomeration of clay layers in polypropylene/ polyamide matrix led to blockage of the polymer empty spaces/ voids which consequently hindered the water migration inside the polymer, 19 which it is totally in contrast to our results. As a fact, in case of the present low aspect ratio CaSO4 nanoparticles the agglomeration in high concentrations could take place both before polymerization and during the polymerization, which was in favor of hydrophilicity enhancement as well as weakening the interface between polymer and the particles surfaces. This has resulted in formation of gaps around the agglomerates separating the particle from the matrix and consequently supporting the water molecules transport.
In brief, it can be understood that considering a wide range of structural, mechanical and thermal applications of polymers such as polystyrene, it is substantial to find the appropriate criteria for incorporation of hydrophilic nano-size reinforcement materials from the moisture diffusion point of view. Automotive and construction industry may be considered as the most critical fields to employ such improved generations of materials including the similar polymer nanocomposites so that they should essentially be assessed in terms of safe addition criteria of nano-fillers beforehand.
Conclusion
Polystyrene/calcium sulfate nanocomposites have been prepared through in situ polymerization of styrene in the presence of stearic acid stabilized calcium sulfate nanoparticles in order to study the possibility of water diffusion into the nanocomposites. Effective diffusion coefficients have been obtained for the samples containing different weight percentages of nanoparticles with the help of diffusion equation given by Fick’s 2nd law. The results have demonstrated that introduction of these inorganic nanoparticles into the polymeric matrix had two opposite simultaneous effects. It was realized that the presence of smaller and more compact nanoparticles in the samples induced a reduction in the effective diffusion coefficient values. That is due to the strength effect being dominant in the aforementioned cases which could be attributed to the spaces between the chains filled with the nanoparticles leading to lower effective diffusion coefficients. While, by raising the concentration of nanoparticles to 15 wt.% in the matrix, the hydrophilic nature of nanoparticles and possible agglomeration of them at larger amounts were dominated which caused a decline in the effective diffusion coefficient values followed by a substantial increase. Hence, one can conclude that high loadings of inorganic nanoparticles such as calcium sulfate in polystyrene or similar polymers may improve the possibility of water diffusion through the nanocomposite and it is essential to consider an optimum incorporation limit for polymer reinforcing purposes.
We appreciate the head of the chemical engineering faculty of Tarbiat Modares University for providing laboratory facilities. The experiments and analyses have been performed receiving Tarbiat Modares University research grant awarded to MSC students.
Footnotes
Declaration of conflicting interests
The author(s) declared no potential conflicts of interest with respect to the research, authorship, and/or publication of this article.
Funding
The author(s) received no financial support for the research, authorship, and/or publication of this article.