Abstract
Banana fiber-reinforced nanocomposites were fabricated by melt mixing in a twin-screw extruder followed by compression molding in this study. Maleic anhydride polypropylene copolymer (MA-g-PP) was used as a compatibilizer to increase the compatibility between the PP matrix, clay, and banana fiber to enhance exfoliation of organoclay and dispersion of fibers into the polymer matrix. Variation in mechanical, thermal, and physico-mechanical properties with the addition of banana fiber into the PP nanocomposites was investigated. It was observed that presence 3 wt% of nanoclay and 5 wt% MA-g-PP within PP matrix results in an increase in tensile and flexural strengths by 41.3%, and 45.6%, respectively, compared with virgin PP due to the high aspect ratio of clay stacks in the fully exfoliated nanocomposites. Further, incorporation of 30 wt% banana fiber in PP nanocomposites system increases the tensile and flexural strengths to the tune of 27.1%, and 15.8%, respectively. The morphology of fiber-reinforced PP nanocomposites has been examined using scanning and transmission electron microscopies. Significant enhancement in thermal stability of nanocomposites was also observed due to the presence of nanoclay under thermogravimetric analysis. Dynamic mechanical analysis tests revealed an increase in storage modulus (E′) and damping factor (tan δ), conforming the strong interaction between nanoclay/banana fiber and MA-g-PP in the fiber-reinforced nanocomposites systems.
Introduction
The development of new composite materials based on both industrial and techno-economical criteria has been dominated by research for adequate mechanical and thermal performances. Natural fibers provide indisputable advantages over conventional reinforcement materials such as low cost, low density, non-toxicity, recyclability, acceptable strength, high specific properties, and minimum waste disposal problems. These materials can be suitably used in different sectors like aircrafts, aeronautics, automobiles, as well as in civil engineering applications.1–3 Fiber-reinforced composite materials offer high strength-to-weight ratio, improved dimensional stability, and better environmental resistance compared to conventional composites. Banana fiber obtained from the pseudo-stem of banana plant (Musa sepientum) is a stem fiber, widely distributed in tropical countries and has been a waste product of banana cultivation. The fibers can be used for various industrial purposes without further investment in fiber extraction and retting. The superior mechanical and thermal properties of natural fibers are associated with their high cellulose content and comparatively low microfibrillar angle. However, their hydrophilic character has been the primary cause for poor compatibility with the hydrophobic polymers used as matrix, which leads to composites with unsatisfactory mechanical and thermal properties.4,5 Hence, interaction between the natural fibers and the matrix plays a vital role in obtaining composites with desired attributes. Surface treatment of the fibers using chemical treatment techniques, such as acetylation, benzylation, plasma treatment, and mercerization have been observed to impart certain degree of interfacial interaction with the polymeric matrices, thereby improving its overall performance characteristics. Maleic anhydride-grafted polypropylene has been proved to function as an effective coupling agent in modifying the interfacial interaction between the natural fibers and PP matrix. 6 Technological performance of composites such as mechanical and thermal properties depends largely on fiber quality, fiber matrix interface, and fiber–polymer mixing ratios. Polypropylene being a versatile thermoplastic matrix has been widely investigated as a consequence of its recyclability and low processing cost for massive production.7,8 Several studies pertaining to the stability of lignocellulosic natural fibers have also been investigated by the authors in different systems like jute/PP, sisal/PP, banana/glass fiber hybrid composites, etc.9–11
Polymer nanocomposites have emerged as a new class of materials and attracted considerable interest and investment in research and development worldwide. The pioneering studies on clay-derived nanocomposites were first initiated by Toyota research team, wherein exfoliation of clay galleries into a nylon 6 matrix to increase modulus and strength at break, without compromising its impact resistance, had been reported. 12 Toyota’s innovation triggered several similar investigation focusing on the benefits of the nanoclays as a potential candidate for reinforcing agent in a wide variety of thermoplastics,13–15 as well as thermoset matrices.16,17 Studies focusing on PP-based nanocomposite systems have been reported by various authors.18,19 Shariatpanahi et al. 20 observed an improvement in tensile modulus and impact strength of PP matrix by 15% and 22%, respectively, with the addition of montmorillonite clay via direct melt mixing method. However, extensive literature survey indicates that the effect of fiber reinforcement on the performance of polypropylene nanocomposites systems needs to be explored. The expected increase in strength of fiber-reinforced nanocomposites can only be achieved if all factors such as void content, fiber wetting, and adhesion remain unaffected. Investigations done by Lei et al. 21 indicate improved mechanical and thermal behaviors in case of HDPE/pine/clay nanocomposites. The authors own work on PP/PALF nanocomposite matrix system, employing two-stage processing, showed exfoliation of clay galleries with the incorporation of PALF fibers. Also, improved mechanical and thermal properties were obtained compared with virgin polymer and nanocomposite matrix. 22
In this investigation, variation in mechanical properties of banana fiber-reinforced nanocomposites as a function of nanoclay and fiber loading has been evaluated. The fiber-reinforced nanocomposite samples are also subjected to dynamic mechanical analysis (DMA) to evaluate the glass transition temperature (Tg), stiffness, and damping properties under specific periodic stress. The morphology of composites was also observed using scanning electron microscopy (SEM) and transmission electron microscopy (TEM). Thermal stability of samples has been studied using differential scanning calorimetry (DSC) and thermogravimetric analysis (TGA).
Experimental
Materials and Method
Isotactic polypropylene (H110MA), density 0.91 g/cc and melt flow index 11 g/10 min, obtained from M/s Reliance Industries, India, has been used in the study as the base polymer matrix. Cloisite 20A (C20A), organically treated montmorillonite with dimethyl-dehydrogenated tallow quaternary ammonium having cation exchange capacity of 95 meq/100 g clay, procured from M/s Southern Clay Products (Gonzales, TX, USA), has been used as nanoclay. Epolene G-3003, having density 0.91 g/cc and acid number 8, and molecular weight 26,000, was procured from M/s Eastman Chemicals, Germany and has been used as coupling agent. Banana fibers obtained from M/s Sheeba Fibers and Handicrafts, Poovancode, Tamilnadu, India were used as a reinforcing agent.
Fabrication of PP/clay/banana Fiber Nanocomposites
The fibers were soaked in caustic soda solution with 2N concentration at ambient temperature. Subsequently, the fibers were washed several times with distilled water and pH of the solution was maintained at 7 to bring about complete removal of alkali. The fibers were then dried at room temperature for 48 h, followed by oven drying at 70°C for 3 h to remove the moisture content. Finally, the fibers were kept in airtight polyethylene bags to overcome moisture ingress. To insure easy blending of the fibers with the PP matrix, these caustic soda-treated fibers (mercerized banana fiber, MBF) were cut into a fiber length of ∼5 mm using an electronic fiber-cutting machine.
Compounding was carried out using a melt mixer (Haake Rheocord 9000, M/s Haake, Germany) having two banbury rotors and a mixing chamber with volumetric capacity of 69 cm3. The compounding was done in two steps. In the first stage, PP nanocomposites containing different weight% values of Cloisite 20A nanoclay (1, 2, and 3 wt%) with maleic anhydride polypropylene copolymer (MA-g-PP) at 5 wt%, were prepared at a temperature of 180°C with a mixing speed of 40 rpm for a duration of 15 min. In the second stage, optimized PP (OPP) nanocomposites was melt blended with different weight% values of MBF (10%, 20%, 30%, and 40%) with a mixing speed of 45 rpm for a duration of 15 min at 190°C. The melt mixers were brought down to room temperature and stored in airtight containers prior to use. Specimens were prepared by compression molding (Delta Malikson Pressman 100T) at 180°C temperature employing a cycle time of 10–15 min to produce sheets of 3 ± 0.1 mm thickness.
Characterization Techniques
Mechanical Properties
PP, OPP, and OPP/MBF nanocomposite sample specimens of dimension 165 × 2.7 × 3 mm3 were subjected to tensile test, using Universal Testing Machine (UTM, LR 100K Lloyds Instruments, UK) as per ASTM D 638, at cross-head speed 50 mm/min and gage length 50 mm. Specimens of dimension 127 × 12.7 × 3 mm3 were subjected to flexural test under three-point bending, made using the same UTM (LR 100K Lloyds Instruments, UK), as per ASTM D 790. A cross-head speed of 1.3 mm/min and span length of 50 mm were used for carrying out the test. Izod impact strength for the specimens of dimensions 63.5 × 12.7 × 3 mm3 was determined as per ASTM D-256, with ‘V’ notch depth of 2.54 mm and notch angle of 45°, using impactometer 6545 (CEAST, Italy).
Thermal Properties
The melting, crystallization, and thermal stability of virgin PP, PP nanocomposite, and fiber-reinforced PP nanocomposite samples have been studied using DSC (Perkin-Elmer Diamond DSC, USA) and TGA (Perkin-Elmer Pyris-7 TGA,USA), respectively.
DSC analysis was carried out using 5–10 mg of samples at a scanning rate of 20°C/min and temperature range of 30–200°C under nitrogen atmosphere. Corresponding melting temperature, heat of fusion, and crystallization temperature were recorded.
Similarly, thermal stability of virgin PP, the nanocomposite, and fiber-reinforced nanocomposite samples has been studied using 5–10 mg weight samples, which were scanned from 40°C to 600°C at a heating rate of 20°C under nitrogen atmosphere to evaluate the peak temperature for DTG curve. The initial and final degradation temperatures and corresponding percentage weight loss for the samples were noted.
Scanning Electron Microscopy
The SEM of tensile fractured composite specimens was carried out using JEOL-JSM T330A (Germany).The samples were sputter-coated with platinum and were dried for 30 min at 70°C in vacuum prior to analysis.
Transmission Electron Microscopy
Samples for TEM imaging were sectioned using Lieca Ultracut UCT microtome at room temperature using a diamond knife (M/s Lieca, UK). Sections of 50–70 nm thickness were collected from water on a 300 mesh carbon-coated copper grids and were kept overnight on filter paper for drying. Subsequently, TEM of tensile fractured specimens was carried out using electron microscope (JEOL-1200 EX, Japan) at an accelerating voltage of 80 kV.
Dynamic Mechanical Properties
The dynamic mechanical behavior of the samples was studied using dynamic mechanical thermal analyzer (NETZSCH DMA 242). The experiments are carried out at fixed frequency of 1 Hz and heating rate of 10°C/min. The tests were conducted in a temperature range −150°C to 200°C using specimen of dimensions 40 × 10 × 3 mm3.
Results and Discussion
Effect of Nanoclay and Banana Fiber on Mechanical Properties of Fiber-reinforced Nanocomposites
The mechanical properties of nanocomposites determined as a function of nanoclay and fiber loading with 5 wt% of MA-g-PP are represented in Table 1. It is evident from the results that with the incorporation of 3 wt% of nanoclay shows an optimum increase in the mechanical properties of virgin PP. The tensile and flexural strengths increased by 40.82% and 45.67%, respectively, compared with the virgin matrix, which is probably due to the uniformly dispersed organoclay within polymer matrix. Addition of MA-g-PP as compatibilizer also facilitates expansion of the gallery spacing due to the inclusion of polar groups in the clay layers through hydrogen bonding. Similar investigations have also been reported by Hasegawa and Usuki, 23 and Kawasumi et al. 24 The tensile and flexural moduli also exhibited a dramatic increase to the tune of 34.39% and 89.24%, respectively, at a clay loading of 3 wt% and MA-g-PP concentration of 5 wt%. As reported by other investigators, the anhydride part of MA-g-PP links with the Si–O– group of the C20A nanoclay, which contributes to increased mechanical properties. The notched impact strength of the matrix polymers showed a marginal increase from 19.2 to 27.92 J/m at clay loading of 2 wt%. However, beyond 2 wt%, i.e., at 3 wt% of clay loading, the impact strength reduced to 20.32 J/m, which is nearly comparable to the impact strength of virgin PP. This indicates the probability of agglomeration in the nanocomposite matrix, which leads to less resistance to shock loading and hence less impact strength. Since 3 wt% of clay loading gives optimum tensile and flexural properties while maintaining the impact strength, this composition has been retained for fabrication of fiber-reinforced nanocomposites (OPP/MBF system). Additionally, incorporation of MBF into OPP nanocomposites showed a consistent increase in the mechanical properties. Nearly, 27.1% increase in the tensile strength and 101.3% increase in modulus were observed due to the incorporation of 30 wt% of MBF. The flexural strength and modulus increased to 15.8% and 95.1%, respectively. The impact strength is also increased to 28.12% compared with OPP matrix. This increment in the mechanical properties revealed that MBFs with uniform cross-section have the capability to support effective stress transformation in the nanocomposites matrix. Furthermore, the high-molecular weight MA-g-PP has more flexible chains, which are able to diffuse into the matrix leading to inter-chain entanglements, thereby contributing to the mechanical continuity of the system. This can be further supported by the ester linkage between the anhydride part of MA-g-PP and hydroxyl part of natural fiber; similar finding was also observed in our previous studies on PP/PALF nanocomposite. However, beyond 40 wt% fiber loading, there is a decrease in mechanical properties. This decrease in strength at higher fiber loading could be reflection of poor adhesion between the fibers and matrix which promoted microcrack formation at the interface as well as non-uniform stress transfer due to the fiber agglomeration in the matrix. Higher percentage of fiber loading also results in the formation of voids in the composites because of fiber–fiber agglomeration due to H-bonding between the fibers, thereby leading to non-uniform distribution of the later within OPP nanocomposite matrix. Similar investigations have also been reported by Mohanty et al. 25 for jute-reinforced polyester amide composites wherein the broken fiber ends caused crack initiation and potential composite failure.
Halpin–Tsai Micromechanics-based Model
Micromechanical-based models have been used in the case of composites to analyze the effect of filler’s structural parameters, such as shape, aspect ratio, and orientation on the mechanical properties of a neat matrix.
26
Although these micromechanical models cannot be used to fully account for the exact mechanical behavior of polymer fiber-reinforced nanocomposites, they generally give satisfactory correlations. Tucker and Liang
27
have reported the application of several models for fiber-reinforced composites demonstrating that the Halpin–Tsai theory
28
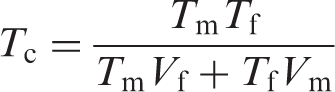
gives reasonable predictions in the case of the modulus. The tensile moduli of the banana fiber-reinforced nanocomposites (Ec) were calculated in accordance with the Halpin–Tsai equation as
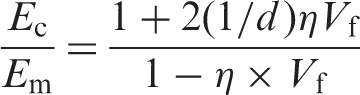
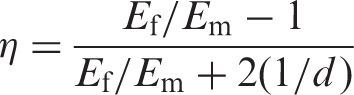
Theoretical tensile modulus of the composites calculated from Halpin–Tsai equation has been compared with experimental tensile modulus, and the fitting curve is represented in Figure 1. It is evident from the curve that the theoretical tensile modulus values calculated using Halpin–Tsai equation are in good agreement with the experimental tensile modulus values of banana fiber-reinforced nanocomposites.
Halpin–Tsai model for OPP/MBF nanocomposites.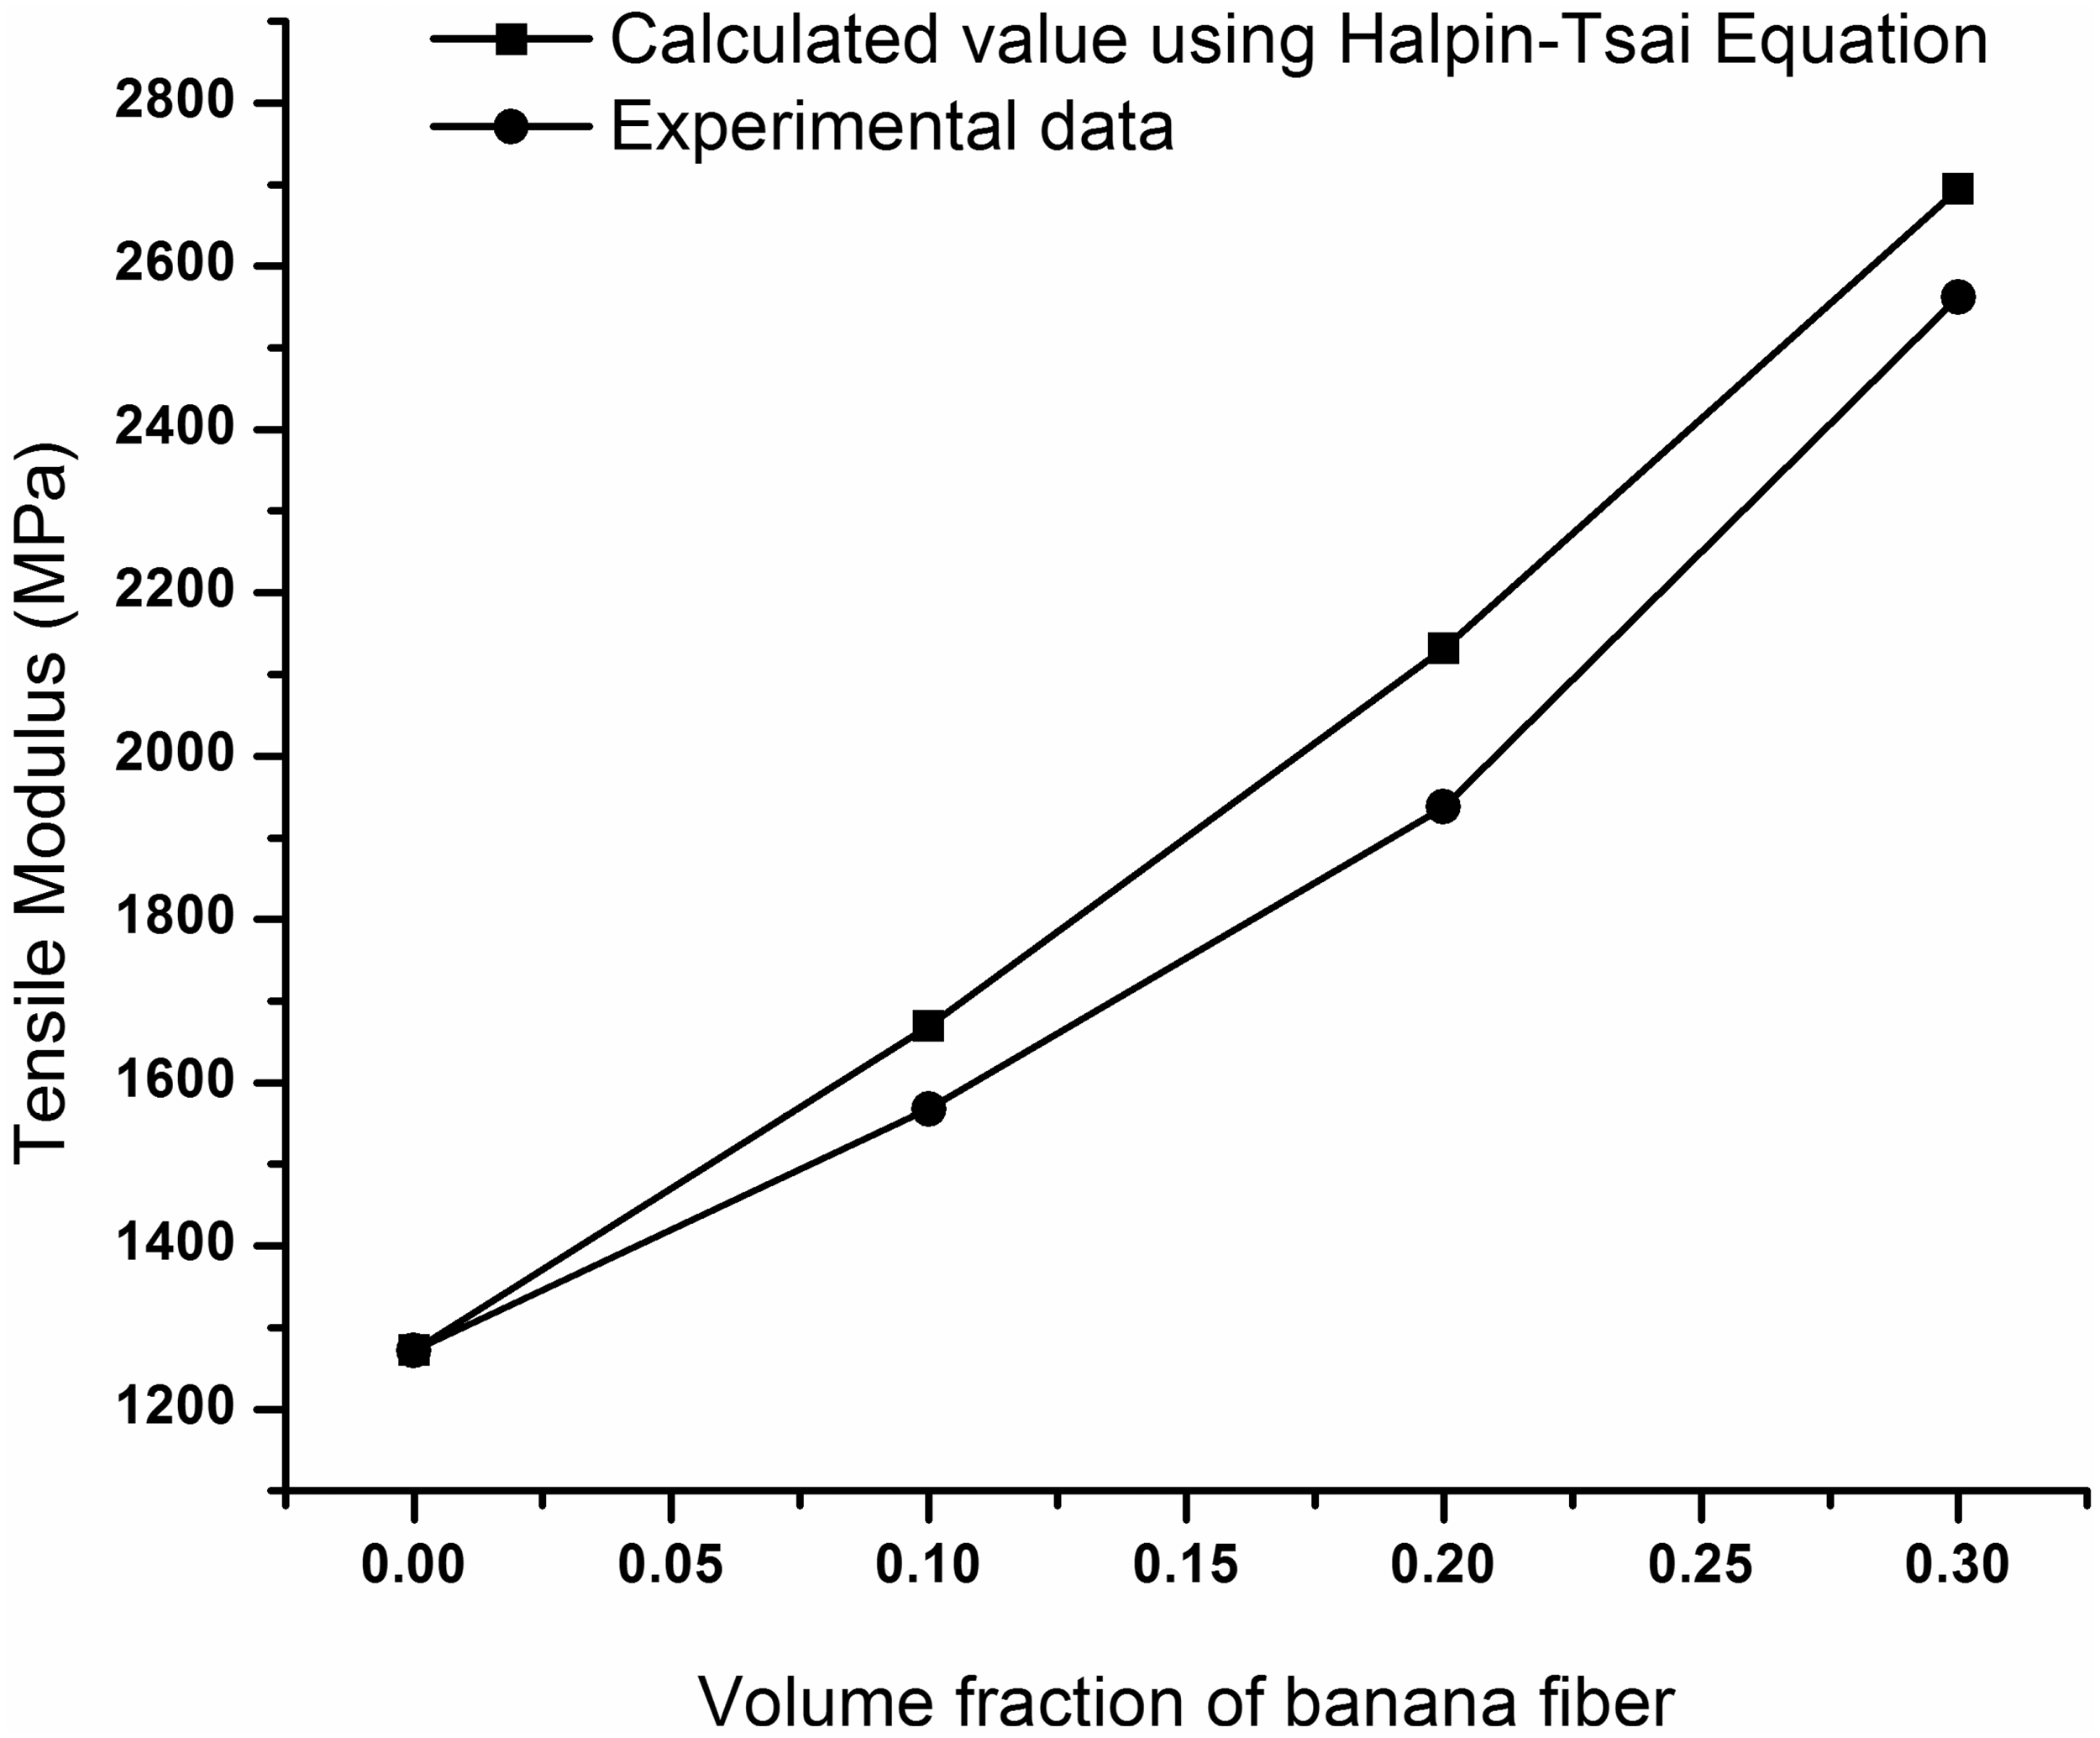
However, the shear rate induces the fiber orientation during the mixing of fiber with the PP nanocomposites, thereby affecting the strength of the composite material. For determining the properties of randomly oriented fibers in a matrix, series and Hirsh’s models are more useful. According to these models, tensile strength is calculated using the following equation.
Series Model
Hirsch’s Model
For calculation, the value of ‘x’ was varied to obtain the best fitting values with the experimental results. Theoretical values of tensile strengths were calculated using the above models and are compared with the experimental values, as shown in Figure 2. In the case of series and Hirsch’s models, it is found that the tensile strength increases regularly with the increase in the volume fraction of the fibers. However, the theoretical values are found to be higher compared to the experimental one, which may be due to the compression molding process followed for the preparation of OPP/MBF nanocomposites resulting in non-uniform molecular orientation.
Series and Hirsh models for PP/clay/MBF nanocomposites.
Thermal Properties
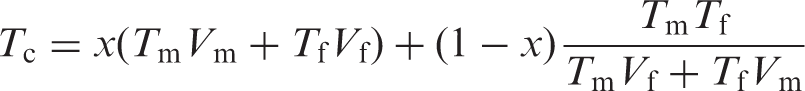
The thermal degradation behavior of PP and OPP nanocomposites with various percentages of fiber loading has been studied employing TGA and DTG thermograms, as shown in Figure 3(a) and (b). It is evident from the figure that the thermal degradation of virgin PP started at 246.2°C and 100% degradation was noticed at 398°C. However, with the incorporation of nanoclays, there was substantial enhancement in the thermal stability of the nanocomposites with an initial degradation decomposition peak at 384°C and final decomposition peak at 452°C giving a charred residue of 2.8%. The increase in thermal stability of nanocomposites is attributed due to the organic/inorganic interaction between the polymer and nanoclays, where the organoclay delays volatilizations of the products generated at the temperature of carbon–carbon bond scission of the polymer matrix.
30
Further addition of MBF in PP nanocomposite system follows a two-stage decomposition behavior. The first stage was probably due to dehydration from cellulose unit and thermal cleavage of glycosidic linkage by transglycosylation and scission of C–O– and –C–C– bonds, whereas second stage decomposition is primarily attributed due to aromatization involving dehydration reaction. The final decomposition temperature of OPP/MBF nanocomposite is found to be 475°C, which is higher than that of OPP nanocomposites. This is attributed to the improved fiber/matrix adhesion resulting due to the presence of MA-g-PP in fiber-reinforced nanocomposites as a compatibilizer. Again the slight drop in mass of the fiber-reinforced nanocomposites at the beginning of the curve is due to the heat of vaporization of water from the banana fiber. The final residue in the OPP/MBF nanocomposites is comparatively higher than the OPP nanocomposites and virgin matrix indicating higher flame retradancy.
(a) TGA and (b) DTG curves of PP, OPP, and OPP/MBF nanocomposites.
Non-isothermal degradation kinetics
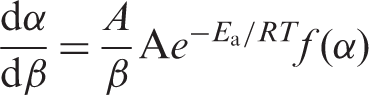
The thermal oxidative degradation kinetics of banana fiber-reinforced PP nanocomposites was determined on the basis of TGA results. The fundamental rate equation used in all kinetic studies is generally described as
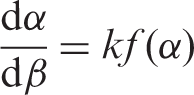
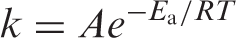
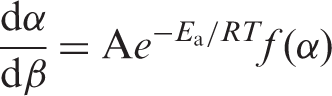
For a dynamic TGA process, introducing the heating rate β, i.e., change in absolute temperature with time (dT/dt) in Equation (5), is as follows:
Equations (4) and (5) are the fundamental expressions of analytical methods to calculate kinetic parameters on the basis of TGA data. The calculation of the activation energy from the thermal degradation at different conversion rates during heating is obtained by kinetic analysis using Kissinger,
31
Flynn–Wall–Ozawa (F–W–O),32,33 and modified Coats–Redfern
34
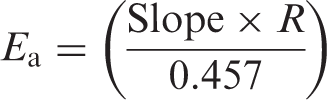
model-free methods. In the Kissinger method, ln(β/
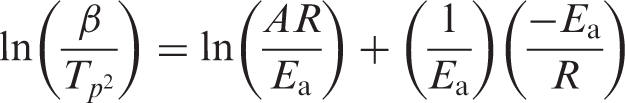
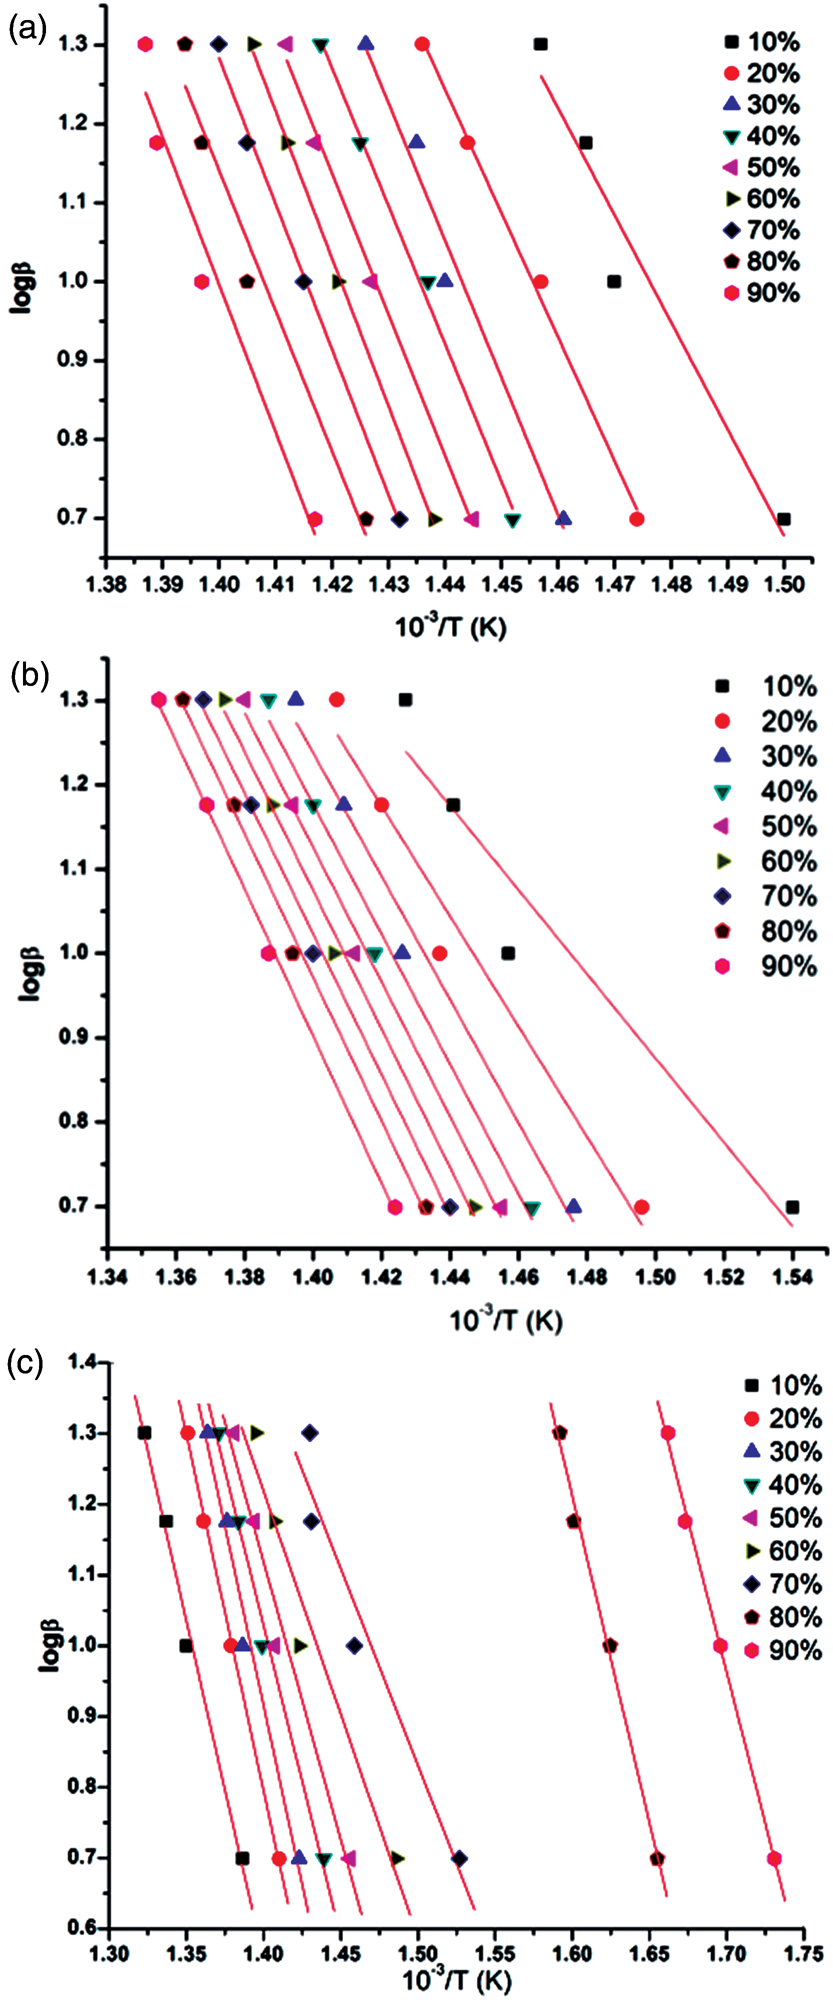
The iso-conversional F–W–O method is the integral method where the data are plotted by the logarithm of heating rate (log β) against the reciprocal absolute temperature (1/T) for each conversion degree (α). From iso-conversion curves (Figure 4), the activation energy (Ea) at the specific conversion can be obtained from the slope of the line using the following equations:
TGA Thermograms of (a) PP, (b) OPP, and (c) OPP/MBF at different conversion rates.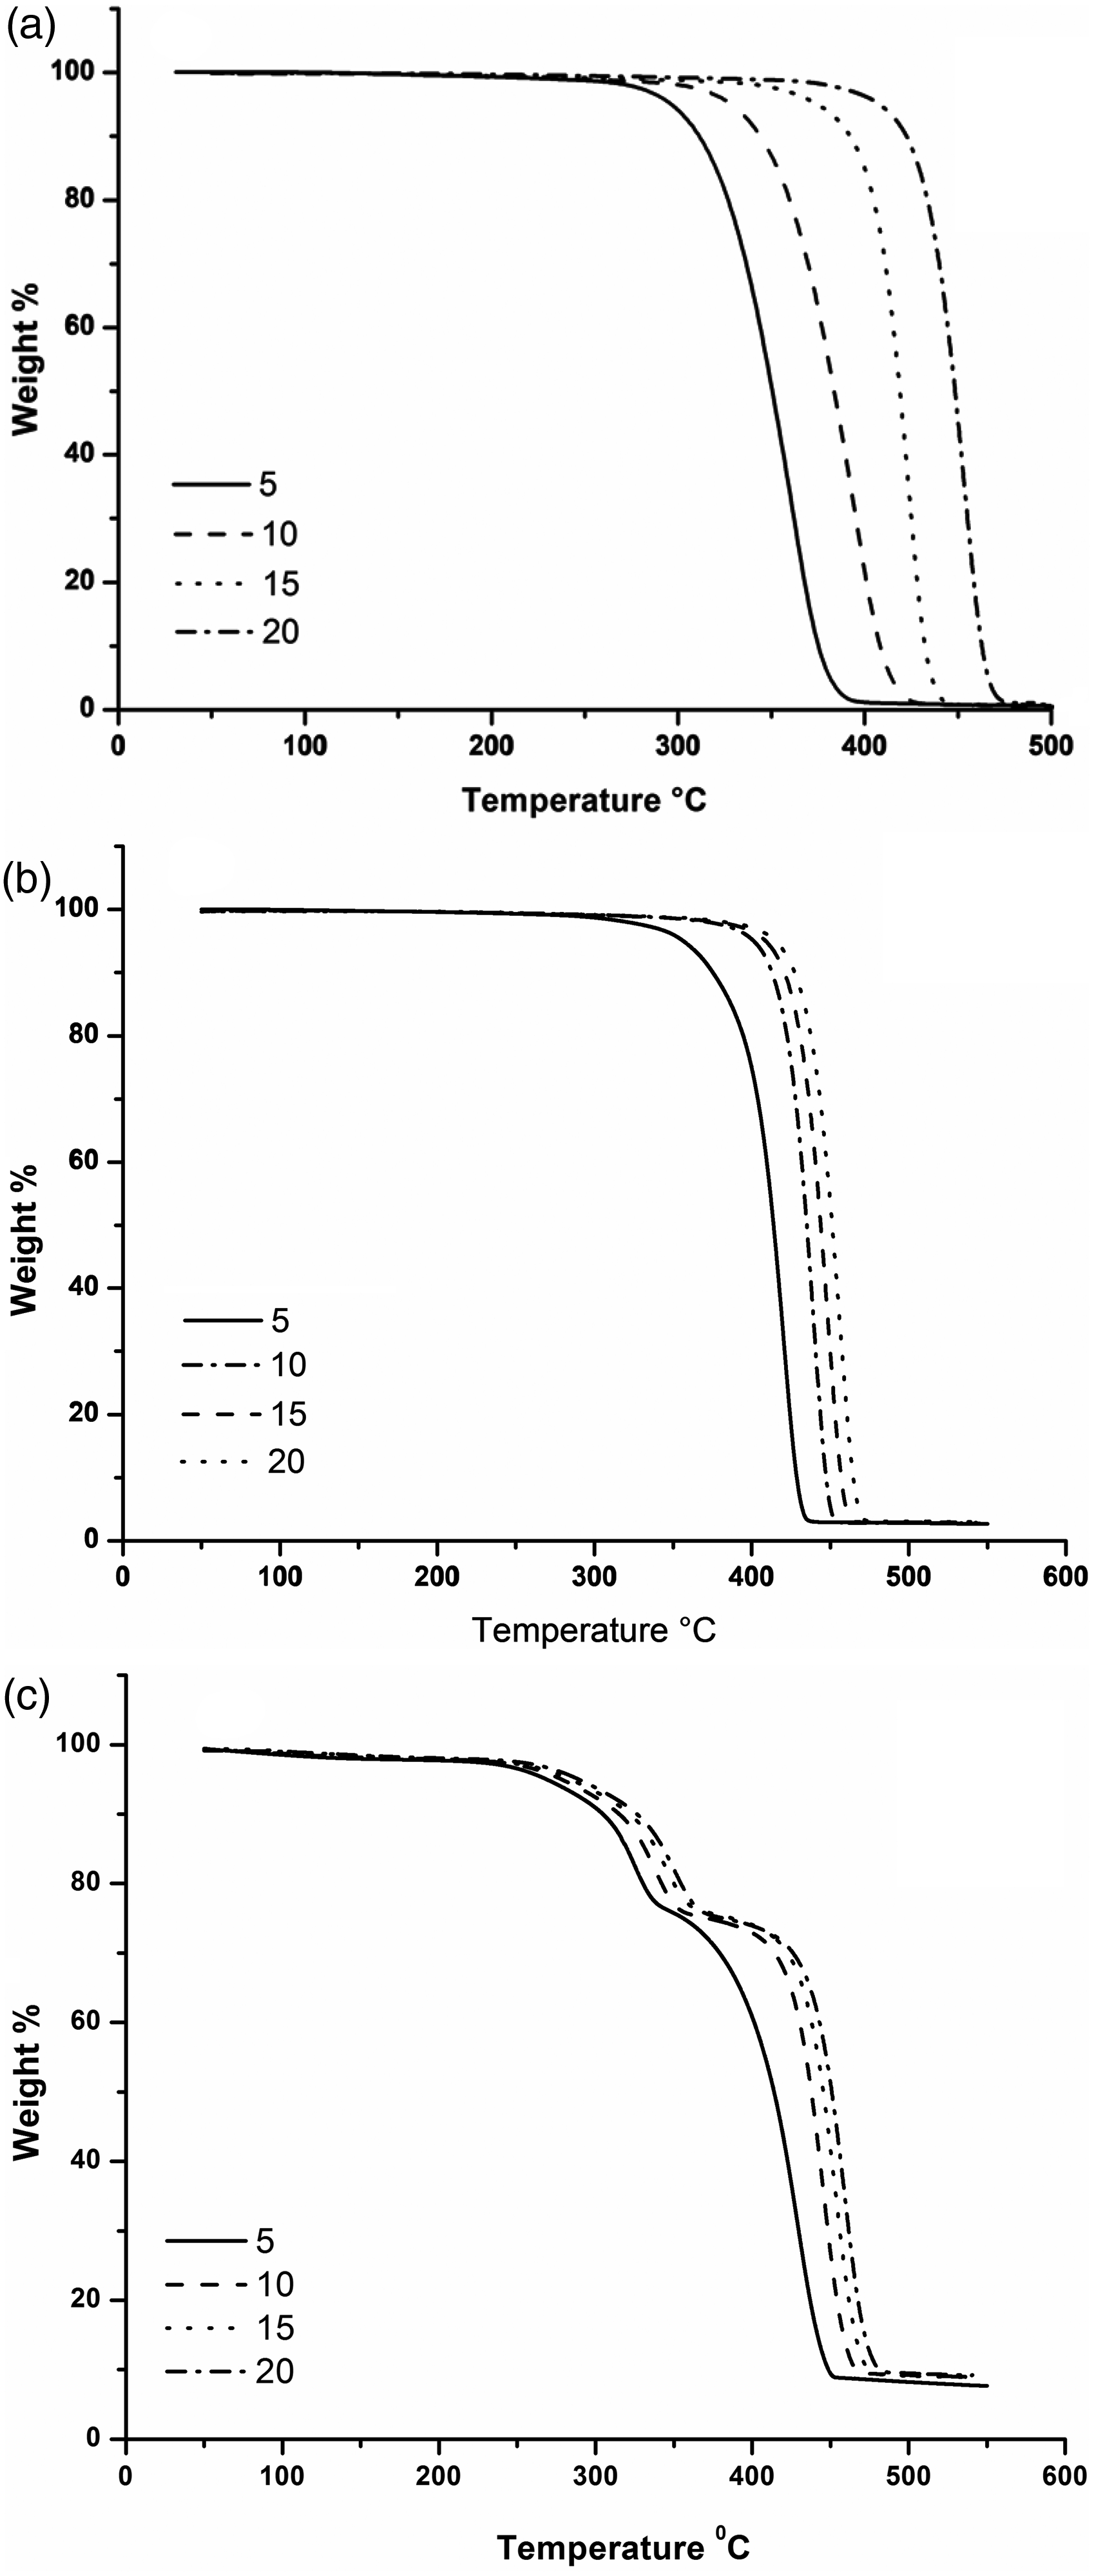
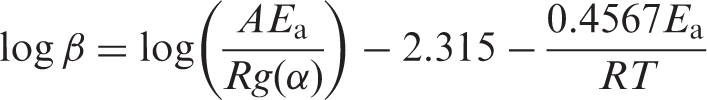
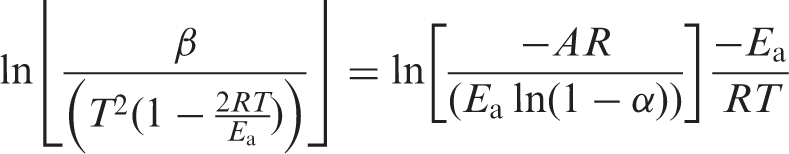
The modified Coats–Redfern method is a multi-heating rate application of the Coats–Redfern equation:
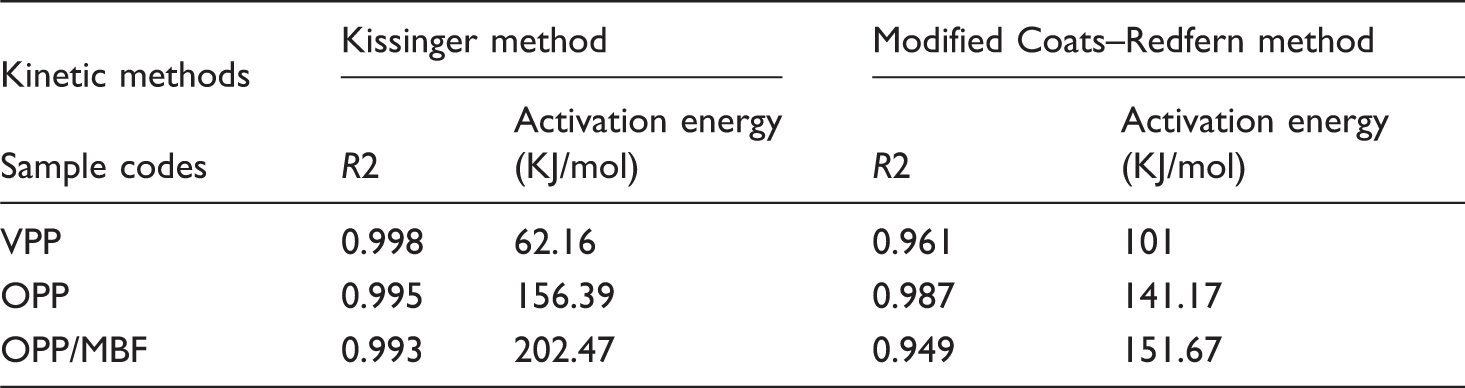
The TGA results of PP, OPP, and OPP/MBF nanocomposites obtained under a steady flow of air at different heating rates, 5, 10, 15 and 20°C/min, have been depicted in Figure 4. Kissinger method has been employed to calculate the activation energy from TGA data analysis using Equation (6). The peak temperature (Tp) obtained from the DTG curves and the activation energy (Ea) values for the degradation of PP, OPP, and OPP/MBF nanocomposites are given in Figure 5 and Table 2, respectively. It is evident that the peak temperature (Tp) shifted to higher temperatures with the increasing heating rate in all cases. The value of Ea for the thermal oxidative degradation of virgin PP in air is observed to be 62.163 KJ/mol, which substantially increased to 156.394 kJ/mol in case of OPP nanocomposites. These indicate that the layered silicates serve as a thermal barrier in delaying the degradation process of PP in the nanocomposites. The results are analogous to the higher thermal stability of PP nanocomposites obtained obtained from TGA. Further with the addition of 30 wt% of MBF to the OPP nanocomposites, the activation energy additionally increased to 202.479 KJ/mol, which is due to the reinforcing effect of banana fiber within the OPP nanocomposites matrix in the presence of MA-g-PP compatibilizer.
Linear plots of Kissinger method for: (a) PP, (b) OPP, and (c) OPP/MBF nanocomposites.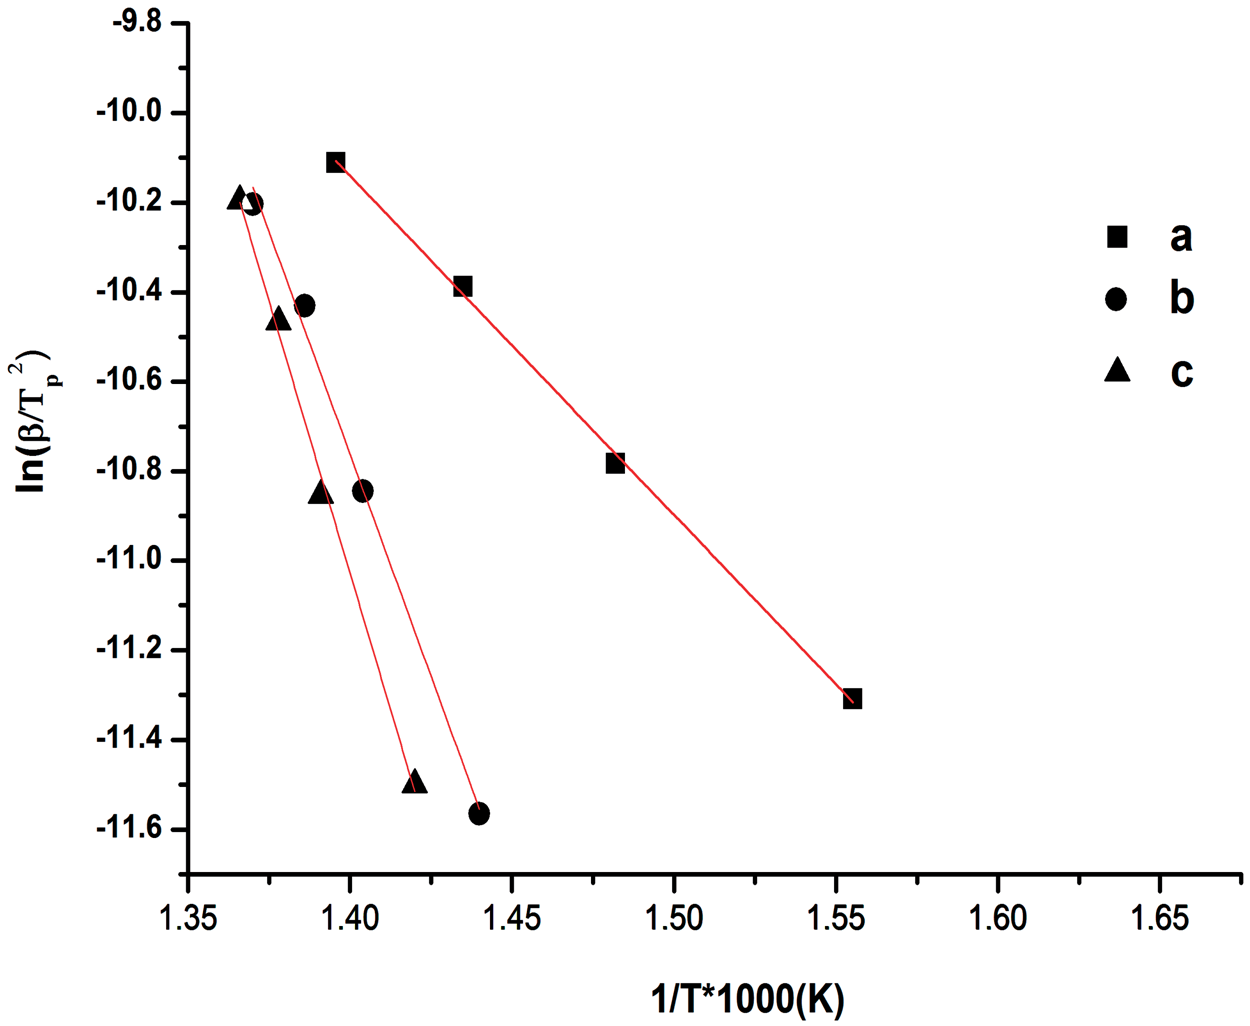
The other integral method used in this study is the F–W–O method, which is independent of the degradation mechanism.
35
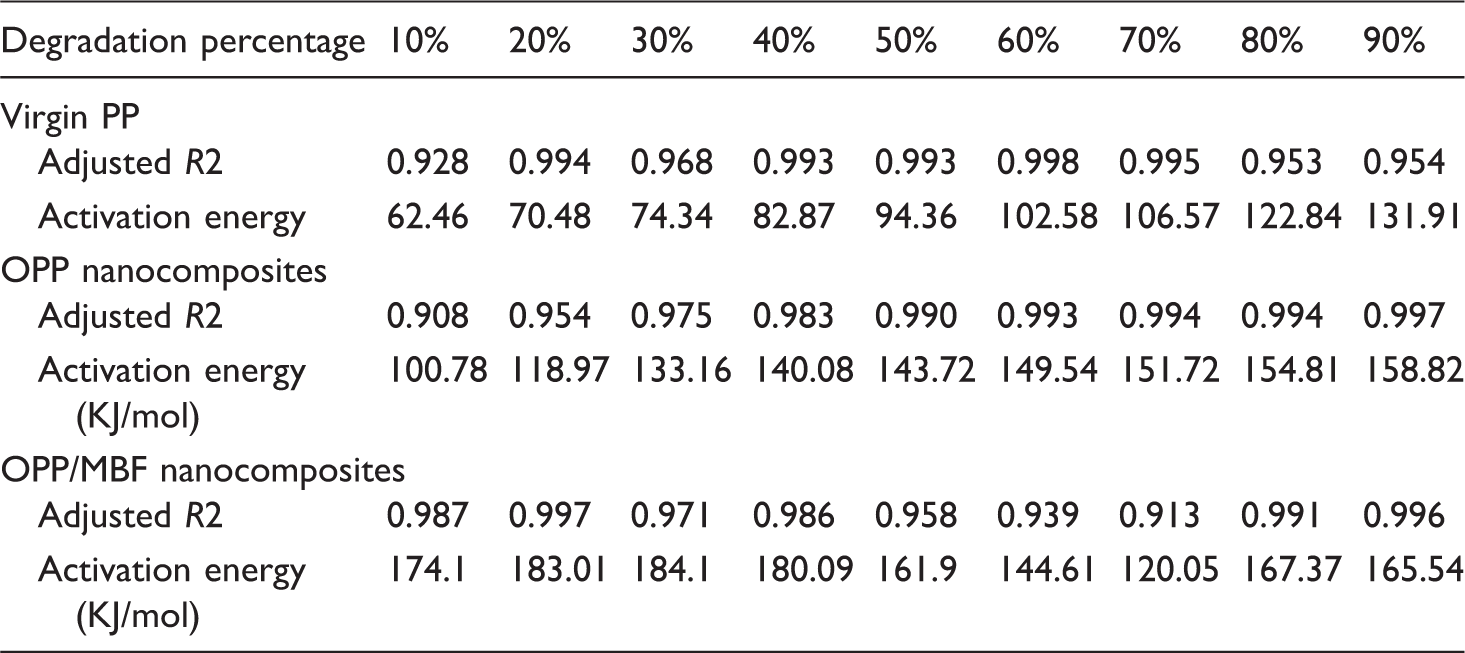
The conversion values in the range 10–90 wt% are used for the determination activation energy of PP, OPP, and OPP/MBF nanocomposites in this study, as obtained from Figure 6. The average values of Ea of neat PP, OPP, and OPP/MBF nanocomposites are found to be 94.26, 139.06, and 164.53 KJ/mol, respectively. The activation energy from F–W–O methods is in accordance with the values obtained from Kissinger method following the order: OPP/MBF > OPP > virgin PP, though there is a discrepancy between the Ea values. The lines obtained from F–W–O methods are nearly parallel in case of PP and OPP which indicates that approximate activation energies at different conversions and consequently implies the possibility of single reaction mechanism or the unification of multiple reaction mechanisms at various conversion rates. On the contrary, OPP/MBF nanocomposites deviate from these sequence showing two-stage decomposition mechanism with a heterogeneous system. The apparent activation energy values calculated by F–W–O for neat PP, OPP, and OPP/MBF nanocomposites are given in Table 3. Coats–Redfern method is shown in Figure 7 and the activation energy values are represented in Table 2, at 50 wt% conversion rates following the same order of Ea value as obtained by Kissinger and F–W–O methods. The apparent activation energy calculated from these methods provides the information of critical energy needed to initiate a combustion process. The activation energy obtained in these studies can help in understanding the thermal decomposition and stability of OPP/MBF nanocomposites compared to that of virgin PP and OPP nanocomposites, respectively.
Linear plots of Coats–Redfern method for: (a) PP, (b) OPP, (c) OPP/MBF nanocomposites. Linear plots of (a) PP, (b) OPP, and (c) OPP/MBF from F-W-O method.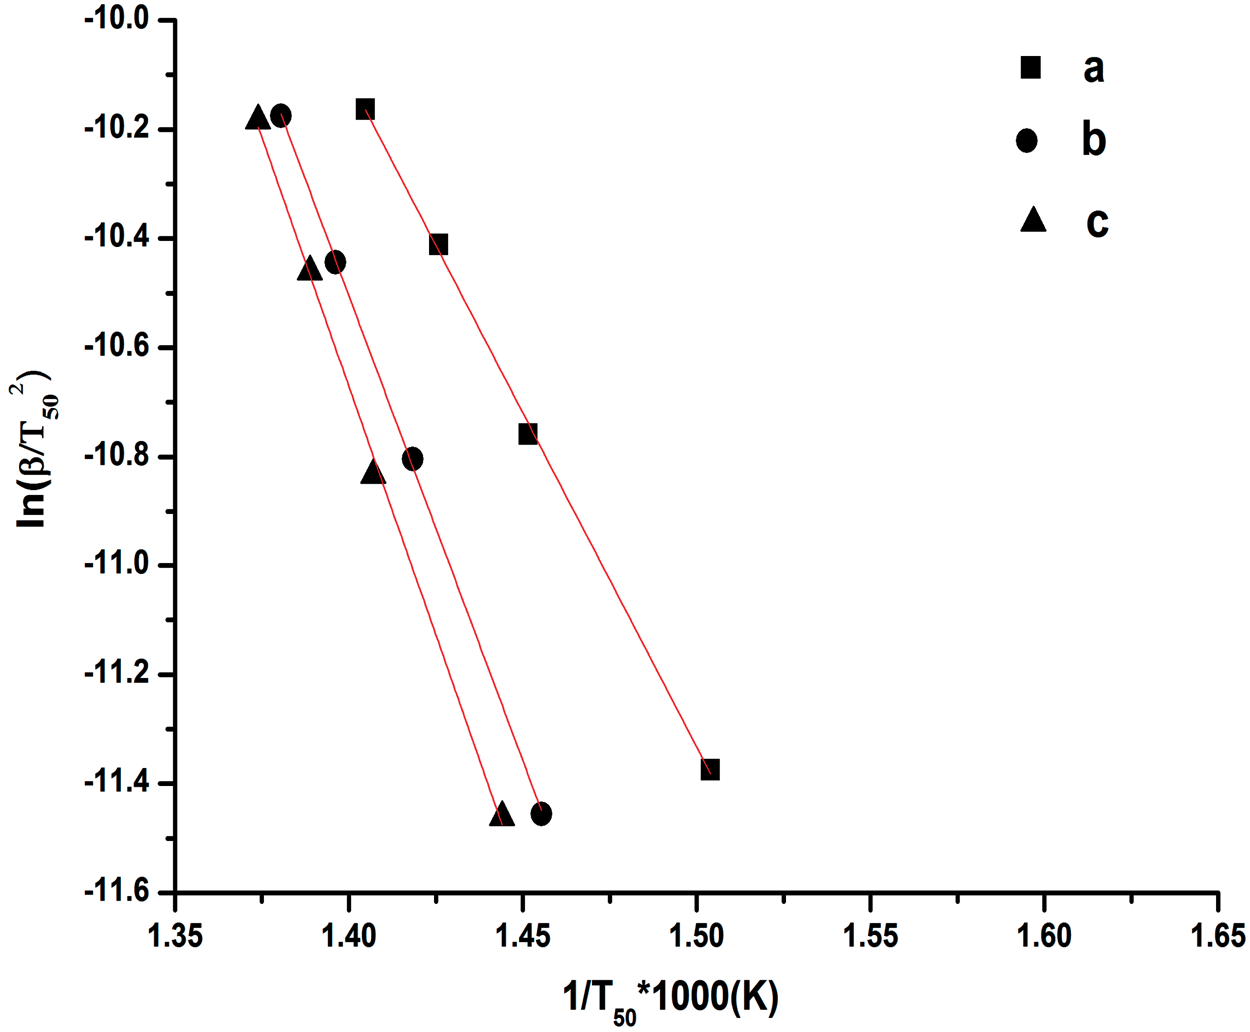
Morphological properties
The SEM micrographs of banana fiber-reinforced nanocomposites with 30 wt% of banana fiber (Figure 8) show that the fibers embedded in the polymer matrix are well dispersed. The pullout fiber along with the PP matrix during fracture in tensile test indicates better cohesive coupling between MA-g-PP, fibers, and PP matrix thus revealing efficient fiber matrix adhesion. It is also confirmed that the compatibilizer adheres to the primary cell wall of the fiber and the crack has not run through the fiber matrix interface or perpendicular to the fiber but it has fully split over the fiber length. This is probably due to the anhydride group present in MAPP which strongly adheres to the –OH groups present on the banana fiber surface thus confirming the fact that the fracture has not occurred at the interface but at the fiber itself. A homogenous distribution of nanoparticles in the PP matrix was also achieved with some agglomerate on the surface, as shown in the figure. However, SEM micrographs OPP/MBF nanocomposites with MA-g-PP do not provide any phenomenal morphological change due to the dispersion of nanoclay within the matrix composites. Hence, TEM micrographs of the nanocomposite samples are taken into consideration for further study of clay within the OPP/MBF nanocomposite system.
Scanning electron micrographs of brittle-fractured OPP/MBF nanocomposites at different magnifications.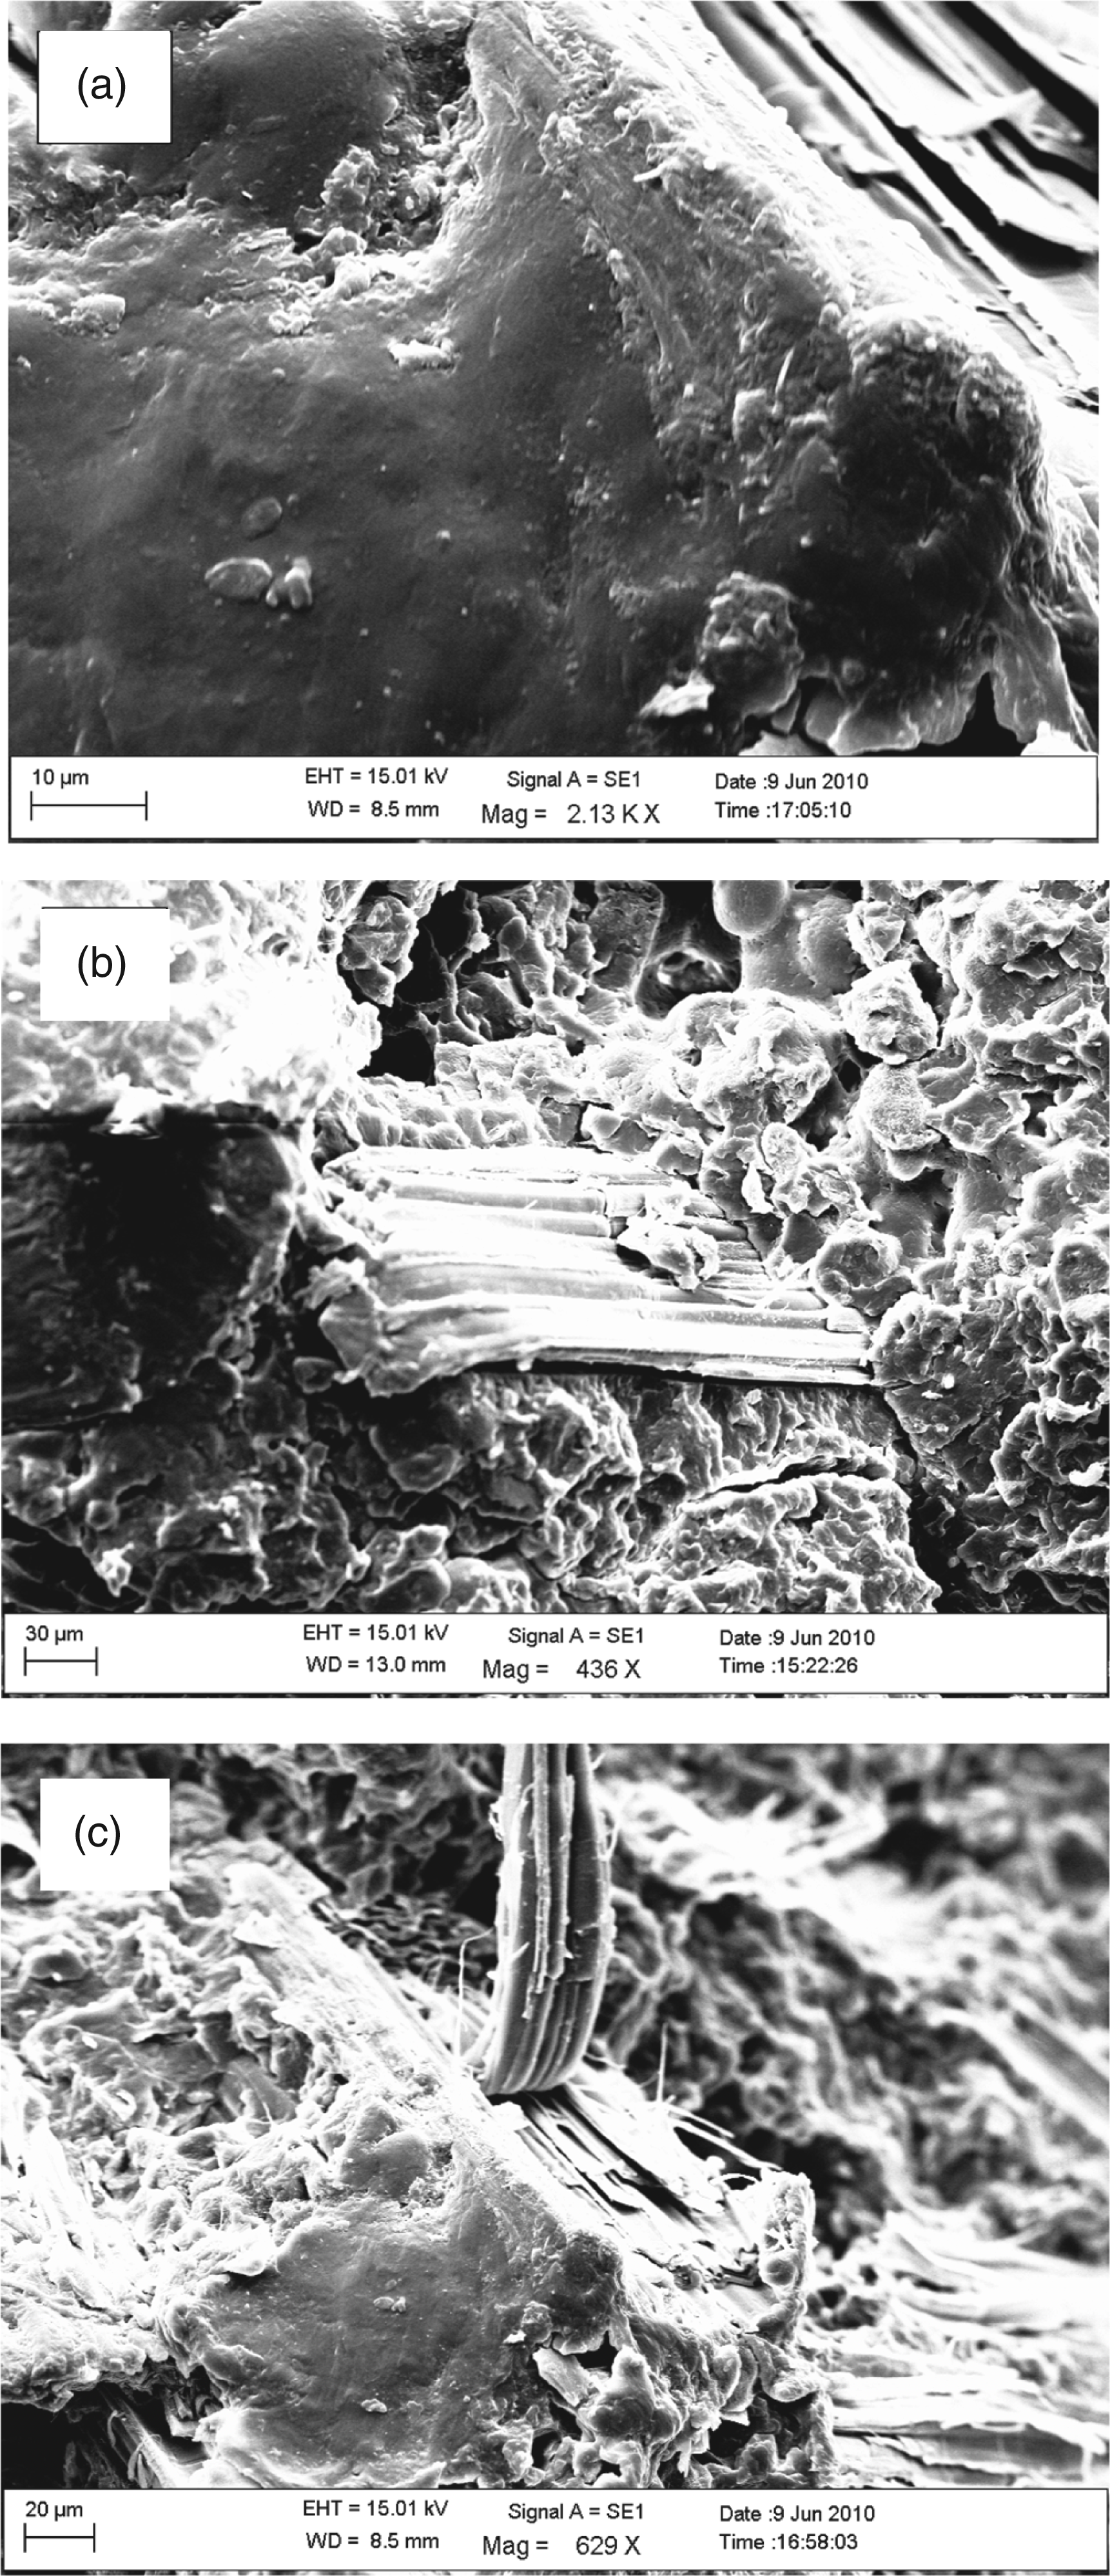
The arrangement of clays within the PP and OPP/MBF nanocomposite has been studied employing transmission electron micrographs depicted in Figure 9. TEM micrographs for PP nanocomposites indicate both thick dark and thin gray strips. The dark strips, which may consist of stacks of silicate layers, indicate the breakup of the clay tactoids. On the other hand, the gray lines, which may represent a single layer or small stacks of clay platelets, indicate a state of complete exfoliation in the matrix. The thin gray lines thus represent clay nanolayers within the resolution provided. In case of OPP/MBF nanocomposite, exfoliated clay galleries were observed in the region of fiber microfibrils adhering to the PP matrix. Whereas, the intercalated clay layers indicate improved interface among fiber, nanoclay, and PP due to the formation of chemical/physical bonds.
Transmission electron micrographs of: (a) PP and (b) OPP/MBF nanocomposites at 100 nm magnification.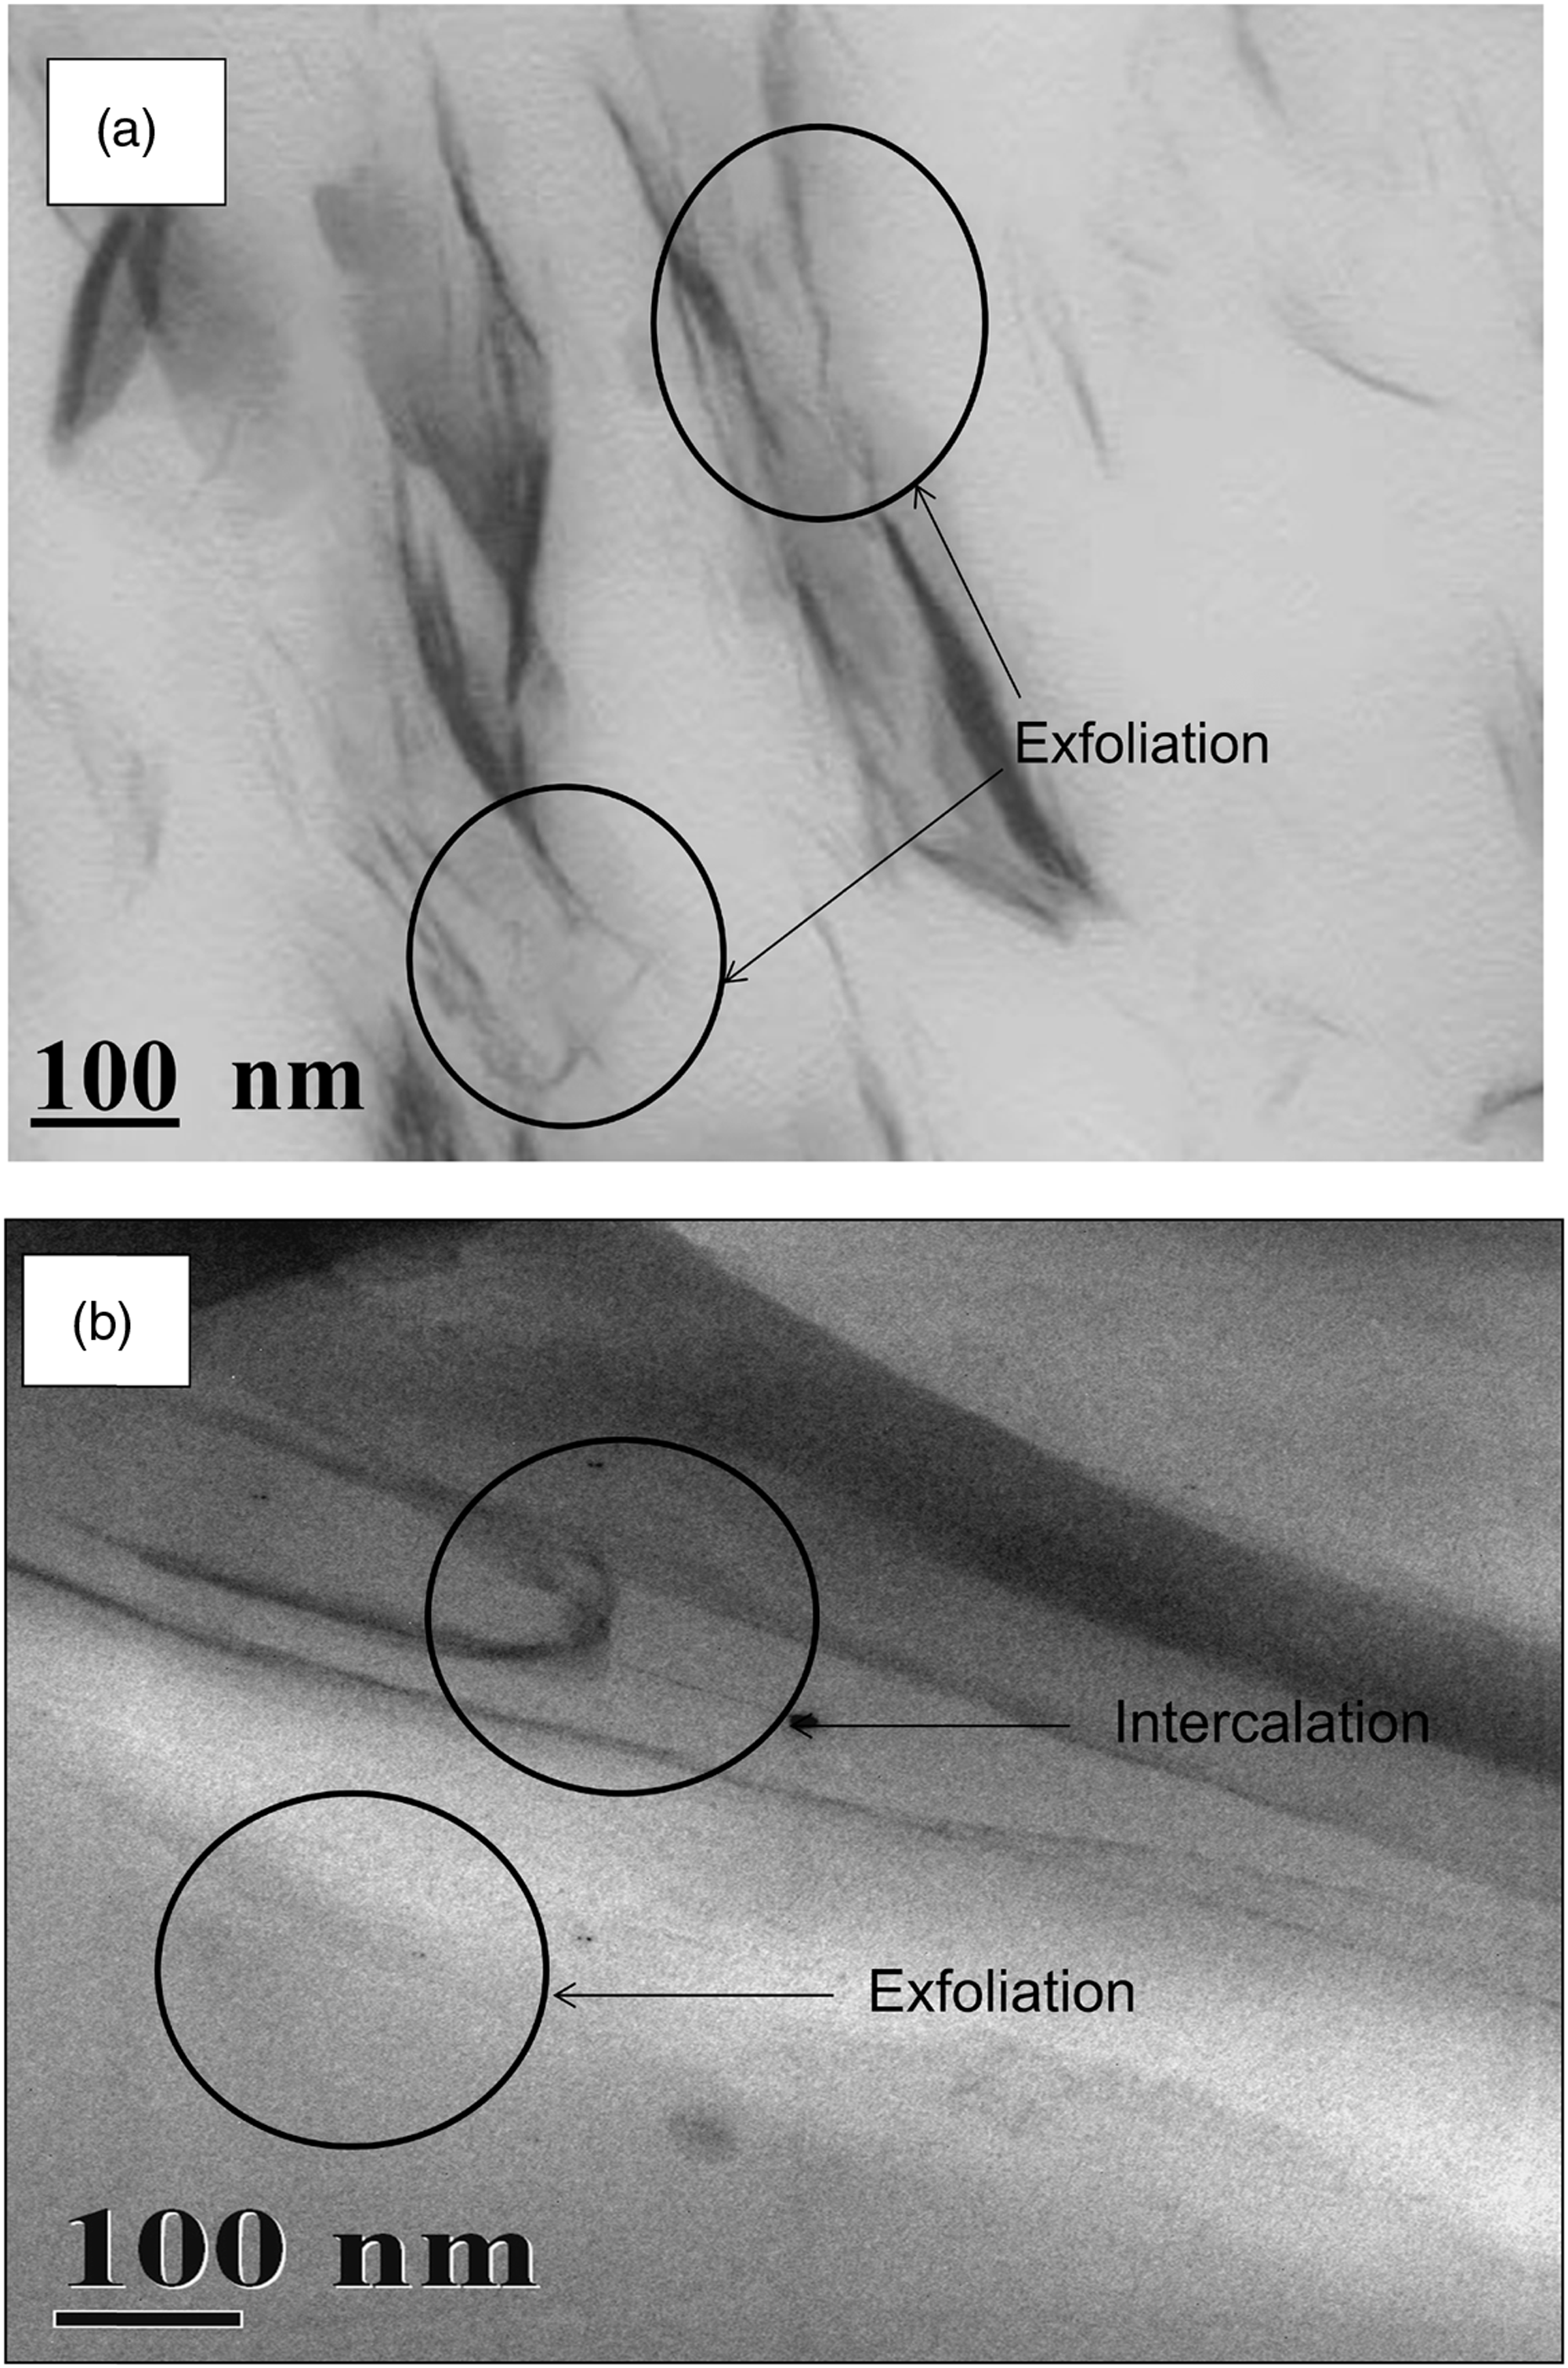
Dynamic Mechanical Properties
Storage Modulus
To investigate the reinforcing effect of layered silicate and banana fiber in a broader temperature range, DMA of nanocomposites has been carried out at a fixed frequency of 1 Hz in the temperature range from −100°C to 150°C. Figure 10 represents the temperature dependencies of the dynamic storage moduli (E′), loss moduli (E″), and loss factor tan δ for the neat PP, OPP, and OPP/MBF nanocomposites containing 5 wt% compatibilizers. It was also found that the dynamic storage modulus of OPP nanocomposites is higher when compared with that of virgin PP matrix. The improvement in storage modulus of the nanocomposites with the pristine counterpart is more prominent in the rubbery region because in this region, the material is soft and flexible. The enhancement in the storage modulus strongly depends on the aspect ratio of dispersed clay particles and intercalation of the polymer chains inside the matrix.
36
Furthermore restricted segmental motion at organic/inorganic interface and exfoliation of the clay galleries at the nanoscale level may be the possible cause for a phenomenal increase in the storage modulus. Further, with the incorporation of banana fiber into the optimized nanocomposite system, the storage modulus of fiber-reinforced PP nanocomposites shows an increase trend, which indicates that stress transfer from the matrix to the fiber.
37
Storage modulus values of PP matrix and its composite are not the same at low temperature, because the fibers impart stiffness to the composite in this temperature region.
38
It is observed that there is a sharp drop in E′ from −10°C to about 25°C, which is associated with the relaxation of the amorphous phase (α-relaxation). In this case, the glassy state of the amorphous phase goes through its glass transition, which is responsible for segmental mobility of the polymer chains.
Storage modulus of: (a) PP, (b) OPP, (c) OPP/MBF, (d) OPP/20%MBF, and (e) OPP/30%MBF.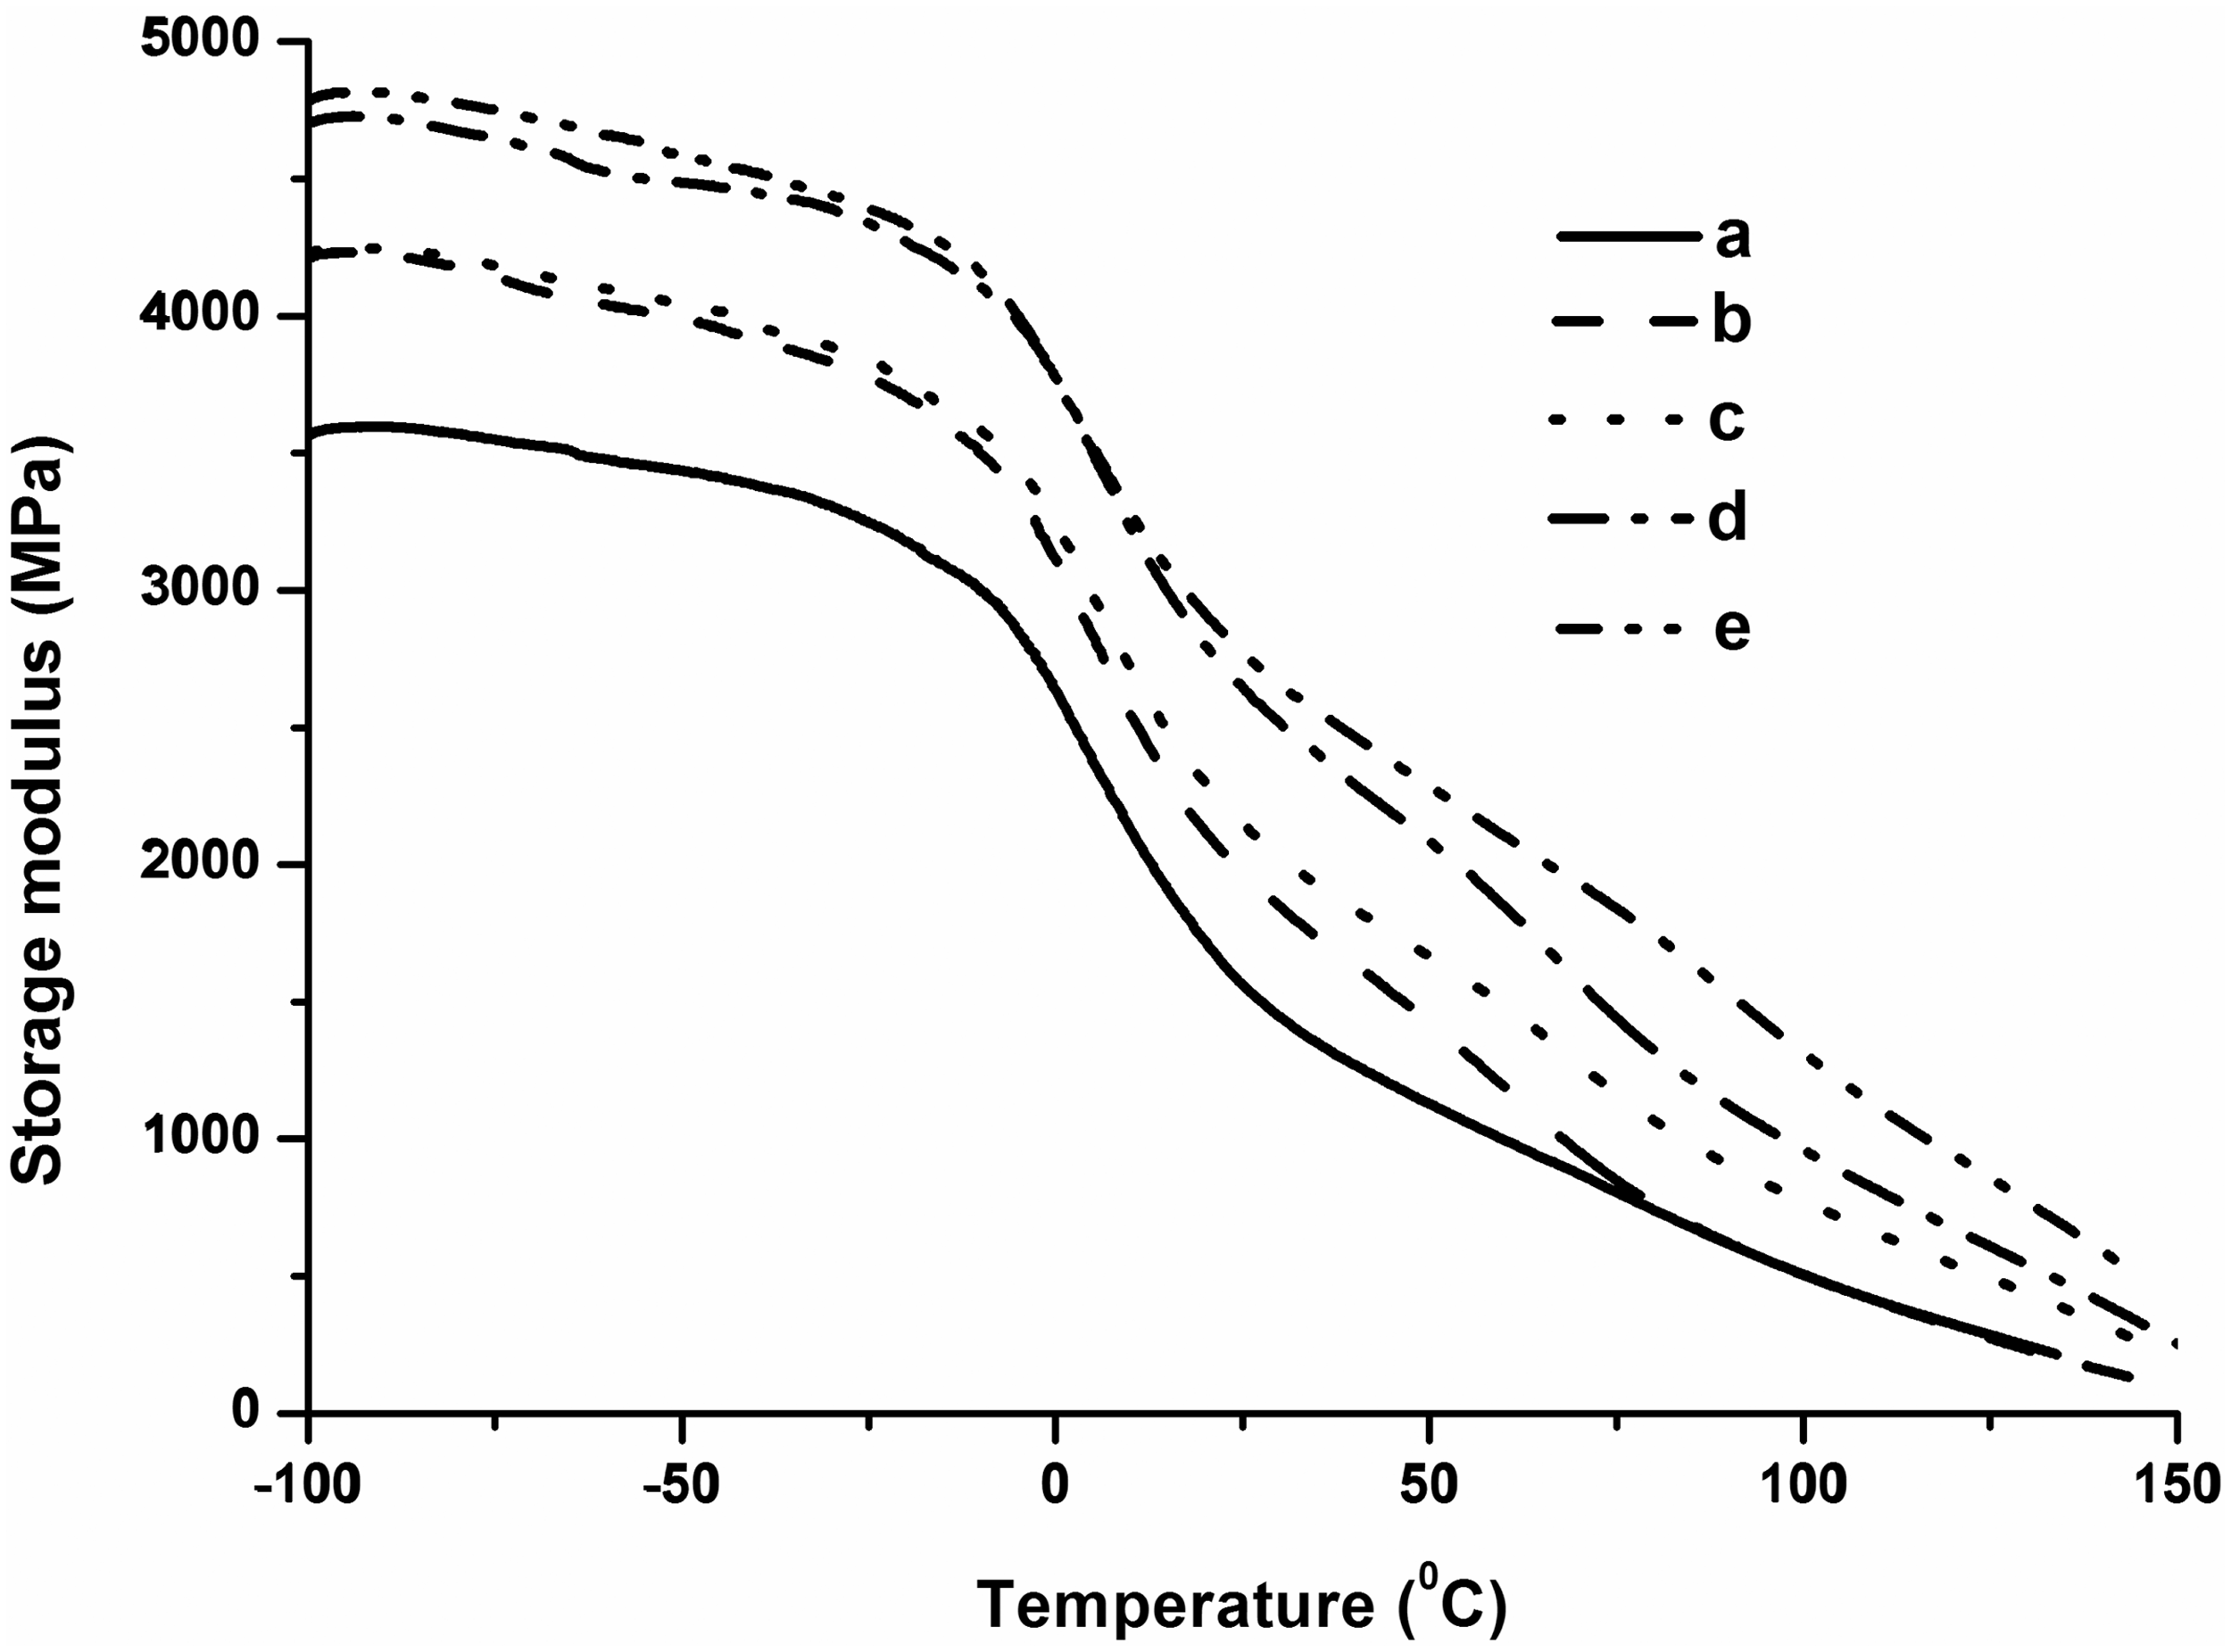
Loss Modulus
Figure 11 indicates the dynamic loss modulus curve of virgin PP showing three relaxation peaks at −80°C (γ), 10°C (β), and 100°C (α), similar results are also obtained by McCrum et al.
39
The loss modulus E″ of all the materials studied displayed a maxima at around 0°C, related with the β transition, which corresponds to the glass transition temperature of PP. The glass transition is assigned to the energy dissipation possibilities across the free amorphous phase, and the lower Tg values would mean an easier mobility of the free amorphous phase in the composites. The comparison study of PP with OPP nanocomposites indicates a shifting of peak value towards higher temperature to about 5°C and 10°C in the case of OPP/MBF nanocomposites. The first one is primarily attributed due to the MA-g-PP giving a good compatibility between the clay layer and polymer matrix. The second one is attributed due to the immobilization of polymer molecule near to the surface of banana fiber. Conversely, the filled composites displayed an increase in peak height and broadening of the relaxation region. This behavior is probably due to inhibition of the relaxation process, resulting in the decrease in the mobility of polymer chains in the crystallites.
Loss modulus of: (a) PP, (b) OPP, (c) OPP/MBF, (d) OPP/20%MBF, and (e) OPP/30%MBF.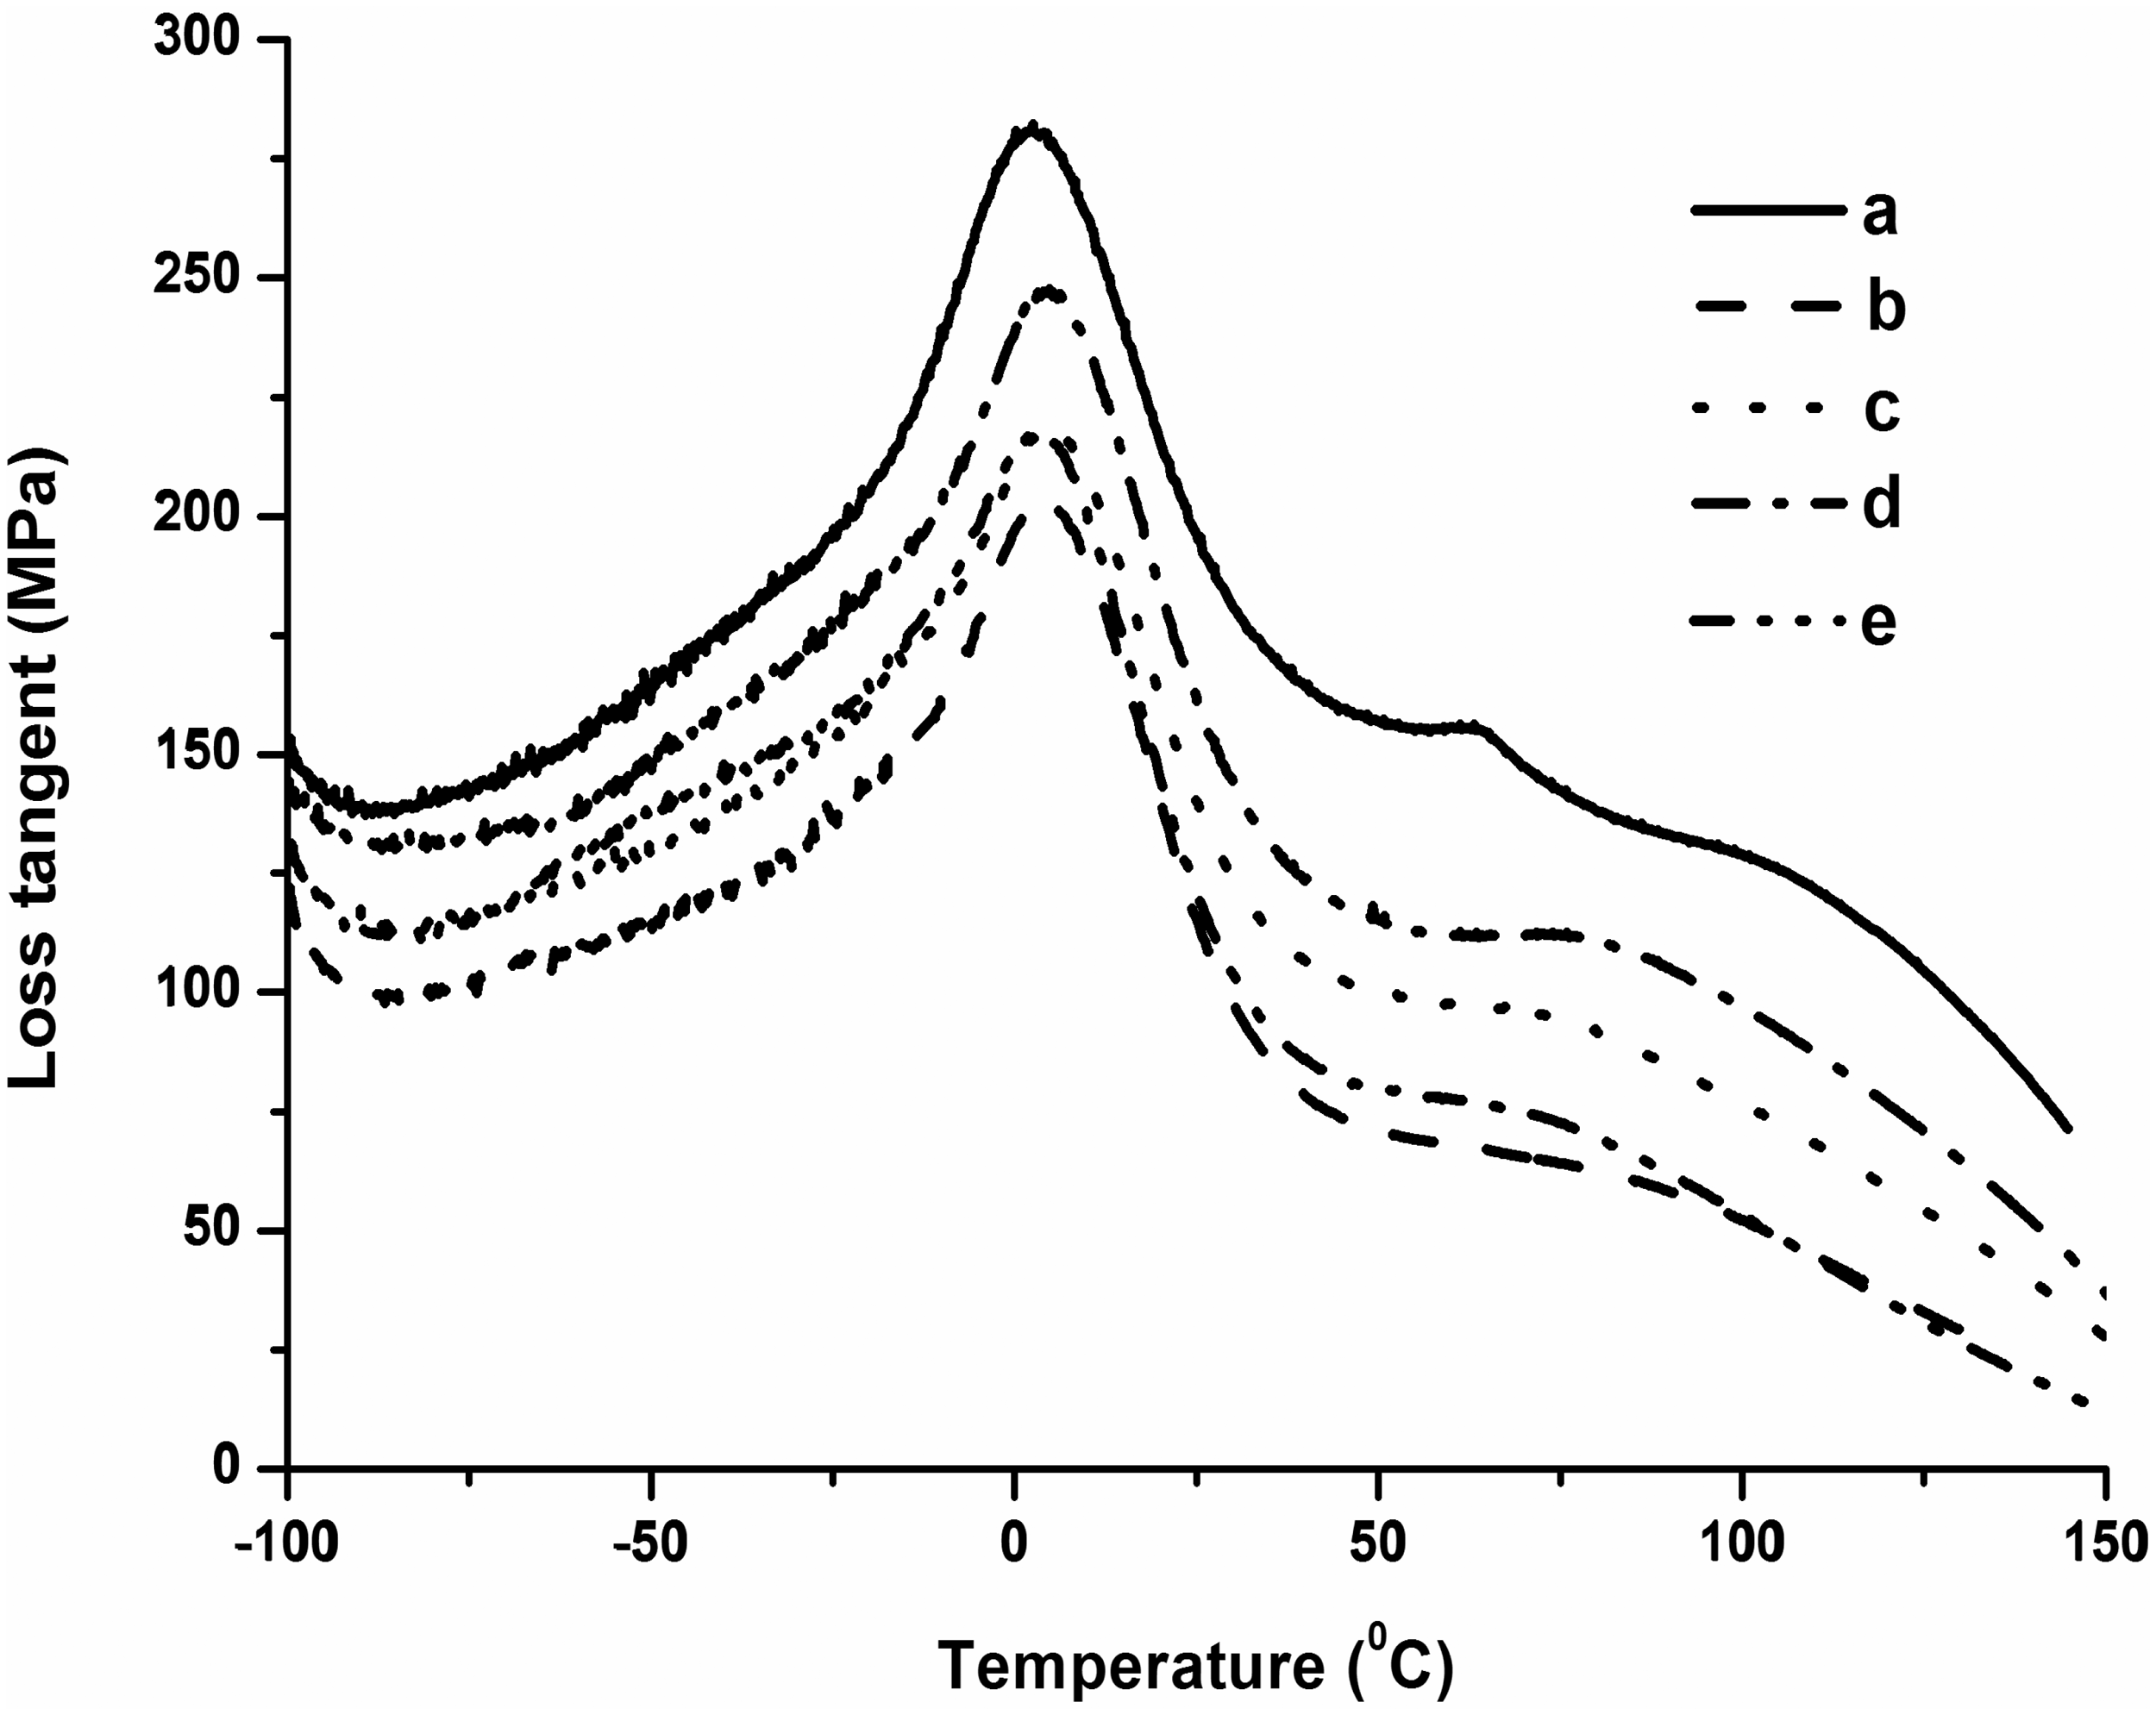
Loss Tangent (tan δ)
As seen in Figure 12, incorporation of fibers as well as nanoclay reduces the tan δ peak height by restricting the movement of the PP matrix molecules. Since the filler surface interacts with the polymer through catalytic activity and orientation of molecular segments, modification of the fiber surface may lead to a change in the nucleation kinetics of PP matrix.
40
Therefore, fiber treatments by addition of compatibilizer are an essential factor to promote the alignment of molecular segments within the thermoplastic matrix. The mercerized fiber surface in the presence of PP-g-MA creates a higher surface interaction responsible for more height of the tan δ peak, compared to PP matrix. The other explanation is that there is no restriction to the chain motion in the case of neat PP matrix, while the presence of the cellulose fibers hinders the chain mobility, resulting in the reduction of sharpness and height of the tan δ peak value.
41
Murayama
42
reported in his studies that with the incorporation of fibers in a composite system, the damping is affected due to shear stress concentrations at the fiber ends in association with the additional viscoelastic energy dissipation in the matrix material.
Loss tangent of: (a) PP, (b) OPP, (c) OPP/MBF, (d) OPP/20%MBF, and (e) OPP/30%MBF.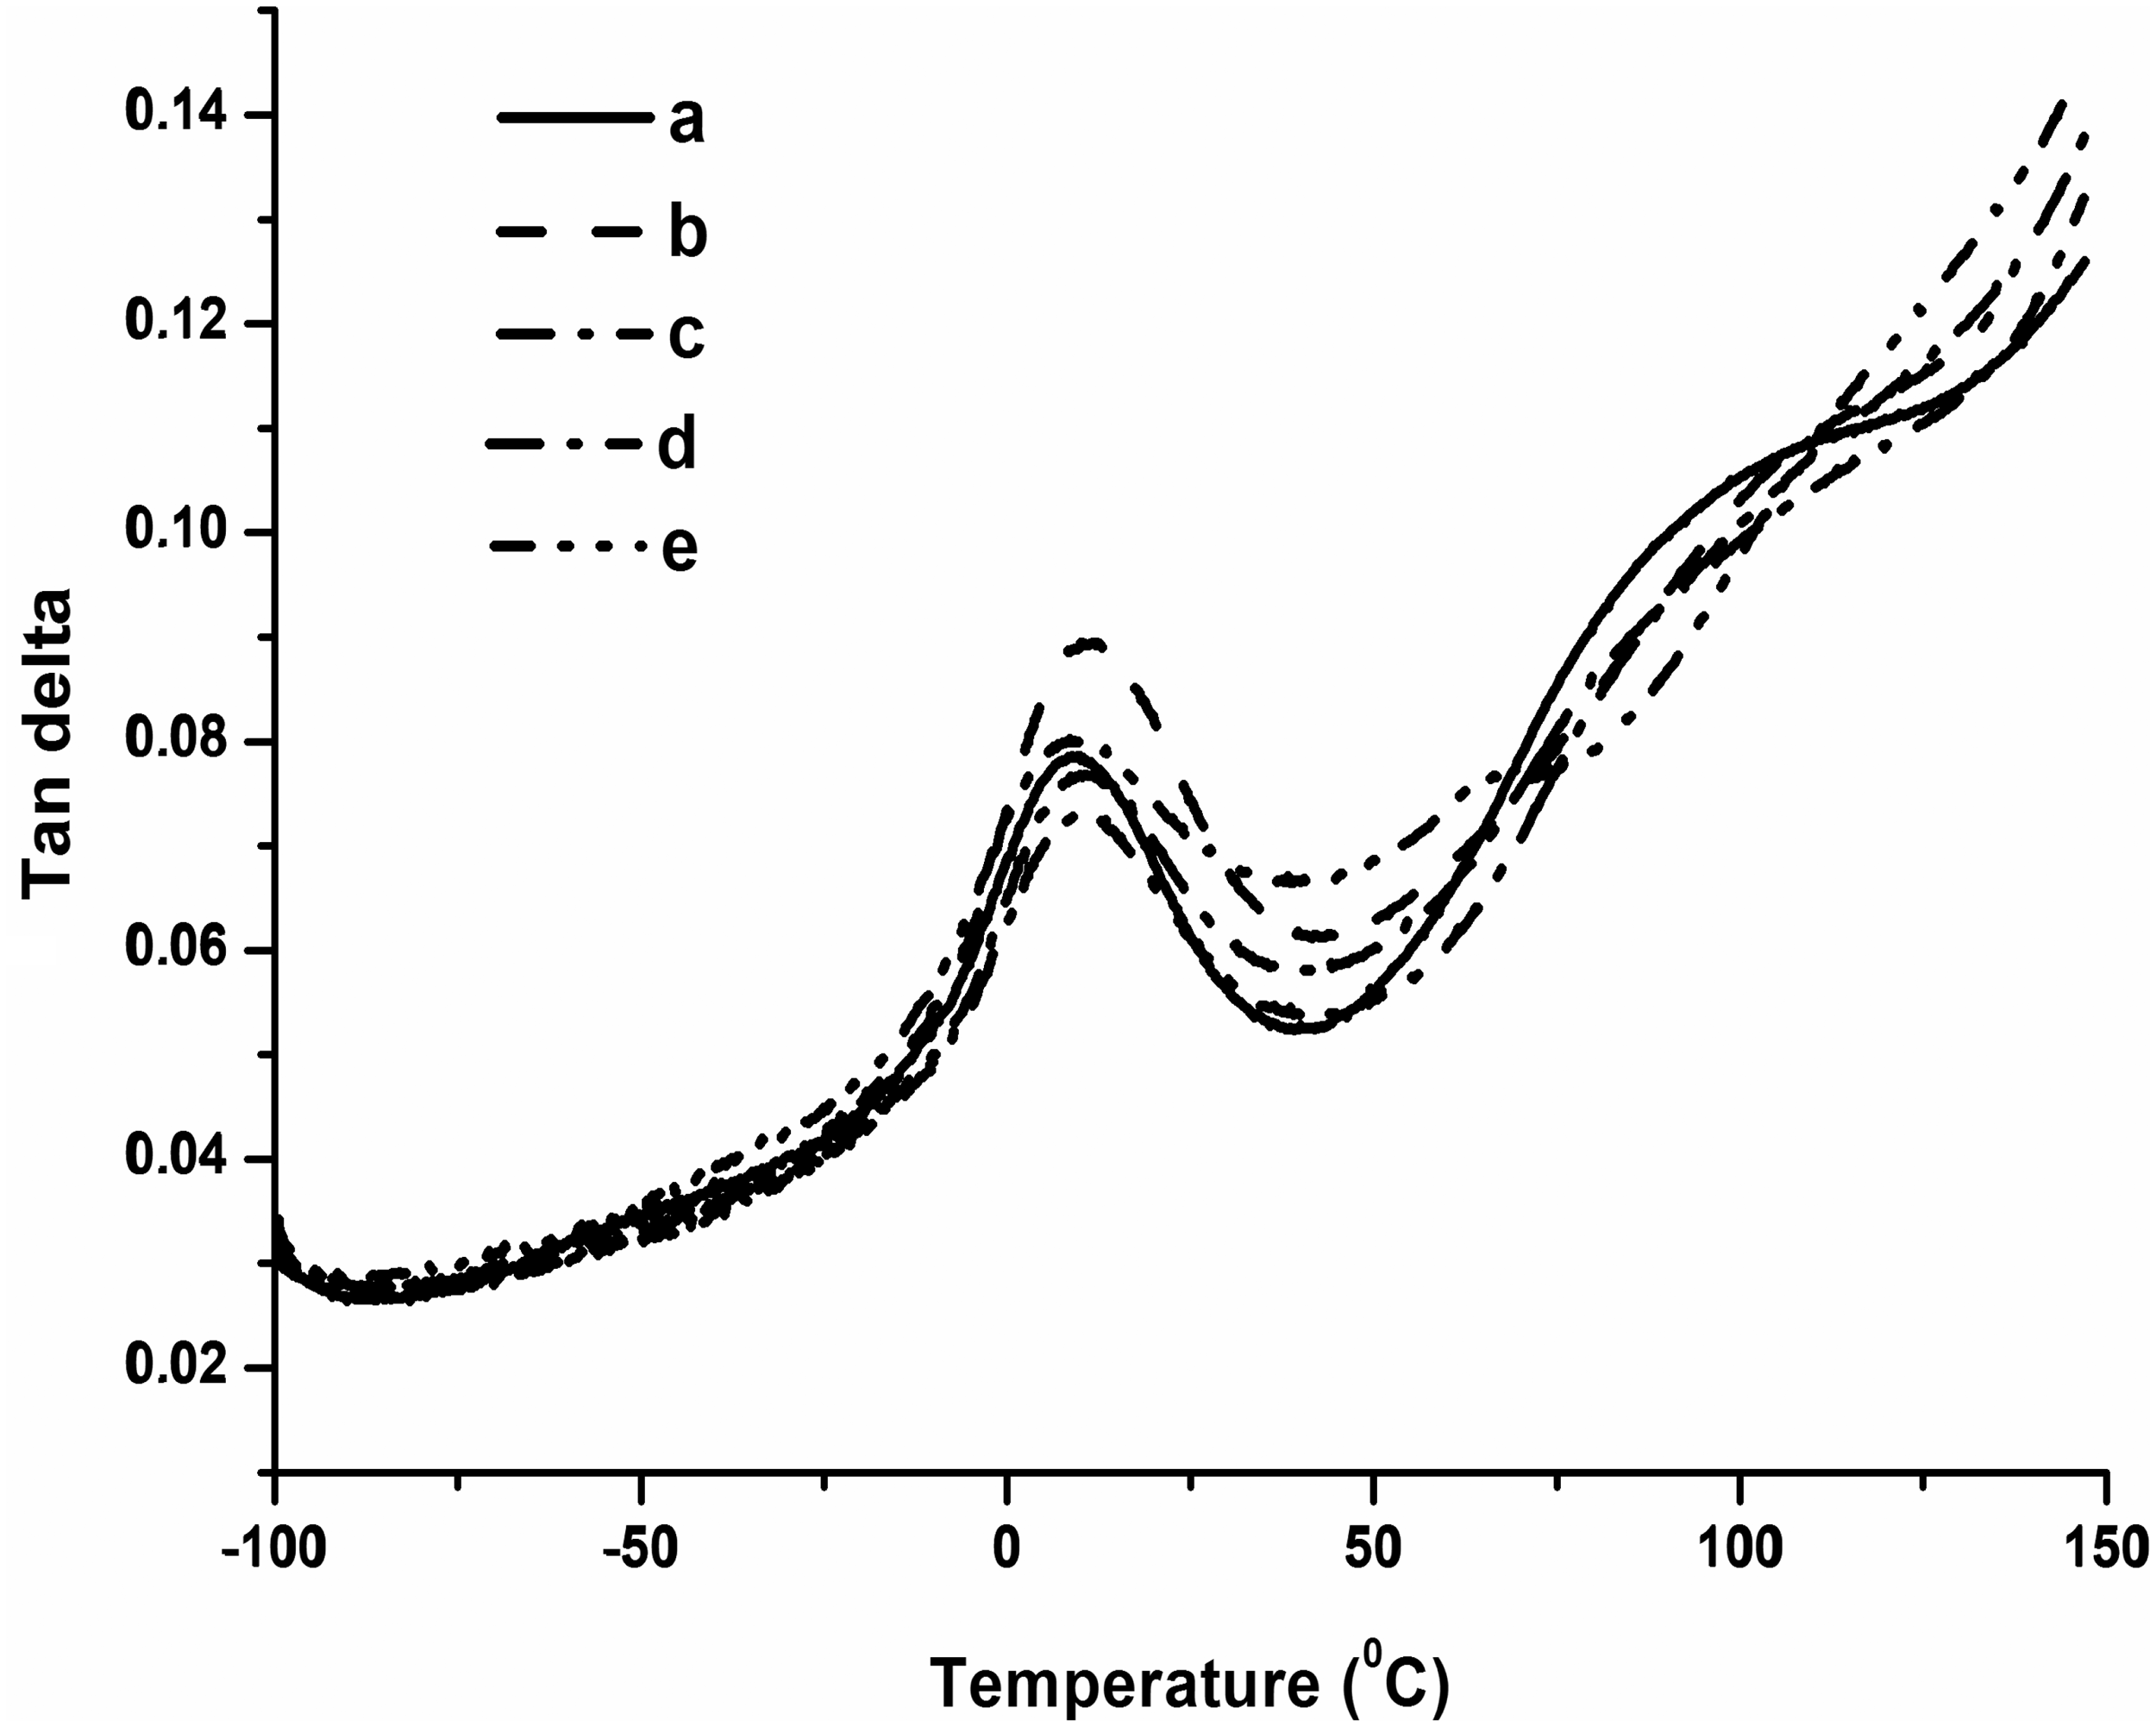
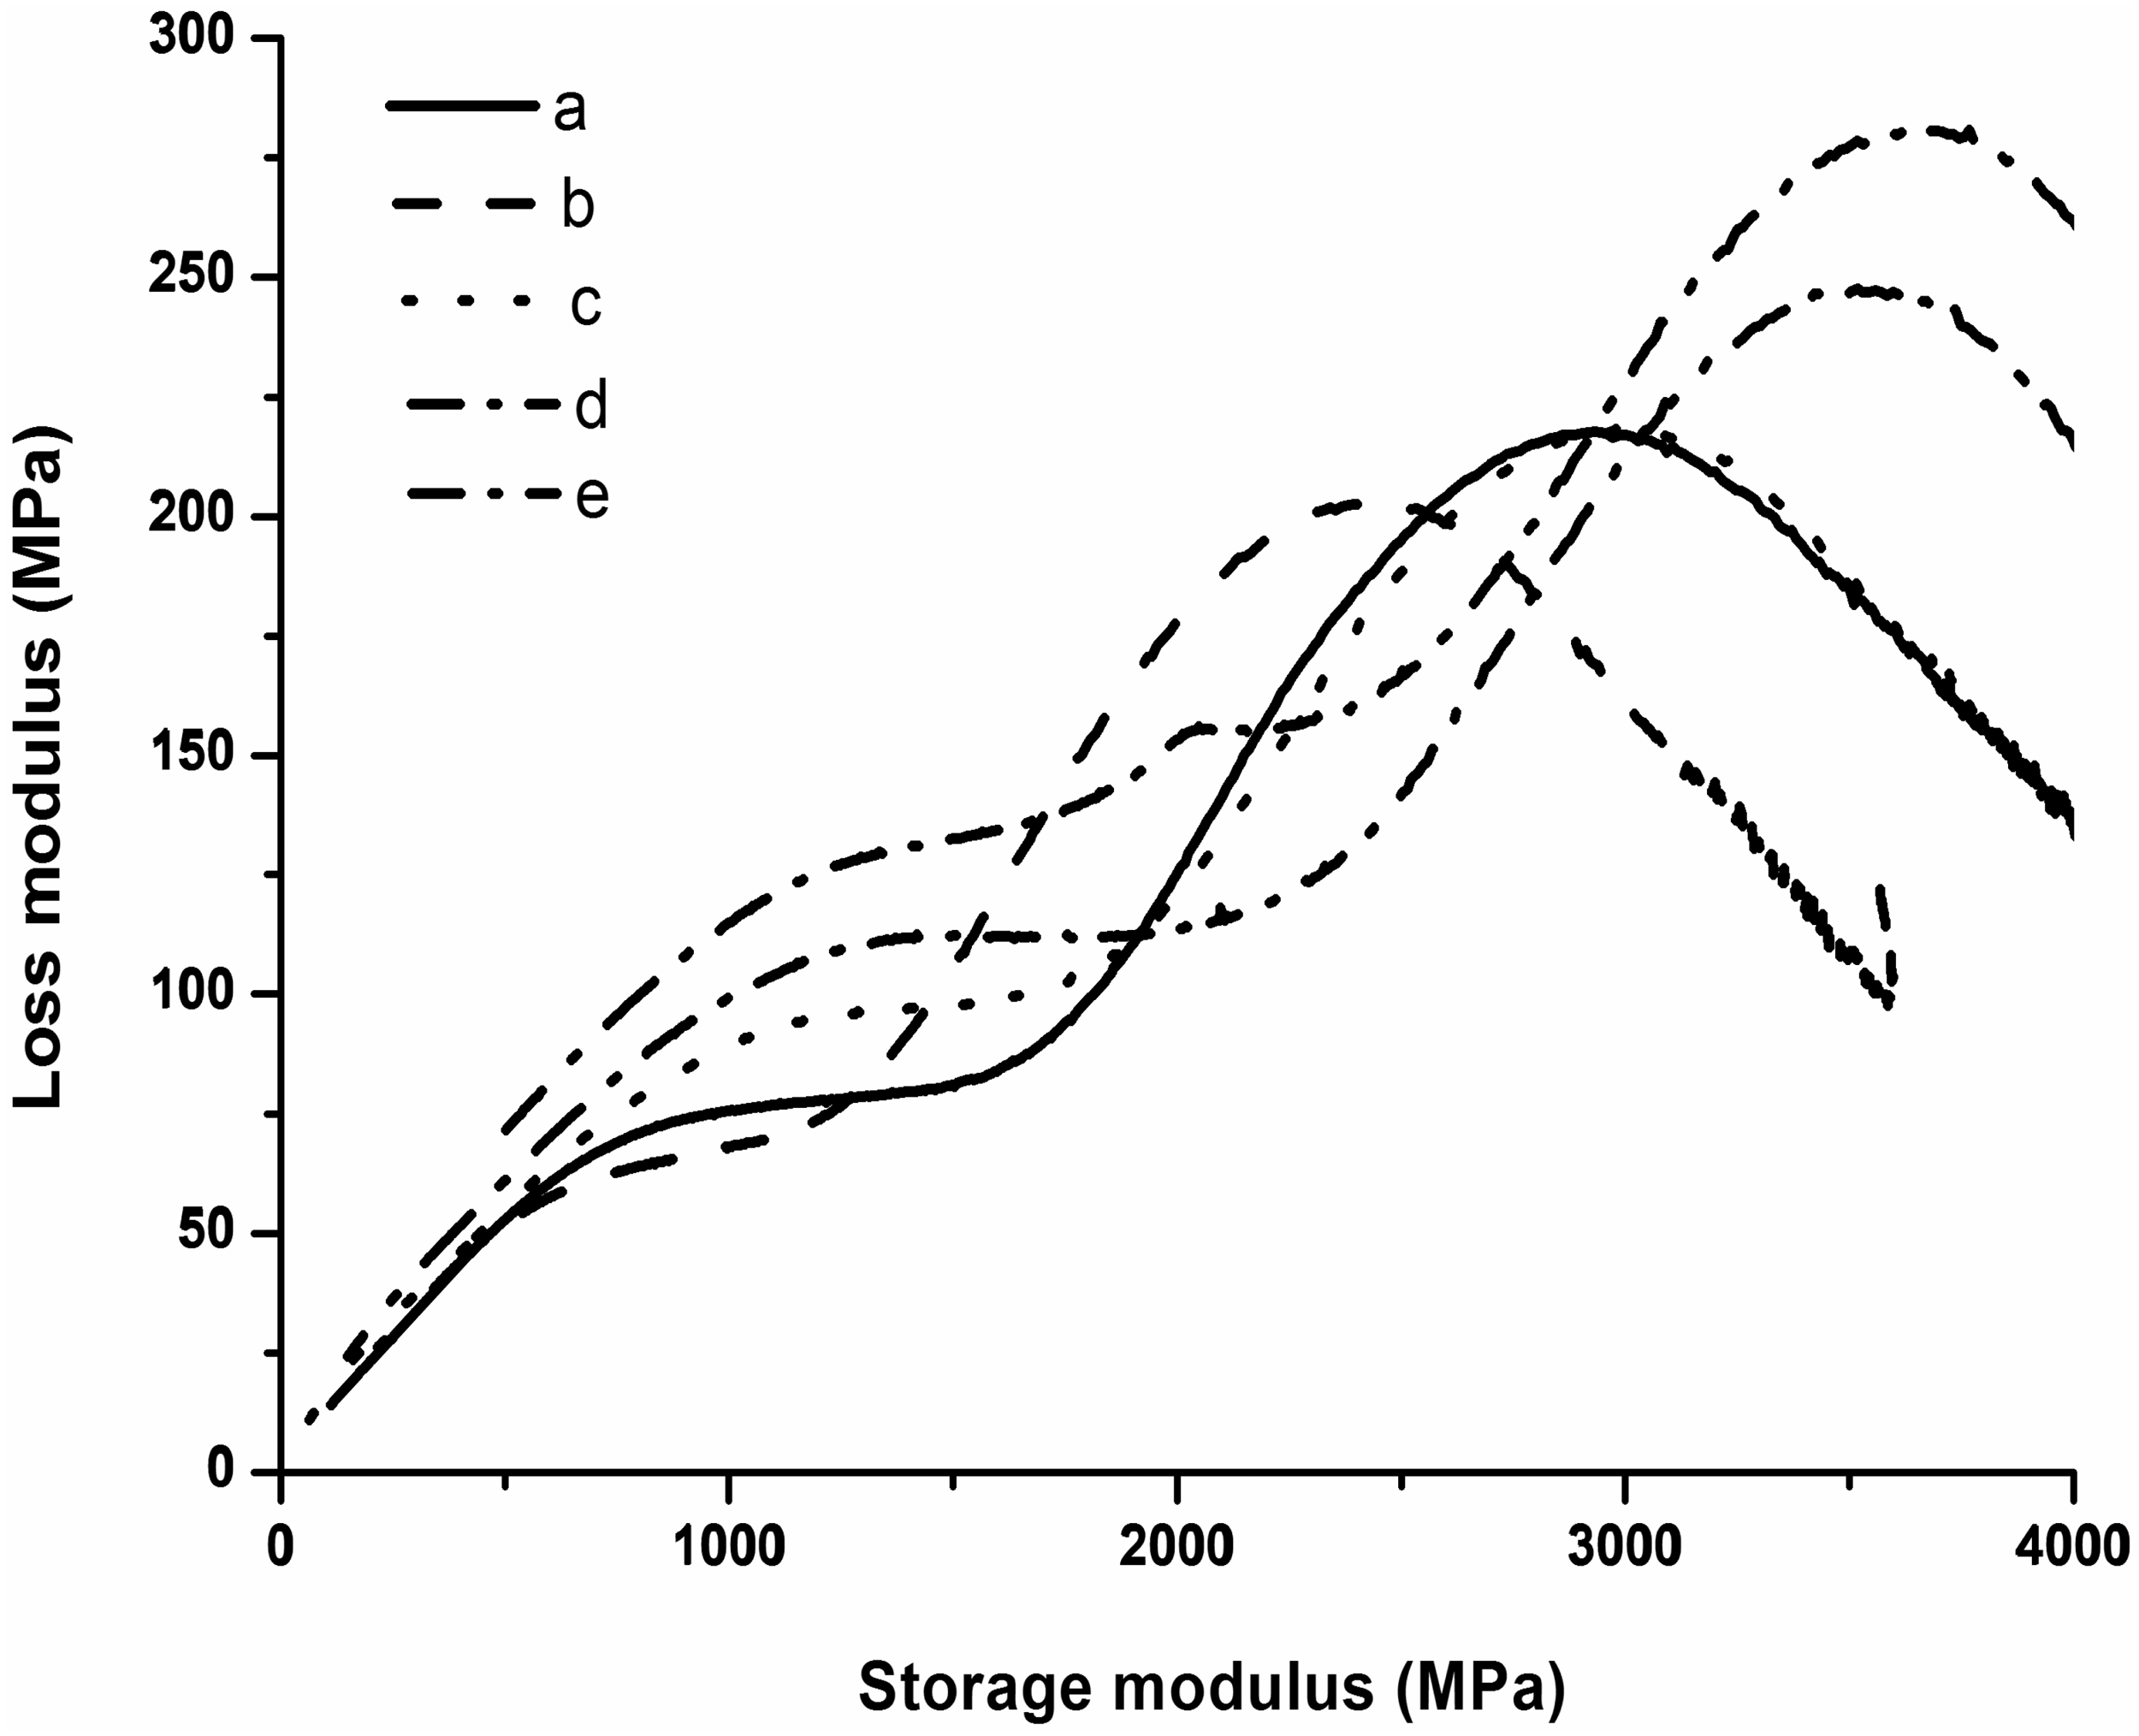
Cole–Cole Plot
Cole–Cole analysis was made to understand the phase behavior and structural changes taking place after the addition of nanofiller to polymeric systems. The dynamic mechanical properties as a function of temperature is represented on the Cole–Cole complex plane in Figure 13, where the loss modulus (E″) is plotted as a function of the storage modulus (E′). The nature of the Cole–Cole plot is reported to be indicative of the nature of the polymer filler system. The shape of the curve indicates the heterogeneous systems with relatively good clay–polymer and fiber interaction. Thus, it can be concluded that clay loadings do not affect the morphological state of fiber-reinforced nanocomposites. Figure 14 shows the data for comparison of elastic modulus ratios for these samples from the variation of ratios across the entire temperature range. The reinforced effect in storage modulus by adding banana fiber is the most effective, especially in the higher temperature range rather than the lower temperature range.
The ratio of elastic modulus for: (a) PP, (b) OPP, (c) OPP/MBF, (d) OPP/20%MBF, and (e) OPP/30%MBF. Cole–Cole plot (plot of E′ vs. E″) of: (a) PP, (b) OPP, (c) OPP/MBF, (d) OPP/20%MBF, and (e) OPP/30%MBF nanocomposites as a function of temperature.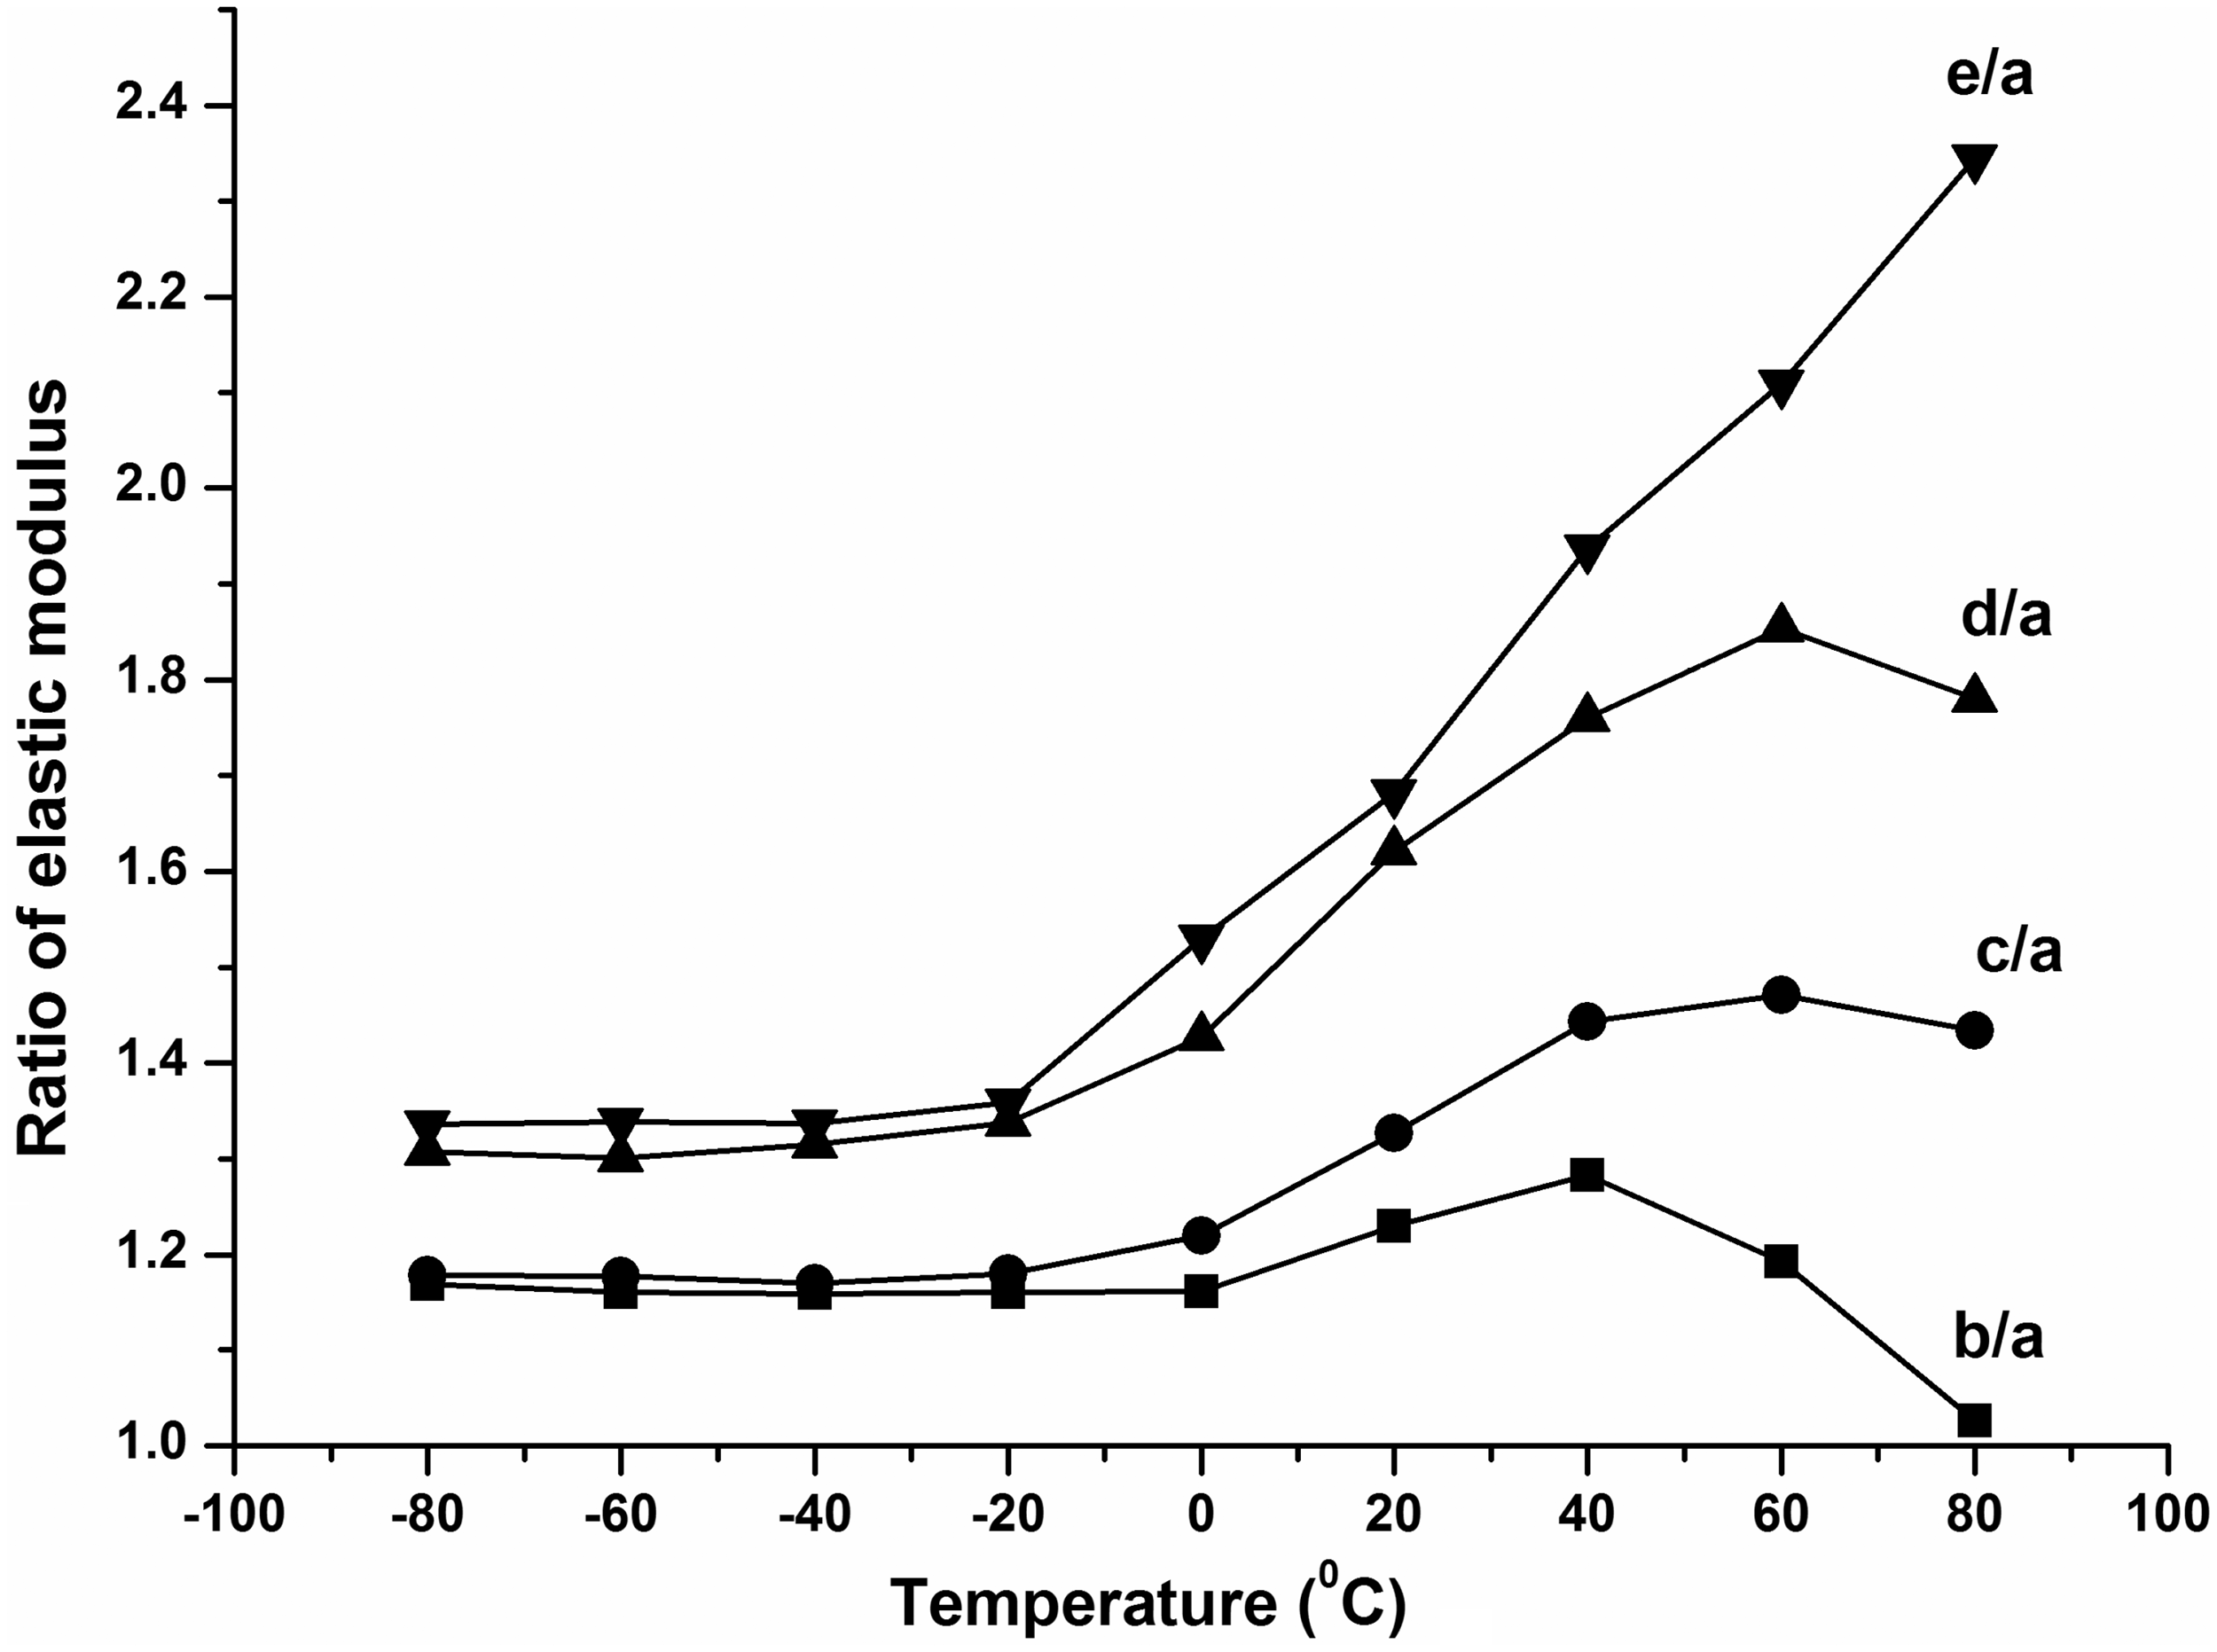
Conclusions
Mechanical properties of PP, OPP nanocomposites, and PP/MBF nanocomposites.
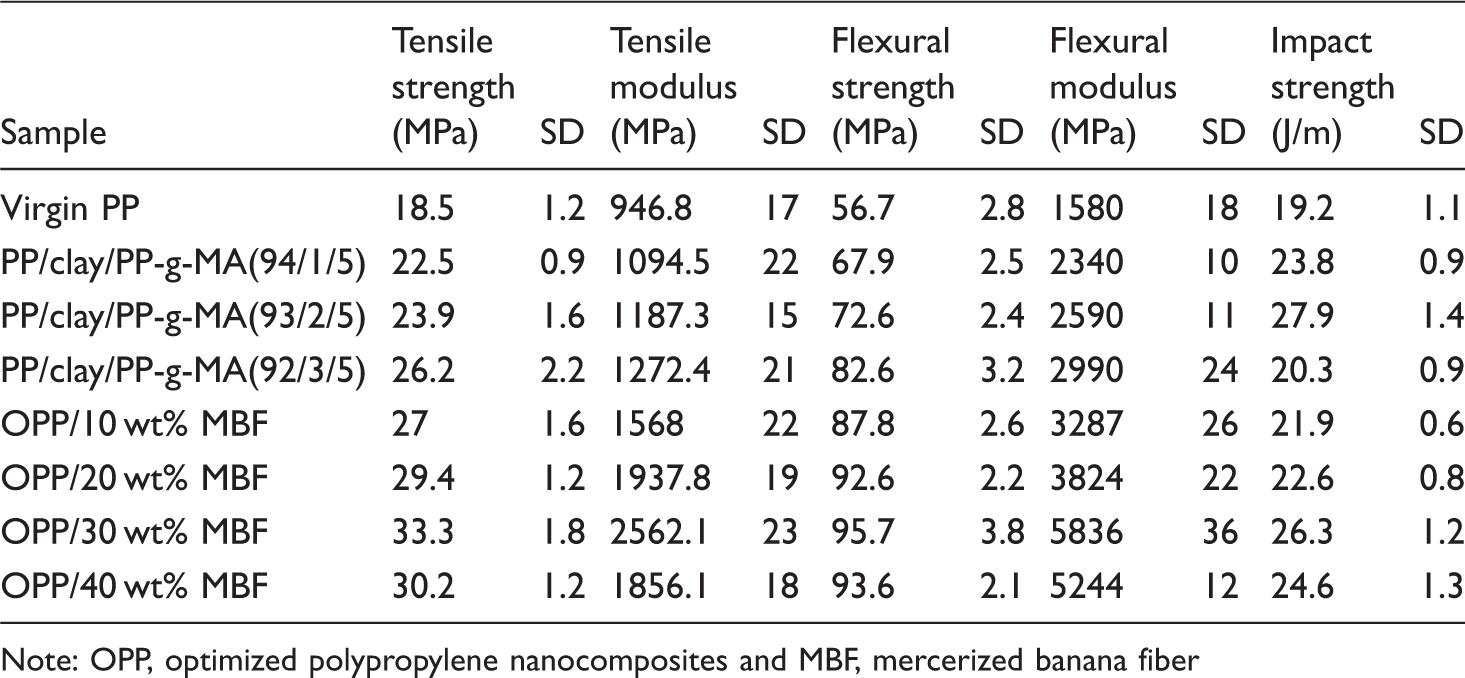
Note: OPP, optimized polypropylene nanocomposites and MBF, mercerized banana fiber
Activation energy (Ea) of PP, OPP, and OPP/MBF nanocomposites calculated by Kissinger and modified Coats–Redfern method.
Activation energy (Ea) of PP, OPP, and OPP/MBF nanocomposites calculated by F–W–O method.