
Abstract
Reinforced poly(lactic acid) (PLA) and poly(butylene succinate-co-L-lactate) (PBSL) blend was prepared. Two different fillers namely coconut shell (CS) and rice husk (RH) were used as reinforcement for the PLA-PBSL blend at different filler content (0–10 wt%) and their effects on the blend was investigated. Tensile test results showed that 7.5 wt% filler is the optimum filler loading for both filler types. The comparative performance of composites prepared using the optimum filler loading was further investigated. At the same filler loading, CS performs better than RH in terms of strength, crystallization, and water absorption properties of the blends. Specifically, the tensile strength of CS reinforced blend increased by 195% compared to RH (145%). Likewise, the CS blend has a crystallinity index (XDSC) of 52% compared to 45% of RH which aligns with observations from the X-ray diffraction analysis. However, thermogravimetric analysis revealed that RH reinforced blend is more thermally stable than CS reinforced blends. This study reveals that the two fillers can desirably enhance the performance of PLA/PBSL blends, especially to produce environmentally friendly products. However, CS could offer better performance over RH especially where better mechanical strength, improved crystallization and low water absorption are desired.
Introduction
Recently, there is an increasing interest in biodegradable polymers to substitute their petroleum-based counterparts. This is particularly due to their environmental friendliness, and the drastically diminishing petroleum reserve which have triggered a growing increase in the price of oil.1,2 Particularly, poly(lactic acid) (PLA) has drawn large research interest due to its desirable strength and stiffness which is comparable to several engineering polymers. 3 So, PLA has been extensively used in different applications, 4 but its wider application is limited by its inherent brittle nature and low toughness.4,5 Therefore, an increasing number of studies are recently being concentrated on toughening PLA, through copolymerization, plasticization, or physical blending.2,6
Blending PLA with suitable polymers has been observed to be promising, because this approach is facile and cost effective compared to the chemical modification methods. Hence, there are several reports on blending of PLA with different flexible polymers.7-9 However, the blends sometimes do not mix together, forming phase-separated structures due to poor compatibility, which often result in unsatisfactory modification or toughening effects.2,9 One of the notable polymers that have been reportedly blended with PLA, is poly(butylene succinate-co-L-lactate) (PBSL). The presence of lactate units in this copolyester helps to facilitate its compatibility with PLA. Previously, it was reported that blending PBSL and PLA significantly improved the toughness and elongation of the blend. 9 Likewise, an increase of about 284% was reported when 25 wt% PBSL was incorporated into PLA in another study. 10 Shibata et al., used poly(butylene succinate) (PBS) to improve the toughness for PLA by incorporating lactide into the PBS as a compatibilizer. It was reported that PBSL facilitated significant enhancement in the elongation of the blend compared to PBS. 11 However, despite these notable and significant enhancements in toughness and elongation at break of the PLA toughened blends, reports have revealed that most of the blends present undesirable decrease in modulus values as well as unsatisfactory toughening effects.2,3
In another vein, over the past few decades, the salient properties of lignocellulosic fibers have been widely exploited in different applications, especially as reinforcement in different polymeric composites.12-17 Likewise, polymer blends can be reinforced with natural fibers to improve properties such as stiffness and modulus. However, in the case of PLA/PBSL blends, it is rather common to find reports on modification through blending than reinforcement. For example, PBSL has been used to toughen PLA. 2 Likewise, PLA has been incorporated as the minor component in PBSL to improve the blend properties. In contrast, natural fibers have been separately incorporated into PLA and PBSL composites. This is evident through the several reports on natural fiber reinforced PLA composites.18-20 Likewise, different natural fibers have been exploited as reinforcement for PBS matrix. 21 This is partly due to the polar groups, and non-polar components in the structure of these matrices, because natural fibers also contain polar and non-polar components in their structure which helps to facilitate good fiber-matrix interactions. However, to the best of the authors’ knowledge, there is limited report on the reinforcement of PLA-PBSL blend, using natural fillers. Therefore, the reinforcement of PLA-PBSL blend using two different natural fillers such as coconut shell (CS), and rice husk (RH) is reported herein. These fillers were selected based on their comparative chemical composition,22-25 which is presented in Table 1. The comparative effects of these fillers on the mechanical, thermal, crystallinity and water absorption properties of the blends were investigated.

Materials and methods
Materials
The matrices used in this study are PLA and PBSL. The PLA is an IngeoTM 3052D Biopolymer from Nature works with a melt flow index of 30–40 g/10 min (190°C/2.16 kg), density of 1250 kg/m3 and melting temperature of 160–170°C. On the other hand, the PBSL pellets (Type GS Pla® AZ-type) was used. The PBSL has a lactate unit of ca. 3%, Mn = 0.6 × 10⁵, Mw = 1.47 × 10⁵, DP = 479.8 and PD = 2.5. The reinforcing fillers used are coconut shell (CS) and rice husk (RH). The raw coconut shell was obtained from the wet market in Nibong Tebal, Malaysia while the rice husk was obtained as residue from the paddy factory. The coconut shell was first crushed into smaller pieces using a hammer after which the two filler types were subjected to ultrasound assisted treatment in a water medium at 90°C for 75 min at an ultrasound power of 9 W/cm2. The dried treated fillers were then ground using a laboratory mill after which they were sieved on a laboratory mechanical sieve shaker with a mesh size of 50 µm.
Methods
Blend preparation
The neat PLA and PBSL control samples were prepared using a two-roll mixer at 190°C and 120°C respectively while the PLA-PBSL blend was prepared through melt-mixing at 190°C, using a Labtech LRM-S-110/3E+W Scientific Laboratory Two Roll Mill. Similarly, the reinforced PLA-PBSL blends were prepared at the condition of the blend, by incorporating the required wt% amount of the respective fillers such as 2.5 wt%, 5 wt%, 7.5 wt%, and 10 wt%. After compounding, test samples were prepared through compression moulding at 190°C for 7 min after which they were cooled. The code name of the different samples prepared, and their respective compositions are summarized in Table 2.
Composition of the prepared samples and their code names.

Fourier transform infrared (FTIR) spectroscopy
The FTIR spectra of the materials were obtained from a Shimadzu FTIR spectrophotometer (Model-IR affinity-1 S) over a wavenumber range of 400–4000 cm−1. The FTIR analysis was performed through the standard KBr technique and IR spectra were recorded for each sample after 32 scans.
Morphological analysis
The fractured surface morphologies of the samples were observed on scanning electron microscope (SEM; ZEISS, EVO 50). Dried samples were coated with platinum through sputtering prior to SEM observation, to make them conductive.
Tensile testing
Tensile test was performed on a universal testing machine (Instron: Series IX version 8.25.00). The samples were prepared according to ASTM D638 and testing was conducted at 23°C on dry samples at a relative humidity of 50%, and crosshead speed of 5 mm min−1. Five specimens were tested for each batch and the average result was used to obtain the tensile strength (TS) and tensile modulus (TM).
Thermal analysis
Thermogravimetric analysis (TGA) and derivative thermogravimetry (DTG) analysis were used to assess the thermal stabilities of the neat PLA, PLA-PBSL blend and the reinforced PLA-PBSL blends. The thermal analysis was performed on a TA analyzer (TGA Q500 V6.4, Germany). The dried samples were weighed and placed in a platinum crucible after which they were heated at a constant rate of 10°C min−1 under nitrogen atmosphere. The gas flow rate is 40 mL min−1 and the samples were heated over a temperature range of 25–650°C.
Differential scanning calorimetric analysis
Calorimetry analysis (DSC) was used to investigate the crystallinity of the specimens. The DSC analysis was performed using a thermal analyzer instrument (DSC Q1000), as the specimens were heated over a temperature range of 25 to 250°C at a constant rate of 10°C min−1. The glass transition temperature (Tg), crystallization temperature (Tc), and melting temperature (Tm) of the samples were determined from the DSC thermogram. In addition, the crystallinity (XDSC) of PLA and the influence of reinforcing filler on the crystallinity of the PLA-PBSL blend was evaluated using the heat of fusion of the tested specimens and a reference PLA sample with 100% crystallinity. This was calculated using equation (1).

where, ΔH, is the heat of fusion of sample and ΔHm, is the heat of fusion of the reference PLA sample with 100% crystallinity. On the other hand, W is the mass fraction of the matrix. The heat of fusion of reference PLA with 100% crystallinity was taken as 93.6 J/g. 26
X-Ray diffraction (XRD) analysis
The XRD analysis was performed on the samples at 1° min−1, using a sampling step of 0.02°, over 2Θ range of 3–50° at a wavelength of 0.541 nm using an XRD diffractometer.
Wettability and water absorption analysis
The water absorption properties of the neat PLA, PLA-PBSL blend and the reinforced PLA-PBSL blends were determined according to ASTM D570-98. Briefly, dried specimens were immersed in distilled water for about 60 days at room temperature, without providing any protection for the specimen surfaces. The weight of the specimens was regularly measured after an interval of 10 days. Then the increase in weight was used to calculate the percentage water absorption at a time t, using the following equation:

where, Wo and Wt are the initial weight of the specimen at t = 0, and the weight of the immersed specimen at a time (t), respectively.
Results and discussion
Tensile properties
The tensile strength (TS) and tensile modulus (TM) of neat PLA, neat PBSL, PLA/PBSL blend and PLA/PBSL blend containing different wt% of coconut shell (CS) or rice husk (RS) fillers are illustrated in Figure 1. As can be seen in the figure, the TS and TM of neat PLA is higher than all the other samples. On the other hand, whereas the TS of PBSL (Figure 1a) is higher than the value for all the blends, the TM values of the blends are higher than the TM of neat PBSL (Figure 1b). This is because the initial TS of PLA/PBSL blend is lower than neat PBSL, and was improved by the incorporation of the fillers whereas the initial TM of the PLA/PBSL blend is higher that the TM of PBSL. So, the incorporation of fillers merely helped to further improve the TM of the blend (Figure 1b).
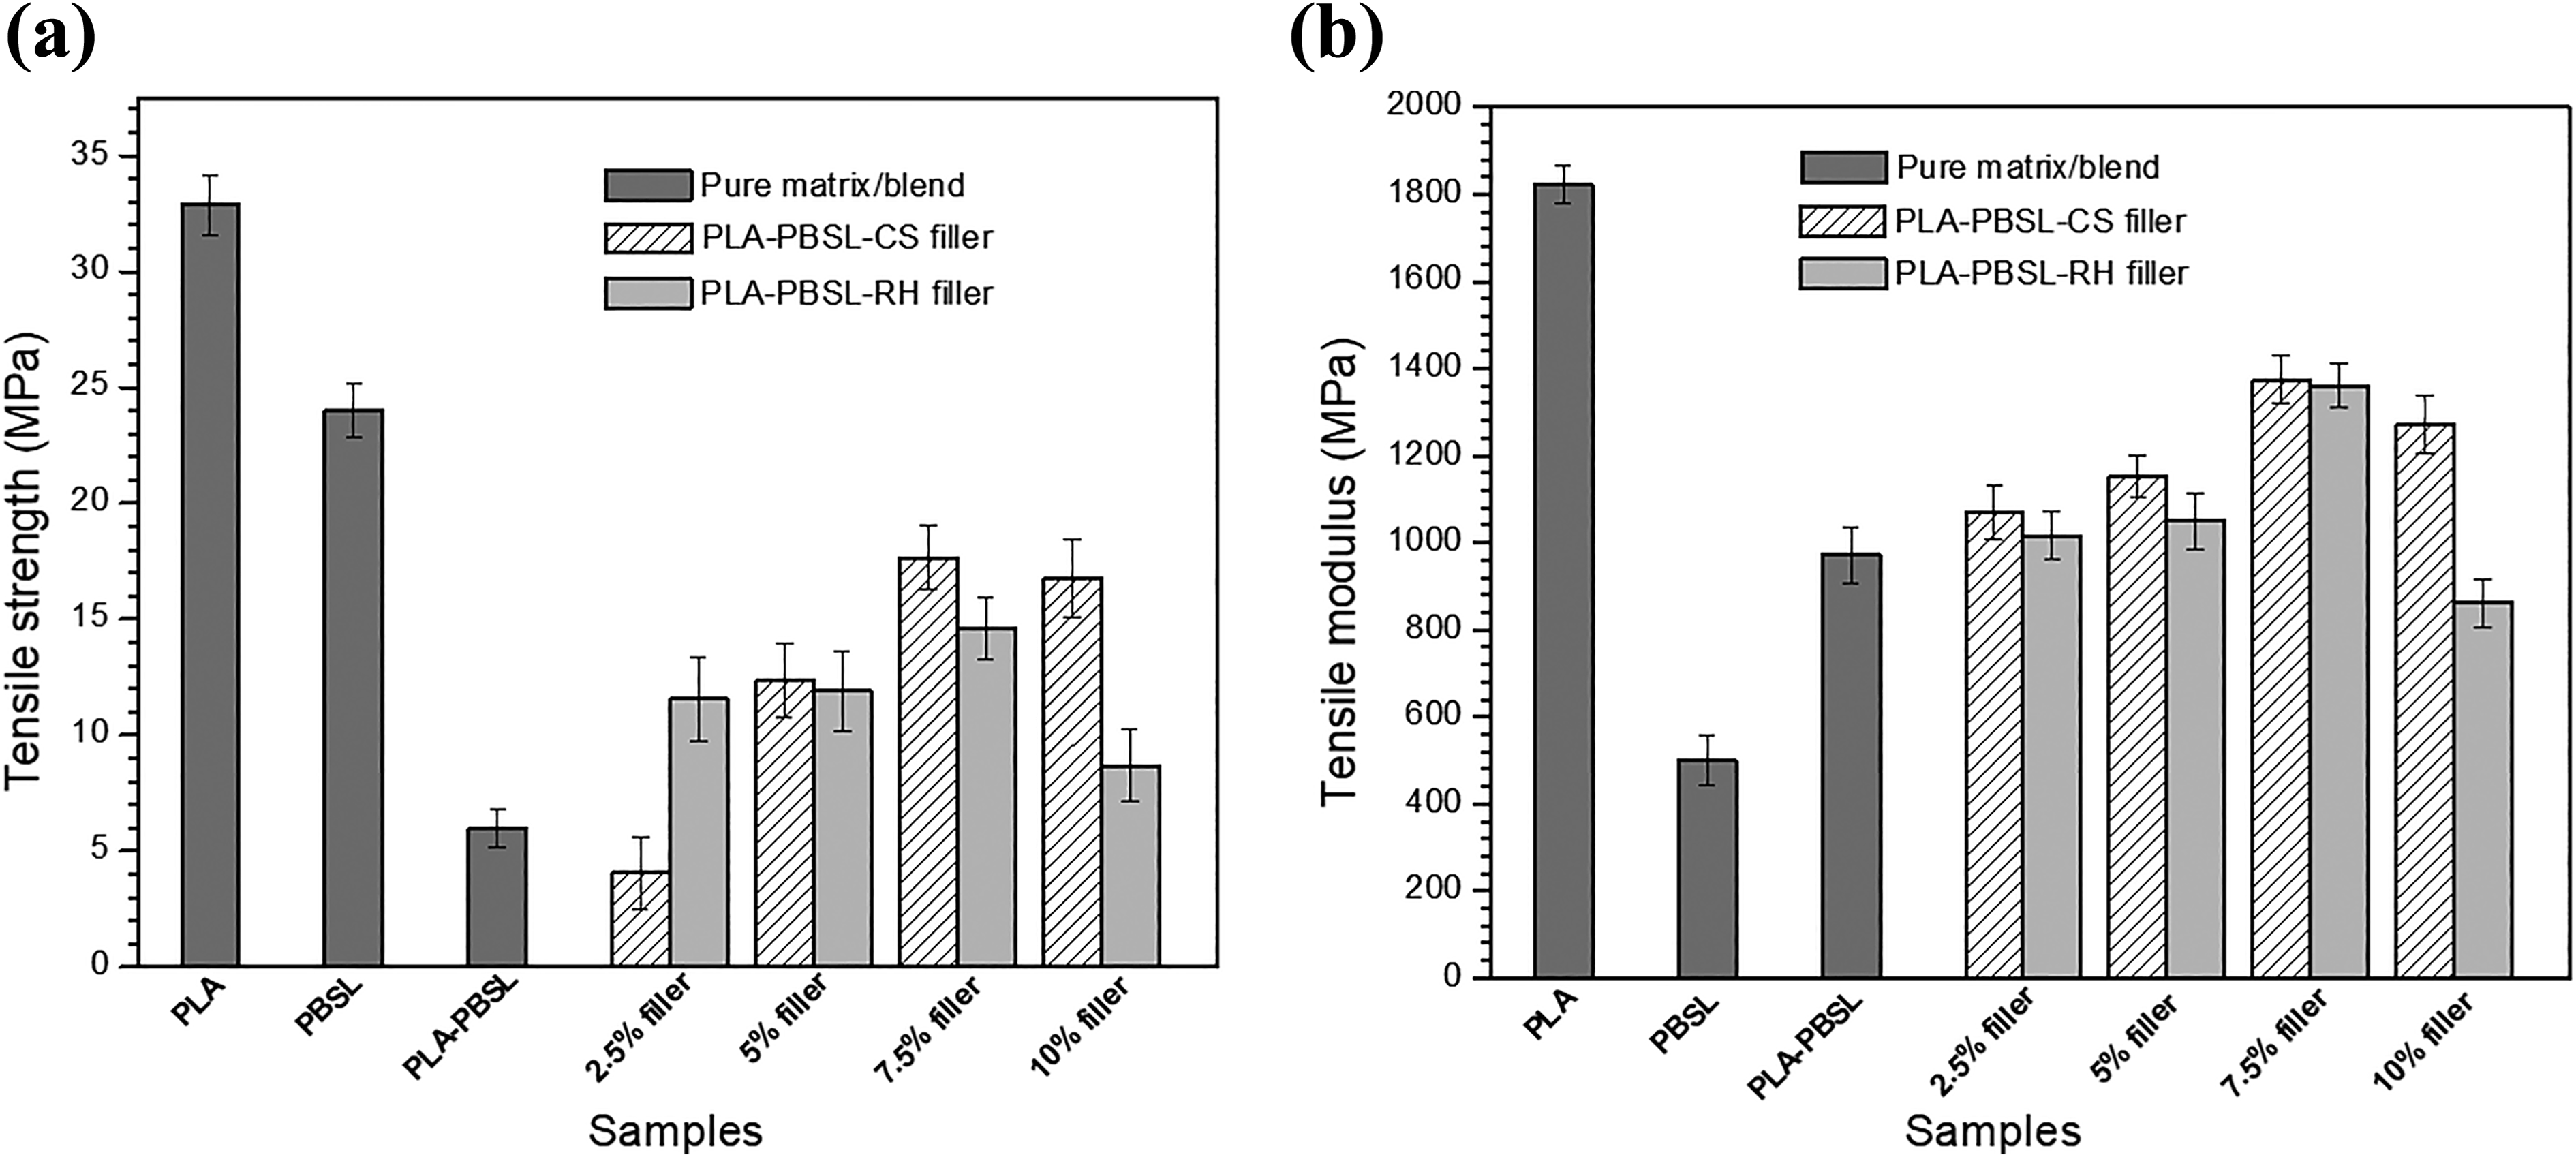
Tensile strength (a), and tensile modulus (b) of neat PLA, neat PBSL, PLA-PBSL blend and reinforced PLA-PBSL blends containing different type and wt% filler content.
The higher tensile properties of neat PLA compared to PBSL can be attributed to the superior mechanical properties of PLA. The TS and TM of the PLA-PBSL blend are lower than the individual neat polymers, perhaps due to reduction in the stiffness of PLA following the incorporation of PBSL. Also, it can be as a result of ineffective stress transfer across the phase of the two matrices as reported in a previous study. 7 Significantly, the incorporation of fillers into the blend produced notable improvement in tensile properties. Specifically, the TS and TM increased with increasing filler loading up till 7.5 wt% filler content for both types of filler. However further increase in filler content to 10 wt% resulted in reduced mechanical properties. The initial increase in mechanical properties can be attributed to effective stress transfer from the matrix to the reinforcing filler perhaps due to good dispersion. 27 However, above 7.5 wt% filler content, agglomeration of the fillers might have occurred which would cause the fillers to act as stress concentration sites. 28 Invariably, this will trigger premature failure, thereby negatively affecting the mechanical properties of the reinforced blend as evident through the reduced TS and TM values at 10 wt% filler content. This might also be the reason for the reduced crystallization activities in the blend containing higher filler loading as revealed by the DSC analysis.
The percentage decrease in the mechanical properties of PBSL and the blends with respect to neat PLA is presented in Table 3. By comparing the two fillers, CS reinforced blends presents better mechanical properties compared to RH reinforced blends. This can be attributed to the higher aspect ratio of CS compared to RH, rather than the cellulose content in the CS filler, which might have increased the contact between PLA and PBSL thereby facilitating better mechanical interlocking compared to the RH reinforced blends. Based on these tensile results, as presented in Figure 1 and Table 2, the reinforced blends containing 7.5 wt% filler content was selected as the optimum filler loading for ease of comparison between the two types of fillers used. However, where necessary, the lowest amount of filler used in this study (2.5 wt%) is also included in some analysis results for comparison purposes.
Percentage decrease in tensile properties of the PBSL matrix, PLA-PBSL blend, and reinforced PLA-PBSL blends in comparison with neat PLA.

Morphological properties
The SEM images of the fractured surfaces of PLA, PLA-PBSL blend and reinforced PLA-PBSL blend containing 7.5 wt% filler is presented in Figure 2. As can be seen in Figure 2a, the fractured surface of neat PLA exhibits a smooth morphology which is typical of brittle materials. Similarly, morphology of the PLA-PBSL blend is fairly smooth perhaps due to plastic deformation, believed to have been induced by the brittle PLA, as reported for modified PLA in a previous study. 29 Nevertheless, no evidence of phase separation in the fractured surface morphology of the blend which is an evidence of good compatibility between PLA and PBSL. This is because the lactate in the PSBL matrix, might have helped to foster good interaction between the two matrices. 2

Fractured surface morphologies of (a) PLA, (b) PLA-PBSL blend, and reinforced PLA-PBSL blends containing (c) 7.5 wt% CS and (d) 7.5 wt% RH.
In contrast, the incorporation of fillers into the blend produced a rougher morphology similar to what was observed in a recent study on particulate PLA and PBSL composites containing coffee waste. 8 However, by comparing the two fillers, the fractured surface morphology of the CS reinforced blend (Figure 2c) depicts good interaction between the fiber and the polymer blend compared to the RH reinforced blend (Figure 2d). This might be due to the good dispersion of CS in the blend compared to RH. Several pull out holes are evident in the RH reinforced blend (Figure 2d), indicating poor adhesion. This might be responsible for the lower mechanical properties of the RH reinforced blend as presented in Figure 1 and Table 3. It might also have contributed to the low crystallization activities in the RH reinforced blend as discussed through DSC and XRD analysis.
Fourier transforms infrared spectroscopy (FTIR)
The FTIR spectra of neat PLA, PLA-PBSL blend and the reinforced PLA-PBSL blends are illustrated in Figure 3. From the figure, the characteristic vibrations above 3200 cm−1 is attributed to the terminal –OH group in the PLA chain. The band with two notable peaks around 2848–2999 cm−1 is associated with the symmetric and asymmetric stretching of the methyl moieties in PLA. It is worthy of note that the intensity of this peak increased in the spectra of PLA-PBSL blend which is believed to be due to contribution from the methyl components of PBSL. Likewise, this peak is more intense in the reinforced PLA-PBSL blends compared to neat PLA which is believed to be due to additional contribution from the –CH components of the reinforcing fillers, similar to what was reported in a previous study. 30 Generally, it is interesting that the main components in PLA and PBSL (as illustrated in Figure 4), such as the methyl component and groups can be seen in the structure of neat PLA and PBSL.

FTIR spectra of PLA, PLA-PBSL blend and reinforced PLA-PBSL blend containing different amount of CS and RH fillers.

The basic structure of (a) PBSL and (b) PLA showing their functional groups.
The conspicuous peak around 1749 cm−1 in the spectra of neat PLA represents C=O stretching from the carboxylic and ester groups. 30 This peak appeared in the range of 1735–1749 cm−1 in all the samples whereas the peak representing the C–O–C stretching appeared around 1050–1185 cm−1. Similar peaks were also reported for PLA-PBSL blends in a previous study. 9 The peak at 1458 cm−1 is attributed to –CH3 deformation while the peak around 754 cm−1 is due to the skeletal vibrations of the methylene moieties. It is worthy of note that the spectra of all the samples looks very much like that of neat PLA. Specifically, all the important peaks of PLA are present in the blends which suggest that the incorporation of PBSL or the reinforcing filler did not undesirably alter the spectra of the PLA matrix. However, it is interesting that the incorporation of PBSL introduced additional peaks into the PLA spectra as evident in the spectra of PLA-PBSL especially in the region below 1500 cm−1. This suggests effective blending of the PBSL matrix into the PLA matrix, attributed to the polar and non-polar components in the structure of these matrices (Figure 4). On the other, the presence of lactate in the PBSL might have facilitated good compatibility between the two polymers which supports the result of the SEM analysis.
Generally, as stated, it is evident that the spectra of all the samples are similar. However, it is significant that the peak at 1749 cm−1 in the spectra of PLA exhibits a slight downward shift in the spectra of the blends. This is an indication of active reaction between PLA and the components of the blends, especially the C=O of PLA and –OH of the other components. 31 On the other hand, the –CH3 deformation peak at 1458 cm−1 in the PLA spectra was split in the blends. This suggest interactions between PLA, PBSL, and the reinforcing fillers. It is particularly significant that the downward shift in the peak at 1749 cm−1 is a little bit further in the CS reinforced blends at all wt% filler loading compared to RH reinforced blends. This might be the reason for the better mechanical properties of the CS reinforced blends compared to the RH reinforced blends as presented in the mechanical properties section. This might also have contributed to the higher crystallinity of the CS reinforced blends perhaps due to better interaction between CS and the polymer blend, which helped to facilitate good nucleation activities.
Thermal properties
The TGA and DTG curves of the samples are illustrated in Figure 5a and b, while the thermal degradation properties are summarized in Table 4. From Figure 5, the TGA curves of the entire samples exhibit similar trend, just like the DTG curves. The onset of thermal degradation (Tonset) of the samples, except neat PLA is around 255°C whereas the Tonset for neat PLA is around 305°C. Obviously, the Tonset for the PLA-PBSL blend is significantly lower than all other samples and this can be attributed to the low thermal stability of PBSL. However, as presented in Table 3, incorporation of fillers can be seen to shift the Tonset to the right side. This is believed to be due to the barrier imposed by the filler, on the exhausted gas formed by the PLA-PBSL blend during thermal analysis. 32 The weight loss due to thermal degradation of the samples continued till around 425°C for the other samples while it stopped around 400°C for neat PLA. This can be accrued to the degradation of other components present in the blends, which are not present in the neat PLA.

(a) TGA spectra and (b) DTG curves of PLA, PLA-PBSL blend and reinforced PLA-PBSL blends containing the lowest and optimum wt% content of CS and RH fillers.
Thermal properties of PLA, PLA-PBSL blend, and reinforced PLA-PBSL blends containing different type, and amount of filler.

The thermal degradation (Td) of the samples can be obtained from the DTG curve plotted in Figure 5b. However, it is also a common practice to consider the temperature at 50% weight loss of the samples as a signifier of the structural destabilization. 30 The Td of the samples is presented in Table 4. By considering the Tonset and Td values in Table 4, it is evident that the Tonset and Td values of all the blends are lower than neat PLA which is an indication of higher structural destabilization of PLA framework in the blends. By considering the reinforced blends, at higher wt% filler content, the thermal stability increased compared to lower content. This might be due to higher possibility for bonding between the –OH groups of the fillers and the polymer matrices. Specifically, there would be more available –OH groups to bond at higher filler loading compared to lower loading because the polar and non-polar components in the fillers and the blend matrices (Figure 3 and Figure 4), favors good fiber-matrix interactions. However, it is worthy of note that by comparing the two fillers, RH presents higher thermal stability to the blend compared to CS. The residue at 550°C for the samples is included in Table 4. As can be seen, neat PLA has the smallest residue whereas the reinforced blends have higher residue, and the residue content increases with respect to filler loading. This is not unexpected, as similar observation has also been reported in previous studies on reinforced polymer composites. 30
Differential scanning calorimetric analysis
The second heating DSC thermograms of PLA, PLA-PBSL blend and reinforced PLA-PBSL blends containing the lowest (2.5 wt%) and optimum (7.5 wt%) CS and RH fillers are illustrated in Figure 6. The glass transition temperature (Tg), crystallization temperature (Tc), melting temperature (Tm), and degree of crystallinity (XDSC) of the samples are included in Table 4. As can be seen in Figure 6, the Tg of neat PLA is 62°C, followed by a Tc around 115°C and Tm at 153°C. It is noteworthy that the Tg of the blends reveals a left shift compared to neat PLA which can be attributed to the low Tg of PBSL. 9 Around the Tg of heated polymers, there is usually an increase in flexibility and chain mobility. Therefore, the downward shift in Tg of the blends suggests relaxations of the PLA chain which can be attributed to the presence of PBSL. 7 On the other hand, there is an overlap in the Tc of PLA and the Tm of PBSL in the blend. Nevertheless, the Tc of the blend is lower than neat PLA, which is an indication of faster crystallization, attributed to the nucleation activities of PBSL within the PLA matrix. Significantly, the incorporation of fillers tends to further reduce the Tc of the blend which suggests that the dispersed fillers might have induced heterogeneous nucleation in the blend.
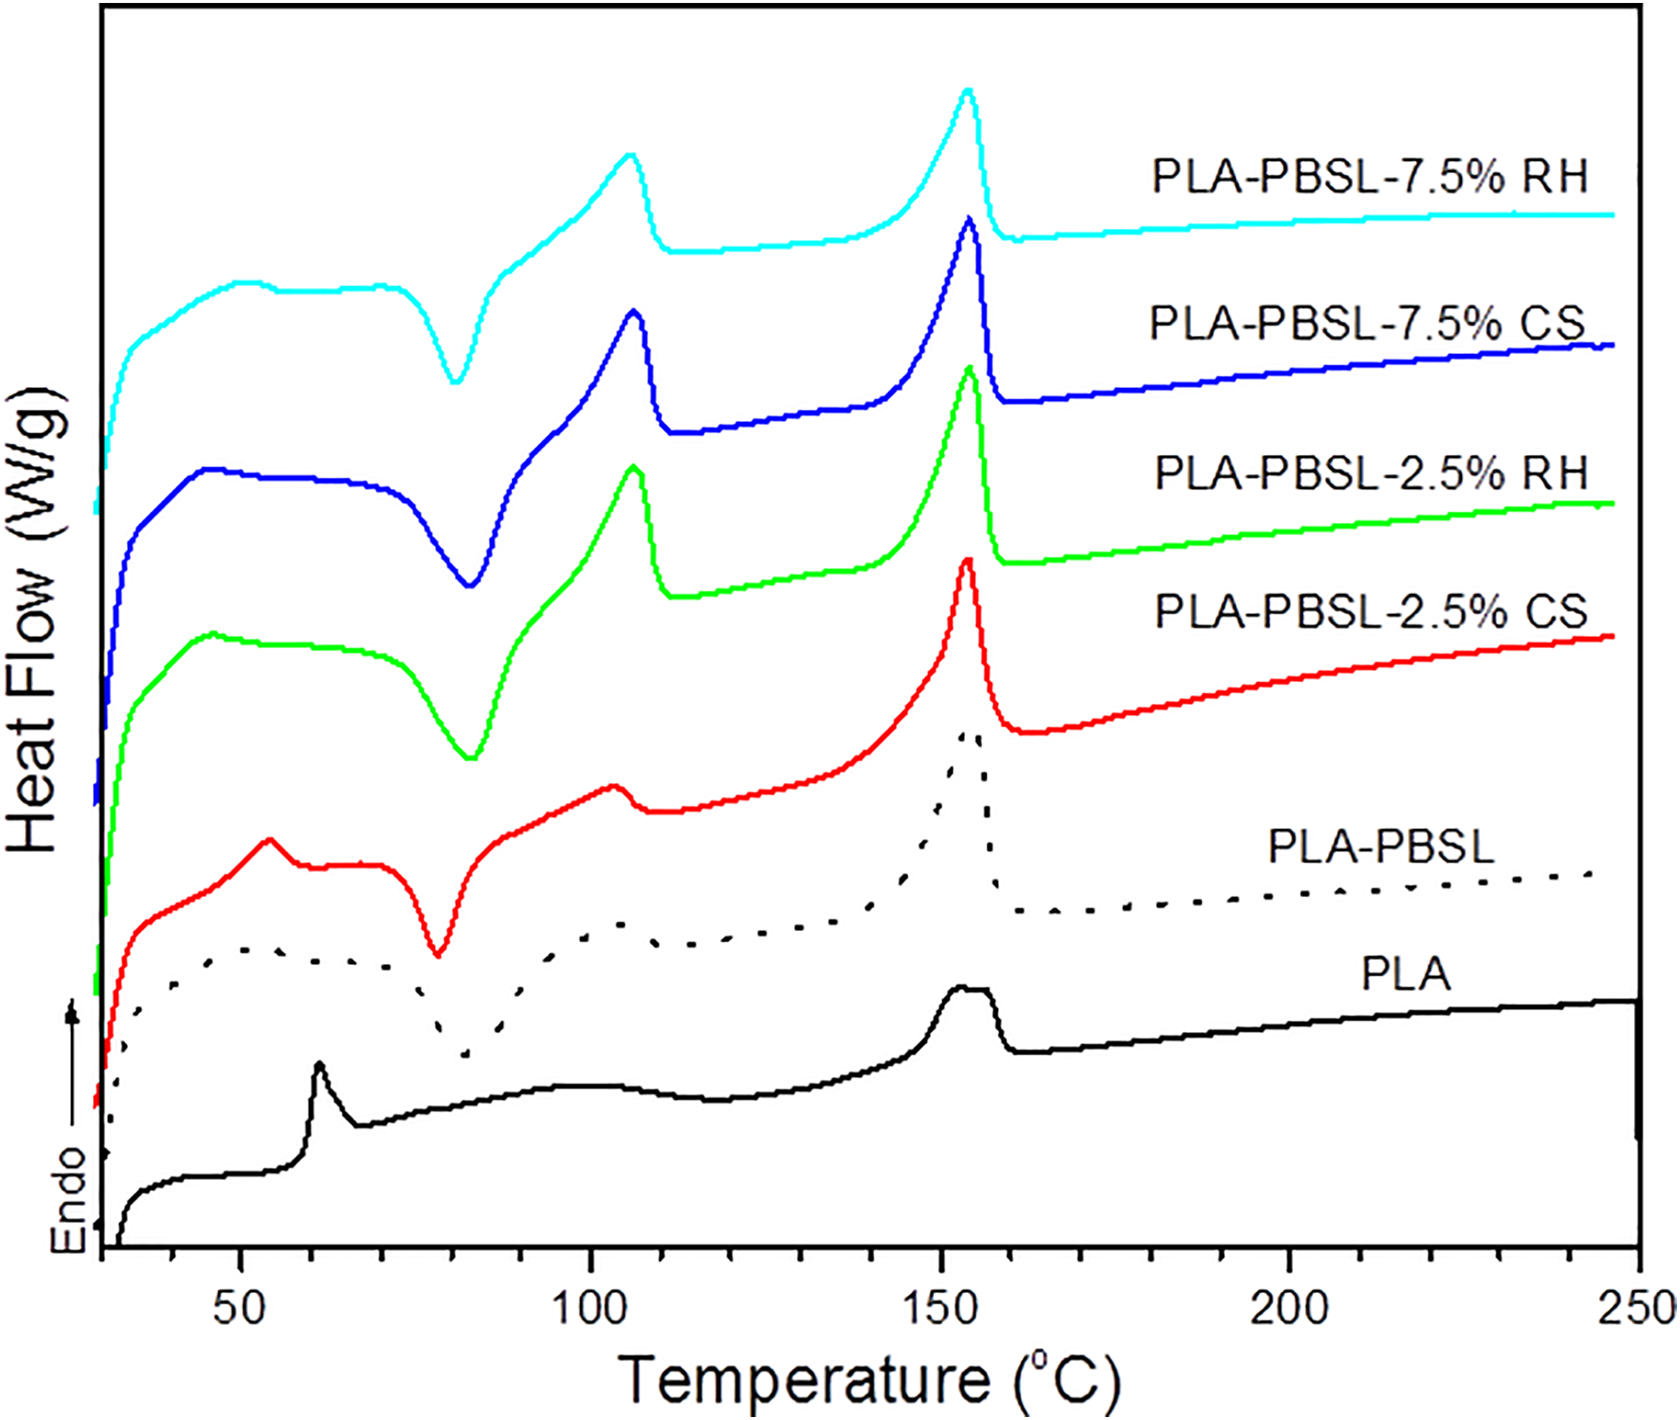
DSC heating thermograms of neat PLA, PLA-PBSL blend, and reinforced PLA-PBSL blends containing the lowest and optimum wt% content of CS and RH fillers.
However, by comparing the CS and RH fillers, it can be seen that crystallization is faster in CS reinforced blends and this might have contributed to the higher mechanical strength of CS reinforced blends compared to RH reinforced blends as presented in the mechanical properties section. The resultant effect of the lower Tc of the blends can be seen in the right shift of the endothermic Tm peak of PLA and PBSL in the blends. Usually, when cold crystallization takes place, it often results in the formation of less perfect crystals which would normally melt at higher temperature compared to more perfect ones. 33 Therefore, the right shift in Tm of PLA in the PLA-PBSL blend, and the further shift following the incorporation of fillers are indications of heterogeneous crystallizations which was further investigated through the crystallinity index and presented in Table 4. The increased crystallinity of the reinforced blends suggests the presence of more crystallites in the blends. The crystallization activities in the blends at the optimum wt% filler loading (7.5 wt%) was further investigated through XRD analysis as discussed in the following section.
XRD properties
The XRD patterns of PLA, PLA-PBSL blend and PLA-PBSL blend containing 7.5 wt% filler is illustrated in Figure 7. As can be seen in the figure, neat PLA exhibits a broad and diffused diffraction peak, which indicates that the PLA chains are not well ordered, suggesting low crystallinity and high amorphous content.31,34 In contrast, the blends reveals additional peaks, howbeit small at Bragg angles of 20°, 22.5°, and 29° which corresponds to (0 2 0), (1 1 0) and (1 1 1) monoclinic crystal cell units of PBSL. 35 Incorporation of filler can be seen to increase the intensity of the peaks, which is more pronounced in the CS reinforced blend compared with the RH. However, it is noteworthy that increased intensity of the peaks is more pronounced in the CS reinforced blend compared to RH. This suggests that CS presents higher heterogeneous nucleating effect on the blend compared to RH. Notably, this conforms to the results of DSC analysis and this observation aligns with what was previously reported in a similar study on CNC reinforced PLA/PBS blend. 34 The higher nucleation activity of the CS filler might have contributed to the higher mechanical properties of CS reinforced blends compared with RH reinforced blends, perhaps due to increased stiffness and crystallinity of the blend. This is equally evident in the higher crystallinity index of the CS reinforced blend as presented in Table 4.
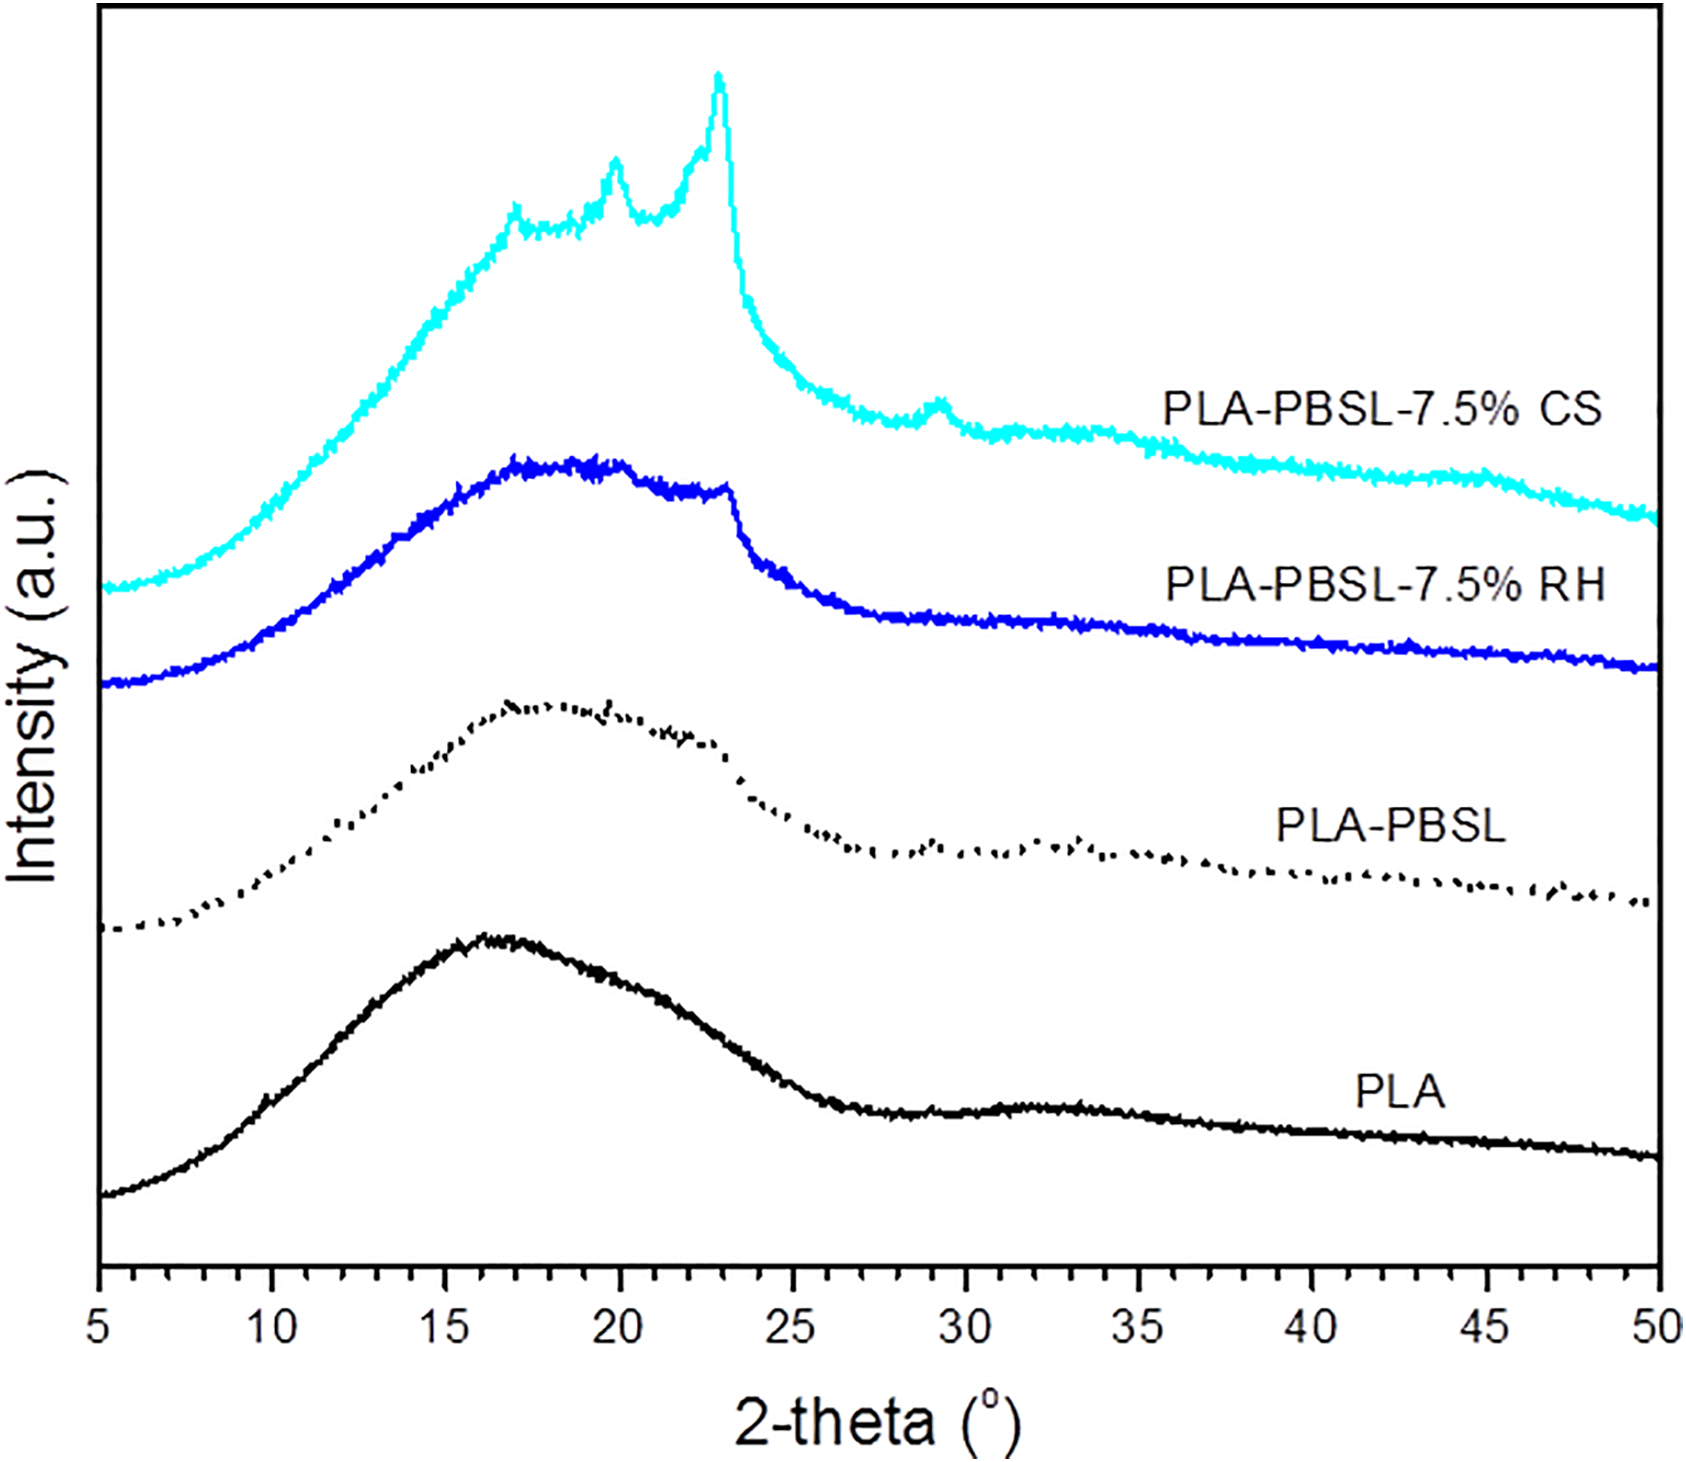
XRD curves of neat PLA, PLA-PBSL blend, and reinforced PLA-PBSL blends containing 7.5 wt% CS and RH fillers.
Water absorption properties
The water uptake curves of the samples are illustrated in Figure 8. As can be seen in the figure, there is a linear increase in the water absorption of the samples as the soaking time increased, with an initial rapid absorption at the early stages of the soaking period. Generally, water uptake in natural fiber reinforced blends depends on several factors such as nature and amount of filler, exposure of filler on blend surface, void content, and interfacial interactions between the filler and blend matrices. 36 Obviously, all the samples followed the Fickian diffusion process wherein there is an initial rapid uptake which reached a plateau before beginning to decrease with further increase in soaking period, indicating saturation. Similar observation was also reported for natural fiber reinforced composites in previous studies.37,38

Variation of water absorption with soaking period of PLA, PLA-PBSL blend, and reinforced PLA-PBSL blends containing the lowest and optimum wt% content of CS and RH fillers.
Notably, all the blends absorbed more water compared to neat PLA and the increase in water absorption is higher in the reinforced blends which can be accrued to the water uptake properties of natural fibers. 39 Specifically, natural fibers exhibit high hydrophilic tendencies due to the abundant hydroxyl groups in their structure. These hydroxyl groups make it easier for them to interact with water molecules. The hydrophilic nature of the reinforcing fillers will invariably facilitate the affinity of the reinforced blends for moisture and this is believed to be responsible for the higher water absorption of the blends containing 7.5 wt% filler compared to those with 2.5 wt% filler loading. Notwithstanding, it should be emphasized that the water absorption test was performed at conditions that may be considered a bit extreme. Specifically, the samples were immersed in water without providing any protection for their surface. As such this is not an accurate representation of the actual applications of these materials. Therefore, the higher water absorption of the reinforced blends compared to neat PLA or the unreinforced PLA-PBSL blend does not indicate a significant limitation to their application.
However, by comparing the CS and RH reinforced blends, it is evident that at same filler loading, RH tends to absorb larger amounts of water compared to CS. Specifically, the CS and RH reinforced blends absorbed about 1.4% and 2.1% of moisture respectively, at 2.5 wt% filler loading. Similarly, the maximum water absorption for the two fillers is 3.5% and 5% for CS, and RH reinforced blends respectively at 7.5 wt% filler loading. This indicates faster rate of water diffusion into the RH reinforced blend. As stated, factors such as nature and amount of filler, exposure of filler on blend surface, void content and interfacial interactions between the filler and blend matrices can influence the water absorption properties of natural fiber reinforced blends. Specifically, poor interfacial interaction can trigger undesirable agglomeration within the blend, as well as resulting in the exposure of large amount of filler on the blend surface. These could then lead to excessive ingress of water into the blend. Notably, agglomeration and poor interfacial interactions will affect the mechanical properties of the blend. Therefore, this could be the reason for the lower mechanical properties of RH reinforced blends compared to CS reinforced blend as discussed under the mechanical properties section. This might also be responsible for the reduced nucleation activities within the RH reinforced blends as evident through the DSC and XRD results.
Conclusion
Polymer blend containing poly(lactic acid) (PLA) and poly(butylene succinate-co-L-lactate) (PBSL) was prepared via two-roll mill compounding followed by compression moulding. Two types of reinforcing fillers such as coconut shell (CS) and rice husk (RH) were incorporated into the PLA-PBSL blend in order to comparatively investigate the effects of filler amount and type, on properties of the blend. It was generally observed that at the same filler loading, CS reinforced blends present more desirable properties compared to RH reinforced blend. Specifically, the tensile strength of CS reinforced blend was improved by about 195% compared to RH reinforced blend (145%) due to better interaction between CS and the blend polymers as revealed through SEM. Likewise, the CS blend has a crystallinity index (XDSC) of 72% compared to 65% of the RH blend which was supported by result from the X-ray diffraction analysis which was attributed to higher nucleation activities in the CS blends compared with the RH blends. On the other hand, the RH reinforced blends tend to absorb more water compared to CS reinforced blend as evident through water absorption analysis which was accrued to higher ingress of water through diffusion into the RH blend. However, thermogravimetric analysis revealed that RH reinforced blends are slightly more thermally stable compared to CS reinforced blends. On the overall, the two fillers can desirably enhance the performance of PLA/PBSL blends especially, to produce environmentally friendly products. However, if a decision needs to be made, it is suggested that CS should be considered over RH especially where better mechanical strength, improved crystallization and low water absorption are desired.
Footnotes
Acknowledgments
The authors would like to thank the Ministry of Education Malaysia for the financial support through Fundamental Research Grant Scheme (FRGS MRSA; Grant no. 6071385). The authors also appreciate the support from Universiti Sains Malaysia (USM) and the School of Materials & Mineral Resources Engineering, USM, for providing post-doctoral fellowship to two of the authors.
Declaration of conflicting interests
The author(s) declared no potential conflicts of interest with respect to the research, authorship, and/or publication of this article.
Funding
The authors disclosed receipt of the following financial support for the research, authorship, and/or publication of this article: Ministry of Education, Malaysia [Fundamental Research Grant Scheme (FRGS MRSA; Grant no. 6071385)], and Universiti Sains Malaysia (Post-doctoral scholarship to two of the authors).