
Abstract
A new filler for polyethylene terephthalate (PET) was synthesized by doping carbon black (CB) with nanosilver. Images taken from energy-dispersive X-ray spectrometry and X-ray diffraction validated the synthesis of the filler (nanosilver-doped CB (CB-Ag)). We evaluated the effect of CB-Ag on the mechanical, thermal, and antibacterial properties of the nanocomposites (CB-Ag/PET). Thermogravimetric analyses, morphology, and tensile tests indicated that thermodegradation, crystallization rate, and tensile strength were all improved as a result of filling PET with CB-Ag. Excellent antibacterial properties were imparted to PET nanocomposites, which would be useful for a wide array of industrial applications.
Keywords
Introduction
Polymers consist of huge molecules. They are encountered in nature or are produced by modern technology. 1 Polymers find wide applications in many areas such as textiles, 2 -6 biodegradable materials, 5 -10 food packaging, 11 renewable materials, 12 medical products, 13 -18 and energy materials. 19,20 One of the most common polymers is polyethylene terephthalate (PET). PET can be used to make plastic bottles 21 and fabrics. 22
To modify polymers, additives or fillers are often added. 23 -25 Carbon black (CB) is widely used as fillers in conductive polymers employed as packaging for electronic components or electromagnets. CB is also applied as conductive radar absorbent materials, as it exhibits a high surface area. The electrical conductivity of CB is also important in fuel cell electrodes. 26 Natural and synthetic fabrics were directly dyed with a surface-modified CB. This technique had opened new applications of nanotechnology in textile production. 27
A lot of research has been conducted on PET with fillers. PET was filled with different amounts of CB (2.5–25 phr). The modified PET was examined in terms of its dielectric permittivity, dielectric loss, and conductivity. 28 PET was also mixed with asphalt cement to improve its rheological properties and binder stiffness at high temperatures. 29 PET and CB were blended together by using a twin-screw extruder. The resulting CB/PET composites could function as strain sensors for civil engineering. 29 Incorporating PET with nano-CB and nano-TiO2 produced nanocomposites with heightened electrical conductivity and photocatalytic activity. 30 Dispersing agents, such as dimethyl terephthalate, dimethyl isophthalate, and 1,4-butandiol, stimulated the dispersion of CB and, in turn, facilitated the blending of CB with PET. The results indicated that the mechanical properties of CB/PET composites were strengthened as a result of adding CB to PET in the presence of dispersing agents. 31
CB has been generally used as fillers in polymers applied as conductive and reinforced materials. 32,33 However, CB has no antibacterial property beneficial for preventing antibacterial infections. Accordingly, we synthesized a new filler in the form of CB doped with nanosilver, which would simultaneously reinforce the tensile properties of PET and impart antibacterial properties to PET. Our present study is the first to report on filling PET with nanosilver-doped CB (or CB-Ag) to fabricate nanocomposites with extensive applications.
Experimental
Preparation of nanocomposites
PET (Far Eastern New Century Co., Ltd, Taipei, Taiwan) was dried in a vacuum oven at 160°C for 9 h to remove residual water. CB (Apex Nanotek Co., Ltd, Taipei, Taiwan) ranged in particle size from 3 µm to 5 μm. A similar method 9 was adopted to dope CB with nanosilver. PET was melt-blended with varying amounts of CB-Ag (0.25–0.75 wt%) in a twin-screw extruder at 265°C. Subsequently, the nanocomposites were hot-pressed at 270°C and 12 MPa for 2 min, and then cooled at room temperature. Table 1 presents the composition of CB-Ag/PET nanocomposites.
Composition of CB-Ag/PET nanocomposites.

PET: polyethylene terephthalate; CB-Ag: nanosilver-doped carbon black.
Energy-dispersive X-ray spectroscopy
PET and CB-Ag/PET nanocomposites were analyzed in terms of their elemental composition by using energy-dispersive X-ray (EDX) spectroscopy (7021-H HORIBA, Kyoto, Japan). Samples were first sputtered with gold dust before placing them in the spectroscope. Then, measurements were conducted, with the EDX spectroscope operated at 15 kV.
Scanning electron microscopy
The morphology of fractured samples (those subjected to tensile strength tests) was observed using scanning electron microscopy (SEM; JSM-6390, JEOL, Japan). Prior to SEM examination, samples were coated with a thin layer of platinum. Micrographs were taken at 29 kV.
Tensile testing
The tensile properties of hot-pressed samples at 25°C were determined using a Shimadzu tensile testing machine (Kyoto, Japan) with a speed of 50 mm min−1. ASTM D638 Type IV standards 34 -36 were applied. Samples were in the shape of a dog bone. First, a sample was clamped to the upper and lower grips of the machine. Then, the height of the grips was adjusted to ensure that the sample was straight and without folds. Finally, the machine was operated to determine the sample tensile strength and elongation at break. At least five samples were measured, and the data were averaged.
Thermogravimetric analysis
Samples were examined through thermogravimetric analysis (TGA; model Pyris 1, PerkinElmer, Buckinghamshire, UK). The weights of PET and CB-Ag/PET nanocomposites were 8–10 mg. They were heated from 35°C to 600°C under nitrogen at a heating rate of 10°C min−1.
Differential scanning calorimetry
The sample crystallization characteristics were evaluated through differential scanning calorimetry (DSC; model Jade, PerkinElmer). Samples were placed in aluminum pans, and they were scanned under nitrogen purging in the temperature range of 280–85°C at a cooling rate of 10°C min−1.
Antibacterial tests
The antibacterial properties of PET, CB/PET composites, and CB-Ag/PET nanocomposites were evaluated against two strains of bacteria: Staphylococcus aureus and Escherichia coli. The minimum inhibitory concentration (MIC) of CB-Ag was determined in accordance to the microdilution method CLSI M27-A2 (standard of American clinical laboratory). 37 A quantitative test required that each sample was inoculated with a cell suspension (0.1 mL) at 30°C for 24 h. The suspension of bacteria was diluted with a sterile physiological saline solution and inoculated onto a sterile Petri plate, which was subsequently incubated at 30°C for 24 h. Ultimately, grown colonies were counted on pure PET and on nanocomposites of PET filled with CB or CB-Ag, and the number of bacteria was compared with a control.
Results and discussion
Elemental composition
Figure 1 shows the EDX images of the polymer (PET), filler (CB-Ag), and nanocomposites (CB-Ag/PET), along with the corresponding elemental composition. Figure 1(a) indicates that the filler contained 99.52 wt% C and 0.48 wt% Ag; in other words, the mass ratio of C to Ag was roughly 200:1. Figure 1(b) provides the elemental composition of neat PET; the EDX image showed no trace of Ag signal (which was expected). Figure 1(c) to (e) depicts the EDX images of different nanocomposites of PET with CB-Ag, depending on the amounts of the filler (0.25–0.75 wt% CB-Ag). With increasing amounts of the filler, the Ag content also increased, as described by the elemental compositions. More Ag would lead to a more effective prevention of bacterial adhesion.

EDX images: (a) CB-Ag, (b) PET, (c) 0.25 CB-Ag/PET, (d) 0.50 CB-Ag/PET, and (e) 0.75 CB-Ag/PET.
Crystalline structure
Figure 2 presents the X-ray diffraction (XRD) patterns of neat CB and CB-Ag. Both CB and CB-Ag exhibited two diffraction peaks, one at 2θ = 23.5 (002) and the other at 2θ = 44 (100). These peaks referred to the carbon crystal surfaces. 38 An imperceptible peak was located at 2θ = 38, which should denote the crystal form of Ag. 39 The intensity of the peak was diminutive, as the nanosilver content was extremely small (mass ratio of C to Ag = 200:1).

XRD patterns: (a) neat CB and (b) CB-Ag.
Mechanical properties
The effects of CB with and without Ag on the mechanical properties of PET nanocomposites were determined. Figure 3 compares and contrasts the tensile strength and elongation at break of pure PET, CB/PET composites, and CB-Ag/PET nanocomposites. Relative to neat PET, PET filled with CB or CB-Ag exemplified greater tensile strength. Fillers with a high surface area (such as CB and CB-Ag) would participate in a strong interfacial interaction with the polymer matrix. 40 Accordingly, the tensile strength was reinforced when PET was filled with CB or CB-Ag, especially at 0.50 wt% CB or CB-Ag. This increased mechanical strength signified that modified PET could withstand higher stress. Although introducing rigid CB and CB-Ag fillers lowered the elongation at break, the decrease was only 2.3% relative to neat PET at 0.50 wt% fillers, which should still be within the standard limit of nanocomposites. However, the presence of 0.75 wt% fillers reduced both the tensile strength and elongation at break. Notably, the elongation at break dropped to nearly 50% when 0.75 wt% CB or CB-Ag filler was incorporated. At this high filler content, particles would have aggregated in the nanocomposite material, thereby contributing to weaker interactions at the interface between PET and the filler (CB or CB-Ag). Therefore, for considerations of mechanical properties, the content of CB or CB-Ag filler should be 0.50 wt%, which could be considered optimum. There was no considerable difference in the effect of CB and CB-Ag fillers on the mechanical properties of filled PET, as only a very small amount of Ag was added (primarily to impart antibacterial properties).

(a) Tensile strength and (b) elongation at break of neat PET, CB/PET composites, and CB-Ag/PET nanocomposites.
Morphology
Figure 4 shows the morphology of tensile-fractured sections of PET and CB-Ag/PET nanocomposites. Figure 4(a) describes that the surface of pure PET was fairly smooth. Filling PET with 0.25 and 0.50 wt% CB-Ag resulted in a surface morphology illustrating cascades of ripples (Figure 4(b) and (c)). At a greater amount of the filler at 0.75 wt%, however, the surface turned out rough, characterized by many protrusions. This coarse surface morphology can be attributed to the agglomeration of CB-Ag in the PET matrix, causing stress concentration because of excessive fillers. 11,41 Such strained conditions would worsen with the addition of more fillers, and, in turn, would lead to reductions in tensile strength (Figure 3(a)).

SEM images: (a) PET, (b) 0.25 CB-Ag/PET, (c) 0.50 CB-Ag/PET, and (d) 0.75 CB-Ag/PET.
Thermal stability
Table 2 presents the thermal stability of PET and CB-Ag/PET nanocomposites. Adding fillers (CB-Ag) strengthened the PET thermal stability. The degradation temperature (Td) at 5 and 10 wt% losses demonstrated that the thermal stability increased when PET was filled with increasing amounts of CB-Ag (0.25 and 0.50 wt%). Nevertheless, the introduction of a higher amount of filler at 0.75% CB-Ag effected no noticeable improvement in the thermal stability anymore, suggesting heterogeneity in the nanocomposite material, which was probably caused by the poor dispersion of a large amount of filler in the polymer matrix. Therefore, 0.50 wt% CB-Ag yielded optimum thermal properties (similar to the conclusion drawn from the aforementioned discussion on optimum tensile properties). Many studies reported that CB could improve the thermal stability of polymers, 42,43 and that incorporating too much amount of fillers would likely reduce Td. 41,44,45 The increasing trend in the data of char residue as more fillers were added signified the growing weight of refuse or noncombustible CB that remained after combustion.
Thermogravimetric data of PET and CB-Ag/PET nanocomposites.

Td: degradation temperature; PET: polyethylene terephthalate; CB-Ag: nanosilver-doped carbon black.
Crystallization data
Figure 5 plots the DSC curves for PET and CB-Ag/PET nanocomposites, wherein crystallization temperature peaks emerged. Pure PET exhibited the lowest crystallization temperature. Mixing PET with different amounts of CB-Ag would render the crystallization temperature of the resulting nanocomposites higher by about 50°C relative to the crystallization temperature of PET. The nanocomposite with 0.50 wt% CB-Ag revealed the highest crystallization temperature. Concentrations higher than 0.50 wt% CB disrupted the homogeneous dispersion of the fillers in PET. 46,47 Such homogeneity was responsible for increasing the PET crystallization temperature. The filler dispersed poorly in PET when the concentration of CB-Ag became much higher at 0.75 wt%. As such, the nanocomposite crystallization temperature decreased.

DSC curves for PET and CB-Ag/PET nanocomposites at 10°C min−1 cooling rate.
Table 3 summarizes the melting temperatures (Tm1 and Tm2) and crystallinity (Xc) of PET and CB-Ag/PET nanocomposites. Pure PET gave only one melting point (244.1°C). For PET filled with CB-Ag, however, two melting points appeared in the DSC curve. Partial melting and crystallization during the process of heating 48 may be responsible for the occurrence of Tm1 and Tm2 in the case of CB-Ag/PET nanocomposites. Pure PET crystallized at a slow rate; however, the presence of CB-Ag in PET nanocomposites hastened the crystallization rate. In the process of heating PET nanocomposites, crystals with an incomplete structure would melt first, but because of the added CB-Ag, part of PET crystallized out at a faster rate, and this initial crystallization would contribute to the completion of crystal structures. CB-Ag promoted the formation of crystal nuclei and enhanced the crystal density. The crystallinity was the highest at 0.50 wt% CB-Ag. Nevertheless, the agglomeration of CB-Ag dominated when the CB-Ag content reached 0.75 wt%, resulting in the reduction of crystal nuclei and in the appearance of crystal defects.
DSC data of PET and CB-Ag/PET nanocomposites.

DSC: differential scanning calorimetry; PET: polyethylene terephthalate; CB-Ag: nanosilver-doped carbon black; Tm1: first melting point; Tm2: second melting point; Xc: crystallinity.
Antibacterial properties
Table 4 indicates that the MIC of CB-Ag for S. aureus and E. coli was 350 and 200 µg mL−1, respectively. Figure 6 shows graphs of the antibacterial action of PET, CB/PET composites, and CB-Ag/PET nanocomposites, in reference to a control, against gram-positive S. aureus and gram-negative E. coli, whereas Table 5 tabulates the data on the antibacterial action of PET with and without nanosilver. CB/PET composites exhibited no antibacterial activity, as micro-sized CB has no antibacterial properties (though carbon nanostructures are certainly antibacterial). However, when the micro-sized CB was doped with nanosilver and used as a filler in PET, the resultant nanocomposite had the capacity to lessen the number of viable bacteria present in the samples. With the control as a reference, the nanocomposite materials with 0.25, 0.50, and 0.75 wt% CB-Ag reduced bacterial growth (for S. aureus or E. coli) by approximately 56%, 70%, and 82%, respectively. Therefore, CB-Ag/PET nanocomposites were demonstrated to be effective antibacterial agents, particularly at the highest content of CB-Ag. Greater amounts of Ag present in PET must be responsible for the higher efficiency of bacterial growth prevention.

Antibacterial action of PET, CB/PET composites, and CB-Ag/PET nanocomposites, in reference to a control, against (a) Staphylococcus aureus and (b) Escherichia coli.
MIC of CB-Ag for Staphylococcus aureus and Escherichia coli.
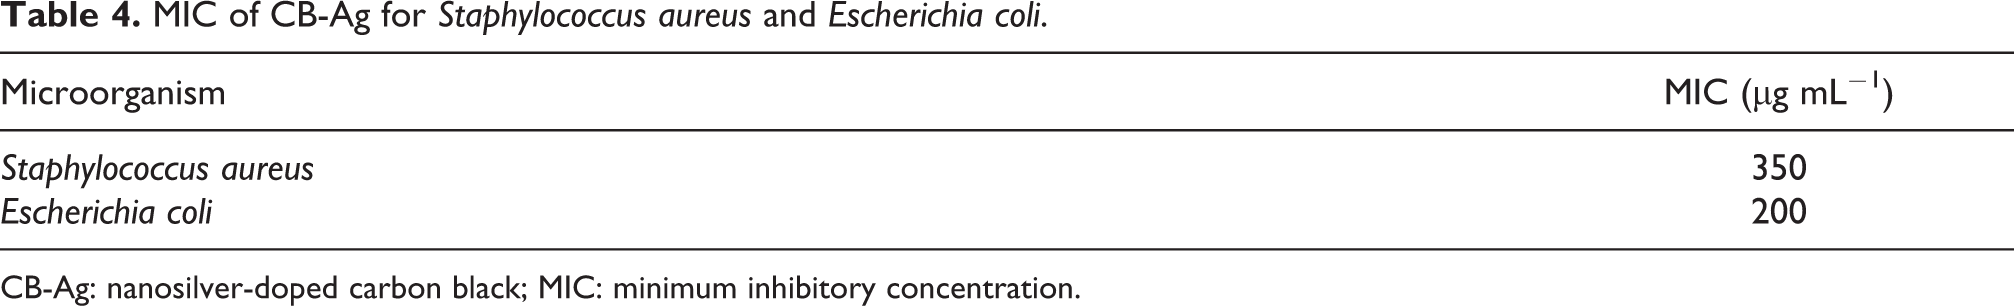
CB-Ag: nanosilver-doped carbon black; MIC: minimum inhibitory concentration.
Data on antibacterial action of control, PET, CB/PET composites, and CB-Ag/PET nanocomposites against Staphylococcus aureus and Escherichia coli.
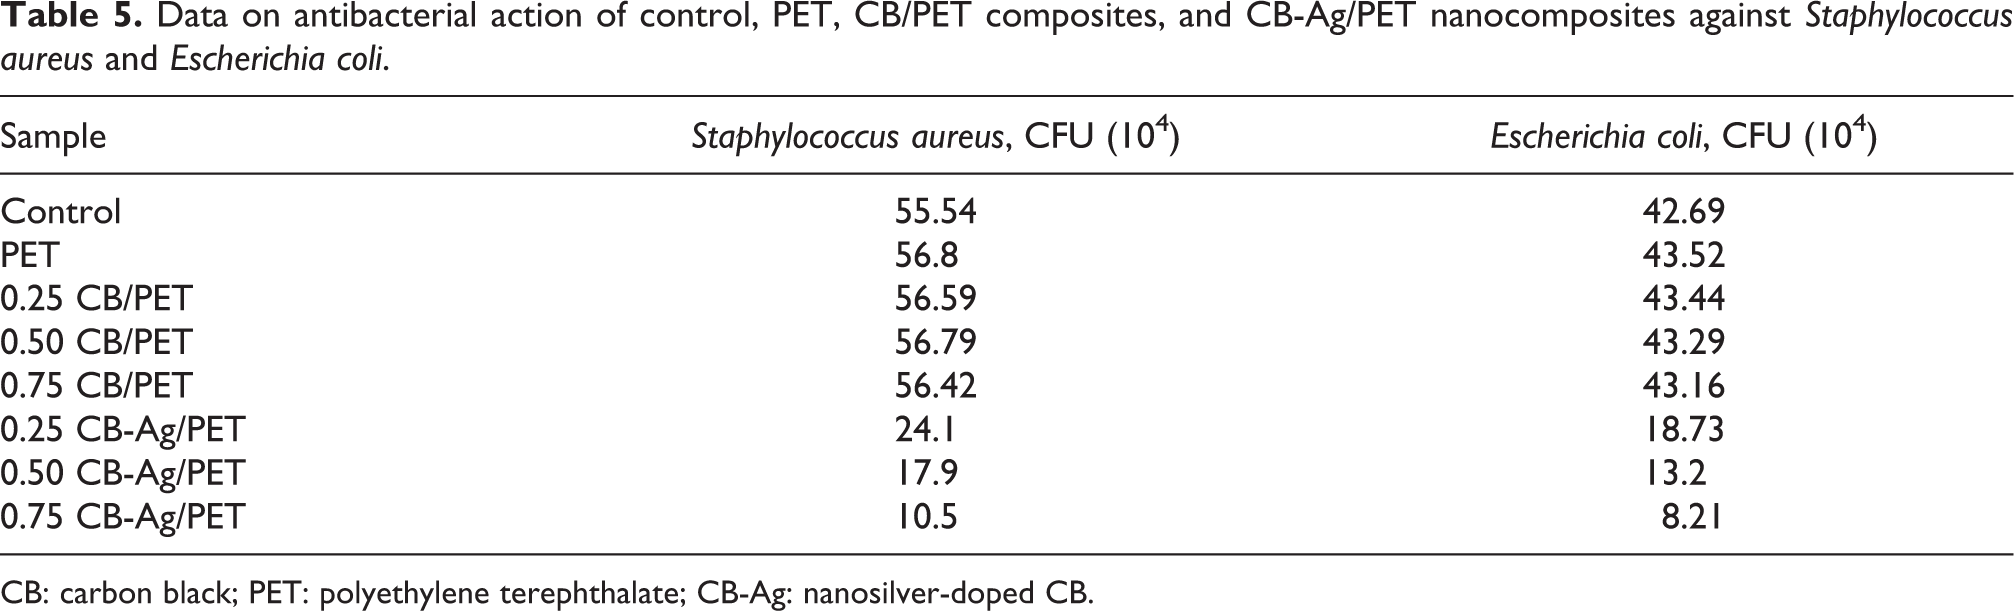
CB: carbon black; PET: polyethylene terephthalate; CB-Ag: nanosilver-doped CB.
Conclusions
CB-Ag fillers were synthesized by following a similar method described in our previous study. EDX and XRD validated that Ag nanoparticles were attached onto CB. The results of tensile tests, SEM, TGA, and DSC indicated that the optimum content of CB-Ag that should be added to PET was 0.50 wt%. The resulting nanocomposites would have potential applications in different fields because of their excellent antibacterial properties.
Footnotes
Acknowledgements
The authors would like to acknowledge the financial support from the following organizations: Wuliangye Group Co., Ltd; Sichuan Province Science and Technology Support Program; Zigong City Science and Technology; Opening Project of Material Corrosion and Protection Key Laboratory of Sichuan Province; and Opening Project of Sichuan Province, the Foundation of Introduced Talent of Sichuan University of Science and Engineering. Appreciation is also extended to Sichuan Golden-Elephant Sincerity Chemical Co., Ltd; Apex Nanotek Co., Ltd; and Ratchadapisek Sompote Fund for Postdoctoral Fellowship (Chulalongkorn University).
Author contributions
MRDG and YHW contributed equally to this work.
Declaration of conflicting interests
The author(s) declared no potential conflicts of interest with respect to the research, authorship, and/or publication of this article.
Funding
The author(s) disclosed receipt of the following financial support for the research, authorship, and/or publication of this article: This work was financially supported by Wuliangye Group Co., Ltd (CXY2019ZR001); Sichuan Province Science and Technology Support Program (2019JDRC0029); Zigong City Science and Technology (2017XC16 and 2019CXRC01); Opening Project of Material Corrosion and Protection Key Laboratory of Sichuan Province (2019CL05, 2018CL08, and 2018CL07); and Opening Project of Sichuan Province, the Foundation of Introduced Talent of Sichuan University of Science and Engineering (2017RCL31, 2017RCL36, 2017RCL16, 2019RC05, and 2019RC07).