
Abstract
The influence of spherical (titanium dioxide (TiO2)) and platelet-like (Closite20A) nanofillers on the physical properties of polyethylene terephthalate (PET) nanocomposites was investigated. PET nanocomposites were prepared by melt blending of PET and nanofillers. Differential scanning calorimetry showed that PET nanocomposites had higher crystallinity than the neat PET, possibly due to the nucleating role of the nanoparticles. It was observed that the influence of nanoclays on crystallization of PET is more considerable than TiO2 nanoparticles. For PET/TiO2 and PET/clay nanocomposites, the highest value of crystallinity observed at 3 wt% and 1 wt% loading level of TiO2 and Closite20Ananoparticles, respectively. Scanning electron microscopic micrographs showed that uniform distribution and good dispersion of TiO2 through PET matrix were achieved at 1 and 3 wt% loadings but at higher loadings up to 5 wt%, nanoparticles tend to accumulate. Transmission electron microscopy and wide angle X-ray diffraction showed that the dominant structure of PET nanocomposites containing 1 wt% nanoclays was exfoliation while at higher loading levels, the shift in peak to lower angles and subsequent increase in platelet spacing suggest intercalated structure. The addition of TiO2 nanoparticles caused noticeable enhancement of PET ductility, while the incorporation of nanoclays into PET matrix developed a fragile structure with lower ductility.
Introduction
Nowadays polymers reinforced by micrometer fillers are being used to obtain higher strength and stiffness, to improve solvent or fire resistance, or simply to reduce cost. However, the incorporation of these micro-sized fillers has some drawbacks such as brittleness and opacity. Nanocomposites, for which at least one dimension of the filler is in the nanometer range, give an approach to overcome the limitations of traditional fillers. 1 Besides, the mentioned property improvements in nanocomposites are achieved at very low loadings of the nanoscale inorganic component (<5 wt%), while traditional microcomposites usually require much higher loadings (25–40 wt%). 2 It is well known that the structure, shape, size, concentration, specific surface area, concentration and adequate dispersion of nanoparticles impress the final properties of the nanocomposite. 3 In terms of shape and size, the nanoparticles used for polymer reinforcement can be classified into three groups: (1) nanoparticles with one dimension in the nanometer range, such as platelet-like-shaped montmorillonite (one to a few nanometers thick and hundreds to thousands nanometers long), (2) nanoparticles with two dimensions on the nanometer scale (i.e. elongated structures such as carbon nanotubes or cellulose whiskers), (3) nanoparticles with three dimensions in the nanometer scale (i.e. spherical silica and titanium dioxide (TiO2)). 4 In recent years, polymer/layered silicate nanocomposites have attracted wonderful interest, both in industry and in academia, because they often present noticeable improvement in material properties when compared with virgin polymer or conventional micro- and macrocomposites. 3 These improvements can include high moduli, increased heat resistance, decreased gas permeability and flammability and increased biodegradability. 5 –11 On the other hand, TiO2 nanopowder is increasingly being investigated because of its nontoxic, chemically inert, broadband ultraviolet filter, antibacteria by photoirradiation effect, and corrosion resistant; and it has high hardness, high refractive index and low cost. 12 There are also some research on improvement of crystallization and viscoelastic behavior of polyethylene terephthalate (PET) by incorporation of nanosized TiO2 particles. 4,13,14 Melt compounding and in situ polymerization are the main techniques employed to produce PET nanocomposites. Melt compounding is the preferred method for preparation of polymer nanocomposites, resulting in environmental and cost advantages, due to the absence of solvents and monomers. 15,16 In this study, PET/clay and PET/TiO2 nanocomposites were prepared by melt blending of PET and fillers and the different loading levels of nanoparticles on the physical and mechanical properties of PET have been investigated and eventually compared with each other.
Experimental
Materials
Pure PET (blow molding grade) with intrinsic viscosity of 0.82 dL/g was provided by Tondgooyan Petrochemical Company (Iran). Anatase TiO2 and Closite20A nanoparticles were supplied by Nanoshel LLC (USA) and Southern Clay Co. (USA), respectively. The prepared nanocomposites coded as below:

Preparation of PET nanocomposites
PET nanocomposites containing 1, 3 and 5 wt% of nanoparticles were prepared via melt blending in a lab-scale counterrotating twin-screw extruder (Collin ESC-T10 model) with a screw diameter of 50 mm and L/D ratio of 15. The extruder has five heater zones and a die zone set at 250, 270, 275, 270, 265, and 265°C and operated at a screw speed of 90 rpm. The components of nanocomposite were dried in an oven at 170°C for 5 h before extrusion process. The prepared profiles were water cooled and then milled in conventional milling equipment. Neat PET sample as reference material was prepared in the same procedure.
Differential scanning calorimetry analysis
The melting and crystallization characteristics of PET in the prepared samples were studied by differential scanning calorimeter (DSC 200 F3 Maia® NETZSCH, Germany). The melting behavior of nanocomposite samples was determined using heating and cooling tests between 25 and 270°C at a rate of ±10°C/min. The first heating run was used to erase the thermal history, and all reported data on melting characteristics of the prepared samples were obtained from the second heating curve of the DSC thermograms. The degree of crystallinity (Xc
) of PET in the nanocomposites and the neat polymer specimens were calculated using the following equation
where ΔHm 0 is the melting enthalpy of 100% crystalline PET (ΔHm 0 = 105.97 J/g 17 ) and ΔHm is the melting enthalpy of the samples.
X-ray diffraction (XRD)
The XRD patterns were recorded in an X-ray diffractometer (Simens D5000-Germany) at room temperature, using Cu Kα tube radiation with the wavelength of 1.5409oA, generated at 30 kV and 30 mA. The samples were scanned with a step size of 0.04o in the range of 2θ = 2–12° and 2–80° for PET/clay and PET/TiO2 nanocomposites, respectively. The angular and layer spacing values of Closite20A powder and PET/clay nanocomposites calculated through Bragg’s law:

where d is the spacing between diffraction lattice planes and θ is the measured diffraction angle.
Transmission electron microscopy (TEM)
Ultrathin sections (70–100 nm) of the nanocomposites were obtained with a Leica UltraCut-UCT microtome (Leica, Deerfield, IL) equipped with a diamond knife. The morphology of PET/clay nanocomposites was studied by transmission electron microscopy (TEM, Philips-EM208S electron).
Scanning electron microscopy
The bulk morphology of the PET/TiO2 samples was investigated using field emission scanning electron microscopy (Hitachi S-4160) under an acceleration voltage of 15 kV. The specimens were fractured in liquid nitrogen and the cross surface of samples were coated by gold via sputtering process.
Tensile testing
Engineering stress–strain curves were prepared from uniaxial tension tests (following ASTM D638 18 ) on injection molded dumbbell-like specimens using a Galdabini Sun2500 tensile tester (Galdabini, Italy). The tensile tests were carried out at a crosshead speed of 5 mm/min. At least five specimens for each sample were tested. The mechanical characteristics of the sample consisting of stress at break, strain at break, elastic modulus, and dissipated energy were determined from the test.
Results and discussion
Morphology
Wide-angle XRD (WAXD) measurements were done on pure nanoparticles, neat PET and PET nanocomposites to investigate intercalation/exfoliation morphology of PET/clay nanocomposites as well as the influence of TiO2 nanoparticles on the crystalline structure of PET. Figure 1 shows the WAXD pattern of PET/clay nanocomposites. Closite20A powder shows a peak at approximately 2θ = 4.84 (d = 1.83 nm), corresponding to the basal interlayer spacing of the clay. The d spacing of nanoclays and nanocomposite sheets were determined by means of Bragg’s equation (Table 2). An efficient interaction between nanoclay and polymer matrix allowing the polymer chains insert within the interlayer of the montmorillonite structure leading to intercalated/exfoliated structures. The obviously larger interlayer distance of nanoclays in PET nanocomposites demonstrates the efficiency of filling. A shift to lower angles of the characteristic diffraction peak in PET3%NC and PET5%NC suggests an increase in interlayer spacing or gallery of the clay, which is referred to as intercalation. The maximum decrease in the 2θ value obtained for PET1%NC corresponds to higher increase in interlayer spacing of nanoclays. TEM micrographs of PET films containing 1 and 3 wt% Cloisite20A nanoparticles show a partially exfoliated/intercalated structure with dispersed tactoids for PET3%NC samples (Figure 2). The individual delaminated silicate layers, observed at 1 wt% loading levels of nanoclays, reflect fully exfoliated structure for PET1%NC samples. TScanning electron microscopic (SEM) micrographs of PET/TiO2 nanocomposites (Figure 3) show uniform distribution and appropriate dispersion of TiO2 nanoparticles through matrix at lower TiO2 concentration (1 and 3 wt%), While increasing the TiO2 level up to 5 wt% leads to nanoparticles agglomerations. Therefore, the interaction of polymer chains with higher accessible solid surfaces and embedment of a portion of macromolecule chain length in nanofiller agglomerates could significantly hinder the segmental motion of polymer chains during the growth step of crystallization, which resulted in reduction of the crystallization rate. The incorporation of TiO2 nanoparticles into PET matrix and increasing its loading level caused no shift in the peak position of crystalline plane of PET, verifying that the type of crystals do not alter in the presence of TiO2 fillers (Figure 4).
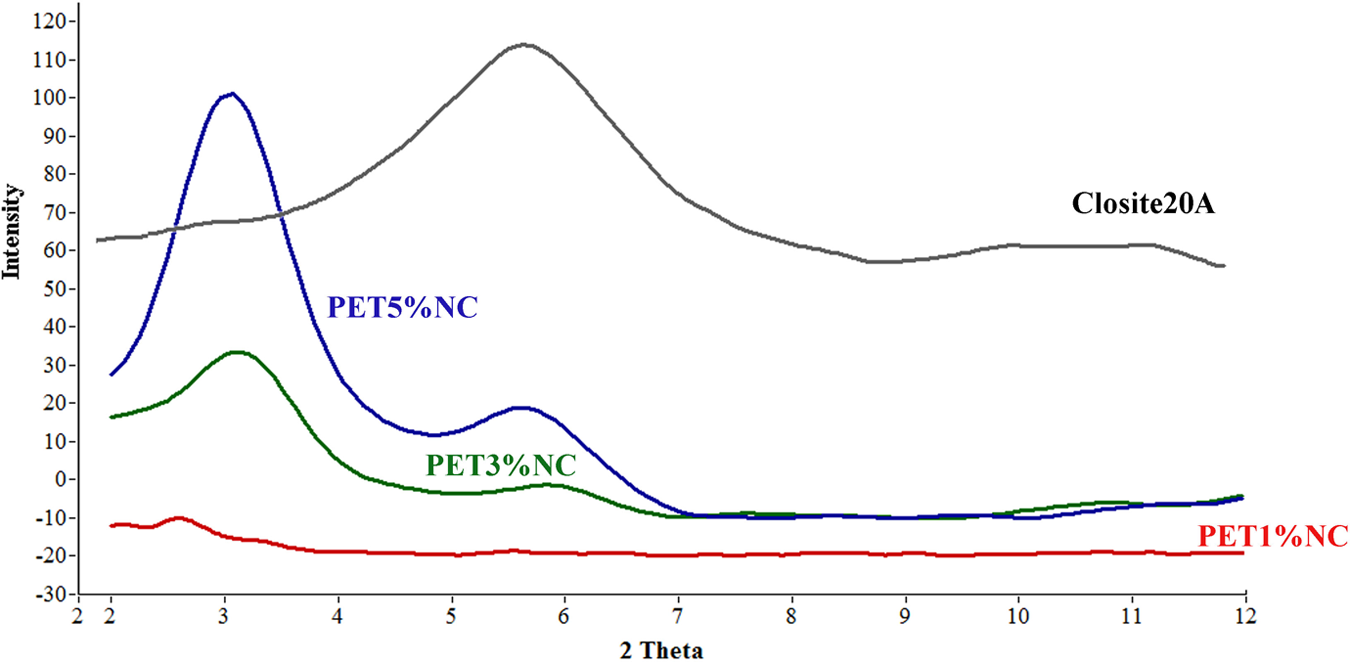
Wide-angle XRD (WAXD) analysis of Closite20A powder and PET/clay nanocomposites. PET: polyethylene terephthalate.
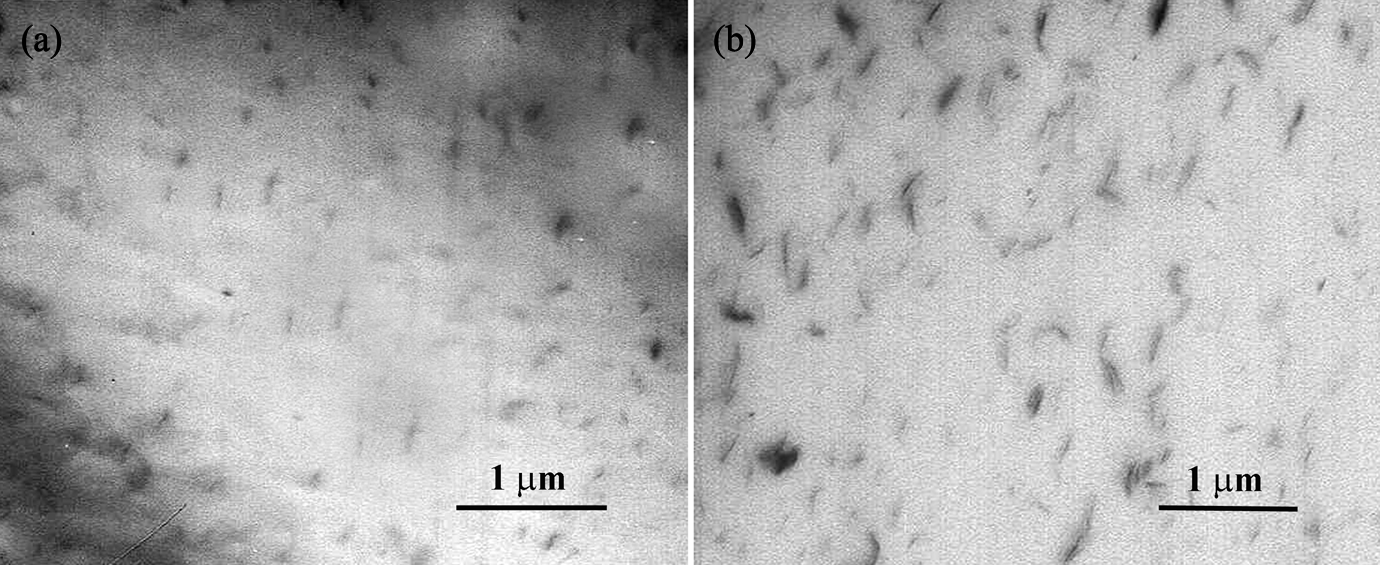
TEM micrographs of PET nanocomposites containing 1 wt% (a) and 3 wt% (b) nanoclays. TEM: transmission electron microscope; PET: polyethylene terephthalate.
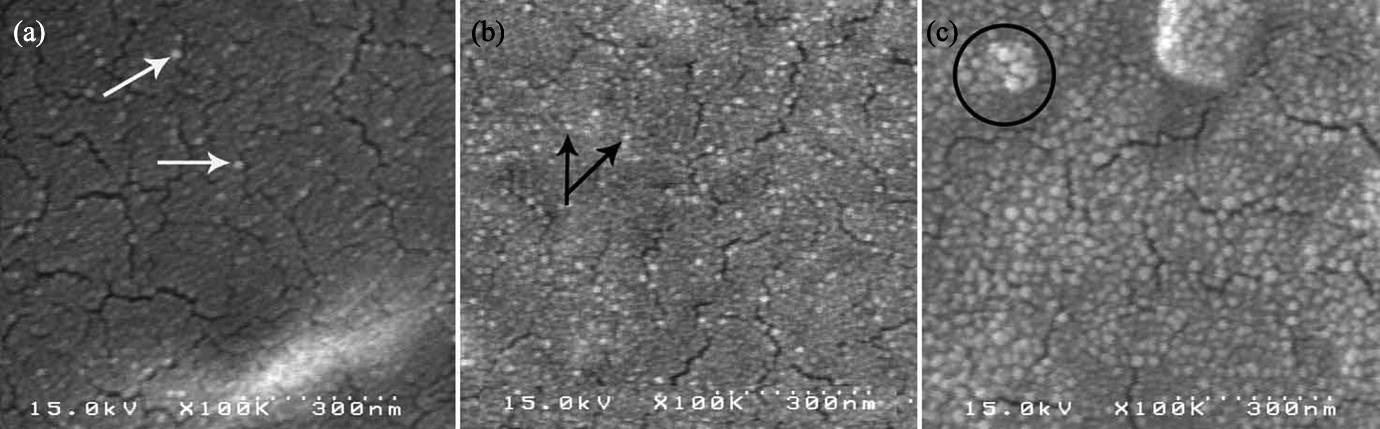
SEM micrographs of fracture surfaces of PET/TiO2 nanocomposites: PET1%NT (a), PET3%NT (b) and PET5%NT (c). SEM: scanning electron microscope; PET: polyethylene terephthalate; TiO2: titanium dioxide.
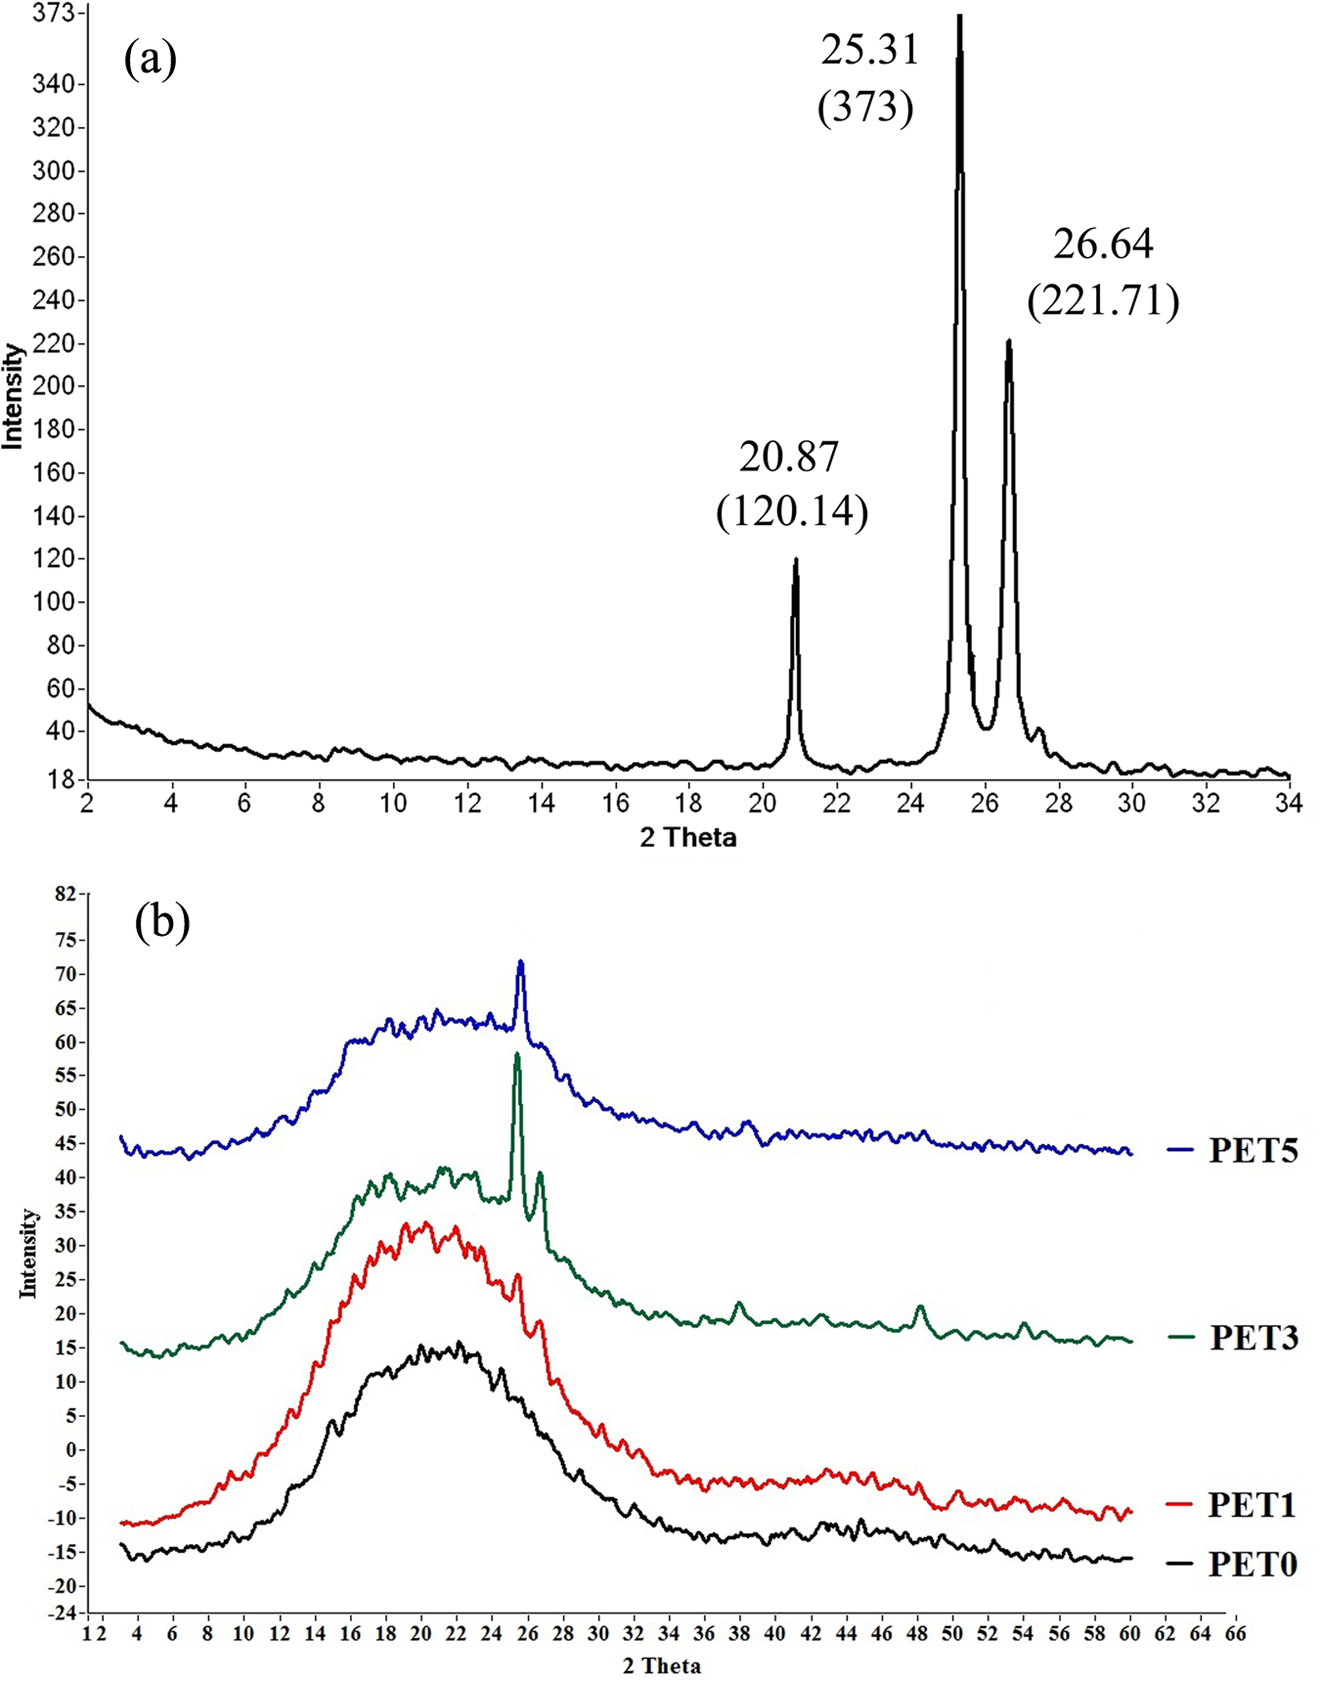
Wide-angle XRD (WAXD) spectra of anatase TiO2 (a) and neat PET and its nanocomposites (b). PET: polyethylene terephthalate; TiO2: titanium dioxide.
Thermal analysis
The values of glass transition temperature (Tg ), melting temperature (Tm ), crystallization temperature (Tc ), enthalpy of crystallization (ΔHc ), enthalpy of melting (ΔHm ), and degree of crystallinity (Xc ) are listed in Table 1.
The characteristic values of DSC analysis of different samples.
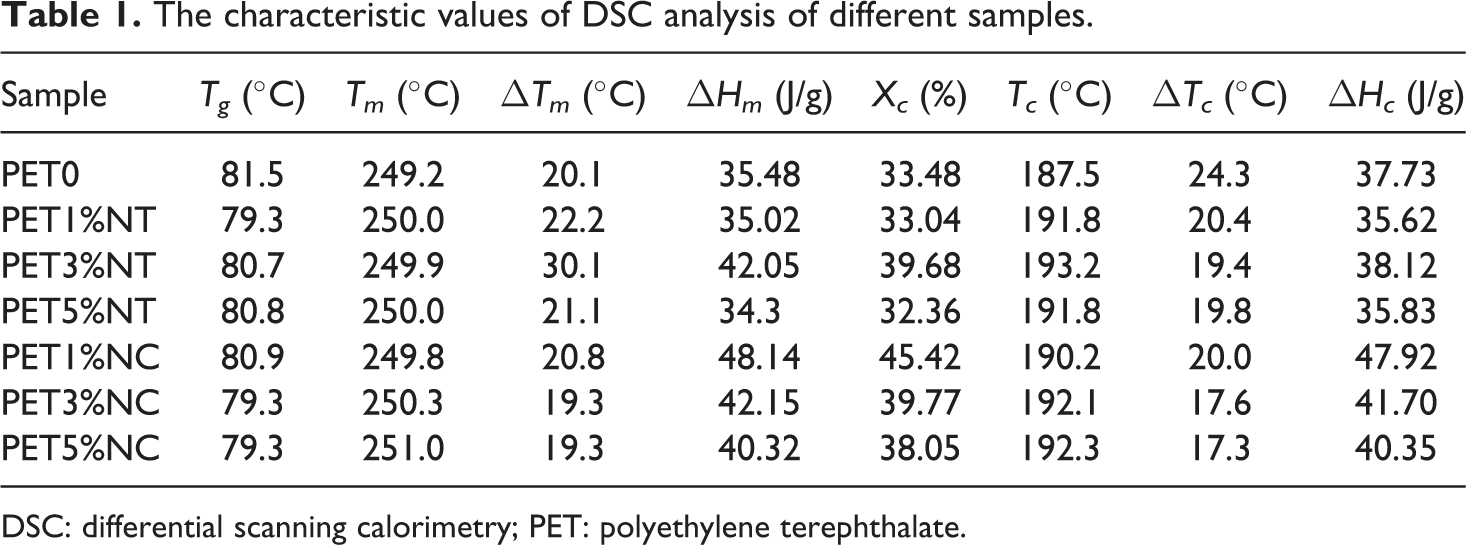
DSC: differential scanning calorimetry; PET: polyethylene terephthalate.
Values of 2θ and d spacing for PET nanocomposites.
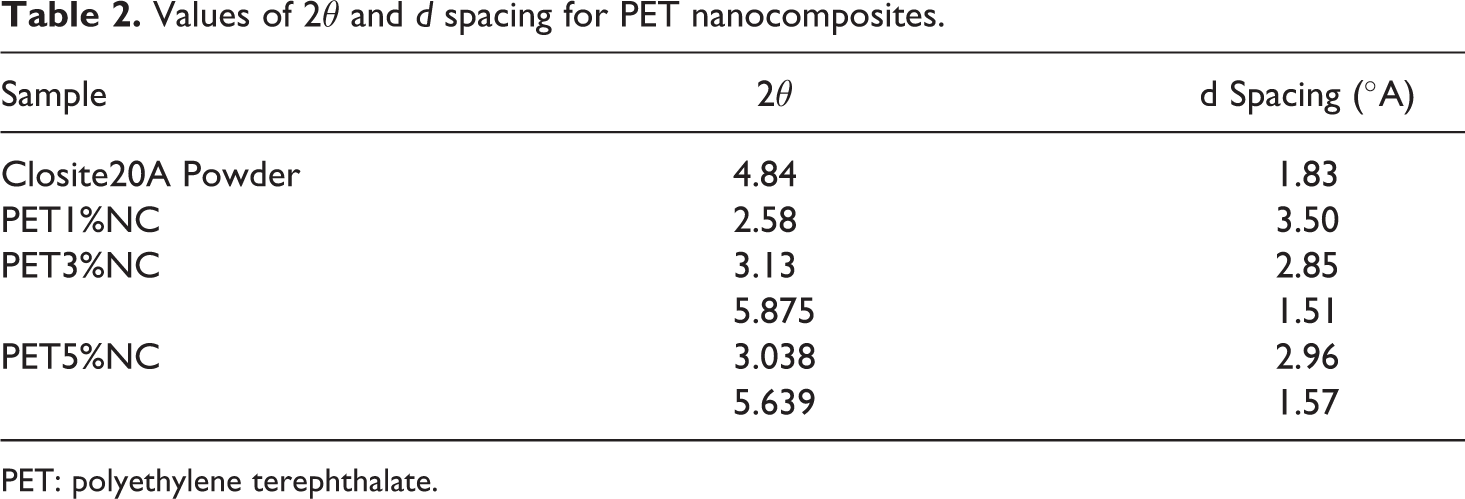
PET: polyethylene terephthalate.
As shown in Table 1, the reduction in Tg of nanocomposites with increasing nanofiller content is not very significant. Negligible reduction in Tg value could be as a result of slight degradation of the polymer matrix upon mixing with nanoparticles. This unnoticeable effect was also observed by other researchers. 19 –21 The cooling and heating curves of the neat PET sample and PET nanocomposites are shown in Figures 5 and 6, respectively. The crystallization temperatures (Tc ) of both TiO2 and clay nanocomposites shift to higher temperatures compared to the neat PET. The characteristic values collected in Table 1 show that the crystallization peak width (ΔTc ) of the nanocomposites is narrower than the one of the neat PET. At 3 wt% loading of TiO2 nanofillers and 5 wt% loading of nanoclays, the narrowest crystallization peak was observed which is by 5°C and 7°C narrower than the ΔTc of PET0 sample, respectively. Pattanawanidchai et al. reported that PET/BaSO4 composites exhibited higher crystallization temperature (T c = 203°C) than neat PET (Tc = 191°C) and the crystallization peak width was narrower by 6–10°C. 22 He et al. also showed the same trend for PET/SiO2 composites. 23 Bandyopadhyay et al. showed that addition of 1.3% and 2% Closite20A into PET caused higher crystallization temperature compared to the neat polymer. 12 Guan et al. showed that addition of 1, 2 and 3% montmorillonite (MMT) into PET matrix increases the crystallization temperature of nanocomposites. 24 Generally, the results obtained in this study showed that the effect of nanoclays on crystallization is more sensible than TiO2 nanoparticles. Addition of 1% of TiO2 had no effect on Xc , while the addition of 1 wt% nanoclay caused about 35% increase in the degree of crystallization. The highest Xc was observed at 3 wt% of loading level of TiO2 nanoparticles, while PET/clay nanocomposites showed the highest Xc value at 1 wt% of clay fillers in polymer matrix. However, when the content of TiO2 nanoparticles and nanoclays increases to 5 and 3 wt%, respectively, Xc tends to decrease, suggesting that high nanofiller content significantly restricted the mobility of polymer chain segments. It is noteworthy that another factor affecting the reduction of Xc of PET/clay nanocomposites at high loading level of nanofillers is the final intercalation/exfoliation morphology. The results showed that the exfoliated clay morphology is dominant for low nanofiller content (1 wt%), while the intercalated one is prevailing for high filler loading (3 wt% and 5 wt%). Lower restriction of polymeric segments near the silicate surface at exfoliated structure caused lower limitations of polymer chain segments during the crystallization process and resulted in higher Xc of PET1%NC sample. The presence of "confining" inorganic layers in intercalated structure caused the polymer chains to exhibit more restrictions in segmental motion. According to Todorov et al., the intercalation morphology may reduce the ability of polymer to crystallize. 4 So, PET3%NC and PET5%NC samples with higher level of intercalation showed lower degree of crystallinity rather than PET1%NC sample.
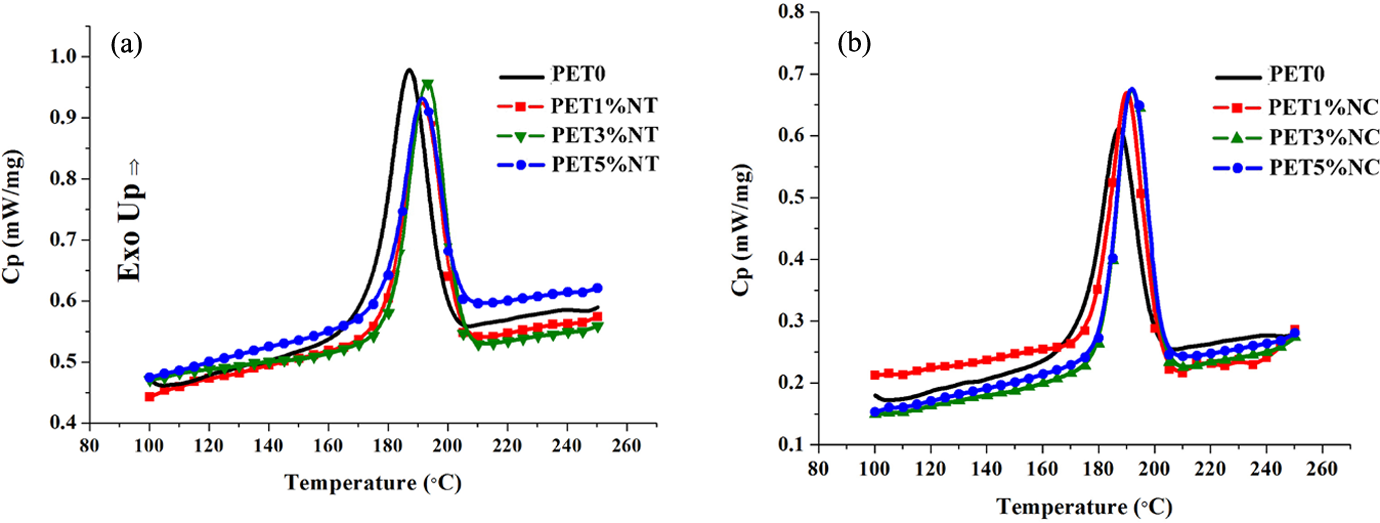
The cooling process of DSC curves, PET/TiO2 nanocomposites (a), PET/clay nanocomposites (b). PET: polyethylene terephthalate; TiO2: titanium dioxide.
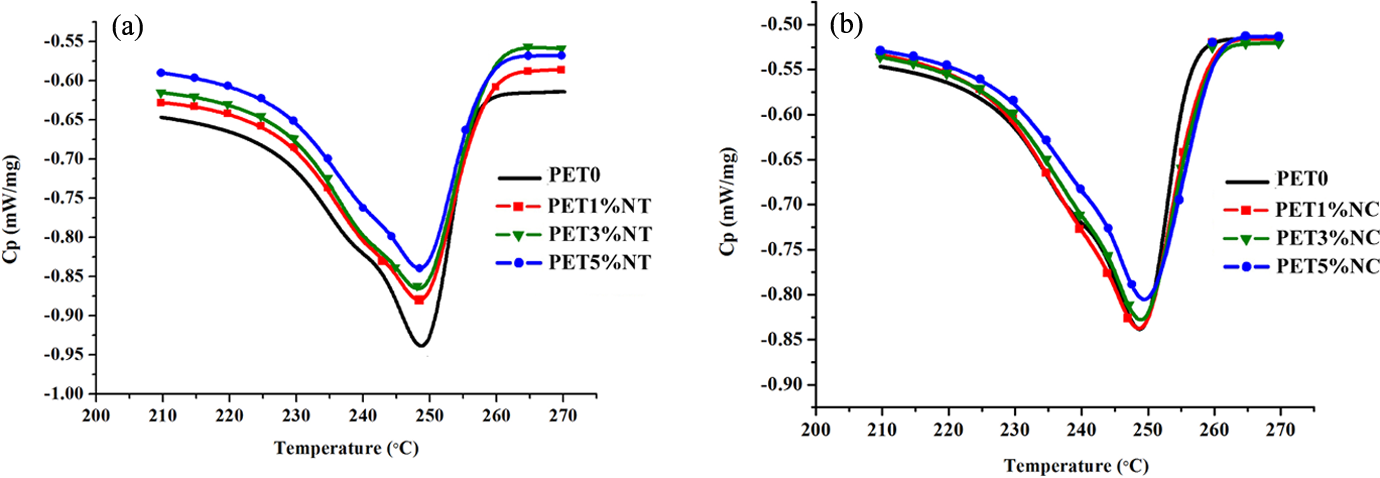
The heating process of DSC curves, PET/TiO2 nanocomposites (a), PET/clay nanocomposites (b). PET: polyethylene terephthalate; TiO2: titanium dioxide.
Increase in Xc and crystallization rate of nanocomposites could be due to the heterogeneous nucleation effect of nanoparticles surface on the crystallization of PET macromolecules, which reduces the need for meeting the barrier activation energy of thermal homogeneous nucleation. Therefore, crystallization process of nanocomposites can begin at higher temperatures than pure polymer. Compared to the spherical TiO2 nanoparticles, broader nucleation effect of platelet-like nanoclays with superior aspect ratio resulted in higher crystallization of PET matrix.
Tensile testing
The mechanical properties of the neat polymer and the prepared nanocomposites were listed in Table 3. It was expected that the elastic modulus of nanocomposites increases with the addition of mineral rigid nanoparticle, while the results show that there is no significant difference in the magnitude of modulus. Although the modulus of nanocomposite showed a rising trend with increase in the loading level of the nanoparticles, large standard deviation of the modulus causes the results to overlap each other. The tensile strength of both PET/clay and PET/TiO2 nanocomposites decreased compared to the neat PET. It could be as a result of the prevention effect of nanoparticles on strain hardening of the polymer chains after cold drawing. Strain hardening phenomenon plays a critical role in stabilizing the polymers against strain localization and fracture and reducing wear. 25 So, nanofiller as heterogeneous solid nanoparticles could hinder the polymer stress-induced crystallization and subsequently, decrease the resistance of polymer network against fracture.
Mechanical properties of neat PET and PET nanocomposites.
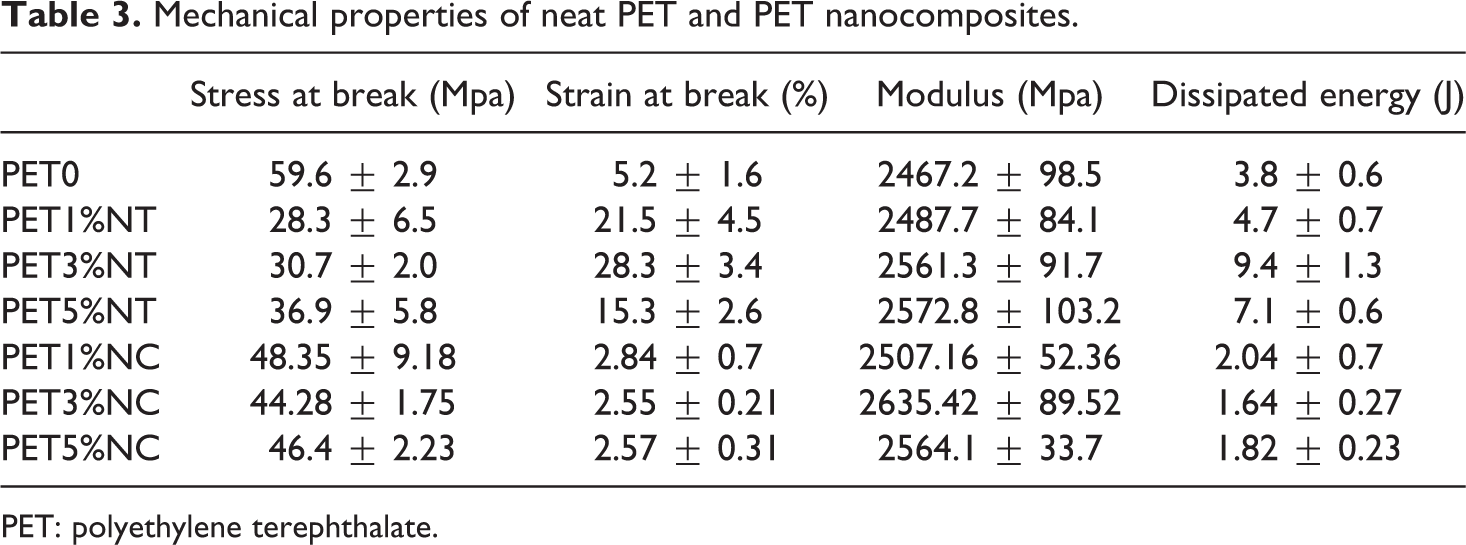
PET: polyethylene terephthalate.
Another attractive observed effect of the addition of nanoparticles on mechanical properties is the increment in strain at break and dissipated energy or ductility (lost energy determined from the area under the stress–strain curve up to break). On the other word, the nanocomposite’s ductility enhanced with the addition of TiO2 and reduced with the addition of nanoclays. Reinforcing effect of TiO2 nanoparticles on polymer ductility could be a consequence of the creation of new energy damping mechanisms in the presence of nanoparticles such as agglomerates breaking up, void nucleation, crack deflection, nanofiller debonding or pull out, matrix deformation and bridging. During the first two mechanisms, particle agglomerates are broken and are debonded from the matrix, creating small voids. The breaking or debonding stress determines the crazing stress that is lower than that in unfilled matrix. Therefore, slight agglomeration facilitates crazing and more crazes can be created with a positive effect on energy dissipation and toughness. 26 However, as observed in Table 3, the dissipated energy of PET5%NT decreased when compared to PET3%NT sample. As the nanoparticle size increases and large agglomerates are formed, the total particle/matrix interfacial surface area available for energy dissipation decrease, but the critical stress for particle/matrix debonding also decreases, and this could be the reason for the observation of an optimum for ductility with increasing nanoparticle loading. In similar research, it was found that the incorporation of TiO2 to PET could cause the elongation at break increment. 4
In a different manner, the PET/clay nanocomposite’s ductility decreased with the addition of nanoclays. Sanchez-Solis et al. has shown that strain at break diminishes drastically for PET/clay nanocomposites with 1, 2, and 3 wt% of organomodified and nonmodified MMT. 27 This opposite effect of nanoclays on polymer ductility reflecting the fragile behavior with generally small strain at break, could be as a result of creating larger voids in PET/clay interface compared to the PET/TiO2 nanocomposites. A comparison of the results reveals that clay nanofillers have a detrimental effect on the mechanical properties of the PET.
Conclusions
The results of DSC analysis showed that the crystallization temperature from the melt moved to higher temperatures with increasing nanoparticle loading level. The percentage of crystallinity first increases and then decreases with the incremental addition of nanoparticles. Both the crystallization rate and degree of crystallinity reached their maximum values in nanocomposite containing 3 wt% TiO2 and 1 wt% nanoclay. The results demonstrated that the addition of TiO2 and clay nanofillers could significantly enhance the rate of crystallization of PET as a result of heterogeneous nucleation effect of nanofillers. This phenomenon is more sensible in for platelet-like clay nanoparticles with broader surface area. The XRD patterns showed a shift to lower angles of the characteristic diffraction peak in PET/clay nanocomposites. The maximum decrease in the 2θ value was obtained for PET1%NC. TEM micrographs suggest full exfoliation morphology for PET nanocomposites with 1 wt% nanoclays. The incorporation of TiO2 nanoparticles into PET matrix and increasing its loading level caused no shift in the peak position of crystalline plane. SEM micrographs display uniform distribution of TiO2 nanofillers in PET matrix at 1 and 3 wt% loading levels of nanoparticles. The ductility of PET enhanced with the addition of TiO2 nanoparticles, while it declined with the incorporation of clay fillers in polymer matrix.
Footnotes
Funding
This research received no specific grant from any funding agency in the public, commercial, or not-for-profit sectors.